Relative Strength of 2 securities - Jayy This is an update of the Relative Strength to index as used by Leaf_West.. 4th from the top. my original RS script is 3rd from the top.
In this use of the term " Relative Strength" (RS) what is meant is a ratio of one security to another.
The RS can be inerpreted in a fashion similar to price action on a regual security chart.
If you follow his methods be aware of the different moving averages for the different time periods.
From Leaf_West: "on my weekly and monthly R/S charts, I include a 13 EMA of the R/S (brown dash line) and
an 8 SMA of the 13 EMA (pink solid line). The indicator on the bottom of the weekly/monthly charts is an
8 period momentum indicator of the R/S line. The red horizontal line is drawn at the zero line.
For daily or 130-minute time periods (or shorter), my R/S charts are slightly different
- the moving averages of the R/S line include a 20EMA (brown dash line), a 50 EMA (blue dash line) and
an 8 SMA of the20 EMA (pink solid line). The momentum indicator is also slightly different from the weekly/monthly
charts – here I use a 12 period calculation (vs 8 SMA period for the weekly/monthly charts)."
Leaf's website has gone but I if you are interested in his methods message me.
What is different from my previous RS: The RS now displays RS candles. So if you prefer to watch price action of candles to
a line chart which only plots the ratio of closes then this will be more interesting to you.
I have also thrown in a few options to have fun with.
Jayy
חפש סקריפטים עבור "horizontal line"

Momentum of Relative strength to Index Leaf_West styleMomentum of Relative Strength to index as used by Leaf_West. This is to be used with the companion Relative Strength to Index indicator Leaf_West Style. Make sure you use the same index for comparison. If you follow his methods be aware of the different moving averages for the different time periods. From Leaf_West: "on my weekly and monthly R/S charts, I include a 13 EMA of the R/S (brown dash line) and an 8 SMA of the 13 EMA (pink solid line). The indicator on the bottom of the weekly/monthly charts is an 8 period momentum indicator of the R/S line. The red horizontal line is drawn at the zero line.
For daily or 130-minute time periods (or shorter), my R/S charts are slightly different - the moving averages of the R/S line include a 20EMA (brown dash line), a 50 EMA (blue dash line) and an 8 SMA of the20 EMA (pink solid line). The momentum indicator is also slightly different from the weekly/monthly charts – here I use a 12 period calculation (vs 8 SMA period for the weekly/monthly charts)." Leaf's methods do evolve and so watch for any changes to the preferred MAs etc..

Relative strength to Index set up as per Leaf_WestRelative Strength to index as used by Leaf_West. If you follow his methods be aware of the different moving averages for the different time periods. From Leaf_West: "on my weekly and monthly R/S charts, I include a 13 EMA of the R/S (brown dash line) and an 8 SMA of the 13 EMA (pink solid line). The indicator on the bottom of the weekly/monthly charts is an 8 period momentum indicator of the R/S line. The red horizontal line is drawn at the zero line.
For daily or 130-minute time periods (or shorter), my R/S charts are slightly different - the moving averages of the R/S line include a 20EMA (brown dash line), a 50 EMA (blue dash line) and an 8 SMA of the20 EMA (pink solid line). The momentum indicator is also slightly different from the weekly/monthly charts – here I use a 12 period calculation (vs 8 SMA period for the weekly/monthly charts)." Leaf's methods do evolve and so watch for any changes to the preferred MAs etc..

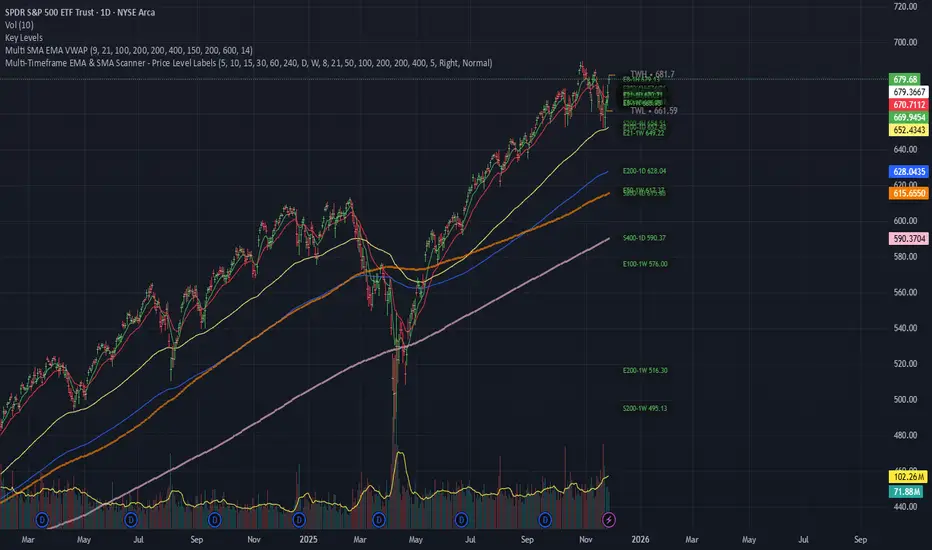
Multi-Timeframe EMA & SMA Scanner - Price Level LabelsOverview
A powerful multi-timeframe moving average scanner that displays EMA and SMA levels from up to 8 different timeframes simultaneously on your chart. Perfect for identifying key support/resistance levels, confluence zones, and multi-timeframe trend analysis.
Key Features
📊 Multi-Timeframe Analysis
Monitor up to 8 different timeframes simultaneously (5m, 10m, 15m, 30m, 1H, 4H, 1D, 1W)
Each timeframe can be independently enabled/disabled
Fully customizable timeframe selection
📈 Comprehensive Moving Averages
5 configurable EMA periods (default: 8, 21, 50, 100, 200)
2 configurable SMA periods (default: 200, 400)
All periods are fully customizable to match your trading strategy
🎯 Smart Price Level Labels
Labels positioned at actual price levels (not in a list)
Color-coded labels for easy identification
Dynamic text color: Green when price is above, Red when below
Compact notation: E8-5m means EMA 8 on 5-minute timeframe
Adjustable label offset from current price
📉 Optional Horizontal Lines
Dotted reference lines at each MA level
Color-matched to corresponding MA type
Can be toggled on/off independently
📋 Comprehensive Data Table
Shows all MA values organized by timeframe
Displays percentage distance from current price
Trend indicator (Strong Up/Up/Neutral/Down/Strong Down)
EMA alignment status (Bullish/Bearish/Mixed)
Color-coded cells for quick visual analysis
🎨 Full Customization
Individual color settings for each MA type
Adjustable table size (Tiny/Small/Normal/Large)
Choose table position (Left/Right)
Toggle any MA or timeframe on/off
🔔 Built-in Alerts
Golden Cross detection (EMA 50 crosses above EMA 200)
Death Cross detection (EMA 50 crosses below EMA 200)
Price crossing major EMAs
Available for multiple timeframes
How to Use
For Day Traders:
Enable lower timeframes (5m, 10m, 15m, 30m)
Focus on faster EMAs (8, 21, 50)
Watch for confluence zones where multiple timeframe MAs cluster
For Swing Traders:
Enable higher timeframes (1H, 4H, 1D)
Use all EMAs plus SMAs for broader perspective
Look for alignment across timeframes for high-probability setups
For Position Traders:
Focus on daily and weekly timeframes
Emphasize 100, 200 EMAs and 200, 400 SMAs
Use for long-term trend confirmation
Understanding the Labels
Label Format: E8-5m 45250.50
E8 = EMA with period 8
5m = 5-minute timeframe
45250.50 = Current price level
Green text = Price is currently above this level (potential support)
Red text = Price is currently below this level (potential resistance)
For SMAs: S200-1D 44500.00
S200 = SMA with period 200
1D = Daily timeframe
Trading Applications
Support/Resistance Identification
MAs act as dynamic support and resistance levels
Multiple timeframe MAs create stronger zones
Confluence Trading
When multiple MAs from different timeframes cluster together, it creates high-probability zones
These areas often result in strong reactions
Trend Analysis
Check the Alignment column: Bullish alignment = all EMAs in ascending order
Trend column shows overall price position relative to all MAs
Entry/Exit Timing
Use lower timeframe MAs for precise entries
Use higher timeframe MAs for trend direction and exits
Settings Guide
Timeframes Section:
Select and enable/disable up to 8 timeframes
Default: 5m, 10m, 15m, 30m, 1H, 4H, 1D, 1W
MA Periods Section:
Customize all EMA and SMA periods
Default EMAs: 8, 21, 50, 100, 200
Default SMAs: 200, 400
Display Section:
Toggle price labels and horizontal lines
Adjust label offset (distance from right edge)
Show/hide data table
Choose table position and size
Colors Section:
Customize colors for each MA type
Each MA has independent color control
Pro Tips
✅ Start with default settings and adjust based on your trading style
✅ Disable timeframes/MAs you don't use to reduce chart clutter
✅ Use the data table for quick overview, labels for precise levels
✅ Look for "confluence clusters" where multiple MAs from different timeframes align
✅ Green labels = potential support, Red labels = potential resistance
✅ Set alerts on key crossovers for automated notifications
Technical Specifications
Pine Script v6
Overlay indicator (displays on main chart)
Maximum 500 labels supported
Real-time updates on each bar close
Compatible with all instruments and timeframes
Perfect For:
Day traders seeking multi-timeframe confirmation
Swing traders looking for high-probability setups
Position traders monitoring long-term trends
Anyone using moving averages as part of their strategy
Note: This indicator does not provide buy/sell signals. It's a tool for analysis and should be used in conjunction with your trading strategy and risk management rules.
Pivot Move Ranges█ OVERVIEW
“Pivot Move Ranges” is an indicator that displays only the historical price ranges of moves that match the direction of the current swing.
It measures the price range of each individual swing and draws them as horizontal Δ-boxes positioned at the level of the most recently detected pivot.
The indicator operates with a delay equal to the set pivot detection length – after each new Pivot High, only red Δ-boxes appear showing the sizes of previous downward moves; after each new Pivot Low, only green Δ-boxes appear showing the sizes of previous upward moves. When the swing direction changes, the displayed set of levels instantly switches to the opposite direction.
█ CONCEPTS
The indicator was created to instantly provide the trader with objective, real historical price ranges – perfectly reinforcing classic tools such as Fibonacci extension/retracement, daily/weekly pivots, moving averages, order blocks, or Volume Profile.
It detects classic Pivot High and Pivot Low points:
- New Pivot High → only previous downward moves are shown (red Δ-boxes)
- New Pivot Low → only previous upward moves are shown (green Δ-boxes)
This ensures that at any moment you see only the historical ranges that match the current market direction. Price moves very often repeat themselves – the indicator makes these recurring levels immediately visible and ready to serve as natural reinforcement for other technical analysis tools.
█ FEATURES
- Pivot High / Pivot Low detection with adjustable length (default 12)
- Δ-boxes – thin horizontal lines showing the exact size of previous moves that match the current swing
- Automatic switching of the Δ-box set whenever a new opposite pivot appears
- Memory of the last N moves (default 6, max. 50) – oldest are automatically removed
- Labels showing move size (Δ) and start date/time
- Full color customization (separate for up and down), border and text transparency
- Choice of date format (DD.MM.YYYY or MM/DD/YYYY)
- Small circles marking the exact pivot locations
█ HOW TO USE
Add the indicator to your TradingView chart → paste the code → Add to Chart.
Settings:
- Pivot Length – higher values = fewer but more significant pivots (detected with a delay equal to this length)
- Max Corrections to Keep – how many previous matching moves are displayed at once
- Upward / Downward Box Color – colors of the Δ-boxes
- Box Border Transparency (%) – 0 = solid lines, 50–70 = subtle
- Show Δ Text + Move Start Date – turn labels on/off
Interpretation:
At any given moment the chart shows only the historical ranges of moves in the current direction:
- after a Pivot High → red Δ-boxes = “how far the market previously fell”
- after a Pivot Low → green Δ-boxes = “how far the market previously rose”
█ APPLICATIONS
- Instant reinforcement of technical levels – historical moves matching the current swing direction often coincide with Fibonacci levels, daily/weekly pivots, moving averages, or order blocks
- Fast cluster detection – set a high Max Corrections value (30–50) to see where the largest number of similarly sized moves cluster, then reduce to 6–10 and focus only on the most recent levels
█ NOTES
- On very strong trends, Δ-boxes can be extremely long – this is normal and correct behavior
- Always use as a supporting layer alongside other technical analysis tools

كلاستر
Detailed Description – Fibonacci Cluster Zones + OB + FVG (AR34)
This script is an advanced multi-layer confluence system developed under the AR34 Trading Framework, designed to identify high-accuracy reversal zones, liquidity imbalances, institutional footprints, and trend direction using a unified analytic engine.
It combines Fibonacci mathematics, Smart Money Concepts, market structure, and smart trend signals to produce precise, reliable trading zones.
⸻
🔶 1 — Fibonacci Retracement Zones + Custom Smart Levels
The script calculates the highest and lowest prices over a selected lookback period to generate key Fibonacci retracement levels:
• 0.236
• 0.382
• 0.500
• 0.618
• 0.786
• 1.000
You can also add up to three custom Fibonacci levels (0.66, 0.707, 0.88 or any value you want).
✔ Each level is drawn as a horizontal line
✔ Optional label display for every level
✔ Color and activation fully customizable
These levels help identify pullback zones and potential turning points.
⸻
🔶 2 — True Fibonacci Cluster Detection
The script automatically identifies Cluster Zones, which occur when:
1. A Fibonacci level
2. An Order Block
3. A Fair Value Gap
all overlap in the same price range.
When all three conditions align, the script prints a CLUSTER marker in yellow.
These zones represent:
• High-probability reversal areas
• Strong institutional footprints
• Highly reactive price levels
⸻
🔶 3 — Automatic Order Block (OB) Detection
The indicator detects Order Blocks based on structural candle behavior:
• Bearish candle → followed by bullish
• Price interacts with a Fibonacci level
• Area aligns with institutional order flow
When detected, the OB is marked for easy visualization.
⸻
🔶 4 — Fair Value Gap (FVG) Mapping
The script scans for liquidity imbalances using the classic FVG logic:
• low > high
When an FVG exists, it draws a green liquidity box.
This highlights:
• Gaps left by institutional moves
• High-value return zones
• Efficient price retracement levels
⸻
🔶 5 — Fibonacci Extension Projections
The script calculates extension targets using:
• 1.272
• 1.618
• 2.000
These are drawn as dashed teal lines and help forecast:
• Breakout continuation targets
• Wave extension objectives
• Take-profit areas
⸻
🔶 6 — Smart Trend Signal (EMA-200 Engine)
Trend direction is determined using the EMA 200:
• Price above EMA → uptrend
• Price below EMA → downtrend
A green or red signal icon appears only when the trend flips, reducing noise and improving clarity.
This helps detect:
• Trend shifts early
• Cleaner entries and exits
• Trend-based filtering
⸻
🔶 7 — Four-EMA Multi-Trend System
The indicator includes optional visualization of four moving averages:
• EMA 20 → Short-term
• EMA 50 → Medium-term
• EMA 100 → Long-term
• EMA 200 → Major trend
All are fully customizable (length + color + visibility).
⸻
🔶 8 — Dynamic Negative Fibonacci Levels (Green Only)
When enabled, the script calculates deep retracement zones using:
• –0.23
• –0.75
• –1.20
These negative Fibonacci levels are drawn in green and help identify:
• Deep liquidity capture points
• Hidden structural supports
• Potential reversal bottoms
⸻
🔶 9 — Complete User Control
Users maintain full control over:
✔ Enabling/disabling OB detection
✔ Enabling/disabling FVG detection
✔ Activating custom Fibonacci levels
✔ Showing or hiding labels
✔ Selecting timeframe for Fib calculations
✔ Adjusting moving average parameters
✔ Activating dynamic Fibonacci
The script is designed to be flexible, scalable, and suitable for any trading style.
⸻
🎯 Summary
This indicator is a powerful all-in-one analytical system that merges:
✔ Fibonacci Mathematics
✔ Smart Money Concepts (OB + FVG)
✔ Trend-based filtering
✔ Institutional cluster detection
✔ Dynamic extensions + retracements
✔ Multi-EMA trend mapping
شرح السكربت بالتفصيل – Fibonacci Cluster Zones + OB + FVG (AR34)
هذا السكربت هو نظام تحليل احترافي متكامل من تطوير AR34 Framework يجمع بين أقوى أدوات التداول الحديثة في مؤشر واحد، ويهدف إلى كشف مناطق الانعكاس القوية، والتجميع الذكي، والاتجاه العام، باستخدام مزيج علمي من فيبوناتشي + السيولة + الاتجاه.
يعمل هذا المؤشر بأسلوب Confluence Trading بحيث يدمج عدة مدارس مختلفة في طبقة واحدة لتحديد مناطق الانعكاس والارتداد والاختراق بدقة عالية.
⸻
🔶 1 — مناطق فيبوناتشي (Retracement) + الكلاستر الذكي
يقوم المؤشر بحساب أعلى وأدنى سعر خلال عدد محدد من الشموع (Retracement Length) ثم يرسم مستويات فيبوناتشي الكلاسيكية:
• 0.236
• 0.382
• 0.500
• 0.618
• 0.786
• 1.000
مع إمكانية إضافة 3 مستويات خاصة من اختيارك (0.66 – 0.707 – 0.88 وغيرها).
✔️ كل مستوى يتم رسمه بخط مستقل
✔️ يظهر بجانبه رقم المستوى إذا تم تفعيل خيار Show Fib Labels
✔️ يمكن تغيير لونه، قيمته، وتفعيله حسب رغبتك
⸻
🔶 2 — كاشف الكلاستر الحقيقي (Cluster Detection)
الكلاستر يُعتبر أقوى مناطق الارتداد في التحليل الفني.
السكربت يحدد الكلاستر عندما تتداخل 3 عناصر مع مستوى فيبوناتشي:
1. مستوى فيبوناتشي مهم
2. Order Block
3. Fair Value Gap
إذا اجتمعت الثلاثة في نفس المنطقة، يتم رسمها باللون الأصفر وتظهر كلمة CLUSTER.
هذا يعطيك:
• أقوى منطقة انعكاس
• أعلى دقة في تحديد نقاط الدخول
• مناطق ذات سيولة مرتفعة
⸻
🔶 3 — دمج Order Blocks تلقائياً
يكتشف المؤشر الـ OB الحقيقي باستخدام شروط حركة الشموع:
• bearish candle → bullish candle
• السعر لمس مستوى فيبوناتشي
• منطقة محتملة لتجميع المؤسسات
إذا تحققت الشروط يظهر OB باللون الأحمر.
⸻
🔶 4 — دمج Fair Value Gaps (FVG)
يكتشف الفجوات السعرية بين الشمعتين الأولى والثالثة:
• low > high
ويقوم برسم بوكس أخضر حول الفجوة (FVG Zone).
يساعدك على معرفة:
• مناطق اختلال السيولة
• أهداف السعر القادمة
• مناطق “العودة” المحتملة
⸻
🔶 5 — امتدادات فيبوناتشي (Fibonacci Extensions)
يقوم بحساب الامتدادات من مستويات:
• 1.272
• 1.618
• 2.0
ويظهرها بخطوط متقطعة (Teal Color).
هذه المستويات مهمة لتوقع:
• أهداف اختراق
• مناطق TP
• امتداد موجات السعر
⸻
🔶 6 — إشارة الاتجاه الذكية (Smart Trend Engine – EMA200)
يعتمد على EMA 200 لتحديد الاتجاه العام:
• إذا السعر فوق EMA200 → اتجاه صاعد
• إذا السعر تحت EMA200 → اتجاه هابط
ويظهر المؤشر:
🟢 سهم أخضر عند تحول الاتجاه لصعود
🔴 سهم أحمر عند تحول الاتجاه لهبوط
ميزة التحول فقط عند تغيير الاتجاه (No Noise).
⸻
🔶 7 — أربع موفنقات احترافية (EMA 20 – 50 – 100 – 200)
المؤشر يعرض الموفنقات الأربعة الأساسية:
• EMA 20 → اتجاه قصير
• EMA 50 → متوسط
• EMA 100 → طويل
• EMA 200 → الاتجاه الرئيسي
مع إمكانية:
• تغيير اللون
• تغيير الطول
• إخفائها وإظهارها
⸻
🔶 8 — فيبوناتشي الديناميكي (Dynamic Green Fib)
ميزة قوية جداً تظهر فقط عند تفعيلها.
تحسب أعلى وأدنى سعر في Lookback Period ثم ترسم مستويات سلبية:
• –0.23
• –0.75
• –1.20
هذه المستويات تظهر كخطوط خضراء تحت السعر وتستخدم لـ:
• تحديد مناطق الانعكاس المخفية
• رصد الدعم الديناميكي
• اكتشاف القيعان المحتملة
⸻
🔶 9 — المرونة الكاملة للمستخدم
المؤشر يسمح لك التحكم بكل شيء:
✔️ تفعيل/إلغاء الـ OB
✔️ تفعيل/إلغاء الـ FVG
✔️ تفعيل/إلغاء مستويات فيبوناتشي
✔️ إضافة مستويات مخصصة
✔️ اختيار الفريم المستخدم
✔️ تغيير الألوان
✔️ التحكم في الاتجاه والموفنقات
⸻
🎯 الخلاصة
هذا السكربت يعمل كنظام تحليلي متكامل يجمع:
✔️ فيبوناتشي
✔️ السيولة المؤسسية (OB + FVG)
✔️ الاتجاه الذكي
✔️ الكلاستر الاحترافي
✔️ الموفنقات
✔️ فيبوناتشي الديناميكي

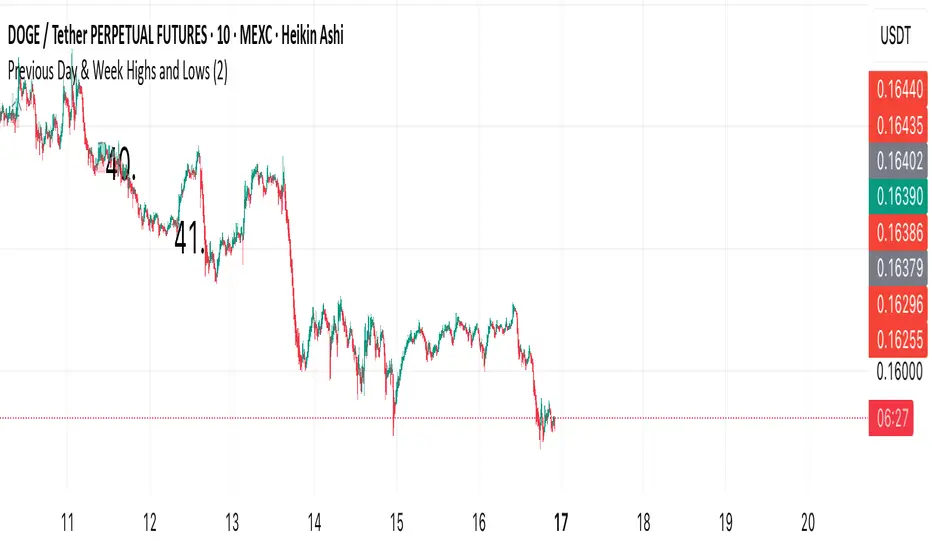
Previous Day & Week Highs and Lows 1.3Overlay indicator that plots horizontal lines for the previous day’s and previous week’s highs and lows. Lines extend until the next period starts, so you can see these levels throughout the current day or week.
The indicator detects new daily and weekly sessions and draws lines at the previous period’s high and low. Daily levels use green (high) and red (low); weekly levels use blue (high) and magenta (low). You can toggle daily/weekly independently, customize colors, and adjust line width. It works on intraday timeframes and helps identify support/resistance and track breakouts relative to prior periods.

Previous Day & Week Highs and LowsOverlay indicator that plots horizontal lines for the previous day’s and previous week’s highs and lows. Lines extend until the next period starts, so you can see these levels throughout the current day or week.
The indicator detects new daily and weekly sessions and draws lines at the previous period’s high and low. Daily levels use green (high) and red (low); weekly levels use blue (high) and magenta (low). You can toggle daily/weekly independently, customize colors, and adjust line width. It works on intraday timeframes and helps identify support/resistance and track breakouts relative to prior periods.
Auto Fibonacci RetraceNOTE: This script is for educational purposes only.
This Pine Script v6 indicator automates the drawing of Fibonacci retracement levels on a TradingView chart based on detected pivot highs and lows. It's designed to identify the most recent swing points in a price trend and plot horizontal lines at standard Fibonacci ratios (0%, 23.6%, 38.2%, 50%, 61.8%, 78.6%, 100%), along with optional labels for each level. The script is useful for traders who want dynamic, hands-free Fib retracements that update as new pivots form, helping to spot potential support/resistance zones without manual intervention.
Key Features
Automatic Pivot Detection: Uses TradingView's built-in ta.pivothigh and ta.pivotlow functions to find recent swing highs and lows. The sensitivity is adjustable via user inputs for "Left Bars" and "Right Bars" (default: 5 each), which define how many bars are checked on either side to confirm a pivot.
Trend Direction Awareness: Determines if the current swing is an uptrend (recent high after low) or downtrend (recent low after high) and orients the Fib levels accordingly—starting from the low in uptrends or high in downtrends.
Dynamic Drawing:
Plots dashed horizontal lines extending to the right of the chart for each Fib level.
Colors are predefined for visual distinction (e.g., blue for 23.6%, orange for 61.8%).
Lines and labels are cleared and redrawn only when a new pivot is detected or on initial load to prevent chart clutter.
Customizable Labels: Optional labels show the percentage (e.g., "61.8%") and can be positioned on the "Left" (at the swing start) or "Right" (pinned to the current bar, updating dynamically). Labels use semi-transparent backgrounds for readability.
Performance Optimizations: Uses arrays to manage lines and labels efficiently, with reverse-indexed loops for safe deletion. The max_bars_back=500 ensures it handles historical data without excessive computation.
User Inputs:
Left/Right Bars: Tune pivot detection (higher values for major trends, lower for shorter swings).
Show Fib Levels/Labels: Toggle visibility.
Label Position: "Left" or "Right" for placement flexibility.
Usage Instructions
Adding to Chart: Copy-paste into TradingView's Pine Editor, save as a new indicator, and add it to your chart via the "Indicators" menu.
Customization: Adjust inputs in the indicator settings panel. For example, set Left/Right Bars to 10 for daily charts in strong trends.
Best Practices:
Use on trending markets (e.g., stocks, forex, crypto like BTC/USD); avoid choppy sideways action.
Combine with other indicators (e.g., RSI for overbought/oversold confirmation) for better trade signals.
Test on historical data—zoom out to see how it redraws on past swings.
Limitations: Relies on pivot functions, so it may lag slightly (pivots confirm after "Right Bars"). Not a trading strategy—use for analysis only. No alerts built-in, but you can add alertcondition if extending it.
Potential Enhancements: Add extensions (e.g., 161.8%), user-defined levels, or alerts on price touches via simple modifications.
This script provides a clean, efficient way to visualize Fib retracements automatically, saving time compared to manual drawing. If you need further tweaks or integration into a full strategy, let me know!

ICT Sessions Ranges [SwissAlgo]ICT Session Ranges - ICT Liquidity Zones & Market Structure
OVERVIEW
This indicator identifies and visualizes key intraday trading sessions and liquidity zones based on Inner Circle Trader (ICT) methodology (AM, NY Lunch Raid, PM Session, London Raid). It tracks 'higher high' and 'lower low' price levels during specific time periods that may represent areas where market participants have placed orders (liquidity).
PURPOSE
The indicator helps traders observe:
Session-based price ranges during different market hours
Opening range gaps between market close and next day's open
Potential areas where liquidity may be concentrated and trigger price action
SESSIONS TRACKED
1. London Session (02:00-05:00 ET): Tracks price range during early London trading hours
2. AM Session (09:30-12:00 ET): Tracks price range during the morning New York session
3. NY Lunch Session (12:00-13:30 ET): Tracks price range during typical low-volume lunch period
4. PM Session (13:30-16:00 ET): Tracks price range during the afternoon New York session
CALCULATIONS
Session High/Low: The highest high and lowest low recorded during each active session period
Opening Range Gap: Calculated as the difference between the previous day's 16:00 close and the current day's 09:30 open
Gap Mitigation: A gap is considered mitigated when the price reaches 50% of the gap range
All times are based on America/New_York timezone (ET)
BACKGROUND INDICATORS
NY Trading Hours (09:30-16:00 ET): Optional gray background overlay
Asian Session (20:00-23:59 ET): Optional purple background overlay
VISUAL ELEMENTS
Horizontal lines mark session highs and lows
Subtle background boxes highlight each session range
Labels identify each session type
Orange shaded boxes indicate unmitigated opening range gaps
Dotted line at 50% gap level shows mitigation threshold
FEATURES
Toggle visibility for each session independently
Customizable colors for each session type
Automatic removal of mitigated gaps
All drawing objects use transparent backgrounds for chart clarity
ICT CONCEPTS
This tool relates to concepts discussed by Inner Circle Trader regarding liquidity pools, session-based analysis, and gap theory. The indicator assumes that session highs and lows may represent areas where liquidity is concentrated, and that opening range gaps may attract price until mitigated.
USAGE NOTES
Best used on intraday timeframes (1-15 minute charts)
All sessions are calculated based on actual price movement during specified time periods
Historical session data is preserved as new sessions develop
Gap detection only triggers at 09:30 ET market open
DISCLAIMER
This indicator is for educational and informational purposes only. It displays historical price levels and time-based calculations. Past performance of price levels is not indicative of future results. The identification of "liquidity zones" is a theoretical concept and does not guarantee that orders exist at these levels or that prices will react to them. Trading involves substantial risk of loss. Users should conduct their own analysis and risk assessment before making any trading decisions.
TIME ZONE
Set your timezone to: America/New_York (UTC-5)

Trend Meter [MMT]The Trend Meter is a dynamic Pine Script indicator designed to provide traders with a clear, multi-dimensional view of market trends and momentum across different timeframes and metrics. By integrating Exponential Moving Averages (EMAs), Volume-Weighted Average Price (VWAP), higher timeframe (HTF) analysis, and Regular Trading Hours (RTH) breakouts, this indicator offers a comprehensive tool for identifying bullish, bearish, or neutral market conditions. Its customizable visual display and label system make it ideal for traders seeking actionable insights for trend-following, breakout, or reversal strategies.
Key Features:
1. Multi-Metric Trend Analysis:
- Trend Meter : Compares a Fast EMA (default: 9) and Slow EMA (default: 21) to determine short-term trend direction.
- Bias Meter : Uses a longer-term Bias EMA (default: 35) to assess the overall market bias based on the close price.
- VWAP Meter : Evaluates price position relative to the VWAP for dynamic support/resistance insights.
- HTF Meter : Analyzes higher timeframe (default: 60-minute) price action, detecting breakouts of previous highs/lows and candle direction.
- RTH Meter : Tracks price breakouts above/below the US Regular Trading Hours (09:30–16:00 EST) 15m opening range (09:30–09:45 EST).
2. Color-Coded Visuals:
- Each metric is displayed as a horizontal line with customizable colors (green for bullish, red for bearish, gray for neutral).
- Visual style options (dotted, dashed, or solid lines) allow for personalized chart clarity.
3. Dynamic Labels:
- Optional labels for each metric (Trend, Bias, VWAP, HTF, RTH) with customizable text, size (tiny to huge), and color.
- Labels update in real-time, providing clear identification of each meter’s role and current state.
4. Flexible Metric Selection:
- Toggle individual metrics (EMA, VWAP, HTF, RTH) on/off to focus on relevant indicators for your trading style.
- Option to use the previous bar’s close price for calculations, reducing noise in volatile markets.
5. RTH and Opening Range Analysis:
- Calculates the high/low of the opening range (09:30–09:45 EST) during RTH sessions.
- Signals bullish or bearish conditions when the price breaks above/below the opening range outside the initial 15-minute window.
6. Higher Timeframe Breakout Detection:
- Monitors HTF price action to identify breakouts of the previous candle’s high or low, combined with the HTF candle’s direction for trend confirmation.
How to Use:
- Trend Confirmation : Use the Trend and Bias Meters to confirm short-term and long-term market direction.
- Breakout Trading : Leverage the RTH Meter for breakout setups above/below the opening range during US trading hours.
- Support/Resistance : Utilize the VWAP Meter to identify dynamic price levels for entries or exits.
- Higher Timeframe Context : Monitor the HTF Meter for broader market trend alignment, ideal for swing or position trading.
- Customization : Adjust EMA lengths, toggle metrics, and customize visual styles and labels to suit your chart preferences.
Settings:
- Bias Settings :
- Fast EMA (default: 9), Slow EMA (default: 21), Bias EMA (default: 35).
- Higher Timeframe (default: 60-minute).
- Option to use previous close price for calculations.
- Enable/disable individual metrics (EMA, VWAP, HTF, RTH).
- Visual Settings :
- Bullish (green), bearish (red), and neutral (gray) colors.
- Line style (dotted, dashed, solid).
- Label Settings :
- Enable/disable labels.
- Customize label size (tiny, small, normal, large, huge) and text color.
- Custom text for each meter’s label (Trend, Bias, VWAP, HTF, RTH).
Notes:
- Optimized for intraday trading (e.g., 1m, 5m, 15m) but adaptable to any timeframe.
- RTH and opening range calculations are tailored for US markets (EST timezone); adjust session times in the code for other markets.
- Higher timeframe analysis enhances context for multi-timeframe strategies.
Ideal For:
- Intraday traders targeting RTH breakout opportunities.
- Swing traders aligning with higher timeframe trends.
- Traders using VWAP and EMA-based strategies for trend and momentum analysis.
- Those seeking a clean, customizable dashboard for multi-metric market analysis.

ADX Color Change by BehemothI find this tool to be the most valuable and accurate entry point indicator along with moving averages and the VWAP.
ADX Color Indicator - Controls & Intraday Trading Benefits
Indicator Controls:
1. ADX Length (default: 14)
- Controls the calculation period for ADX
- Lower values (7-10) = more sensitive, faster signals (better for scalping)
- Higher values (14-20) = smoother, fewer false signals (better for swing trades)
- *Intraday tip:* Try 10-14 for most intraday timeframes
2. Show Threshold Levels (default: On)
- Displays the 20 and 25 horizontal lines
- Helps you quickly identify when ADX crosses key strength levels
3. Use Custom Timeframe (default: Off)
- Allows viewing higher timeframe ADX on lower timeframe charts
- *Example:* Trade on 5-min chart but see 15-min or 1-hour ADX
4. Custom Timeframe
- Select any timeframe: 1m, 5m, 15m, 30m, 1H, 4H, D, etc.
- *Intraday tip:* Use 15m or 1H ADX on 5m charts for better trend context
5. Show +DI and -DI (default: Off)
- Shows directional movement indicators
- Green line (+DI) > Red line (-DI) = bullish trend
- Red line (-DI) > Green line (+DI) = bearish trend
6. Show Background Zon es (default: Off)
- Visual background colors for quick trend strength identification
- Green = strong trend (ADX > 25)
- Yellow = moderate trend (ADX 20-25)
Intraday Trading Benefits:
1. Avoid Choppy Markets
- When ADX < 20 (no background color), market is ranging
- Reduces false breakout trades and whipsaws
- Save time and capital by stepping aside during low-quality setups
2. Identify High-Probability Trend Trades
- **Green line + Green zone** = strong trend building, look for pullback entries
- Yellow line crossing above 20 = early trend formation signal
- Catch trends early when ADX starts rising from below 20
3. Multi-Timeframe Analysis
- Use custom timeframe to align with higher timeframe trends
- *Example:* If 1H ADX shows green (strong trend), take breakout trades on 5m chart in same direction
- Increases win rate by trading with the bigger picture
4. Exit Signals
- When ADX turns red (falling), trend is weakening
- Consider tightening stops or taking profits
- Avoid entering new positions when ADX is declining
5. Quick Visual Confirmation
- Color coding eliminates need to analyze numbers
- Instant recognition: Green = go, Yellow = caution, Red = trend dying
- Faster decision-making during fast market moves
6. Scalping Strategy
- Set ADX length to 7-10 for sensitive signals
- Only scalp when ADX is rising (blue, yellow, or green)
- Exit when ADX turns red
7. Breakout Confirmation
- Wait for ADX to rise above 20 after a breakout
- Filters false breakouts in ranging markets
- Yellow or green color confirms momentum behind the move
Optimal Intraday Settings:
- Day Trading (5-15 min charts):** ADX Length = 10-14
- Scalping (1-5 min charts):** ADX Length = 7-10, watch custom 15m timeframe
- Swing Intraday (30min-1H charts):** ADX Length = 14-20
Simple Trading Rules:
✅ Trade: ADX rising + above 20 (yellow or green)
⚠️ Caution: ADX flat or just crossed 20
❌ Avoid:*ADX falling (red) or below 20
The key advantage is staying out of low-quality, choppy price action which is where most intraday traders lose money!

Candle Breakout StrategyShort description (one-liner)
Candle Breakout Strategy — identifies a user-specified candle (UTC time), draws its high/low range, then enters on breakouts with configurable stop-loss, take-profit (via Risk:Reward) and optional alerts.
Full description (ready-to-paste)
Candle Breakout Strategy
Version 1.0 — Strategy script (Pine v5)
Overview
The Candle Breakout Strategy automatically captures a single "range candle" at a user-specified UTC time, draws its high/low as a visible box and dashed level lines, and waits for a breakout. When price closes above the range high it enters a Long; when price closes below the range low it enters a Short. Stop-loss is placed at the opposite range boundary and take-profit is calculated with a user-configurable Risk:Reward multiplier. Alerts for entries can be enabled.
This strategy is intended for breakout style trading where a clearly defined intraday range is established at a fixed time. It is simple, transparent and easy to adapt to multiple symbols and timeframes.
How it works (step-by-step)
On every bar the script checks the current UTC time.
When the first bar that matches the configured Target Hour:Target Minute (UTC) appears, the script records that candle’s high and low. This defines the breakout range.
A box and dashed lines are drawn on the chart to display the range and extended to the right while the range is active.
The script then waits for price to close outside the box:
Close > Range High → Long entry
Close < Range Low → Short entry
When an entry triggers:
Stop-loss = opposite range boundary (range low for longs, range high for shorts).
Take-profit = entry ± (risk × Risk:Reward). Risk is computed as the distance between entry price and stop-loss.
After entry the range becomes inactive (waitingForBreakout = false) until the next configured target time.
Inputs / Parameters
Target Hour (UTC) — the hour (0–23) in UTC when the range candle is detected.
Target Minute — minute (0–59) of the target candle.
Risk:Reward Ratio — multiplier for computing take profit from risk (0.5–10). Example: 2 means TP = entry + 2×risk.
Enable Alerts — turn on/off entry alerts (string message sent once per bar when an entry occurs).
Show Last Box Only (internal behavior) — when enabled the previous box is deleted at the next range creation so only the most recent range is visible (default behavior in the script).
Visuals & On-chart Info
A semi-transparent blue box shows the recorded range and extends to the right while active.
Dashed horizontal lines mark the range high and low.
On-chart shapes: green triangle below bar for Long signals, red triangle above bar for Short signals.
An information table (top-right) displays:
Target Time (UTC)
Active Range (Yes / No)
Range High
Range Low
Risk:Reward
Alerts
If Enable Alerts is on, the script sends an alert with the following formats when an entry occurs:
Long alert:
🟢 LONG SIGNAL
Entry Price:
Stop Loss:
Take Profit:
Short alert:
🔴 SHORT SIGNAL
Entry Price:
Stop Loss:
Take Profit:
Use TradingView's alert dialog to create alerts based on the script — select the script’s alert condition or use the alert() messages.
Recommended usage & tips
Timeframe: This strategy works on any timeframe but the definition of "candle at target time" depends on the chart timeframe. For intraday breakout styles, use 1m — 60m charts depending on the session you want to capture.
Target Time: Choose a time that is meaningful for the instrument (e.g., market open, economic release, session overlap). All times are handled in UTC.
Position Sizing: The script’s example uses strategy.percent_of_equity with 100% default — change default_qty_value or strategy settings to suit your risk management.
Filtering: Consider combining this breakout with trend filters (EMA, ADX, etc.) to reduce false breakouts.
Backtesting: Always backtest over a sufficiently large and recent sample. Pay attention to slippage and commission settings in TradingView’s strategy tester.
Known behavior & limitations
The script registers the breakout on close outside the recorded range. If you prefer intrabar breakout rules (e.g., high/low breach without close), you must adjust the condition accordingly.
The recorded range is taken from a single candle at the exact configured UTC time. If there are missing bars or the chart timeframe doesn't align, the intended candle may differ — choose the target time and chart timeframe consistently.
Only a single active position is allowed at a time (the script checks strategy.position_size == 0 before entries).
Example setups
EURUSD (Forex): Target Time 07:00 UTC — captures London open range.
Nifty / Index: Target Time 09:15 UTC — captures local session open range.
Crypto: Target Time 00:00 UTC — captures daily reset candle for breakout.
Risk disclaimer
This script is educational and provided as-is. Past performance is not indicative of future results. Use proper risk management, test on historical data, and consider slippage and commissions. Do not trade real capital without sufficient testing.
Change log
v1.0 — Initial release: range capture, box and level drawing, long/short entry by close breakout, SL at opposite boundary, TP via Risk:Reward, alerts, info table.
If you want, I can also:
Provide a short README version (2–3 lines) for the TradingView “Short description” field.
Add a couple of suggested alert templates for the TradingView alert dialog (if you want alerts that include variable placeholders).
Convert the disclaimer into multiple language versions.

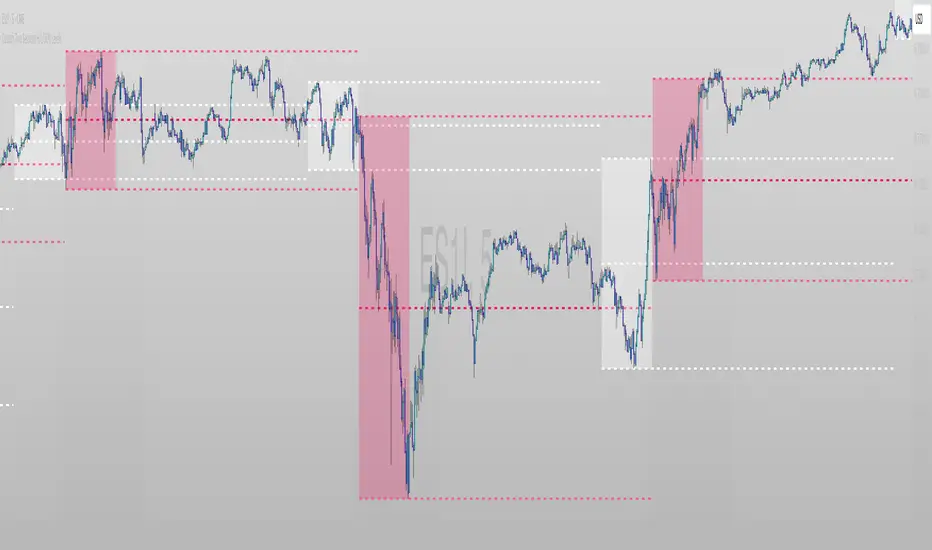
Custom Two Sessions H/L/50% LevelsTrack high/low/midpoint levels across two customizable time sessions. Perfect for monitoring H4 blocks, session ranges, or any custom time periods as reference levels for lower timeframe trading.
What This Indicator Does:
Tracks and projects High, Low, and 50% Midpoint levels for two fully customizable time sessions. Unlike fixed-session indicators, you define EXACTLY when each session starts and ends.
Key Features:
• Two independent sessions with custom start/end times (hour and minute)
• High/Low/50% midpoint tracking for each session
• Visual session boxes showing calculation periods
• Horizontal lines projecting levels into the future
• Historical session levels remain visible for reference
• Works on any chart timeframe (M1, M5, M15, H1, H4, etc.)
• Full visual customization (colors, line styles, widths)
• DST timezone support
Common Use Cases:
H4 Candle Tracking - Set sessions to 4-hour blocks (e.g., 6-10am, 10am-2pm) to track individual H4 highs/lows
H1 Candle Tracking - 1-hour blocks for scalping reference levels
Session Trading - ETH vs RTH, London vs NY, Asian session, etc.
Custom Time Periods - Any time range you want to monitor
How to Use:
The indicator identifies key price levels from higher timeframe periods. Use previous session H/L/50% as reference levels for:
Identifying sweep and reclaim setups
Lower timeframe structural flip confirmations
Support/resistance zones for entries
Delivery targets after breaks of structure
Settings:
Configure each session's start/end times independently. The indicator automatically triggers at the first bar crossing into your specified time, making it compatible with all chart timeframes.
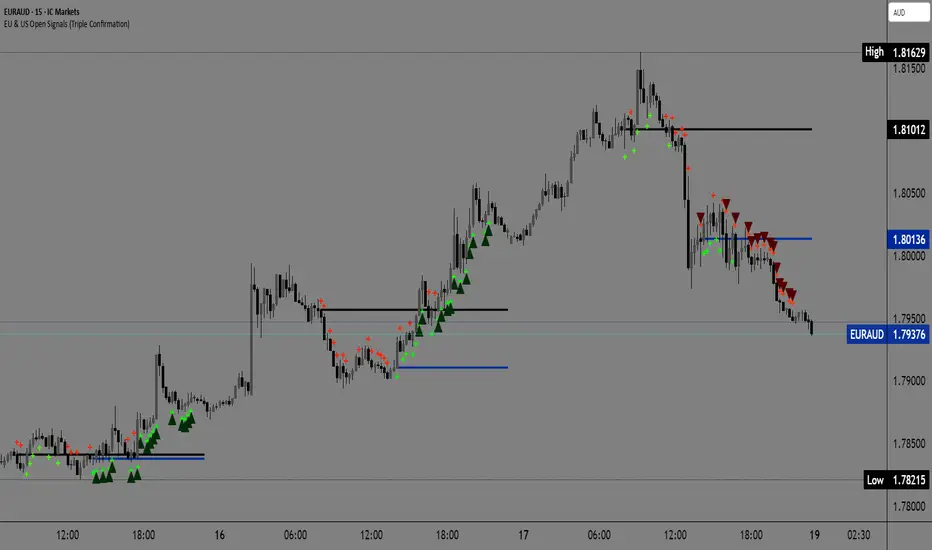
EU & US Open Signals (Triple Confirmation)🚀 EU & US Open Signals: Triple Confirmation Breakouts
💡 What This Indicator Does
This indicator plots the opening prices of the European (EU) and American (US) trading sessions as key daily support/resistance levels. Its main function is to generate three distinct levels of signals based on the breakout of these levels, strictly filtered by candlestick type.
The goal is to easily spot market momentum following the opening of the major trading sessions.
🔑 Key Features
1. Daily Session Levels
The indicator plots two crucial horizontal lines that reset daily:
EU Open (Black Line): The European session opening price (Default: 06:00 UTC).
US Open (Dark Blue Line): The American session opening price (Default: 12:00 UTC).
2. Triple Signaling Logic
All signals are only generated if the breakout candle is bullish (for Buy) or bearish (for Sell), and only within your set trading hours.
Logic I. EU Single Break
Condition: Close breaks above/below the EU Open Level + Bullish/Bearish candle.
Visual Plot: Small Cross (Green for Buy / Red for Sell).
Meaning: Early signal focused on EU session momentum.
Logic II. US Single Break
Condition: Close breaks above/below the US Open Level + Bullish/Bearish candle.
Visual Plot: Small Cross (Green for Buy / Red for Sell).
Meaning: Signal focused on US session momentum.
Logic III. Double Break (HIGH CONFIRMATION)
Condition: Close breaks above Both Levels (EU and US) for Buy, or below Both Levels for Sell + Bullish/Bearish candle.
Visual Plot: Large Triangle (Dark Green/Red).
⚠️ Crucial: This is the strongest signal, indicating strong momentum as both key daily levels have been broken.
⚙️ Simple Settings
Easily customize the indicator to fit your strategy:
EU/US Session Open Hour (UTC): Set the exact session open times.
Time Zone: Select your time zone for accurate level calculation.
Start/End Trading Hour: Define the daily window for when signals will be active.
🎯 Recommended Use
High Confidence: Focus on the Double Break (Logic III) - Large Triangle for your most confirmed entries.
Context: Use the Single Break signals (I and II) to confirm early market bias.
Risk: The Open Levels can serve as natural points for setting Stop-Loss orders.
Disclaimer: Trading carries risk. This tool is for analysis purposes only. Use it at your own discretion.
Previous Day & Week High/Low LevelsPrevious Day & Week High/Low Levels is a precision tool designed to help traders easily identify the most relevant price levels that often act as strong support or resistance areas in the market. It automatically plots the previous day’s and week’s highs and lows, as well as the current day’s developing internal high and low. These levels are crucial reference points for intraday, swing, and even position traders who rely on price action and liquidity behavior.
Key Features
Previous Day High/Low:
The indicator automatically draws horizontal lines marking the highest and lowest prices from the previous trading day.
These levels are widely recognized as potential zones where the market may react again — either rejecting or breaking through them.
Previous Week High/Low:
The script also tracks and displays the high and low from the last completed trading week.
Weekly levels tend to represent stronger liquidity pools and broader institutional zones, which makes them especially important when aligning higher timeframe context with lower timeframe entries.
Internal Daily High/Low (Real-Time Tracking):
While the day progresses, the indicator dynamically updates the current day’s internal high and low.
This allows traders to visualize developing market structure, identify intraday ranges, and anticipate potential breakouts or liquidity sweeps.
Multi-Timeframe Consistency:
All levels — daily and weekly — remain visible across any chart timeframe, from 1 minute to 1 day or higher.
This ensures traders can maintain perspective and avoid losing track of key zones when switching views.
Customizable Visuals:
The colors, line thickness, and label visibility can be easily adjusted to match personal charting preferences.
This makes the indicator adaptable to any trading style or layout, whether minimalistic or detailed.
How to Use
Identify Key Reaction Zones:
Observe how price interacts with the previous day and week levels. Rejections, consolidations, or clean breakouts around these lines often signal strong liquidity areas or potential directional moves.
Combine with Market Structure or Liquidity Concepts:
The indicator works perfectly with supply and demand analysis, liquidity sweeps, order block strategies, or simply classic support/resistance techniques.
Scalping and Intraday Trading:
On lower timeframes (1m–15m), the daily levels help identify intraday turning points.
On higher timeframes (1h–4h or daily), the weekly levels provide broader context and directional bias.
Risk Management and Planning:
Using these levels as reference points allows for more precise stop placement, target setting, and overall trade management.
Why This Indicator Helps
Markets often react strongly around previous highs and lows because these zones contain trapped liquidity, pending orders, or institutional decision points.
By having these areas automatically mapped out, traders gain a clear and objective view of where price is likely to respond — without needing to manually draw lines every day or week.
Whether you’re a beginner still learning about price structure, or an advanced trader refining entries within liquidity zones, this tool simplifies the process and keeps your charts clean, consistent, and data-driven.

ORBs, EMAs, AVWAPThis Pine Script (version 6) is a multi-session trading indicator that combines Opening Range Breakouts (ORBs), Exponential Moving Averages (EMAs), and an Anchored VWAP (AVWAP) system — all in one overlay script for TradingView.
Here’s a clear breakdown of its structure and functionality:
🕒 1. Session Logic and ORB Calculation
Purpose: Identify and plot the high and low of the first 30 minutes (default) for the Tokyo, London, and New York trading sessions.
Session Anchors (NY time):
Tokyo → 20:00
London → 03:00
New York → 09:30
(All configurable in inputs.)
ORB Duration: Default is 30 minutes (orbDurationMin), also user-configurable.
Resets:
London and NY ORBs reset at the start of each new New York trading day (17:00 NY time).
Tokyo ORB resets independently using a stored timestamp.
Process:
For each session:
While the time is within the ORB window, the script captures the session’s high and low.
Once the window closes, those levels remain plotted until reset.
Plot Colors:
Tokyo → Yellow (#fecc02)
London → Gray (#8c9a9c)
New York → Magenta (#ff00c8)
These form visible horizontal lines marking the prior session ranges — useful for breakout or retest trading setups.
📈 2. EMA System
Purpose: Provide trend and dynamic support/resistance guidance.
It calculates and plots four EMAs:
EMA Period Color Purpose
EMA 9 Short-term Green Fast signal
EMA 20 Short-term Red Confirms direction
EMA 113 Medium Aqua Trend filter
EMA 200 Long-term Orange Macro trend baseline
Each EMA is plotted directly on the price chart for visual confluence with ORB and VWAP levels.
⚖️ 3. Anchored VWAP (AVWAP)
Purpose: Display a volume-weighted average price anchored to specific timeframes or events, optionally with dynamic deviation or percentage bands.
Features:
Anchor Options:
Time-based: Session, Week, Month, Quarter, Year, Decade, Century
Event-based: Earnings, Dividends, Splits
VWAP resets when the chosen anchor condition is met (e.g., new month, new earnings event, etc.).
Bands:
Up to three levels of symmetric upper/lower bands.
Choose between Standard Deviation or Percentage-based widths.
Display Toggles:
Each band’s visibility is optional.
VWAP can be hidden on 1D+ timeframes (hideonDWM option).
Color Scheme:
VWAP: Fuchsia (magenta-pink) line
Bands: Green / Olive / Teal with light-filled zones
⚙️ 4. Technical Highlights
Uses ta.vwap() with built-in band calculations.
Handles instruments with or without volume (errors if missing volume).
Uses time-zone aware timestamps (timestamp(NY_TZ, …)).
Uses timeframe.change() to detect new anchors for the VWAP.
Employs persistent variables (var) to maintain session state across bars.
💡 In Practice
This indicator is designed for multi-session intraday traders who:
Trade Tokyo, London, or NY open breakouts or retests.
Use EMA stacking and crossovers for trend confirmation.
Use Anchored VWAP as a fair-value or mean-reversion reference.
Need clear visual structure across different market sessions.
It provides strong session separation, trend context, and volume-weighted price reference — making it ideal for discretionary or semi-systematic trading strategies focused on liquidity zones and session momentum.

VWAP + Multi-Condition RSI Signals + FibonacciPlatform / System
Platform: TradingView
Language: Pine Script® v6
Purpose: This script is an overlay indicator for technical analysis on charts. It combines multiple tools: VWAP, RSI signals, and Fibonacci levels.
1️⃣ VWAP (Volume Weighted Average Price)
What it does:
Plots the VWAP line on the chart, which is a weighted average price based on volume.
Can be anchored to different periods: Session, Week, Month, Quarter, Year, Decade, Century, or corporate events like Earnings, Dividends, Splits.
Optionally plots bands above and below VWAP based on standard deviation or a percentage.
Supports up to 3 bands with customizable multipliers.
Will not display if the timeframe is daily or higher and the hideonDWM option is enabled.
Visual on chart: A main VWAP line with optional shaded bands.
2️⃣ RSI (Relative Strength Index) Signals
What it does:
Calculates RSI with a configurable period.
Identifies overbought and oversold zones using user-defined levels.
Generates buy/sell signals based on:
RSI crossing above oversold → Buy
RSI crossing below overbought → Sell
Detects strong signals using divergences:
Bullish divergence: Price makes lower low, RSI makes higher low → Strong Buy
Bearish divergence: Price makes higher high, RSI makes lower high → Strong Sell
Optional momentum signals when RSI crosses 50 after recent overbought/oversold conditions.
Visual on chart:
Triangles for buy/sell
Different color triangles/circles for strong and momentum signals
Background shading in RSI overbought/oversold zones
Alerts: The script can trigger alerts when any of these signals occur.
3️⃣ Fibonacci Levels
What it does:
Calculates Fibonacci retracement and extension levels based on the highest high and lowest low over a configurable lookback period.
Plots standard Fibonacci levels: 0.146, 0.236, 0.382, 0.5, 0.618, 0.786, 1.0
Plots extension levels: 1.272, 1.618, 2.0, 2.618
Helps identify potential support/resistance zones.
Visual on chart: Horizontal lines at each Fibonacci level, shaded with different transparencies.
Summary
This script is essentially a multi-tool trading indicator that combines:
VWAP with dynamic bands for trend analysis and price positioning
RSI signals with divergences for entry/exit points
Fibonacci retracement and extension levels for support/resistance
It is interactive and visual, providing both chart overlays and alert functionality for active trading strategies.
This code is provided for training and educational purposes only. It is not financial advice and should not be used for live trading without proper testing and professional guidance.

Session VWAP & ATR H/L ZonesThis script is a comprehensive tool for day traders, designed to visualize key price levels and zones based on volume and volatility within a specific trading session.
Traders would use your script to identify potential areas of support and resistance, gauge the session's trend, and spot opportunities for mean reversion or breakout trades.
Core Concepts Explained
Your script plots three main types of information on the chart, each serving a different purpose for a trader.
1. Session VWAP (Volume-Weighted Average Price) 📈
What it is: The yellow line is the VWAP, which is the average price of an asset for the current trading session, weighted by the volume traded at each price level. It essentially shows the "fair" price for the day according to the market's activity.
How it's used:
Trend Gauge: If the price is consistently trading above the VWAP, it's generally considered a bullish intraday trend. If it's below, the trend is bearish.
Dynamic Support/Resistance: During a trend, traders often look for the price to pull back to the VWAP to find an entry point (e.g., buying a dip to the VWAP in an uptrend).
VWAP Bands: The optional gray, red, and green bands are standard deviations from the VWAP. They measure how far the price has strayed from its "fair value."
2. ATR High/Low Zones (Support & Resistance) 🎯
What they are: These are the shaded green and red areas at the top and bottom of the session's price range.
The red zone (resistance) is calculated by taking the session's current high and subtracting a value based on the Average True Range (ATR), which is a measure of recent volatility.
The green zone (support) is calculated by taking the session's current low and adding the ATR-based value.
How they're used: These are not just lines; they are zones of interest.
Profit-Taking Areas: A trader who is long might consider taking profits when the price enters the red resistance zone.
Reversal Signals: When the price enters one of these zones and shows signs of stalling (e.g., with specific candlestick patterns), it could signal a potential reversal.
3. Previous Session High & Low 📊
What they are: The script plots the high and low from the previous trading session as straight horizontal lines (teal and fuchsia by default).
How they're used: These are extremely significant static levels that many traders watch.
Price Magnets: Price is often drawn to these levels.
Key Inflection Points: A decisive break above the previous day's high can signal strong bullish momentum. Conversely, a failure to break it can indicate weakness. These levels frequently act as strong support or resistance.

Mean Reverting Suite [OmegaTools]Overview
The Mean Reverting Suits (MR Suite) by OmegaTools is an advanced analytical and visualization framework designed to identify directional exhaustion, statistical overextensions, and conditions consistent with mean-reversion dynamics. It integrates three pillars into a single display: a composite momentum-normalized oscillator, a percentile-based extension model with volume contextualization, and a dynamic structural mapping engine built on confirmed pivots. The indicator does not generate signals or prescribe trade actions; it provides objective context so users can evaluate market balance and the likelihood that price is departing from its recent statistical baseline.
Core logic
The composite oscillator blends MFI on two horizons and RSI on HL2, then averages them to produce a stabilized mean-reversion gauge. Candle and bar colors are mapped by a dual gradient centered at 50. Readings above 50 progressively shift from neutral gray toward the bearish accent color to reflect increasing momentum saturation; readings below 50 shift from the bullish accent color toward gray to reflect potential accumulation or temporary undervaluation. This continuous mapping avoids rigid thresholds and conveys the strength and decay of momentum as a smooth spectrum.
The percentile-based extension model measures the persistence of directional bias by tracking how many bars have elapsed since the last opposing condition. These rolling counts are compared to the 80th percentile of their own historical distributions stored in arrays. When a current streak exceeds its respective percentile, the environment is labeled as statistically extended in that direction. Background shading communicates this information and is modulated by relative volume, computed as live volume divided by a blended average of SMA(30) and EMA(11). Higher opacity implies greater liquidity participation during the extension.
The structural mapping module uses confirmed pivot highs and lows at the chosen length to create persistent horizontal levels that extend forward and automatically maintain themselves until price invalidates or refreshes them. These levels represent market memory zones and assist in reading where reactions previously formed. The engine updates in real time, ensuring the framework continuously reflects the prevailing structure.
Standard deviation and z-score overlay
The updated version introduces a mean and dispersion layer. A simple moving average of HL2 over twice the length provides the reference mean. Dispersion is estimated as the moving average of the absolute deviation between close and the mean over five times the length. The z-score is computed as the distance of price from the mean divided by this dispersion proxy. Visual arrows highlight observations where the absolute z-score exceeds two standard deviations, offering a concise view of statistically unusual departures from the local mean. This layer complements the percentile extension model by adding an orthogonal measure of extremity based on distributional distance rather than run length.
Visualization
Candle bodies and borders inherit the oscillator’s gradient color, creating an immediate sense of directional pressure and potential momentum fatigue. The chart background activates when the extension model detects a statistically rare streak, using blue tones for bearish extension and red tones for bullish extension, with intensity scaling by relative volume. Horizontal lines denote active pivot-based levels, automatically extending, truncating, and refreshing as structure evolves. The z-score arrows appear only when deviations exceed the ±2 threshold, keeping the display focused on noteworthy statistical events.
Inputs and configuration
Length controls the sensitivity of all modules. Lower values make the oscillator and pivot detection more reactive; higher values smooth readings and widen structural context. Bullish and Bearish colors are user-selectable to match platform themes or accessibility requirements.
Interpretation guidance
A strong red background indicates an unusually extended bullish run in the presence of meaningful volume; a strong blue background indicates an unusually extended bearish run in the presence of meaningful volume. Candle gradients near deep bearish tones suggest oscillator readings well above 50; gradients near deep bullish tones suggest oscillator readings well below 50. Pivot lines mark the most recently confirmed structural levels that the market has reacted to. Z-score arrows denote points where price has moved beyond approximately two standard deviations of its local mean, signaling statistically uncommon distance rather than directional persistence. None of these elements are directives; they are objective descriptors designed to improve situational awareness.
Advantages
The framework is adaptive by design and self-normalizes to each instrument’s volatility and rhythm through percentile logic and dispersion-based distance. It is volume-aware, visually encoding liquidity pressure so that users can distinguish thin extensions from structurally significant ones. It reduces chart clutter by unifying momentum state, statistical extension, standard deviation distance, and structural levels into a single coherent view. It is asset- and timeframe-agnostic, suitable for intraday through swing horizons across futures, equities, FX, and digital assets.
Usage notes
MR Suite is intended for analytical and educational purposes. It does not provide trading signals, risk parameters, or strategy instructions. Users may employ its context alongside their own methodologies, risk frameworks, and execution rules. The indicator’s value derives from quantifying how unusual a move is, showing how much liquidity supports it, and anchoring that information to evolving structural references, thereby improving the clarity and consistency of discretionary assessment without prescribing actions.

ORDER BLCOK custom strategy# OB Matrix Strategy - Documentation
**Version:** 1.0
**Author:** HPotter
**Date:** 31/07/2017
The **OB Matrix Strategy** is based on the identification of **bullish and bearish Order Blocks** and the management of conditional orders with multiple Take Profit (TP) and Stop Loss (SL) levels. It uses trend filters, ATR, and percentage-based risk management.
---
## 1. Main Parameters
### Strategy
- `initial_capital`: 50
- `default_qty_type`: percentage of capital
- `default_qty_value`: 10
### Money Management
- `rr_threshold`: minimum Risk/Reward threshold to open a trade
- `risk_percent`: percentage of capital to risk per trade (default 2%)
- `maxPendingBars`: maximum number of bars for a pending order
- `maxBarsOpen`: maximum number of bars for an open position
- `qty_tp1`, `qty_tp2`, `qty_tp3`: quantity percentages for multiple TPs
---
## 2. Order Block Identification
### Order Block Parameters
- `obLookback`: number of bars to identify an Order Block
- `obmode`: method to calculate the block (`Full` or `Breadth`)
- `obmiti`: method to determine block mitigation (`Close`, `Wick`, `Avg`)
- `obMaxBlocks`: maximum number of Order Blocks displayed
### Main Variables
- `bullBlocks`: array of bullish blocks
- `bearBlocks`: array of bearish blocks
- `last_bull_volume`, `last_bear_volume`: volume of the last block
- `dom_block`: dominant block type (Bullish/Bearish/None)
- `block_strength`: block strength (normalized volume)
- `price_distance`: distance between current price and nearest block
---
## 3. Visual Parameters
- `Width`: line thickness for swing high/low
- `amountOfBoxes`: block grid segments
- `showBorder`: show block borders
- `borderWidth`: width of block borders
- `showVolume`: display volume inside blocks
- `volumePosition`: vertical position of volume text
Customizable colors:
- `obHighVolumeColor`, `obLowVolumeColor`, `obBearHighVolumeColor`, `obBearLowVolumeColor`
- `obBullBorderColor`, `obBearBorderColor`
- `obBullFillColor`, `obBearFillColor`
- `volumeTextColor`
---
## 4. Screener Table
- `showScreener`: display the screener table
- `tablePosition`: table position (`Top Left`, `Top Right`, `Bottom Left`, `Bottom Right`)
- `tableSize`: table size (`Small`, `Normal`, `Large`)
The table shows:
- Symbol, Timeframe
- Type and status of Order Block
- Number of retests
- Bullish and bearish volumes
---
## 5. Trend Filters
- EMA as a trend filter (`emaPeriod`, default 223)
- `bullishTrend` if close > EMA
- `bearishTrend` if close < EMA
---
## 6. ATR and Swing Points
- ATR calculated with a customizable period (`atrLength`)
- Swing High/Low for SL/TP calculation
- `f_getSwingTargets` function to calculate SL and TP based on direction
---
## 7. Trade Logic
### Buy Limit on Bullish OB
- Conditions:
- New bullish block
- Uptrend
- RR > threshold (`rr_threshold`)
- SL: `bullishOBPrice * (1 - atr * atrMultiplier)`
- Multiple TPs: TP1 (50%), TP2 (80%), TP3 (100% max)
- Quantity calculation based on percentage risk
### Sell Limit on Bearish OB
- Conditions:
- New bearish block
- Downtrend
- RR > threshold (`rr_threshold`)
- SL: `bearishOBPrice * (1 + atr * atrMultiplier)`
- Multiple TPs: TP1 (50%), TP2 (80%), TP3 (100% max)
- Quantity calculation based on percentage risk
---
## 8. Order Management and Timeout
- Close pending orders after `maxPendingBars` bars
- Close open positions after `maxBarsOpen` bars
- Label management for open orders
---
## 9. Alert Conditions
- `bull_touch`: price inside maximum bullish volume zone
- `bear_touch`: price inside maximum bearish volume zone
- `bull_reject`: confirmation of bullish zone rejection
- `bear_reject`: confirmation of bearish zone rejection
- `new_bull`: new bullish block
- `new_bear`: new bearish block
---
## 10. Level Calculation
- Swing levels based on selected timeframe (`SelectPeriod`)
- `xHigh` and `xLow` for S1 and R1 calculation
- Levels plotted on chart
---
## 11. Take Profit / Stop Loss
- Extended horizontal lines (`extendBars`) to visualize TP and SL
- Customizable colors (`tpColor`, `slColor`)
---
## 12. Notes
- Complete script based on Pine Script v5
- Advanced graphical management with boxes, lines, labels
- Dynamically displays volumes and Order Blocks
- Integrated internal screener
---
### End of Documentation

High Time Frame (HTF) Swing PointsIdentify and display swing highs and lows across multiple higher timeframes on a chart, overlaying horizontal lines and customizable labels at these swing points.
Timeframes
Five user-defined higher timeframes (default settings: 5-minute, 15-minute, 1-hour, 4-hour, and daily)
Manually show/hide individual timeframes
When chart’s timeframe is set higher than one of the five configured, the indicator will automatically hide it. This helps to prevent clutter when navigating between timeframes on the chart
Swing Levels
Configure the line color, opacity, width and weather it’s solid/dotted/dashed
Once swing levels are identified, the indicator will look for the chart candle where the line starts
When price crosses the swing level, the line will be terminated
Tags
Customize the tag text for each individual timeframe, using blank if a tag is not desired for that timeframe
A tag text color can be set for all tags or base it on the line color
Set tag text size based on: Auto, Tiny, Small, Normal, Large
Choose how far to the right of the line the tag text should appear, as an integer representing the size of a candle
Choose to clear the tag or leave it in place after price crosses a swing level
Use Cases
Visualize key swing points from higher timeframes to identify potential reversal or breakout zones
Identify possible low resistance liquidity run (LRLR) areas
Use swing points for stop placement or as targets or draws on liquidity

Enhanced Std Dev Oscillator (Z-Score)Enhanced Std Dev Oscillator (Z-Score)
Overview
The Enhanced Std Dev Oscillator (ESDO) is a refined Z-Score indicator that normalizes price deviations from a moving mean using standard deviation, smoothed for clarity and equipped with divergence detection. This oscillator shines in identifying extreme overbought/oversold conditions and potential reversals, making it ideal for mean-reversion strategies in stocks, forex, or crypto. By highlighting when prices stray too far from the norm, it helps traders avoid chasing trends and focus on high-probability pullbacks.
Key Features
Customisable Mean & Deviation: Choose SMA or EMA for the mean (default: SMA, length 14); opt for Population or Sample standard deviation for precise statistical accuracy.
Smoothing for Clarity: Apply a simple moving average (default: 3) to the raw Z-Score, reducing noise without lagging signals excessively.
Zone Highlighting: Background colours flag extreme zones—red tint above +2 (overbought), green below -2 (oversold)—for quick visual scans.
Divergence Alerts: Automatically detects bullish (price lows lower, Z-Score higher) and bearish (price highs higher, Z-Score lower) divergences using pivot points (default length: 5), with labeled shapes for easy spotting.
Built-in Alerts: Notifications for Z-Score crossovers into OB/OS zones and divergence events to keep you informed without constant monitoring.
How It Works
Core Calculation: Computes the mean (SMA/EMA) over the specified length, then standard deviation (Population or adjusted Sample formula for N>1). Z-Score = (Source - Mean) / Std Dev, handling edge cases like zero deviation.
Smoothing: Averages the Z-Score with an SMA to create a cleaner plot oscillating around zero.
Levels & Zones: Plots horizontal lines at ±1 (orange dotted) and ±2 (red dashed) for reference; backgrounds activate in extreme zones.
Divergence Logic: Scans for pivot highs/lows in price and Z-Score; flags divergences when price extremes diverge from oscillator extremes (looking back 2 pivots for confirmation).
Visualisation: Blue line for the smoothed Z-Score; green/red labels for bull/bear divergences.
Usage Tips
Buy Signal: Z-Score crosses below -2 (oversold) or bullish divergence forms—pair with volume spike for confirmation.
Sell Signal: Z-Score crosses above +2 (overbought) or bearish divergence—watch for resistance alignment.
Customisation: Use EMA mean for trendier assets; enable Sample std dev for smaller datasets. Increase pivot length (7-10) in volatile markets to filter false signals.
Timeframes: Excels on daily/4H for swing trades; test smoothing on lower frames to avoid over-smoothing. Always combine with trend filters like a 200-period MA.
This open-source script is licensed under Mozilla Public License 2.0. Backtest thoroughly—past performance isn't indicative of future results. Trade with discipline! 📈
© HighlanderOne
