Dynamic Dots Dashboard (a Cloud/ZLEMA Composite)The purpose of this indicator is to provide an easy-to-read binary dashboard of where the current price is relative to key dynamic supports and resistances. The concept is simple, if a dynamic s/r is currently acting as a resistance, the indicator plots a dot above the histogram in the red box. If a dynamic s/r is acting as support, a dot is plotted in the green box below.
There are some additional features, but the dot graphs are king.
_______________________________________________________________________________________________________________
KEY:
_______________________________________________________________________________________________________________
Currently the dynamic s/r's being used in the dot plots are:
Ichimoku Cloud:
Tenkan (blue)
Kijun (pink)
Senkou A (red)
Senkou B (green)
ZLEMA (Zero Lag Exponential Moving Average)
99 ZLEMA (lavender)
200 ZLEMA (salmon)
You'll see a dashed line through the middle of the resistances section (red) and supports section (green). Cloud indicators are plotted above the dashed line, and ZLEMA's are below.
_______________________________________________________________________________________________________________
How it Works - Visual
_______________________________________________________________________________________________________________
As stated in the intro - if a dynamic s/r is currently above the current price and acting as a resistance, the indicator plots a dot above the histogram in the red box. If a dynamic s/r is acting as support, a dot is plotted in the green box below. Additionally, there is an optional histogram (default is on) that will further visualize this relationship. The histogram is a simple summation of the resistances above and the supports below.
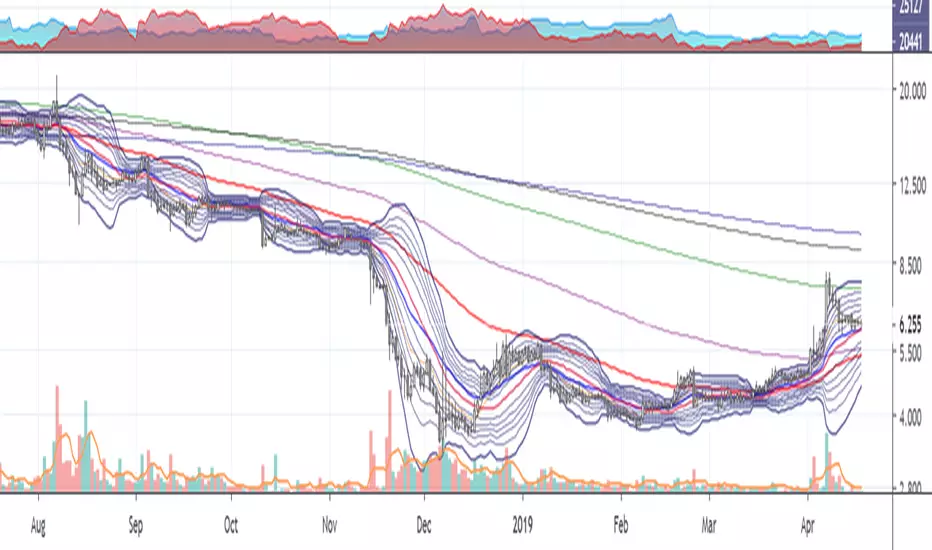
Here's a visual to assist with what that means. This chart includes all of those dynamic s/r's in the dynamic dot dashboard (the on-chart parts are individually added, not part of this tool).
You can see that as a dynamic support is lost, the corresponding dot is moved from the supports section at the bottom (green), to the resistances section at the top (red). The opposite being true as resistances are being overtaken (broken resistances are moved to the support section (red)). You can see that the raw chart is just... a mess. Which kinda of accentuates one of the key goals of this indicator: to get all that dynamic support info without a mess of a chart like that.
_______________________________________________________________________________________________________________
How To Use It
_______________________________________________________________________________________________________________
There are a lot of ways to use this information, but the most notable of which is to detect shifts in the market cycle.
For this example, take a look at the dynamic s/r dots in the resistances category (red background). You can see clearly that there are distinctive blocks of high density dots that have clear beginnings and ends. When we transition from a high density of dots to none in resistances, that means we are flipping them as support and entering a bull cycle. On the other hand, when we go from low density of dots as resistances to high density, we're pivoting to a bear cycle. Easy as that, you can quickly detect when market cycles are beginning or ending.
Alternatively, you can add your preferred linear SR's, fibs, etc. to the chart and quickly glance at the dashboard to gauge how dynamic SR's may be contributing to the risk of your trade.
_______________________________________________________________________________________________________________
Who It's For
_______________________________________________________________________________________________________________
New traders: by looking at dot density alone, you can use Dot Dynamics to spot transitionary phases in market cycles.
Experienced traders: keep your charts clean and the information easy to digest.
Developers: I created this originally as a starting point for more complex algos I'm working on. One algo is reading this dot dashboard and taking a position size relative to the s/r's above and below. Another cloud algo is using the results as inputs to spot good setups.
Colored Bars
There is an option (off by default, shown in the headline image above) to fill the bar colors based on how many dynamic s/r's are above or below the current price. This can make things easier for some users, confusing for others. I defaulted them to off as I don't want colors to confuse the primary value proposition of the indicators, which is the dot heat map. You can turn on colored bars in the settings.
One thing to note with the colored bars: they plot the color purely by the dot densities. Random spikes in the gradient colors (i.e. red to lime or green) can be a useful thing to notice, as they commonly occur at places where the price is bouncing between dynamic s/r's and can indicate a paradigm shift in the market cycle.
_______________________________________________________________________________________________________________
Timeframes and Assets
_______________________________________________________________________________________________________________
This can be used effectively on all assets (stocks, crypto, forex, etc) and all time frames. As always with any indicator, the higher TF's are generally respected more than lower TF's.
Thanks for checking it out! I've been trading crypto for years and am just now beginning to publish my ideas, secret-sauce scripts and handy tools (like this one). If you enjoyed this indicator and would like to see more, a like and a follow is greatly appreciated 😁.
חפש סקריפטים עבור "ichimoku"

CC - PVT CloudsReleasing this test script for PVT ratios using sub-interval harmonics at a 1D, 4H, 1H, 45M, 15M and 5M level.
It basically takes the PVT values for a rolling periodic interval and gets the (avg - min)/max for that interval (the ratio).
Then it colors it based on the subinterval next to it. Just think of it as rolling Ichimoku clouds, but in real-time using PVT.
I'm not saying much more than that, as this is an experimental indicator. Feel free to use it and give me feedback.
Drop a like if this helps you trade, but please do not use these indicators as a DIVINING ROD for your trades.
However, I will possibly release a paid version with TEXTUAL take profit/stoploss indicators.
*DISCLAIMER*
No amount of technical indicators will safe you from a lapse in Due Diligence or Market/Industry Judgement.
I am not responsible for lost equity due to trades caused my relying on this indicator.

InariN simpleJapanese legendary day trader's indicator "InariN" .
"N jijii " introduced this original indicator at his ebook and I made it simple for my own use .
This is not original type but I picked up essential elements to practice his idea .
I guess he is real forex day trader and "InariN" is similar to "Ichimoku" .
I have used this at EUR/USD 5 minutes chart for several months and I get basis for judgement .
This is not a magical tool but you can make good reference point to use this .
I think " I " means first swing , " nari " is " become " and " = " , and " N " is third swing .
For example , look at chart , AB is first swing ,BC is second and CD is third .
In many cases ,AB = CD and it called measured move .
"InariN" provide reference point to decide always-in ,entry point , entry timing and exit point.
1.
"InariN" is a trendfollowing tool , you can judge bull or bear by a few lines .
25 ema represent short time frame , 49 (about 4 hour bar at 5 minutes chart ) is middle time frame and 217 (about 18 hour at 5 minutes chart )is long time frame (preset periods is "N jijii" style . please use favorite time frame ).
For example , when current price is above 25ema ,49ema and 217 High-low band"s middle line , market is strong bull .
So you can do multi time frame analyze .
Hint ; you also have to check daily chart's trend .
2.
Every line provided by "InariN" tends to become bull-bear battle point , so you can easily check where is support and resistance line .
Hint ; Especially 25ema is important to pullback entry in trend and 217 high-low line is important to do fade trade in range and reversal .
You have to wait entry until touch and stick lines and follow winner (to avoid failed breakout check shrinking bar) .
3.
You can also use lines to except exit point because high-low band is symmetry .
Hint ; I recommend use custom fibonacci retracement tool to measure Risk-Reward Ratio and exit point .
I customized fibo tool to be symmetry .
Entry point ,exit point and loss cut point became symmetry and you can add other symmetry points more .
For example , look at chart , blue lines is fibo tool and you can measure exit point .
Have fun!!

Easy Loot Money MakerEasy Loot Money Maker Script
This indicator uses modified Bollinger Bands & Ichimoku Clouds to generate the best opportunities to buy & sell
Works best on lower timeframes, so if you're a day trader or scalper, this indicator is for you
I recommend using anywhere from 5 minute, 15 minute, 1 hour, to 2 hour timeframe to give you the best opportunities on entry & exit price
Obviously mix in your own technical analysis such as support, resistance, and trendlines in addition to using this indicator to make a decision on whether to buy or sell.
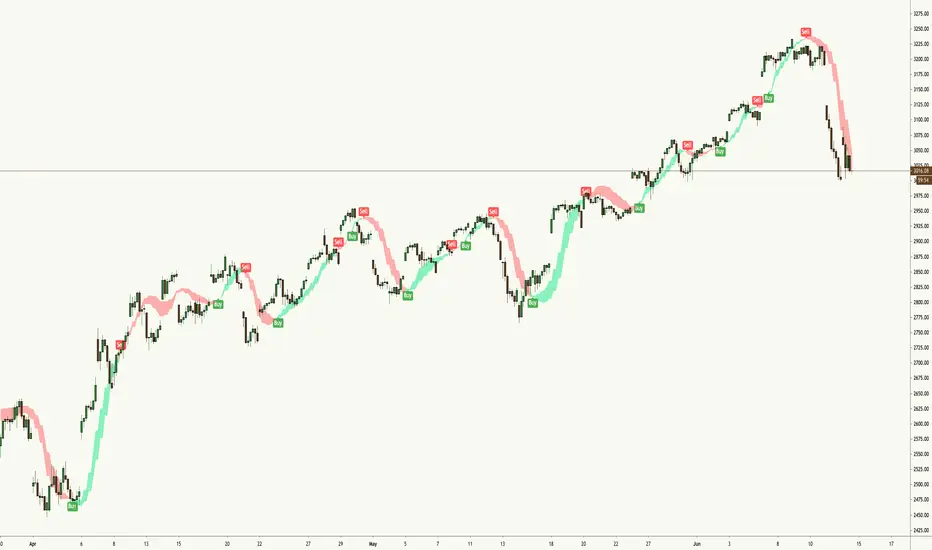
This chart here looking at the 1H chart of S&P500 (SPX), you can clearly see that the indicator called the top as well as these miniature swing highs and lows.
To add this indicator to your chart, simply press the 'like' button and it will be added to your favorites under the 'Indicators' tab at the top of your chart.
Please let me know if you have any questions or concerns regarding this indicator, as well as feedback on using it whilst trading.
BERLIN CandlesA problem with Heikin Ashi is that while it gives you a great overview of overall direction, it is rarely possible to use it as a replacement for normal japanese
candlesticks. The reason for this is that actual price data is lost, since the candles are more akin to a moving average than a different way to see price action. Also, with Heikin Ashi, most of the actual price action is lost, because the candles can be bigger than the high and low of the underlying japanese candlestick.
With BERLIN Candles I have tried to fix that problem. By using a smoothed out version of the previous Heikin Ashi candle close as the current BERLIN Candle open, the high and low of the actual japanese candlestick for the high and low of the BERLIN Candle, and the current Heikin Ashi close as the BERLIN Candle close, while setting hard limits for BERLIN Candle open and close values so that they can never exceed the high and low of the underlying japanese candlestick.
One problem still persists though. The actual current price data is lost. However, the BERLIN Candles have solved this by adding a fifth part to the candles. The close of the underlying japanese candlesticks are indicated with a plus-sign. This way, actual price data is never lost, while keeping all of the other benefits of this type of candles.
A few added bonuses:
The addition of the 14 period ATR at the latest candle
The baseline from Ichimoku is included as an option
The 14 period ATR value of each candle can be seen in the indicator data as
the orange value

Commander IndicatorCommander Multi Indicator
included:
Pioneer EMA
Commander 3MA with MAs cross signal
Double Ichimoku - Kijun Base-Line (26) and Kijun Commander Moving (103)
Parabolic Sar
Bollinger Band
3-Stroke Movings

MA&ICH&BBCan be used in any time frame, any market (crypto,stock and FX) and any symbol. Values changeable and turntable on/off.
Include's :
- EMA/MA/WMA
- BB
- ICHIMOKU Kinko Hyo inspired by Kıvanç Özbilgiç

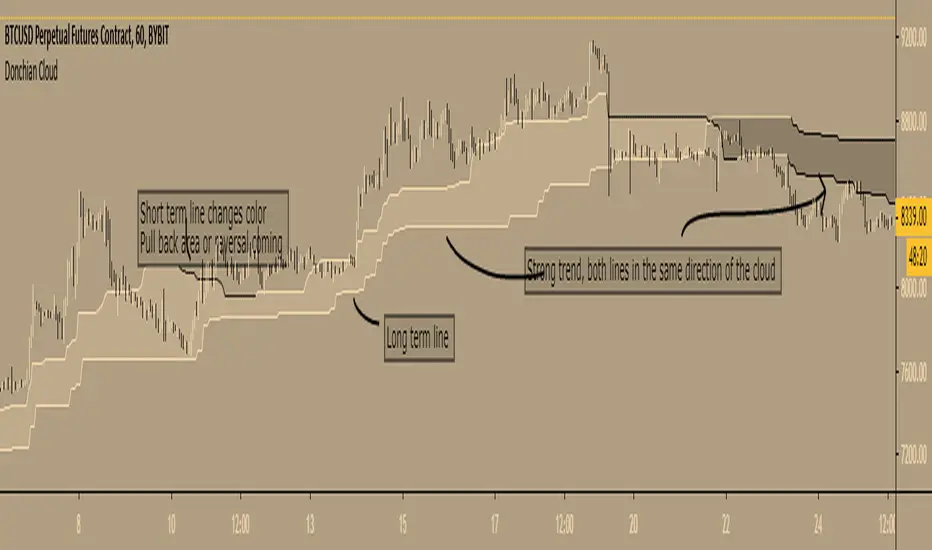
Donchian Cloud - evoA cloud based on the highest high and lowest low of a given period (Donchian), same lines used in Ichimoku Cloud (Conversion line or Base line).
Short term line is based on current time frame, long term line is based on your given multiple of current time frame.
The color of the lines is based on up or down movement.
I stole a piece of code from PineCoders for the multiple time frame:
I have not used this in my trades (yet) so I don't know how good it is, just posting because it looks nice :)
Feel free to share your settings if you can find good ones.
Zentrading Trend Indicator v3.1This is a script for beta testing only.
Based on ichimoku, but with slightly different behaviour, with many added features such as : trend detection, momentum detection, multiple time frame support/resistance levels, exhaustion/reversal signals.
Used in conjunction with the other ZT indicators (ZT momentum, ZT CyclePhase, and ZT Volumebars) the strategy provides very distinct setups to trade for reversals, breakouts and pullbacks.

Direction TradeDirection Trade is a moving average based indicator which combines power of SMA and WMA together.
The Buy/Sell (Arrow) signals comes from the combination of SMA and Hull MAs and works on multiple time frames.
The cross of yellow and blue indicates major trend change on bigger TFs, especially on Daily, these are also highlighted in the background color change.
In addition this indicator also adds power of Ichimoku which uses an optimized settings for crypto.

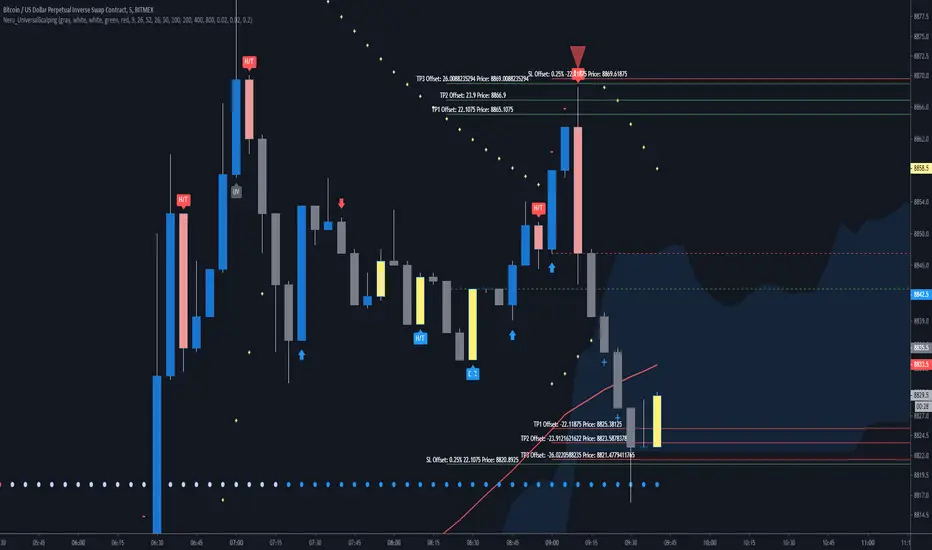
Neru_UniversalScalpingNeru_UniversalScalping - Tool
Markets: All markets, this is a universal tool which is using 100% standard settings for all built-in indicators.
Interval: 3 minutes to maximum 2 hours.
Built-In indicators:
- Basic Candlesticks (E/R as stronger one and H/T as weaker one)
- Stochastic breakups and breakdowns shown in different candle colors (close, 20 and 80)
- Extreme overbought and oversold conditions marked with a + an - (Stochastic >95 and <5)
- Daily and 4H Pivot Points
- Ichimoku Cloud (including Senkou´s, Tenkan + Kijun)
- 5 SMA´s (50,100,200,400 and 800)
- TrendEvaluator at the bottom, showing a basic trend (calculated from the cloud and 3 Moving Averages, 50, 100 and 200)
- Temporary buying + selling pressure labelled as arrows above and below candles
- Standard Parabolic Sar built-in
Risk Management:
You have the option to plot a basic risk calculation into the charts, based on the assumption, you don´t use a leverage and 100% equity.
Shown is a stop loss offset, the % and the price. Same goes for 3 take profits. Fees and spread are NOT included in this calculations.
You can choose between 0.25%, 0.5%, 1% and 1.5%, obviously the smaller the timeframe, the smaller risk you need to consider.
General Information:
All settings are adjustable, also in color and position.
This is not an automated system, that is generating entries and exits. With help of the built-in alarms you will have always to consider
the environment such as the trend, the relative position to the Pivot Points, the relative position to the Moving Averages and for example
conditions such as oversold / overbought and key-levels. It´s not replacing a human.
Please always be aware that counter trades on pullbacks are always more risky than trend-follow trades and a beginner should stick to less risk.
Warm regards, Neru
Neru_TrendEvaluator_v1Neru_TrendEvaluator_v1
_____________________
This trend-finder tool is showing you at the bottom of the chart (adjustable), what the current supertrend for the chosen interval is.
Used indicators are the Ichimoku Cloud (adjustable settings) and three SMAs (also adjustable).
Both have standard settings and are useful for Stocks, Forex and Cryptocurrencies.
_____________________________________________
Warm regards,
Neru

[Birbicator] StochTKDBirbicator is a custom indicator prototype based on Stochastic oscillator, enriched with Stochastic of Tenkan and Kijun of Ichimoku with adjusted, prototyped settings. It includes the ribbon, which corresponds with the momentum per Stochastic oscillator crossovers. It involves histogram as well which displays the relation of distance between Tenkan and Kijun. It displays the coloured candles in the main chart also. The orange colour is bullish while dark candle is bearish. White candles are neutral.
The indicator displays the strength of the trend when Stochastic and TK are following the same direction. The stronger buy/sell signal appears on the Stoch crossover simoultaneous to Histogram crossover.

Lancelot Band - ATR Reversal+Trending IndicatorThis is an indicator I created recently, with the mind of spotting where price might reverse and where the price is trending. You can see this as the primary indicator for your system, however, it is recommended you use this in conjunction with other confirmation indicators.
This script focus solely on ATR or Average True Range.
This indicator is the combination of the baseline from the Ichimoku cloud and the concept of the Keltner channel.
Baseline period = 14
ATR period = 14
ATR Mult = 1.5
For reversal
Long when price crossover Lower band & Stop loss at xLower band
Sell when price crossunder Upper band & Stop loss at xUpper band
For Trend Following
Long when price crossover xUpper band and Stop loss at Upper band
Short when price crossunder xLower band and Stop loss at Upper band
Again, you will need other indicators to help you to succeed in this system. This indicator will not generate the best exit for your position but will generate a good entry signal when you use it with both volume indicator and exit indicator.
Works well on BTCUSD XBTUSD, as well as other major liquid Pair.
Feel free to follow me on Twitter @Lancelot_Auger for more free Alpha.
Please acknowledge my effort by like and follow.
And lastly,
Save Hong Kong, the revolution of our times.

CloudRest ATR based cloudThis is an indicator I have been working on for the past 2 years, developed specifically for cryptocurrency.
It is primarily a trend following indicator with great success and it performs the best in 4hrs to the weekly chart.
There are two components of this indicator.
The baseline from Ichimoku cloud and volatility stop .
baseline period = 26
volatility stop = 1.5ATR, 3
You can view this as the main component of a trend following system but you will need other confirmation indicators to confirm your entry.
Feel free to modify the script for your own system.
Feel free to follow me on twitter @Lancelot_Auger
I will be posting more content in the future, stay tuned.
And lastly,
Free hong kong, the revolution of our time!

The Mango Ribbon The Mango Ribbon is a convenience indicator which encompasses a combination of moving averages combining those of exponential and Ichimoku averages. I will be updating this indicator with more features as time passes.
Hope you enjoy. For access, simply pm me on Telegram (porco1x) or use the sign up form at mangoresearch.co

MA-EMA-BB - NakajimaSome MA and EMA that you can hide/show
Bollinger Bands
Ichimoku
Fibonacci
Fractals


ICH+BB+MA_BY_CRYPDOGThis is multiful layout. :)
1. ICHIMOKU BASE LINE + CONVERTER LINE
2. Multiful BB BAND ( MAX 4 )
3. MA / EMA / VMA ( MAX 6 )
4. Color custom / Input number custom
If you have any question dm me.
Thanks!
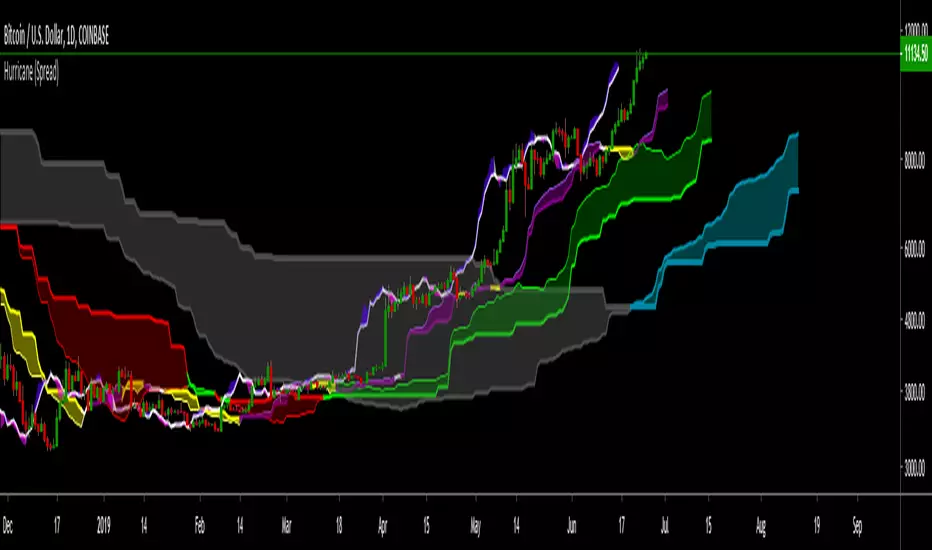
HurricaneThe Hurricane Indicator
This Indicator takes the traditional Ichimoku and expands it's capabilities to a whole new level.
It is a trend based trading indicator that utilises equilibrium calculations from multiple time frames, to reveal areas of support, resistance, strength, weakness, acceleration and momentum throughout the various bull and bear market trends.
By using the three components of the Hurricane together (or individually), it presents the entire picture of micro, mid-term and macro trends, enabling the trader to scalp price movements on a smaller time frame whilst keeping an eye on the larger trend.
For a full write up on what it does and the explained settings follow this link:
docs.google.com
Add this to your favorites, then send me a message through Trading View and I'll grant you temporary access to try it out.
To continue using it after the trial period, send me a message.
BTC: 13UKYNt4AAz2Yh2Suu6AAEWoUEiRVjqC12
LTC: LX4bUBdjiRPsagUbZoAczSGgDC4YqTJL7w
(YEK) Combo(YEK) Combo is a combination of several indicators (listed below). You can use them together or one by one. Just click settings, and choose which of them to be shown.
Here are the indicators included in this script:
- Ichimoku Cloud
- Bollinger Bands
- Moving Average 1
- Moving Average 2 (In case of detecting golden crosses or death crosses)
- Exponential Moving Average
- T3 Tillson
- MavilimW
Enjoy!

IchiMA ChannelEstrategia basada en un principio de ichimoku, Green Long , Red Short.
Make it simple.

HARA's favorite indicator by Theo ParkThis indicator contains :
4 Ichimoku clouds
8 Moving Averages
1 Fibonacci Bollinger Bands
2 Normal Bollinger Bands