Ichimoku Time RetracementThis is educational tool for understand pullback measurement .
Price pullback and Time pullback is basic concept for ichimoku.
I change parameters to understand relationship of each line easily and add lines .
Enjoy!!
חפש סקריפטים עבור "ichimoku"

Ichimoku 2 sets of settings, markers and alertsThis is my take on the masterful, beautiful and powerful Ichimoku.
It comes with:
- 2 sets of settings you can flip between,
- 5 types of markers:
--- Tenkan/Kijun crosses,
--- Price (close)/Tenkan crosses, with the option of only showing those occurring with the trend, so on pullbacks,
--- Price (close) exits out of the Kumo,
--- Chikou exits out of the Kumo,
--- Overbought/Oversold conditions (shown on the chart).
- Choice of showing only long or short markers,
- Coloring of bars using OB/OS conditions,
- Alerts on all markers and on combinations.
The markers are intended as indications—not bulletproof buy/sell signals.
The overbought/oversold conditions are detected when the high/low is a multiple of ATR away from Kijun. The ATR length and multiple used are configurable.
I normally use the Josh Olszewicz (CarpeNoctom) big settings, so those are the default.
I prefer subtle coloring on charts and my choice of colors reflects that.
You will see references to KumoA and KumoB in the names of inputs and style elements. For me, KumoA is the top of the Kumo when it is bullish, so the bottom when bearish.
As usual when creating alerts, be sure you already have defined proper inputs and that you are on the intended interval, as they will be used when triggering alerts.


Options Series - Supertrend, HalfTrend, Ichimoku Cloud and P_SAR➤ Supertrend:
➤ HalfTrend:
➤ Ichimoku Cloud:
➤ Parabolic SAR:
⭐ Overview and How It Works:
This script combines multiple popular technical indicators—Supertrend, HalfTrend, Ichimoku Cloud, and Parabolic SAR—into a single, cohesive tool for analyzing price trends and reversals. Designed for traders who prefer multi-layered confirmation, it displays non-overlay signals in a candlestick format, helping users make sense of intricate market dynamics. It also includes a "Master Candle" condition, which aggregates the signals from all indicators, providing a powerful snapshot of market sentiment.
References for study,
Supertrend and HalfTrend and Ichimoku Cloud and Parabolic SAR
⭐ Key Features and Functionality:
The script integrates four indicators and visually represents them in a non-overlay fashion, meaning that each indicator's signal appears on separate candlestick layers. It uses color coding to differentiate between bullish and bearish signals. The Master Candle is a unique feature that aggregates the signals from all indicators to show the overall sentiment.
Supertrend: It uses ATR and a multiplier factor to create a trailing stop, identifying bullish and bearish trends.
HalfTrend: It analyzes market volatility that provides buy and sell signals based on volatility channels and historical highs and lows.
Ichimoku Cloud: It leverages historical highs and lows to form the conversion and baseline, which are compared to assess market strength.
Parabolic SAR: A stop-and-reverse system that highlights potential reversals. It is based on time and price, offering traders potential reversal points.
Master Candle: It computes a score based on the confluence of all four indicators, adding another layer of confirmation.
🎨 Visualizations and User Experience:
The script's user interface is highly visual, with color-coded candlesticks plotted across multiple layers. Each indicator has its own color coding for bullish and bearish signals, ensuring clarity:
➤ Green for bullish signals.
➤ Red for bearish signals.
➤ Each candlestick layer represents a different indicator (e.g., Supertrend, HalfTrend, etc.), making it easy for the trader to isolate and interpret signals.
➤ The "Master Candle" provides an overarching view of the market by displaying a consolidated signal, which can reduce confusion from mixed indicator signals.
⭐ Settings and Customization:
The script is highly customizable, allowing users to adjust the settings for each indicator. Key customizable parameters include:
• Supertrend ATR Period and Factor
• HalfTrend Amplitude and Channel Deviation
• Ichimoku Conversion, Base, and Lagging Span Periods
• Parabolic SAR Start, Increment, and Maximum value
Additionally, users can toggle the visibility of each indicator and customize the look of the plot to suit their preferences.
⭐ Uniqueness of the Concept:
No repaints. This is the advanced representation and the combination of multiple indicators into a single script, along with a powerful "Master Candle" that aggregates them, makes this tool unique. Most scripts provide isolated indicator signals, while this one brings together four powerful indicators and visually simplifies the analysis. The non-overlay style and color-coded candlesticks offer traders an easy-to-understand, actionable visual cue, which stands out from traditional indicator overlays.
🚀 Conclusion:
This script is a comprehensive, multi-indicator trading tool suitable for traders looking for reliable trend-following and reversal detection. Its ability to provide an aggregated "Master Candle" signal reduces noise and aids in better decision-making. Customization options allow users to tailor it to their trading style, while its clear visualizations provide an excellent user experience.

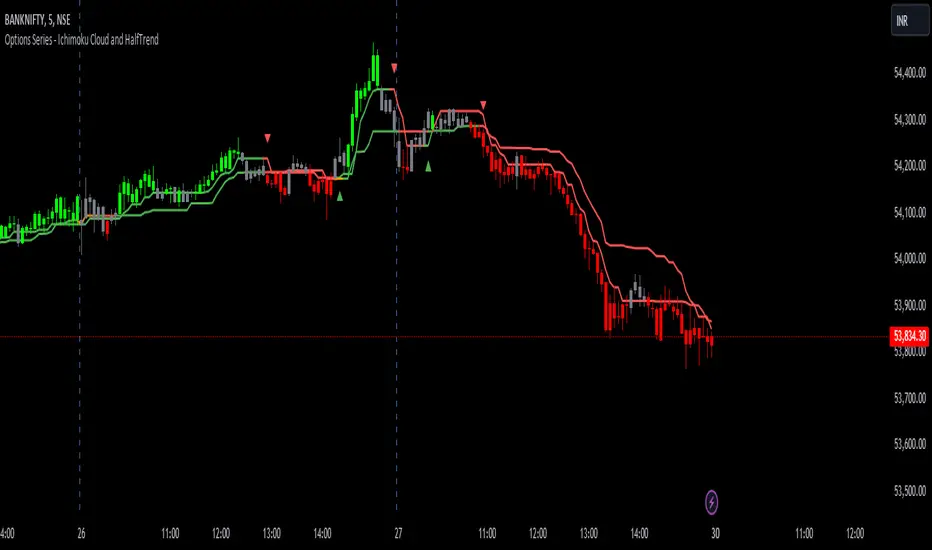
Options Series - Ichimoku Cloud and HalfTrend
The provided script combines two powerful technical indicators, Ichimoku Cloud and HalfTrend, to create a hybrid trading tool. Here's an analysis of the key components and how they work together:
Ichimoku Cloud and HalfTrend
⭐ 1. Indicator Title and Settings:
The script sets the title as "Options Series - Ichimoku Cloud and HalfTrend" and uses the overlay=true option to display the indicators directly on the price chart.
⭐ 2. Color Definitions:
Several colors are defined for later use:
Green and Red for different types of candles and signals.
Fluorescent Colors for highlighting significant trends or changes in market conditions.
⭐ 3. Ichimoku Cloud Setup:
The Ichimoku Cloud is a comprehensive indicator used to identify support, resistance, and trend direction. Here’s how the script configures it:
Conversion Periods, Base Periods, Lagging Span 2 Periods, and Displacement are customizable via input options, giving flexibility to adjust Ichimoku settings based on different market conditions.
The function donchian(len) calculates the Donchian Channel average, which is used to define the Conversion Line and Base Line. The crossover of these lines is crucial in determining bullish or bearish trends.
Color Logic for Kijun Cross: If the Conversion Line is above the Base Line, the trend is bullish (green color), while a bearish trend is indicated by red. A neutral condition is marked with orange.
⭐ 4. HalfTrend Indicator Setup:
The HalfTrend indicator detects trend reversals based on high/low price deviations from a moving average:
Amplitude and Channel Deviation inputs allow users to control the sensitivity of the indicator.
showArrows and showChannels toggle the display of buy/sell arrows and trend channels.
maxLowPrice and minHighPrice variables are initialized to track significant high/low points during the trend, used to confirm trend reversals.
⭐ 5. ATR and Trend Calculations:
The Average True Range (ATR) is used to calculate the volatility-based channels. The script calculates atr2 and uses this to create atrHigh and atrLow for plotting the channel.
The trend detection logic is as follows:
When the trend is upward, the script seeks confirmation by comparing the high moving average with previous lows, signaling a continuation of the uptrend if it holds.
Conversely, a downtrend is confirmed when the low moving average exceeds previous highs.
⭐ 6. Customized Candle Coloring:
A custom color scheme is applied to candles based on a combination of trend direction and Ichimoku Cloud signals:
GreenFluorescent for strong bullish conditions where price is above the HalfTrend line, and the Conversion Line is above the Base Line.
RedFluorescent for strong bearish conditions, with price below the HalfTrend line and Conversion Line below the Base Line.
Gray for neutral or indecisive conditions.
⭐ 7. Plots and Shapes:
The script plots various elements:
HalfTrend Line: The main trendline is plotted in either green (buy) or red (sell), with adjustable line width.
Ichimoku Base Line: This is plotted with the dynamic color based on crossovers.
Buy/Sell Arrows: These are drawn on the chart when valid buy/sell conditions are met.
Custom Candles: The script overrides default chart candles with custom-colored candles based on the previously discussed logic.
⭐ 8. Improvements:
Optimization: Parameters like the amplitude, channel deviation, and Ichimoku periods can be fine-tuned based on backtesting results to maximize performance for specific assets or timeframes.
Alerts: The script could be enhanced by adding alert conditions for real-time buy/sell notifications, leveraging alertcondition() in Pine Script.
In summary, this script merges two trend-following techniques for a multi-faceted view of the market, using visual cues and trendline logic to provide a robust trading tool.
🚀 Conclusion:
Trend-Following System: The combination of Ichimoku Cloud and HalfTrend provides a comprehensive view of both long-term trends (via Ichimoku) and shorter-term reversals (via HalfTrend).
Visual Signals: The script includes clear visual signals (arrows and custom-colored candles) to help traders quickly spot buy/sell opportunities.
Dynamic Customization: Through user inputs, this indicator can be tailored to different market conditions, making it versatile.
Ichimoku Analysis Tool by TheSocialCryptoClubName: Ichimoku Analysis Tool
Category: Indicator.
Timeframe: Any Timeframe
Description: Ichimoku Analysis Tool is an assistant for the trader to visualize the information that can be perceived at a glance from the Ichimoku Kinko Hyo indicator.
Suggested usage: Use on Daily to evaluate the general long term, short term and mid term situation.
Technical Details: Each cell of the table describes an element of the Ichimoku by simply assessing the direction of the lines - or whether they are flat - and how they are positioned with each other (e.g. Tenkan above or below the Kijun) and in general how long ago the last Kumo Twist was and the width in percent of the Kumo.
Credits:
- Some of the indications has been explained by Corrado Rondelli
- Table has been inspired by tanayroy's ICHIMOKU Trading beta

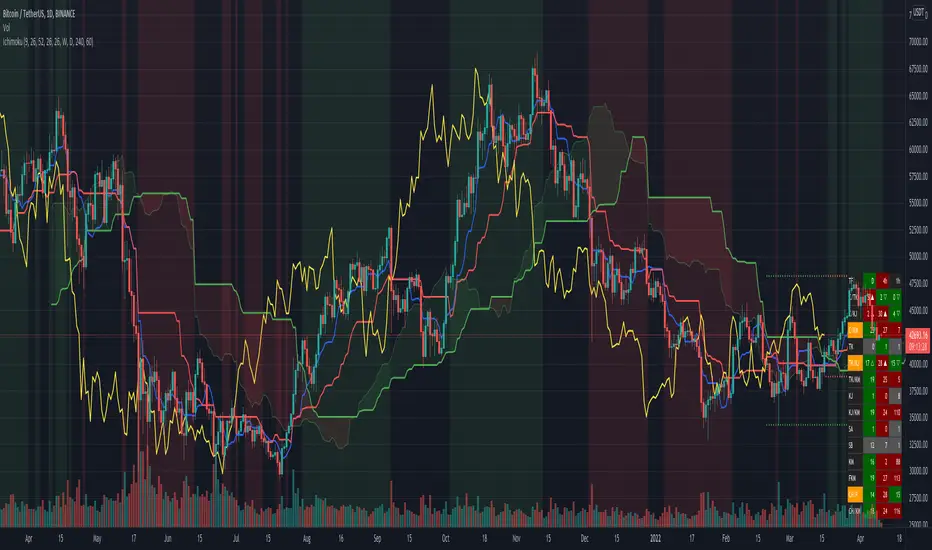
Ichimoku Score by KingThiesiScore, is an Ichimoku-based scoring system, in which individual Ichimoku events are measured by their impact, and then counted towards a greater score, leaning either bullish or bearish. The score tends to be between -3 and 3 for 99% of occurrences. Scores above or below this range are abnormal to say the least.
How the Score is Calculated
Bearish events are negative points. When the score is below zero, bears have control of the given TF. In theory, when the iScore is falling, the market is in downtrend. Note the divergences on reversals. iScore tends to lead price.
Bullish events are positive points. When the score is above zero, bulls have control of the given TF. In theory, when the iScore is rising, the market is in uptrend. Note the divergences on reversals. iScore tends to lead price.
Bullish Events Measured: TK Bull Cross, PK Bull Cross, Lagline Bull Cross, and Leadline Bull Cross
Bearish Events Measured: TK Bear Cross, PK Bear Cross, Lagline Bear Cross & LeadLine Bear Cross
The location of the events are also a factor in the scoring system. Locations include above the kumo, inside the kumo, and below the kumo, and are then prioritized in their own respects, based on the standard rules interpretation of Ichimoku signals, which users can read more into if interested. Links are provided below with further reading.
iScore can be applied to any ticker by any trader, and is not limited to any specific TF. Its programmed in Pine version 4 and uses Heikin Ashi inputs for OHLC, although traders are able to use with any chart type.
Links for Further Reading
Fidelity Ichimoku Summary
Investopedia Intro to Ichimoku Clouds
Cheers!
KT

Ichimoku Cloud & CandlesThe Ichimoku Cloud is a hybrid indicator combining numerous technical indicators that show support and resistance levels, as well as indicating momentum and trend direction. Ichimoku does so by taking multiple, pre-set price moving averages and plotting them on the chart in line form. It also uses these inputs to create a "cloud" which intends to forecast where the price may find support or resistance in the future. Refer to standard, and widely available, Ichimoku Cloud technical publications and/or YT videos for information on how to trade using the Ichimoku Cloud.
This indicator uses standard/default Ichimoku settings. The difference between this indicator and standard Ichimoku indicators is that the candle colors are based on price relative to the Tenkan-sen and Kijun-sen, and as such are painted lime, fuchsia and gray. Lime price candles indicate that price is in an uptrend; fuchsia candles indicate a downtrend; gray is no identifiable trend, or neutral.

Ichimoku Silver Bullet 2026 – Precision Cloud Signals⚡️ Ichimoku Silver Bullet 2026 – Precision Cloud Signals
Take your Ichimoku trading to the next level with Silver Bullet 2026 ⚔️
This advanced system detects Tenkan-Kijun crossovers, Kumo breakouts, and true Cloud confirmations — giving you only the cleanest, most reliable signals.
🔥 Features:
✅ Smart Bull 🟢 & Bear 🔴 alerts with Kumo validation
✅ Precision cloud logic for fewer fake signals
✅ Works on any timeframe & any market
✅ Plug-and-play Ichimoku setup — no clutter, pure signal
🎯 Trade with clarity. Enter with precision. Ride the Silver Bullet. 🌥🚀

Ichimoku Cloud w/ HelpersIchimoku Cloud w/ Helpers is your standard Ichimoku Cloud indicator with two additions.
Checkout TradingView's write up on the Ichimoku Cloud here .
The two additions added to this indicator are described below:
1 — A box is drawn centered on the current bar and stretching a length equal to the 'Senkou Span B Period'.
• The box encompasses the highest high and lowest low in that period.
2 — Two new lines are added.
• Green Line : Projection from the Lagging Line (Chikou Span) to the Span A line, indicating historical price action relative to future projected support/resistance.
• Red Line : Projection from the Kijun-sen (Base Line) to the Span B line, indicating medium-term trend direction relative to future projected support/resistance.
Use cases :
• The Box is simply a visual cue to draw your eye towards the area that the Ichimoku Cloud is currently attempting to analyze: Past, Present and Future.
• The green and red lines add a way to interpret the sentiment:
• Diverging Lines with Green Above Red --> Interpret as Bullish Sentiment
• Converging Lines with Green Crossing Above Red --> Interpret as Bullish reversal or strengthening
• Converging Lines with Green Crossing Below Red --> Interpret as Bearish reversal or weakening.
• Diverging Lines with Red Above Green --> Interpret as Bearish Sentiment
• Converging Lines with Red Crossing Below Green --> Interpret as Bullish reversal or weakening bearish trend.
Current limitations :
• Under settings -> Styles, the plotted lines don't allow the colors to be changed. A bug I'm trying to figure out.
Bugs?
Kindly report any issues you run into and I'll try to fix them promptly.
Thank you!

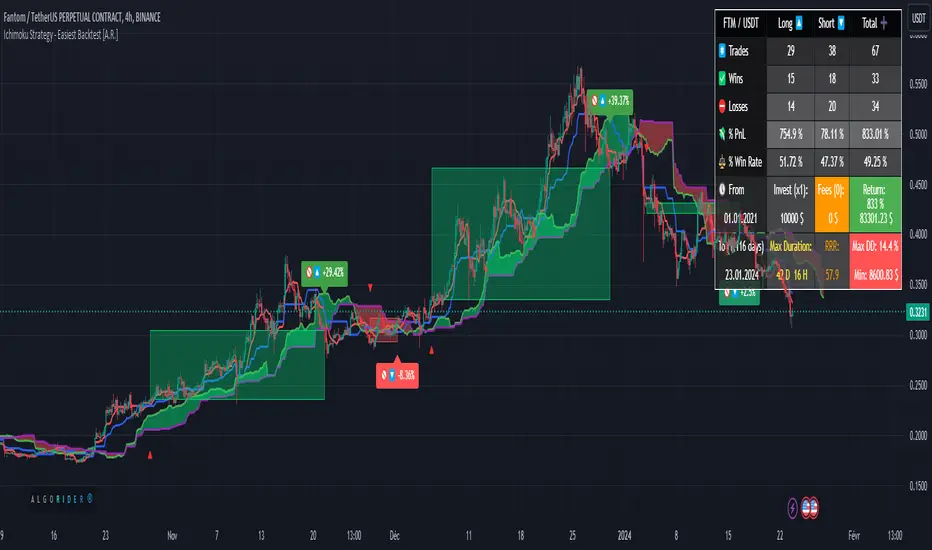
Ichimoku Strategy - Easiest Backtest [A.R.]▓ INTRODUCTION
This indicator allows a new "sandbox" approach to the Ichimoku system allowing to combine several entry, confirmation and exit conditions, to add basic risk management, to be able to backtest the performance of the strategy using a table directly on chart, and automate entry and exit signals using alerts.
▓ DEFINITION
The Ichimoku strategy is a trading system based on technical analysis, using a set of graphical indicators to evaluate the trend, strength and support/resistance levels of a financial asset. It integrates components such as the conversion line (Tenkan), the baseline (Kijun), the cloud delimited by the Senkou Span A and the Senkou Span B (SSA - SSB - Kumo) and the lagging span (Chikou) to provide different trading signals.
▓ ADDED VALUE
Several indicators and strategies concerning Ichimoku are already available on Tradingview, we are publishing this indicator to make this strategy even more accessible, what makes it original:
▪️ Unique Settings Windows, easy-to-read. The settings categories are clearly separated. Some parameters are aligned to avoid having an endless list of parameters to modify. This makes the settings window easy to understand and pleasant to use.
▪️ Sandbox type settings, you can choose 1 or 2 Entry conditions, choose to add 1 Confirmation, choose to add between 1 and 3 Exit Conditions. Dozens of possible configurations.
▪️ Possibility of adding basic Risk Management (TP/SL)
▪️ Backtest table directly on chart that allow to get quickly the results (script execution <1 sec) which makes it practical, allowing dozens of different configurations to be tested in a short period of time
▪️ Monitoring historical and current trades on chart thanks to Boxes and Labels
▓ HOW TO USE
You can try the indicator with default settings but you can also modify backtesting settings and trade Entry conditions, Entry Confirmation, and Exit conditions, also you can decide to add a Stop Loss and/or a Take Profit. Then you can find the stats of the backtesting in a table directly in the top right corner of the chart. Finally you can automate the strategy using Alert conditions. You can find all the settings below:
Initial backtesting settings:
🔹Set up Side: Choose Long|Short, Long or Short
🔹Set up Investment: Choose an amount in $, it simulates the equity / funds on the trading account.
🔹Set up Position Size: Choose an amount in $, it simulates the amount of the position size of each trade. If you want to simulate leverage trading, you can put a Position Size superior to Investment. For exemple Investment = 10000 and Position Size = 20000 simulates a x2 leverage.
🔹Set up your Fee rate %: Each trade entry and trade exit, a % of position size will be deducted from the PnL stats. For example if you choose 0.04% with 10000 Position Size, 4$ will be deducted each trade entry and each trade exit = 8$ fees each trade.
🔹Set up the Start and End date: It allows to backtest the strategy over a period of time, for Example from 01-01-2021 to 01-12-2022. By default the end date is year 2050, the backtest will start to take into account data from Start Date to the current time.
Backtest the main Ichimoku sub-strategies choosing entry conditions:
🔸Cloud Breakouts trading: Choose this Entry condition to start a trade when Price crosses the Cloud Upside (Long) or Downside (Short)
🔸Tenkan x Kijun cross trading: Choose this Entry condition to start a trade when Tenkan (Red line) crosses Kijun (Blue line) Upside (Long) or Downside (Short)
* There is no repaint, a signal is validated after the condition is confirmed at the end of the previous candle. If a signal appears on the chart, it won't ever disappear.
Entry Confirmations:
✔️ Chikou Above or Below price: if you check this setting, Long entry signals will be confirmed only when the Chikou (White Line) is Above the current price and Short entry signals will be confirmed only when the Chikou (White Line) is below the current price. In the Ichimoku system the Chikou is often used to confirm all types of signals.
Exit Conditions:
❌ Cloud Reintegrations: When a trade is open (Long or Short), if the price goes back into the cloud the trade is closed
❌ Reverse Cloud Breakouts: When a Long trade is open, if the price breaks out of the cloud from below the trade is closed. When a Short trade is open, if the price breaks out of the cloud from above the trade is closed.
❌ Reverse Tenkan-Kijun Cross: When a Long trade is open, if the Tenkan crosses Downside the Kijun the trade is closed. When a Short trade is open, if the Tenkan crosses Upside the Kijun the trade is closed.
Basic Risk Management:
⛔️ SL: Choose to set up a Stop Loss
✅ 1 single TP: Choose to set up a Take Profit
Signals:
🔔 Entry/Exit Alerts available: 4 types of alert conditions are available ENTRY LONG, ENTRY SHORT, EXIT LONG, EXIT SHORT. The entry conditions trigger at the beginning of the candle, choose alert frequence = once per bar.
👉 Tips: Easier to find profitable configurations in High Timeframe above H4.
▓ BACKTESTING SYSTEM
The Backtesting system integrated into the script tracks each trade. It allows you to test the strategy over a fixed period between a start date and an end date. It also allows to quickly and directly display on the chart the most important data to determine if a configuration is profitable such as the % PnL, the Max Drawdown, the amount of fees, the risk-reward ratio. It has been designed to be easy and quick to use even for a beginner.
═════════════════════════════════════════════════════════════════════════
The information published here on TradingView is not prohibited, doesn't constitute investment advice, and isn't created solely for qualified investors.
Important to note: The source code of this indicator is not accessible because it benefits from the code of our backtesting system present in other non-public indicators that we protect. Our indicators with the same backtesting system are published in separate publications because putting them together in a single script would considerably slow down the execution of the script.
Ichimoku Kinkō hyō 目均衡表█ OVERVIEW
Ichimoku is known to be an Indicator that completes itself, for its power but also for its complexity. This is why I decided to improve the work of
Goichi Hosoda in order to offer the maximum number of options for the most seasoned users but also beginners with options to simplify the
reading of Ichimoku (such as a panel directly giving you the status of each Ichimoku options or Supports/Resistances drawn automatically
according to the conditions chosen in the settings.
█ OPTIONS
Here is the complete list of options to implement :
- "Source" and "Alternative Source" (with lots of choices)
- Heikin Ashi volume.
- Weighted Moving Average Smoothing
- Minimum, Maximum and Adaptive Percentage Length adjustable for Tenkan-Sen, Kijun-Sen, Chikou Span and Senkou-Span)
- The Chikou has a Filter with modifiable Length (in Lookback Percentage)
- Advanced Filter Settings: Volume, Tenkan-Sen/Kijun-Sen Cross, Volatility, Tenkan-Sen Equal Kijun-Sen, Chikou Greater Than Price,
Chikou Momentum, Price Greater Than Kumo, Price Greater Than Tenkan-Sen, Chikou Trend Filter .
- Oscillator volume adjustable via drop-down menu with 5 types of oscillators available: "TFS Volume", "On Balance Volume",
"Klinger Volume", "Cumulative Volume", "Volume Zone".
- Relative Volume Strength Index with Length, Peak and EMA's adjustable. 3 Oscillators available: “On Balance Volume”,
“Cumulative Volume”, “Price Volume Trend”.
- Volatility adjustable with Fast and Slow Length.
- Totally customizable Support and Resistance.
- Bar Trend Color based on chosen settings.
- Fully customizable help panel.
- Alerts available for: Labels Detection, Support/Resistance Line Cross, Panel Trend Status Direction.
█ NOTES
Remember to only make a decision once you are sure of your analysis. Good trading sessions to everyone and don't forget,
risk management remains the most important!

Ichimoku + Forecast + SignalsIchimoku Kinko Hyo (IKH) (Japanese一目均衡表, Ichimoku Kinkō Hyō), usually shortened to "Ichimoku", is a technical analysis method that builds on candlestick charting to improve the accuracy of forecast price moves. - From Wikipedia, the free encyclopedia
This indicator is enhanced with the following helpful features:
Tenkan-sen, Kijun-sen, Senkou Span A and Senkou Span B 5 days forecast
identified bullish (green color), bearish (red color), or flat/within (gray color) signals including the number of days it accrued from the last bar and the place of appearance (▲ - above bullish Kumo, △ - above bearish Kumo, ◆ - within bullish Kumo, ◇ - within bearish Kumo, ▼ - bellow bullish Kumo, ▽ - bellow bearish Kumo)
lines indicating the range of the Tenkan-sen, Kijun-sen, and Senko Span B calculations (we can easily identify the highest-high and the lowest-low of the range and how long it will persist)
Signals description:
C/TK - bullish/bearish Close/Tenkan-sen cross
C/KJ - bullish/bearish Close/Kijun-sen cross
C/KM - bullish/bearish/within Close/Kumo cross
TK - bullish/bearish/flat Tenkan-sen
TK/KJ - bullish/bearish Tenkan-sen/Kijun-sen cross
TK/KM - bullish/bearish/within Tenkan-sen/Kumo cross
KJ - bullish/bearish/flat Kijun-sen
KJ/KM - bullish/bearish/within Kijun-sen/Kumo cross
SA - bullish/bearish/flat Senkou Span A
SB - bullish/bearish/flat Senkou Span B
KM - bullish/bearish Kumo
FKM - bullish/bearish future Kumo
CH/P - bullish/bearish Chikou Span/Price cross
CH/KM - bullish/bearish/within Chikou Span/Kumo cross
Ichimoku Support and Resistance by TheSocialCryptoClubName: Ichimoku Supports and Resistances
Category: Indicator
Timeframe: Any Timeframe.
Description: Ichimoku Support and Resistance is an indicator which allows to represent on the chart the price structures identified through the flat zones of the various lines of the Ichimoku Kinko Hyo indicator
Suggested usage: Use on any timeframe. It is possible to calculate flat zones only in a certain period and in a different time frame, and select those calculated by specific lines.
Technical Details: Internally it uses an Array to store the levels of when a line is flat (calculating the distance to the previous one). At the last bar it prints the various lines on the screen.
Credits:
- Some of the indications has been explained by Corrado Rondelli in "Strategie di trading con l’indicatore Ichimoku Kinko Hyo"

Scalping IchimokuBased on the Ichimoku Cloud indicator, the Scalping Ichimoku is a strategy applied in a simple form.
How the strategy works?
The indicator will watch two filters from the Ichimoku Cloud indicator. The first one is when the price crosses the cloud (over or under). The second filter is when the conversion line crosses the baseline (over or under). When both filters happen, no matter the order or when the indicator will print an arrow signal.
Buy Signal
A buy signal, or arrow up, will appear when the price crosses over the cloud and when the conversion line crosses over the baseline.
Sell Signal
A sell signal, or arrow down, will appear when the price crosses under the cloud and the conversion line crosses under the baseline.
Exit Points
Show Exit Spots enabled. The indicator will print possible exit spots for the last entry, based on the cross from conversion with baseline. In case the cross is against the latest entry signal, it will show an "X"
One Signal At Time
The indicator will print only one signal in a single direction. It will never print the same signal as the last signal
Exit and Entry Spot At The Same Candle
In the chart, when the entry spot and an exit spot appear in the same candle, the exit spot will appear with a different color. This means that the entry spot is more accurate.
This strategy was designed for scalping, no matter the time frame or market, but it may work for swing traders as well.

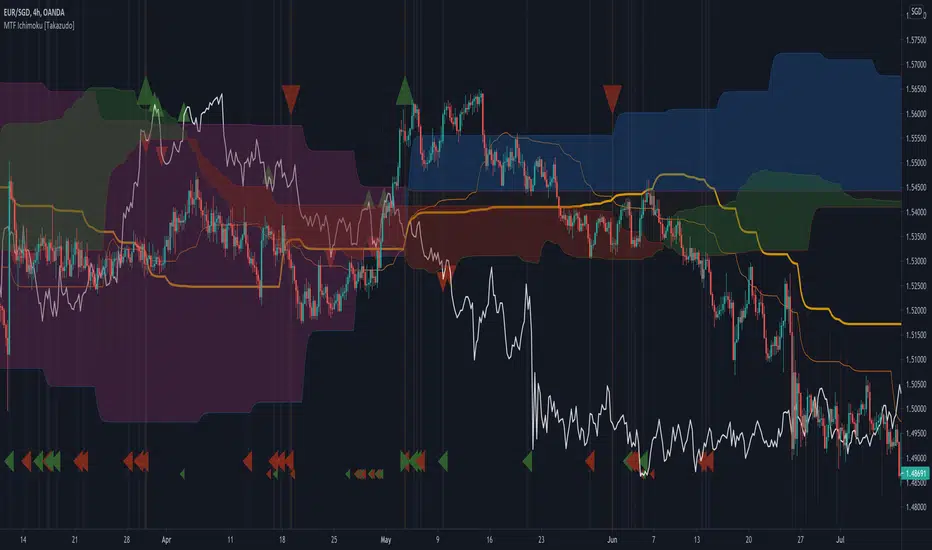
MTF Ichimoku [Takazudo]- A multi time frame Ichimoku with messy hint highlights.
- Most of MTF Ichimoku scripts doesn't handle Chikou-span's place correctly. This script does.
- This script was made to refer the 1day timeframe Ichimoku in lower timeframes.
- I use 1day timeframe mainly. But my entry is always in 4h or 1h timeframe.
OANDA:USDJPY
ICHIMOKU forecast öngörü Hi every Ichimoku Users,
ichimoku is a very useful indicator. It works very well in short periods.İ t helps me define market trends, find entry and follow.
However, it may take a lot of time to calculate which direction the lines will go.( kijun. tenkan and clouds). In the short-term charts, this is not what we want.
I'm sure you said yes.
ichimoku forecast will do this now.
will show us the next 3 candles.
ICHIMOKU FORECAST (öngörü) strengths:
- Forecast future +3 candles will make clouds, tenkan, kijun go!
- Help you indentify easy trend when clouds change, kijun go up or down!
- you can change colors, displacement, hide/show lines in its.
- Flexible and good for every timeframe: W, D, 4H, 1H and shorter.
- Flexible and good for every currencies, gold , future and more.
Test it, watch it, you'll see it works.

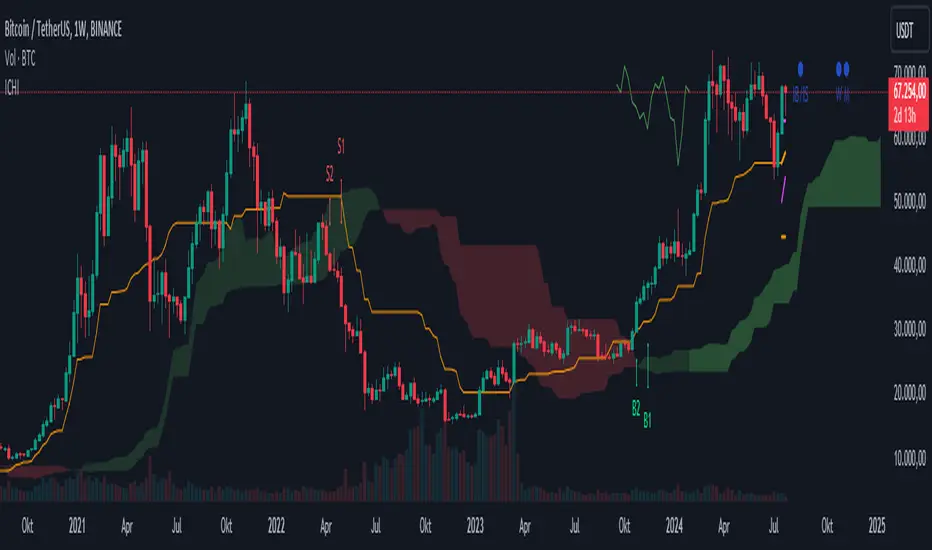
Ichimoku Kinko Hyo + FractalsIn contrast to my Ichimoku ++ Study this is a pure Ichimoku Konko Hyo Study with Bill Williams Fractals (I couldn't leave out the fractals as these levels are too important for Ichimoku trading).
In this study you can find many visualisation options for the Ichimoku Indicator and the signals the Ichimoku Tradingsystem can provide.
Tenkan-sen and Kijun-sen are provided optionally as mtf levels.
An mtf price cloud relationship is shown in the upper right.
The included signals are:
B1/S1 is a strong filtered signal. The condition for long entry is:
price > Kumo AND Chikou > price AND Chikou > Kumo AND Tenkan > Kijun AND Komo is green
B2/S2 is a less filtered signal. The condition for long entry is:
price > Kumo AND Chikou > price AND Tenkan > Kijun
IB/IS is a confluence signal. The condition for a long/short entry is: more than 50% of the 8 defined conditions must trigger a long signal. Below 50% long, it is a short signal because more than 50% of the entry conditions have triggered a short signal.
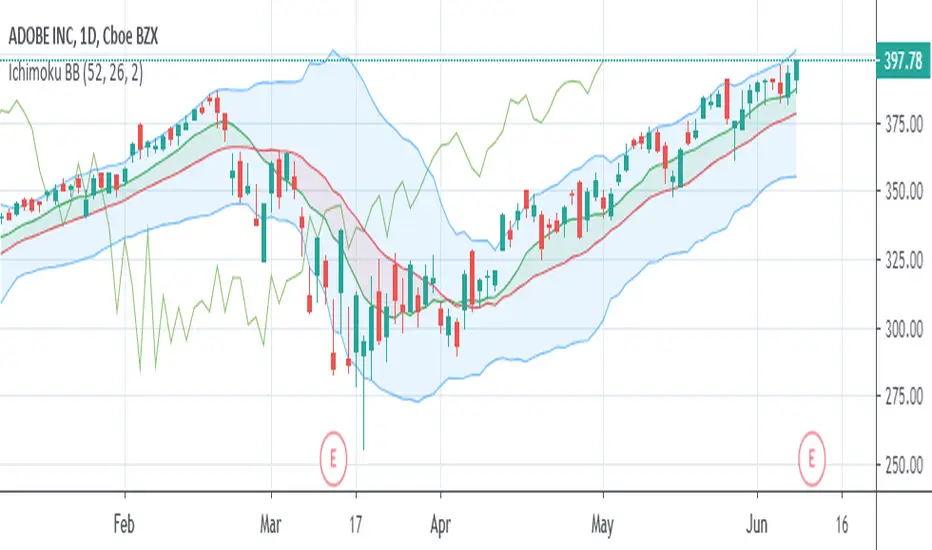
Ichimoku Bollinger BandsThis indicator is a standard set of Bollinger Bands with some functionality borrowed from Ichimoku Kinko Hyo. There's an added SMA (9) that gets shaded green when it's above the basis line of the Bollinger Bands (SMA 20) and turns red when it falls below. No, it's not remotely where the Ichimoku Cloud would appear, but it's a decent trend indicator regardless.
You also get Ichimoku's Lagging Span to help verify the strength of the trend. When the Lagging Span rises above the price history, the trend is up. When the Lagging Span rises above the Bollinger Bands, the uptrend is super strong. And the opposite conditions signal downtrends.
Ichimoku Kinkō hyō Keizen 改MTF善The script is not finnished yet and show's an other interpretation of how it could be scripted
Step -1 is complete... Basic Ichimoku with asjutable length and editable lines colors and visibilities.
Step -2 in progress... Adding ability to une multiple Spans, sens and Kumo on higher and lower timeframe.
Your Step : Like and Share ;) have a good year 2020 !
2020-01-06 /--------/ -R.V.
Jan 06
Release Notes: The script is not finnished yet and show's an other interpretation of how it could be scripted
Step -1 is complete... Basic Ichimoku with asjutable length and editable lines colors and visibilities.
Step -2 in progress... Adding ability to une multiple Spans, sens and Kumo on higher and lower timeframe.
Your Step : Like and Share ;) have a good year 2020 !
2020-01-06 /--------/ -R.V.
Jan 07
Jan 13
Release Notes: MTF Ichimoku is on it's way !!
Jan 17
Release Notes: The script is not finnished yet and show's an interpretation of how it could be scripted
Step -1 is complete... Basic Ichimoku with asjutable length and editable lines colors and visibilities.
Step -2 in complete... Adding ability to use multiple Spans, sens and Kumo on higher timeframe.
Step -3 in progress... Creating a UNIX based function to framgments actual chart periods in subcandles or "Subprices/periods" to plot multiple Spans, sens and Kumo on LOWER timeframe.
Your Step : Like and Share ;) have a good year 2020 !
/--------Coder--------/ -R.V.

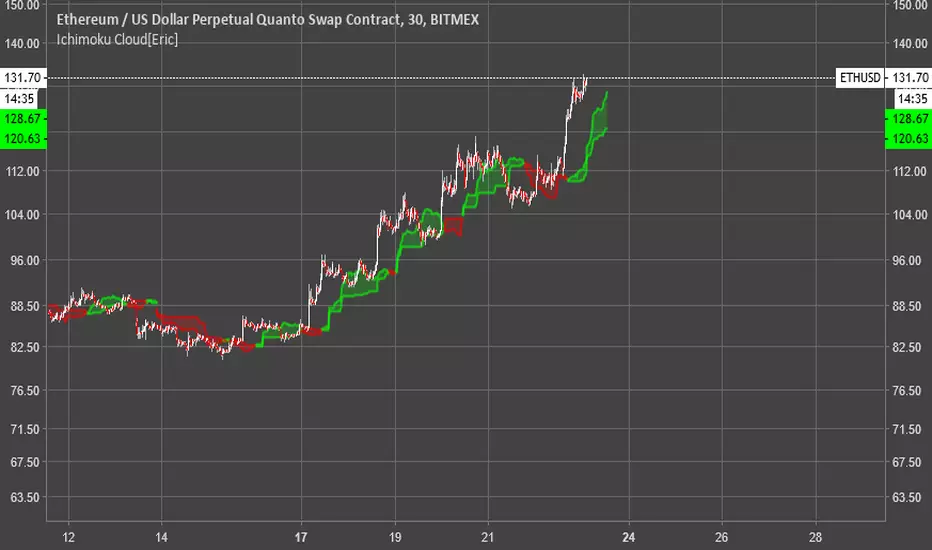
Ichimoku Cloud [Eric]Phase 1: Ichimoku Cloud
Phase 2: Dynamic Ichimoku Cloud
Phase 3: Artificial Intelligence Ichimoku Cloud
Ichimoku Cloud 1H VIPIchimoku dedicated for 1H frame 1H frame 1H frame
High accuracy if you use heikin ashi candles and basic knowledge about ichimoku clouds for analysis when signs appear.

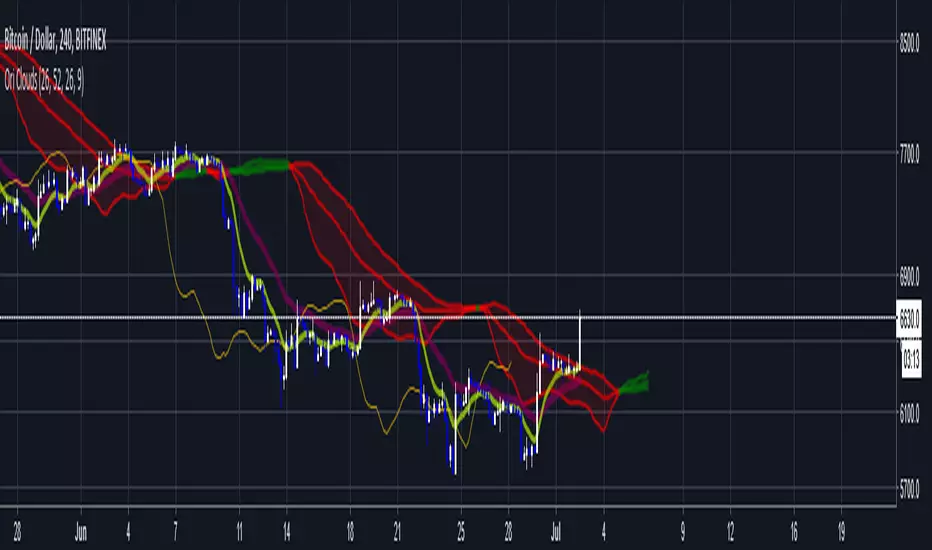
Ori Clouds (Better Ichimoku)Logic is similar to ichimoku . Last cloud color is also important for trend confirmation. Cloud lines important. There is a 3 line cloud which is different from ichimoku .
Logic is same but all calculations are different from ichimoku so be careful this is not the same indicator.
Here is classic Ichimoku for comparison