Vervoort Heiken-Ashi LongTerm Candlestick Oscillator [LazyBear]HACOLT (Heikin Ashi Candles Oscillator Long Term) is a technical indicator designed by Sylvain Vervoort. It is based on Mr.Vervoort's other indicator, HACO (Heikin-Ashi Candles Oscillator - posted here: ).
Optimized for long-term trading, HACOLT shows three levels: -1, 0 and 1. These levels suggest "an open short position", "no open position", and "an open long position", respectively. Passing from a certain level to another is viewed as a trading signal:
- Rising from -1 or 0 to 1 suggests a Long Entry and Short exit;
- Falling from 1 to 0 or -1 suggests a Long Exit;
- Falling from 1 or 0 to -1 indicates a Short Entry.
Fits in nicely with any trading setup as a confirmation indicator
More info:
- tlc.thinkorswim.com
- www.motivewave.com
List of my other indicators:
- GDoc: docs.google.com
- Chart:
חפש סקריפטים עבור "indicator"

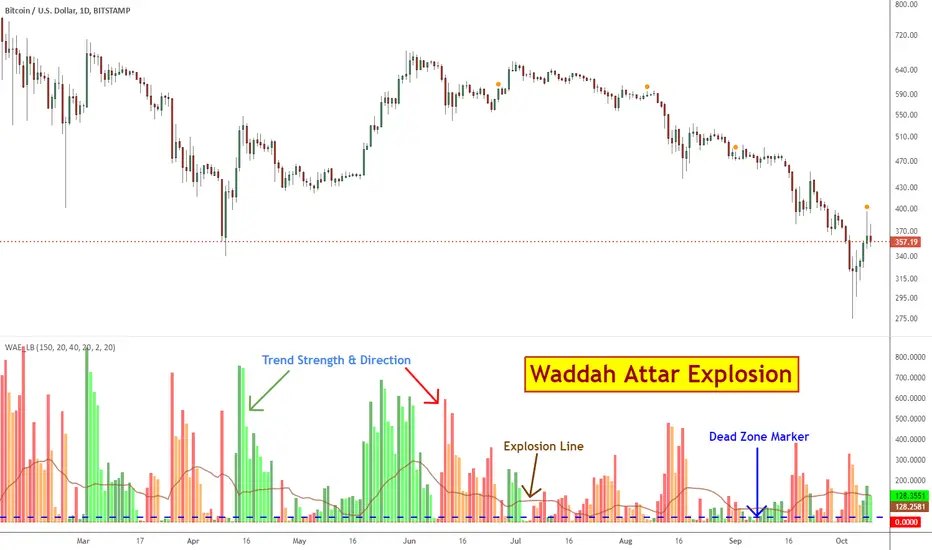
Waddah Attar Explosion [LazyBear]This is a port of a famous MT4 indicator, as requested by user @maximus71. This indicator uses MACD/BB to track trend direction and strength. Author suggests using this indicator on 30mins.
Explanation from the indicator developer:
"Various components of the indicator are:
Dead Zone Line: Works as a filter for weak signals. Do not trade when the red or green histogram is below it.
Histograms:
- Red histogram shows the current down trend.
- Green histogram shows the current up trend.
- Sienna line shows the explosion in price up or down.
Signal for ENTER_BUY: All the following conditions must be met.
- Green histo is raising.
- Green histo above Explosion line.
- Explosion line raising.
- Both green histo and Explosion line above DeadZone line.
Signal for EXIT_BUY: Exit when green histo crosses below Explosion line.
Signal for ENTER_SELL: All the following conditions must be met.
- Red histo is raising.
- Red histo above Explosion line.
- Explosion line raising.
- Both red histo and Explosion line above DeadZone line.
Signal for EXIT_SELL: Exit when red histo crosses below Explosion line. "
All of the parameters are configurable via options page. You may have to tune it for your instrument.
More info:
Author note: www.forex-tsd.com
Video (French): www.youtube.com
List of my other indicators:
- GDoc: docs.google.com
- Chart:
Earnings S/R Levels [LazyBear]These levels are based on price around earnings day. I have implemented support for 2 calculation modes:
Mode 1: Level = (low of 1 day prior to earnings + high of 1 day after earnings) / 2.0
Mode 2: Level = (hl2 of 1 day prior to earnings + hl2 of 1 day after earnings + close from earnings day) / 3.0
Chart above shows "Mode 1". Mode can be changed via options page.
This indicator was requested by user @mika2k1ff. I learnt more about this idea from @DanV and @TimWest (Thanks guys :)). BTW, TimWest has an indicators package, "Key Hidden Levels", that has this and more.
Do let me know how you use this, I am very intrigued by the potential this idea shows. Thanks.
For a complete list of my indicators:
- GDoc: docs.google.com
- Chart:

BE-Indicator Aggregator toolkit█ Overview:
BE-Indicator Aggregator toolkit is a toolkit which is built for those we rely on taking multi-confirmation from different indicators available with the traders. This Toolkit aid's traders in understanding their custom logic for their trade setups and provides the summarized results on how it performed over the past.
█ How It Works:
Load the external indicator plots in the indicator input setting
Provide your custom logic for the trade setup
Set your expected SL & TP values
█ Legends, Definitions & Logic Building Rules:
Building the logic for your trade setup plays a pivotal role in the toolkit, it shall be broken into parts and toolkit aims to understand each of the logical parts of your setup and interpret the outcome as trade accuracy.
Toolkit broadly aims to understand 4 types of inputs in "Condition Builder"
Comments : Line which starts with single quotation ( ' ) shall be ignored by toolkit while understanding the logic.
Note: Blank line space or less than 3 characters are treated equally to comments.
Long Condition: Line which starts with " L- " shall be considered for identifying Long setups.
Short Condition: Line which starts with " S- " shall be considered for identifying Short setups.
Variables: Line which starts with " VAR- " shall be considered as variables. Variables can be one such criteria for Long or short condition.
Building Rules: Define all variables first then specify the condition. The usual declare and assign concept of programming. :p)
Criteria Rules: Criteria are individual logic for your one parent condition. multiple criteria can be present in one condition. Each parameter should be delimited with ' | ' key and each criteria should be delimited with ' , ' (Comma with a space - IMPORTANT!!!)
█ Sample Codes for Conditional Builder:
For Trading Long when Open = Low
For Trading Short when Open = High with a Red candle
'Long Setup <---- Comment
L-O|E|L
' E <- in the above line refers to Equals ' = '
'Short Setup
S-AND:O|E|H, O|G|C
' 2 Criteria for used building one condition. Since, both have to satisfied used "AND:" logic.
Understanding of Operator Legends:
"E" => Refers to Equals
"NE" => Refers to Not Equals
"NEOR" => Logical value is Either Comparing value 1 or Comparing value 2
"NEAND" => Logical value is Comparing value 1 And Comparing value 2
"G" => Logical value Greater than Comparing value 1
"GE" => Logical value Greater than and equal to Comparing value 1
"L" => Logical value Lesser than Comparing value 1
"LE" => Logical value Lesser than and equal to Comparing value 1
"B" => Logical value is Between Comparing value 1 & Comparing value 2
"BE" => Logical value is Between or Equal to Comparing value 1 & Comparing value 2
"OSE" => Logical value is Outside of Comparing value 1 & Comparing value 2
"OSI" => Logical value is Outside or Equal to Comparing value 1 & Comparing value 2
"ERR" => Logical value is 'na'
"NERR" => Logical value is not 'na'
"CO" => Logical value Crossed Over Comparing value 1
"CU" => Logical value Crossed Under Comparing value 1
Understanding of Condition Legends:
AND: -> All criteria's to be satisfied for the condition to be True.
NAND: -> Output of AND condition shall be Inversed for the condition to be True.
OR: -> One of criteria to be satisfied for the condition to be True.
NOR: -> Output of OR condition shall be Inversed for the condition to be True.
ATLEAST:X: -> At-least X no of criteria to be satisfied for the condition to be True.
Note: "X" can be any number
NATLEAST:X: -> Output of ATLEAST condition shall be Inversed for the condition to be True
WASTRUE:X: -> Single criteria WAS TRUE within X bar in past for the condition to be True.
Note: "X" can be any number.
ISTRUE:X: -> Single criteria is TRUE since X bar in past for the condition to be True.
Note: "X" can be any number.
Understanding of Variable Legends:
While Condition Supports 8 Types, Variable supports only 6 Types listed below
AND: -> All criteria's to be satisfied for the Variable to be True.
NAND: -> Output of AND condition shall be Inversed for the Variable to be True.
OR: -> One of criteria to be satisfied for the Variable to be True.
NOR: -> Output of OR condition shall be Inversed for the Variable to be True.
ATLEAST:X: -> At-least X no of criteria to be satisfied for the Variable to be True.
Note: "X" can be any number
NATLEAST:X: -> Output of ATLEAST condition shall be Inversed for the Variable to be True
█ Sample Outputs with Logics:
1. RSI Indicator + Technical Indicator: StopLoss: 2.25 against Reward ratio of 1.75 (3.94 value)
Plots Used in Indicator Settings:
Source 1:- RSI
Source 2:- RSI Based MA
Source 3:- Strong Buy
Source 4:- Strong Sell
Logic Used:
For Long Setup : RSI Should be above RSI Based MA, RSI has been Rising when compared to 3 candles ago, Technical Indicator signaled for a Strong Buy on the current candle, however in last 6 candles Technical indicator signaled for Strong Sell.
Similarly Inverse for Short Setup.
L-AND:ES1|GE|ES2, ES1|G|ES1
L-ES3|E|1
L-OR:ES4 |E|1, ES4 |E|1, ES4 |E|1, ES4 |E|1, ES4 |E|1, ES4 |E|1
S-AND:ES1|LE|ES2, ES1|L|ES1
S-ES4|E|1
S-OR:ES3 |E|1, ES3 |E|1, ES3 |E|1, ES3 |E|1, ES3 |E|1, ES3 |E|1
'Note: Last OR condition can also be written by using WASTRUE definition like below
'L-WASTRUE:6:ES4|E|1
'S-WASTRUE:6:ES3|E|1
Output:
2. Volumatic Support / Resistance Levels :
Plots Used in Indicator Settings:
Source 1:- Resistance
Source 2:- Support
Logic Used:
For Long Setup : Long Trade on Liquidity Support.
For Short Setup : Short Trade on Liquidity Resistance.
'Variable Named "ChkLowTradingAbvSupport" is declared to check if last 3 candles is trading above support line of liquidity.
VAR-ChkLowTradingAbvSupport:AND:L|G|ES2, L |G|ES2, L |G|ES2
'Variable Named "ChkCurBarClsdAbv4thBarHigh" is declared to check if current bar closed above the high of previous candle where the Liquidity support is taken (4th Bar).
VAR-ChkCurBarClsdAbv4thBarHigh:OR:C|GE|H , L|G|H
'Combining Condition and Variable to Initiate Long Trade Logic
L-L |LE|ES2
L-AND:ChkLowTradingAbvSupport, ChkCurBarClsdAbv4thBarHigh
VAR-ChkHghTradingBlwRes:AND:H|L|ES1, H |L|ES1, H |L|ES1
VAR-ChkCurBarClsdBlw4thBarLow:OR:C|LE|L , H|L|L
S-H |GE|ES1
S-AND:ChkHghTradingBlwRes, ChkCurBarClsdBlw4thBarLow
Output 1: Day Trading Version
Output 2: Scalper Version
Output 3: Position Version

Session Breakouts & Trend Indicator# Session Breakouts & Trend Indicator
This indicator identifies high-probability trading opportunities by tracking key intraday sessions and their breakouts while aligning them with the overall market trend direction.
## What Makes This Indicator Unique
Unlike standard breakout indicators that only identify when price crosses a threshold, this indicator:
- Dynamically identifies and tracks important daily sessions (default: AM 09:00-10:00 and PM 15:00-16:00)
- Determines trend direction using a triple EMA system (20/50/200)
- Shows when breakouts align with the overall trend (higher probability setups)
- Provides visual confirmation with session ranges, breakout levels, and background highlighting
- Includes a comprehensive information panel showing trend/session alignment
## How It Works
The indicator tracks two important daily sessions:
1. **AM Session**: Typically the first hour of trading (default: 09:00-10:00)
2. **PM Session**: Typically the last hour of trading (default: 15:00-16:00)
For each session, it:
- Marks the high and low range
- Establishes breakout levels above/below these ranges
- Detects when price breaks beyond these levels
- Determines if the breakout aligns with the prevailing trend
The trend is calculated using three EMAs (20, 50, 200) for reliable trend identification.
## How To Use
1. Apply the indicator to your chart (works best on 5-minute timeframes)
2. Adjust session times to match your trading schedule if needed
3. Watch for breakouts above session highs (bullish) or below session lows (bearish)
4. Check the information panel to see if the breakout aligns with the trend
5. Enter trades in the direction of trend-aligned breakouts for higher probability setups
6. Set stop losses below the opposite side of the session range
## Settings
- **Session Times**: Customize AM and PM session times
- **EMA Lengths**: Adjust trend determination sensitivity
- **Visualization Options**: Toggle display of sessions, breakouts, and VWAP
- **Alert Settings**: Configure alerts for breakouts and trend-aligned conditions
This indicator is valuable for day traders and swing traders looking for objective entry points with higher probability of success.

RSI Full [Titans_Invest]RSI Full
One of the most complete RSI indicators on the market.
While maintaining the classic RSI foundation, our indicator integrates multiple entry conditions to generate more accurate buy and sell signals.
All conditions are fully configurable, allowing complete customization to fit your trading strategy.
⯁ WHAT IS THE RSI❓
The Relative Strength Index (RSI) is a technical analysis indicator developed by J. Welles Wilder. It measures the magnitude of recent price movements to evaluate overbought or oversold conditions in a market. The RSI is an oscillator that ranges from 0 to 100 and is commonly used to identify potential reversal points, as well as the strength of a trend.
⯁ HOW TO USE THE RSI❓
The RSI is calculated based on average gains and losses over a specified period (usually 14 periods). It is plotted on a scale from 0 to 100 and includes three main zones:
Overbought: When the RSI is above 70, indicating that the asset may be overbought.
Oversold: When the RSI is below 30, indicating that the asset may be oversold.
Neutral Zone: Between 30 and 70, where there is no clear signal of overbought or oversold conditions.
⯁ ENTRY CONDITIONS
The conditions below are fully flexible and allow for complete customization of the signal.
______________________________________________________
🔹 CONDITIONS TO BUY 📈
______________________________________________________
• Signal Validity: The signal will remain valid for X bars .
• Signal Sequence: Configurable as AND/OR .
📈 RSI Conditions:
🔹 RSI > Upper
🔹 RSI < Upper
🔹 RSI > Lower
🔹 RSI < Lower
🔹 RSI > Middle
🔹 RSI < Middle
🔹 RSI > MA
🔹 RSI < MA
📈 MA Conditions:
🔹 MA > Upper
🔹 MA < Upper
🔹 MA > Lower
🔹 MA < Lower
📈 Crossovers:
🔹 RSI (Crossover) Upper
🔹 RSI (Crossunder) Upper
🔹 RSI (Crossover) Lower
🔹 RSI (Crossunder) Lower
🔹 RSI (Crossover) Middle
🔹 RSI (Crossunder) Middle
🔹 RSI (Crossover) MA
🔹 RSI (Crossunder) MA
🔹 MA (Crossover) Upper
🔹 MA (Crossunder) Upper
🔹 MA (Crossover) Lower
🔹 MA (Crossunder) Lower
📈 RSI Divergences:
🔹 RSI Divergence Bull
🔹 RSI Divergence Bear
______________________________________________________
______________________________________________________
🔸 CONDITIONS TO SELL 📉
______________________________________________________
• Signal Validity: The signal will remain valid for X bars .
• Signal Sequence: Configurable as AND/OR .
📉 RSI Conditions:
🔸 RSI > Upper
🔸 RSI < Upper
🔸 RSI > Lower
🔸 RSI < Lower
🔸 RSI > Middle
🔸 RSI < Middle
🔸 RSI > MA
🔸 RSI < MA
📉 MA Conditions:
🔸 MA > Upper
🔸 MA < Upper
🔸 MA > Lower
🔸 MA < Lower
📉 Crossovers:
🔸 RSI (Crossover) Upper
🔸 RSI (Crossunder) Upper
🔸 RSI (Crossover) Lower
🔸 RSI (Crossunder) Lower
🔸 RSI (Crossover) Middle
🔸 RSI (Crossunder) Middle
🔸 RSI (Crossover) MA
🔸 RSI (Crossunder) MA
🔸 MA (Crossover) Upper
🔸 MA (Crossunder) Upper
🔸 MA (Crossover) Lower
🔸 MA (Crossunder) Lower
📉 RSI Divergences:
🔸 RSI Divergence Bull
🔸 RSI Divergence Bear
______________________________________________________
______________________________________________________
🤖 AUTOMATION 🤖
• You can automate the BUY and SELL signals of this indicator.
______________________________________________________
______________________________________________________
⯁ UNIQUE FEATURES
______________________________________________________
Signal Validity: The signal will remain valid for X bars
Signal Sequence: Configurable as AND/OR
Condition Table: BUY/SELL
Condition Labels: BUY/SELL
Plot Labels in the Graph Above: BUY/SELL
Automate and Monitor Signals/Alerts: BUY/SELL
Signal Validity: The signal will remain valid for X bars
Signal Sequence: Configurable as AND/OR
Condition Table: BUY/SELL
Condition Labels: BUY/SELL
Plot Labels in the Graph Above: BUY/SELL
Automate and Monitor Signals/Alerts: BUY/SELL
______________________________________________________
📜 SCRIPT : RSI Full
🎴 Art by : @Titans_Invest & @DiFlip
👨💻 Dev by : @Titans_Invest & @DiFlip
🎑 Titans Invest — The Wizards Without Gloves 🧤
✨ Enjoy the Spell!
______________________________________________________
o Mission 🗺
• Inspire Traders to manifest Magic in the Market.
o Vision 𐓏
• To elevate collective Energy 𐓷𐓏

Regime Filter IndicatorRegime Filter – Crypto Market Trend Indicator
📊 Overview
The Regime Filter is a powerful market analysis indicator designed specifically for crypto trading. It helps traders identify whether the market is in a bullish or bearish phase by analyzing key assets in the cryptocurrency market, including Bitcoin (BTC), Bitcoin Dominance (BTC.D), and the Altcoin Market (TOTAL3). The indicator compares these assets against their respective Simple Moving Averages (SMA) to determine the overall market regime, allowing traders to make more informed decisions.
🔍 How It Works
The Regime Filter evaluates three main components to determine the market's sentiment:
1. BTC Dominance (BTC.D) vs. 40 SMA (Medium Timeframe)
The Bitcoin Dominance (BTC.D) is compared to its 40-period SMA on a mid-timeframe (e.g.,
1-hour). If BTC.D is below the 40 SMA, it indicates that altcoins are performing well relative
to Bitcoin, suggesting a bullish altcoin market. If BTC.D is above the 40 SMA, Bitcoin is
gaining dominance, indicating a potential bearish phase for altcoins.
2. TOTAL3 Market Cap vs. 100 SMA (Medium Timeframe)
The TOTAL3 index, which tracks the total market capitalization of all cryptocurrencies except
Bitcoin and Ethereum, is compared to its 100-period SMA. A bullish signal occurs when TOTAL3
is above the 100 SMA, indicating strength in altcoins, while a bearish signal occurs when
TOTAL3 is below the 100 SMA, signaling a potential weakness in the altcoin market.
3. BTC Price vs. 200 SMA (Higher Timeframe)
The current Bitcoin price is compared to its 200-period Simple Moving Average (SMA) on a
higher timeframe (e.g., 4-hour). A bullish signal is given when the BTC price is above the 200
SMA, and a bearish signal when it's below.
🟢 Bullish Market Conditions
The market is considered bullish when:
- BTC Dominance (BTC.D) is below the 40 SMA, suggesting altcoins are gaining momentum.
- TOTAL3 Market Cap is above the 100 SMA, signaling strength in the altcoin market.
- BTC price is above the 200 SMA, indicating an uptrend in Bitcoin.
In these conditions, the background turns green 🟢, and a "Bullish" label is displayed on the chart.
🔴 Bearish Market Conditions
The market is considered bearish when:
- BTC Dominance (BTC.D) is above the 40 SMA, indicating Bitcoin is outperforming altcoins.
- TOTAL3 Market Cap is below the 100 SMA, signaling weakness in altcoins.
- BTC price is below the 200 SMA, indicating a downtrend in Bitcoin.
In these conditions, the background turns red 🔴, and a "Bearish" label appears on the chart.
⚙ Customization Options
- The Regime Filter offers flexibility for traders:
- Enable or Disable Specific SMAs: Customize the indicator by enabling or disabling the 200 SMA for Bitcoin, the 40 SMA for BTC Dominance, and the 100 SMA for TOTAL3.
- Adjust Timeframes: Choose the timeframes for each of the moving averages to suit your preferred trading strategy.
- Real-Time Data Adjustments: The indicator updates in real-time to reflect current market conditions, ensuring timely analysis.
📈 Best Use Cases
- Trend Confirmation: The Regime Filter is ideal for confirming the market's overall trend,
helping traders to align their positions with the dominant market sentiment.
- Trade Entry/Exit Signals: Use the indicator to identify favorable entry or exit points based on
whether the market is in a bullish or bearish phase.
- Market Overview: Gain a quick understanding of the broader crypto market, with a focus on
Bitcoin and altcoins, to make more strategic decisions.
⚠️ Important Notes
Trend-Following Indicator: The Regime Filter is a trend-following tool, meaning it works best in strong trending markets. It may not perform well in choppy, sideways markets.
Risk Management: This indicator is designed to assist in identifying market trends, but it does not guarantee profits. Always apply sound risk management strategies and use additional indicators when making trading decisions.
Not a Profit Guarantee: While this indicator can help identify potential market trends, no trading tool or strategy guarantees profits. Please trade responsibly and ensure that your decisions are based on comprehensive analysis and risk tolerance.

Combined Support & Resistance IndicatorsPivot Points Calculation:
The script calculates the Pivot Point as the average of the high price (high), low price (low), and closing price (close) of the current bar.
The Pivot Point is plotted on the chart as a red line.
Support and Resistance Levels:
The Support Level is calculated as the lowest price over the last lookback bars.
The Resistance Level is calculated as the highest price over the last lookback bars.
These levels are displayed on the chart using horizontal lines: green for support and red for resistance.
Momentum Indicators:
RSI (Relative Strength Index): A momentum oscillator calculated based on the closing price over the last 14 bars. It is plotted as a yellow line.
MACD (Moving Average Convergence Divergence): An indicator consisting of the MACD line (blue) and the signal line (orange). It is calculated based on the closing price.
Moving Averages:
SMA 20: A simple moving average over the last 20 bars. It is plotted as a green line.
SMA 50: A simple moving average over the last 50 bars. It is plotted as a red line.
Dynamic Levels Drawing:
Instead of using hline (which does not support dynamic values), the script uses line.new to draw dynamic support and resistance levels. These lines are updated on each bar.

Multi Stochastic AlertHello Everyone,
I have created a Multi Stochastic Alert based on Scalping Strategy
The Strategy uses below 4 Stochastic indicator:
1. Stochastic (9,3)
2. Stochastic (14,3)
3. Stochastic (40,4)
4. Stochastic (60,10)
Trade entry become active when all of these goes below 20 or above 80, In this indicator you don't need to use all 4, this will show red and green background whenever all of them goes below 20 or above 80.
As shown in picture below, it works better when script is making a channel, Our indicator shows green or red signal, we wait for RSI Divergence and we enter. We book when blue line (9,3) goes above 80, as shown by arrow, and trail rest at breakeven or your own trailing method
Same Situation shown for Short side. We book 50% when Blue line (9,3) Goes below 20 and trail rest at breakeven or your own trailing method
Happy trading, Let me know if any improvements required.

Enhanced Cumulative Volume Delta + MAThe Enhanced Cumulative Volume Delta (CVD) indicator is designed to help traders analyze the cumulative buying and selling pressure in the market by examining the delta between the up and down volume. By tracking this metric, traders can gain insights into the strength of a trend and potential reversals. This indicator uses advanced volume analysis combined with customizable moving averages to provide a more detailed view of market dynamics.
How to Use This Indicator:
Volume Delta Visualization:
The indicator plots the cumulative volume delta (CVD) using color-coded candles, where teal represents positive delta (buying pressure) and soft red represents negative delta (selling pressure).
Moving Averages:
Use the moving averages to smooth the CVD data and identify long-term trends. You can choose between SMA and EMA for each of the three available moving averages. The first and third moving averages are typically used for short-term and long-term trend analysis, respectively, while the second moving average can serve as a medium-term filter.
Arrow Markers:
The indicator will display arrows (green triangle up for crossing above, red triangle down for crossing below) when the CVD volume crosses the 3rd moving average. You can control the visibility of these arrows through the input parameters.
Volume Data:
The indicator provides error handling in case no volume data is available for the selected symbol, ensuring that you're not misled by incomplete data.
Practical Applications:
Trend Confirmation: Use the CVD and moving averages to confirm the overall trend direction and strength. Positive delta and a rising CVD can confirm an uptrend, while negative delta and a falling CVD indicate a downtrend.
Volume Breakouts: The arrows marking when the CVD crosses the 3rd moving average can help you spot potential volume breakouts or reversals, making them useful for entry or exit signals.
Volume Divergence: Pay attention to divergences between price and CVD, as these can often signal potential trend reversals or weakening momentum.

Logarithmic IndicatorThis logarithmic indicator does the following:
It calculates the logarithm of the chosen price (default is close price) using a user-defined base (default is 10).
It then calculates a Simple Moving Average (SMA) of the logarithmic values.
Both the logarithmic value and its SMA are plotted on the chart.
To improve visibility, it also plots an upper and lower band based on the highest and lowest values over the last 100 periods.
To use this indicator:
Open the TradingView Pine Editor.
Paste the code into the editor.
Click "Add to Chart" or "Save" to apply the indicator to your chart.
Adjust the input parameters in the indicator settings as needed.
You can customize this indicator further by:
Changing the color scheme
Adding more moving averages or other technical indicators
Implementing alerts based on crossovers or other conditions
Remember, logarithmic scales are often used in finance to visualize data that spans several orders of magnitude, making it easier to see percentage changes over time.

COT Report Indicator with Selectable Data TypeOverview
The COT Report Indicator with Selectable Data Types is a powerful tool for traders who want to gain deeper insights into market sentiment using the Commitment of Traders (COT) data. This indicator allows you to visualize the net positions of different participant categories—Commercial, Noncommercial, and Nonreportable—directly on your chart.
The indicator is fully customizable, allowing you to select the type of data to display, sync with your chart's timeframe, or choose a custom timeframe. Whether you're analyzing gold, crude oil, indices, or forex pairs, this indicator adapts seamlessly to your trading needs.
Features
Dynamic Data Selection:
Choose between Commercial, Noncommercial, or Nonreportable data types.
Analyze the net positions of market participants for more informed decision-making.
Flexible Timeframes:
Sync with the chart's timeframe for quick analysis.
Select a custom timeframe to view COT data at your preferred granularity.
Wide Asset Coverage:
Supports various assets, including gold, silver, crude oil, indices, and forex pairs.
Automatically adjusts to the ticker you're analyzing.
Clear Visual Representation:
Displays Net Long, Net Short, and Net Difference (Long - Short) positions with distinct colors for easy interpretation.
Error Handling:
Alerts you if the symbol is unsupported, ensuring you know when COT data isn't available for a specific asset.
How to Use
Add the Indicator:
Click "Indicators" in TradingView and search for "COT Report Indicator with Selectable Data Types."
Add it to your chart.
Customize the Settings:
Data Type: Choose between Commercial, Noncommercial, or Nonreportable positions.
Data Source: Select "Futures Only" or "Futures and Options."
Timeframe: Sync with the chart's timeframe or specify a custom one (e.g., weekly, monthly).
Interpret the Data:
Green Line: Net Long Positions.
Red Line: Net Short Positions.
Black Line: Net Difference (Long - Short).
Supported Symbols:
Gold, Silver, Crude Oil, Natural Gas, Forex Pairs, S&P 500, US30, NAS100, and more.
Who Can Benefit
Trend Followers: Identify the buying/selling trends of Commercial and Noncommercial participants.
Sentiment Analysts: Understand shifts in sentiment among major market players.
Long-Term Traders: Use COT data to confirm or contradict your fundamental analysis.
Example Use Case
For example, if you're trading gold (XAUUSD) and select Noncommercial Positions, you’ll see the long and short positions of speculators. An increase in net long positions may signal bullish sentiment, while an increase in net short positions may indicate bearish sentiment.
If you switch to Commercial Positions, you'll get insights into how hedgers and institutions are positioning themselves, helping you confirm or counterbalance your current trading strategy.
Limitations
The indicator only works with supported symbols (COT data availability is limited to specific assets).
The COT data is updated weekly, so it is not suitable for short-term intraday trading.

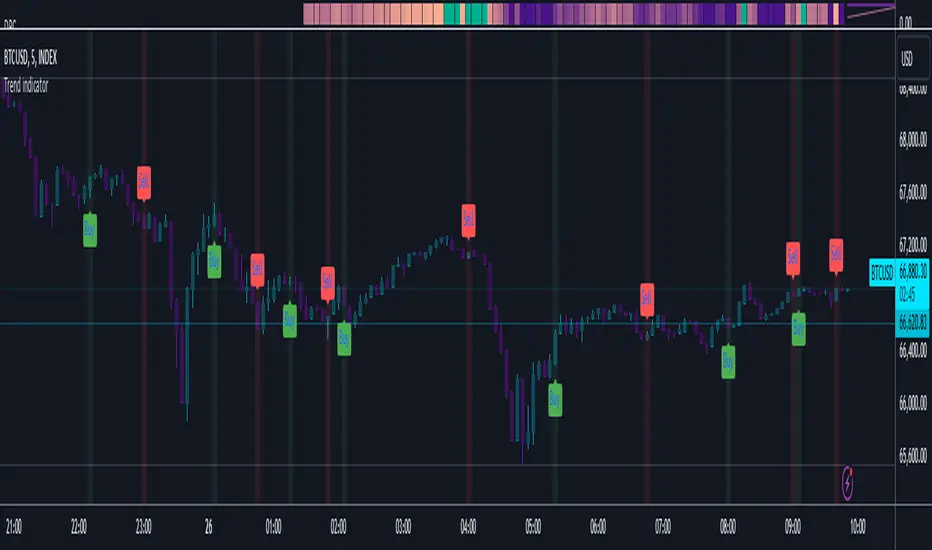
Trend indicatorThe Trend Indicator script is a custom oscillator-based tool designed for identifying potential entry and exit points in the market. Using a combination of Exponential Moving Average (EMA) and Relative Moving Average (RMA) calculations, it captures the trend direction and signals market momentum shifts. The indicator visually presents buy and sell signals and color-codes background conditions based on potential trend reversals, offering a clear and structured approach for trend-based trading strategies.
Key Components
1. User Inputs
Smoothing Length (smoothLength): The script allows the trader to input a smoothing length for adjusting the EMA and RMA calculations. This parameter fine-tunes the indicator's sensitivity to price movements, where lower values result in a more responsive oscillator, while higher values make it smoother and less reactive to minor fluctuations.
Source (source): This is the price data input for the script, defaulting to the close price but customizable to other price points (e.g., open, high, or low) based on user preference.
2. Smoothed Price Calculation
Using an Exponential Moving Average (EMA), the script smooths the selected source price to reduce noise and make trends clearer. The EMA’s calculation length is determined by the smoothLength input, and this moving average forms the baseline from which other components derive.
3. Oscillator Calculation
The oscillator value represents the relative strength or weakness of price momentum. Here, the oscillator is computed using Relative Moving Average (RMA), applied to the difference between the smoothed price and the SMA of the source price. The RMA further filters short-term fluctuations to identify the core trend direction.
This oscillator measures the divergence between the smoothed price and the SMA, providing insight into whether the market is experiencing bullish or bearish pressure.
4. Signal Line
The Signal Line is a Simple Moving Average (SMA) of the oscillator, using the same smoothLength parameter. The SMA smooths the oscillator’s values, offering a secondary reference that traders can use to identify changes in momentum when it crosses the oscillator line.
5. Buy and Sell Signals
Buy Signal (bullSignal): The script triggers a buy signal when the oscillator crosses above zero. This indicates that momentum may be shifting in favor of buyers, potentially signaling an uptrend.
Sell Signal (bearSignal): The script triggers a sell signal when the oscillator crosses below zero, suggesting a shift in momentum to the downside, potentially initiating a downtrend.
Visualization
1. Plotting the Oscillator and Signal Line
The oscillator line is plotted in blue, representing the current momentum of the price. The signal line, plotted in red, serves as a smoother baseline.
When the oscillator crosses the signal line, it hints at a potential trend shift, which can be a signal for cautious traders to pay attention to trend reversals.
2. Buy/Sell Signal Markers
Buy Signal Marker: A green label appears below the bar whenever the oscillator crosses above zero, indicating a potential buying opportunity.
Sell Signal Marker: A red label appears above the bar whenever the oscillator crosses below zero, marking a potential selling opportunity.
These visual cues make it easy for traders to spot signals directly on the chart without needing to watch the oscillator values closely.
3. Background Coloring for Trend Direction
To further aid in trend identification, the background color changes to green when a bullish signal is active and red during bearish signals. This coloring helps visually reinforce the current trend direction, allowing traders to spot prolonged uptrends or downtrends easily.
Trading Strategy Suggestions
This indicator can be adapted to various trading strategies. Here are a few practical suggestions:
Trend-Following Strategy:
When the oscillator crosses above zero (green background), it could indicate the start of a potential uptrend. Consider entering a long position on this signal and holding it until the oscillator crosses back below zero.
Conversely, a cross below zero (red background) may signal a downtrend, making it suitable for short positions or exiting long trades.
Cross-Confirmation with Signal Line:
Use the crossover of the oscillator and signal line to confirm trends. For example, when the oscillator is above zero and crosses above the signal line, it could reinforce a strong buy signal. Similarly, a cross below the signal line when the oscillator is below zero could strengthen a sell signal.
Combining with Other Indicators:
For added accuracy, combine this indicator with other trend-confirming tools like Moving Averages or Bollinger Bands to confirm the validity of buy/sell signals.
Risk Management:
Always set stop-losses below recent lows in uptrends or above recent highs in downtrends. This indicator is useful for entry and exit points but should always be paired with solid risk management practices.
The Trend Indicator is a comprehensive tool for identifying market momentum and potential reversal points. By smoothing out price data and using an oscillator to track momentum shifts, it offers traders a structured approach to trading trends. Its built-in buy/sell markers and background coloring make it visually accessible and easy to interpret at a glance. However, as with any indicator, it's most effective when combined with other strategies and a disciplined approach to risk management.
TechniTrend: Trend and Volume Indicator🟪 Overview
The "TechniTrend: Trend and Volume Indicator" is designed to assist traders in identifying optimal entry and exit points in the market by combining trend detection and volume analysis. This indicator integrates moving average-based trend recognition with volume threshold analysis to provide clear buy and sell signals. Additionally, it includes divergence filtering and correlation analysis to enhance the accuracy of signals, making it suitable for traders who want to identify strong trends and high-probability trading opportunities.
🟪 Indicator Components
🔹Trend Moving Average (MA):
The indicator calculates a moving average based on the closing prices to identify the overall trend. Various moving average types are available for customization:
Simple Moving Average (SMA)
Exponential Moving Average (EMA)
Weighted Moving Average (WMA)
Hull Moving Average (HMA)
The length of the moving average can be adjusted via the Trend MA Length input to adapt to different market conditions.
🔹Volume Analysis:
A volume moving average is calculated over a specified period (Volume MA Length), with a volume threshold derived by multiplying this average by a user-defined Volume Threshold Factor.
This threshold helps to classify volume as either high or low, which plays a crucial role in signal generation.
🔹Divergence Detection:
The indicator can filter out signals when there is a divergence between the price movement and volume changes. Divergence occurs when the price moves in one direction while the volume moves in the opposite direction, indicating a potential weakening of the trend.
🔹Correlation Analysis:
The correlation between price and volume changes is calculated over the same length as the trend moving average. The user can enable this filter to ensure that buy or sell signals are only generated when the correlation exceeds a specified threshold (Correlation Threshold).
🟪 Signals and Alerts
🔹Buy Signal: Generated when the price is above the trend moving average (indicating an uptrend), and the current volume exceeds the volume threshold (indicating high volume). The signal can be filtered based on divergence or correlation settings.
🔹Sell Signal: Triggered when the price is below the trend moving average (indicating a downtrend), and the volume is above the threshold. Similarly, the signal is affected by divergence and correlation filters.
🔹Visual Indicators:
The trend line is plotted on the chart for easy trend identification.
Buy and sell signals are displayed using green and red labels, respectively.
Background highlighting is used to mark areas of high volume on the chart.
🟪 Customizable Inputs
🔹Trend MA Length: Adjusts the moving average length used to detect trends.
🔹Volume MA Length: Sets the length for the volume moving average calculation.
🔹MA Type for Trend: Select the type of moving average for trend detection (SMA, EMA, WMA, HMA).
🔹Volume Threshold Factor: Multiplier used to define high-volume conditions based on the volume moving average.
🔹Enable Divergence Filter: Allows the user to filter out signals where divergence between price and volume is detected.
🔹Enable Correlation Filter: Enables filtering of signals based on the correlation between price and volume changes.
🔹Correlation Threshold: Sets the minimum correlation value required for a signal to be considered valid.
🟪 Alerts
The indicator provides alert conditions for buy and sell signals, allowing traders to receive notifications when new trading opportunities arise.
🟪 Usage Tips
🔹Adjust Moving Average Lengths: Shorter lengths can make the indicator more sensitive to recent market changes, while longer lengths provide a smoother, more reliable trend signal.
🔹Volume Threshold Factor: Increasing this factor raises the volume required to generate high-volume signals, which can help filter.
🟪 Disclaimer:
The "TechniTrend: Trend and Volume Indicator" is a technical analysis tool intended for educational and informational purposes only. It is not a guarantee of future performance or a recommendation to buy, sell, or hold any financial instrument. Trading involves significant risk, and past performance is not indicative of future results. Users should conduct their own research and seek advice from a qualified financial professional before making any investment decisions. The creators of this indicator are not liable for any financial losses or damages incurred through its use.

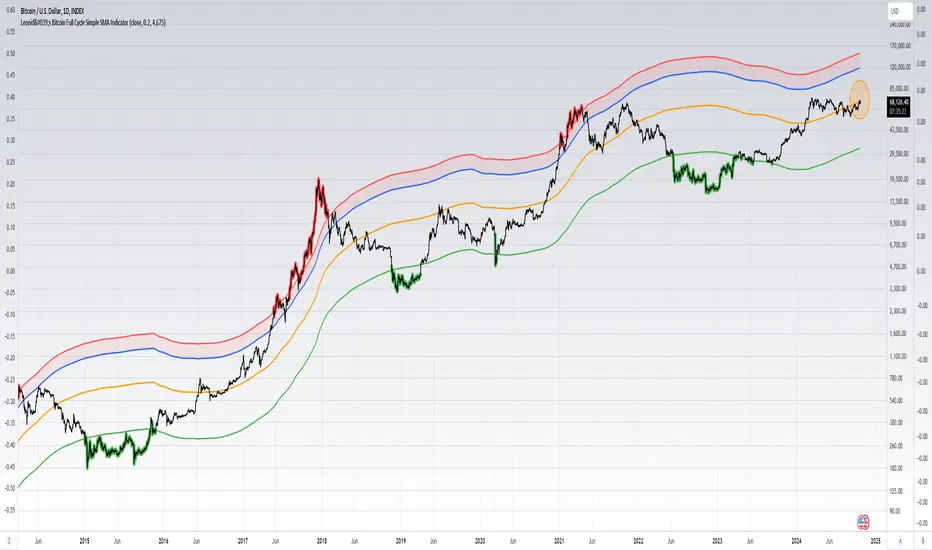
Leonid's Bitcoin Full Cycle Simple SMA IndicatorThis is a straight-forward and customizable indicator to track Bitcoin cycles, specifically used for helping investors understand where to buy and sell. This is done by using a two year SMA period as the base calculation. With that calculation you create lower and upper bounds for bull market peaks and bear market bottoms.
The novel idea here is that you can customize the SMA "strength" for both the upper and lower bounds as alpha decays over time and price get's less volatile with adoption increasing. The multiples are customizable for both the upper and lower bounds along with a mid-line that will adjust based on the settings input.
Indicators don't always have to rely on crazy math or outlandish ideas to be useful, sometimes even the simplest of inputs can give investors (especially those that are new) a great base case for their strategy. Something being simple does not diminish the idea or strength behind the data.
How to use this indicator: This script must be used on INDEX:BTCUSD (Bitcoin All-Time History Index) with the y-axis being set to Logarithmic scale.
Details & how to interpret: The price is colored green when Bitcoin enters a "value zone" meaning it is heavily oversold and likely near a bottom for the bear market cycle. The price is colored red when Bitcoin enters an "overbought zone" meaning it is heavily overbought and is likely near a top for the bull market cycle.
Along with the upper and lower bound I have plotted a mid-line (in orange) to establish a neutral zone which helps depict what phase of the cycle we're in (under mid-line = bearish/accumulation phase, over mid-line = bullish/distribution phase).
The inputs for the upper and lower bound are customizable and will need to be adjusted over time as alpha decay will occur as time goes on. Currently the numbers are as follows:
0.2 for the lower bound
4.675 for the upper bound
Both inputs can be modified depending on your risk tolerance. Mathematically it is safe to assume these numbers will decrease as time goes on and volatility during cycle peaks & troughs is reduced.
I've also plotted an upper bound "heat zone" which is shaded in green, this area is great for signaling when you should be preparing to begin taking profits. It takes the upper bound and subtracts the lower bound to derive the band.
All the colors are customizable and this indicator is best used on a line chart but can be customized to use on a bar chart/candlestick as well.
Simple Moving Averages are a very basic indicator but are often extremely powerful because the majority of traders/investors are looking at such levels which creates a psychological/herd effect. Another good example is the law of round numbers.
Regardless this script can be adapted with EMAs or additional standard deviations if necessary. If you have any questions or concerns please don't hesitate to message me.
GannLSVZO Indicator [Algo Alert]The Volume Zone oscillator breaks up volume activity into positive and negative categories. It is positive when the current closing price is greater than the prior closing price and negative when it's lower than the prior closing price. The resulting curve plots through relative percentage levels that yield a series of buy and sell signals, depending on level and indicator direction.
The Gann Laplace Smoothed Volume Zone Oscillator GannLSVZO is a refined version of the Volume Zone Oscillator, enhanced by the implementation of the upgraded Discrete Fourier Transform, the Laplace Stieltjes Transform. Its primary function is to streamline price data and diminish market noise, thus offering a clearer and more precise reflection of price trends.
By combining the Laplace with Gann Swing Entries and Exits (orange X) and with Ehler's white noise histogram, users gain a comprehensive perspective on volume-related market conditions.
HOW TO USE THE INDICATOR:
The default period is 2 but can be adjusted after backtesting. (I suggest 5 VZO length and NoiceR max length 8 as-well)
The VZO points to a positive trend when it is rising above the 0% level, and a negative trend when it is falling below the 0% level. 0% level can be adjusted in setting by adjusting VzoDifference. Oscillations rising below 0% level or falling above 0% level result in a natural trend.
ORIGINALITY & USFULLNESS:
Personal combination of Gann swings and Laplace Stieltjes Transform of a price which results in less noise Volume Zone Oscillator.
The Laplace Stieltjes Transform is a mathematical technique that transforms discrete data from the time domain into its corresponding representation in the frequency domain. This process involves breaking down a signal into its individual frequency components, thereby exposing the amplitude and phase characteristics inherent in each frequency element.
This indicator utilizes the concept of Ehler's Universal Oscillator and displays a histogram, offering critical insights into the prevailing levels of market noise. The Ehler's Universal Oscillator is grounded in a statistical model that captures the erratic and unpredictable nature of market movements. Through the application of this principle, the histogram aids traders in pinpointing times when market volatility is either rising or subsiding.
The Gann swings and the Gan swing strategy is developed by meomeo105, this Gann high and low algorithm forms the basis of the EMA modification.
DETAILED DESCRIPTION:
My detailed description of the indicator and use cases which I find very valuable.
What is oscillator?
Oscillators are chart indicators that can assist a trader in determining overbought or oversold conditions in ranging (non-trending) markets.
What is volume zone oscillator?
Price Zone Oscillator measures if the most recent closing price is above or below the preceding closing price.
Volume Zone Oscillator is Volume multiplied by the 1 or -1 depending on the difference of the preceding 2 close prices and smoothed with Exponential moving Average.
What does this mean?
If the VZO is above 0 and VZO is rising. We have a bullish trend. Most likely.
If the VZO is below 0 and VZO is falling. We have a bearish trend. Most likely.
Rising means that VZO on close is higher than the previous day.
Falling means that VZO on close is lower than the previous day.
What if VZO is falling above 0 line?
It means we have a high probability of a bearish trend.
Thus the indicator returns 0 and Strategy closes all it's positions when falling above 0 (or rising bellow 0) and we combine higher and lower timeframes to gauge the trend.
What is approximation and smoothing?
They are mathematical concepts for making a discrete set of numbers a
continuous curved line.
Laplace Stieltjes Transform approximation of a close price are taken from aprox library.
Key Features:
You can tailor the Indicator/Strategy to your preferences with adjustable parameters such as VZO length, noise reduction settings, and smoothing length.
Volume Zone Oscillator (VZO) shows market sentiment with the VZO, enhanced with Exponential Moving Average (EMA) smoothing for clearer trend identification.
Noise Reduction leverages Euler's White noise capabilities for effective noise reduction in the VZO, providing a cleaner and more accurate representation of market dynamics.
Choose between the traditional Fast Laplace Stieltjes Transform (FLT) and the innovative Double Discrete Fourier Transform (DTF32) soothed price series to suit your analytical needs.
Use dynamic calculation of Laplace coefficient or the static one. You may modify those inputs and Strategy entries with Gann swings.
I suggest using "Close all" input False when fine-tuning Inputs for 1 TimeFrame. When you export data to Excel/Numbers/GSheets I suggest using "Close all" input as True, except for the lowest TimeFrame. I suggest using 100% equity as your default quantity for fine-tune purposes. I have to mention that 100% equity may lead to unrealistic backtesting results. Be avare. When backtesting for trading purposes use Contracts or USDT.

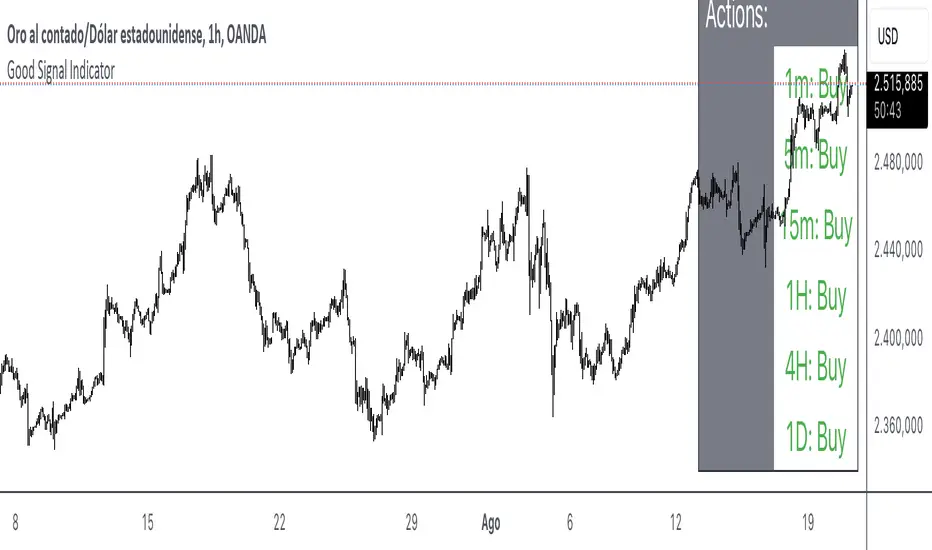
Good Signal IndicatorDescription:
The Good Signal Indicator utilizes Exponential Moving Averages (EMA) across multiple timeframes to provide buy or sell signals based on the relative positioning of short-term and long-term EMAs.
Features:
Multiple Timeframes: Includes EMAs for 1 minute, 5 minutes, 15 minutes, 1 hour, 4 hours, and 1 day.
Customizable Settings: Allows for the configuration of EMA lengths (20 and 50 periods).
Clear Signals: Displays buy, sell, or neutral signals on a table for each timeframe.
How It Works:
EMA Calculation: Computes the EMA values for specified lengths and timeframes.
Signal Generation: Determines buy and sell signals based on whether the current EMA is above or below the EMA from 30 bars ago.
Table Display: Presents the signals in a table at the bottom-right of the chart, showing whether to buy, sell, or hold for each timeframe.
Usage Instructions:
Apply the Indicator: Add the script to your TradingView chart.
Review Signals: Observe the table to understand the current trend for each timeframe.
Adjust Settings: Customize the EMA lengths if needed to fit your trading strategy.
Example Chart:
Ensure your chart is clean, showing only the indicator table without additional clutter. The table should clearly reflect the current buy, sell, or neutral status based on the EMA calculations.
Disclaimer: This indicator is a tool for analysis and should be used in conjunction with other indicators and market research. Always test with historical data before applying it to live trading.
Uptrick: Complex WMA Indicator with Trend Transitions
The "Complex WMA Indicator with Trend Transitions" is a technical analysis tool designed to help traders identify and visualize market trends using three Weighted Moving Averages (WMAs) of varying lengths. The primary purpose of this indicator is to provide a clearer and more nuanced view of market trends by highlighting bullish and bearish phases and filtering out noise, thereby enabling more informed trading decisions.
Detailed Explanation
This indicator allows users to set the lengths of three WMAs through input parameters. The default lengths are set to 10, 20, and 50, but users can customize these values according to their trading strategy. The WMAs are calculated using the closing prices of the specified periods, and the results are plotted on the chart in red, green, and blue, corresponding to the first, second, and third WMAs, respectively.
The indicator defines two primary conditions for trend analysis: bullish and bearish trends. A bullish trend is identified when both the shorter WMAs (first and second) are above the longest WMA (third), indicating upward momentum. Conversely, a bearish trend is identified when both the shorter WMAs are below the longest WMA, signaling downward momentum.
Crossover Signals and Trend Transitions
The script also identifies crossover signals between the first and second WMAs. A bullish crossover occurs when the first WMA crosses above the second WMA, generating a buy signal. This event is marked on the chart with a green upward label. A bearish crossover, marked with a red downward label, occurs when the first WMA crosses below the second WMA, indicating a sell signal.
To track the trend transitions effectively, the indicator employs a state machine. It maintains two variables, currentTrend and prevTrend, to store the current and previous trend states. The trend state is updated based on the defined trend conditions. When the trend changes from one state to another (e.g., from a bullish trend to a bearish trend), the indicator creates a label at the beginning of the new trend to mark this transition. This helps traders quickly recognize significant changes in market direction.
Visual Enhancements
The indicator enhances visual clarity by coloring the background of the chart based on the identified trend. When a bullish trend is detected, the background turns green, and when a bearish trend is identified, it turns red. The script ensures that only clear bullish and bearish trends are highlighted by excluding the "No Clear Trend" state, which reduces noise and prevents false signals.
Alerts
To further aid traders, the indicator includes alert conditions for both bullish and bearish crossovers. These alerts notify traders when a crossover occurs, enabling them to take timely action based on the identified signals.
Purpose and Unique Features
The primary purpose of the "Complex WMA Indicator with Trend Transitions" is to provide traders with a more precise and actionable analysis of market trends. Unlike simple moving average indicators, this tool uses multiple WMAs and incorporates a state machine to track and highlight trend transitions more effectively. By focusing on clear trend signals and filtering out noise, it helps traders make more informed decisions.
This indicator differs from other moving average-based tools in several ways:
Multi-WMA Analysis: It uses three WMAs of different lengths, providing a more comprehensive view of the market trend.
State Machine for Trends: The use of a state machine to track trend transitions ensures that only significant trends are highlighted, reducing noise.
Visual Clarity: The combination of colored backgrounds and labeled transitions makes it easier for traders to identify and act on trends.
Customization: Users can adjust the lengths of the WMAs to suit their trading strategies, making the indicator versatile.
In summary, the "Complex WMA Indicator with Trend Transitions" offers a sophisticated and customizable approach to trend analysis, providing clear visual cues and alerts for significant market movements, which sets it apart from simpler moving average indicators.

Watermark Indicator Overview
The Custom Watermark Indicator is a versatile Pine Script tool designed to enhance your TradingView charts with personalized text elements. This indicator allows users to add custom quotes and symbol information directly onto their charts, providing a unique way to display motivational messages, trading information, or any other text-based content.
Features
Customizable Quote Display:
Text Content: Users can input any desired text to be displayed as a quote on the chart.
Positioning: The quote can be positioned at various locations on the chart (top, middle, bottom; left, center, right).
Styling: Options to customize the text color, background color, and size. Borders around the text can also be toggled on or off.
Symbol Information Display:
Text Content: Users can input additional text to accompany the symbol information.
Symbol Details: Options to display the ticker symbol, the timeframe, and the date.
Positioning: Similar to the quote, the symbol information can be positioned at various locations on the chart.
Styling: Customizable text color, background color, and size, with optional borders.
How to Use
Adding the Indicator:
Add the indicator to your TradingView chart by selecting it from the indicators list or by pasting the script into the Pine Editor and adding it to the chart.
Configuring the Quote:
Show Quote: Toggle the visibility of the quote.
Quote Text: Enter your desired quote in the provided text area.
Positioning: Choose the vertical and horizontal positions for the quote.
Styling: Adjust the text color, background color, and size. Optionally, hide the border around the text.
Configuring the Symbol Information:
Show Symbol Info: Toggle the visibility of the symbol information.
Additional Text: Enter any additional text you want to display with the symbol information.
Details to Display: Select which details to show (ticker symbol, timeframe, date).
Positioning: Choose the vertical and horizontal positions for the symbol information.
Styling: Adjust the text color, background color, and size. Optionally, hide the border around the text.
Practical Applications
Motivational Quotes: Keep yourself motivated by displaying your favorite trading quotes or personal affirmations.
Trading Information: Display important trading details such as the symbol, timeframe, and date in a prominent location on your chart.
Customization: Personalize your chart workspace to make it more engaging and tailored to your preferences.
Conclusion
The Custom Watermark Indicator is a powerful tool for traders looking to add a personal touch to their TradingView charts. With its flexible configuration options and easy-to-use interface, it allows for a high degree of customization to meet the unique needs of each trader. Whether for motivation, information, or aesthetics, this indicator enhances the charting experience by integrating valuable textual elements seamlessly.

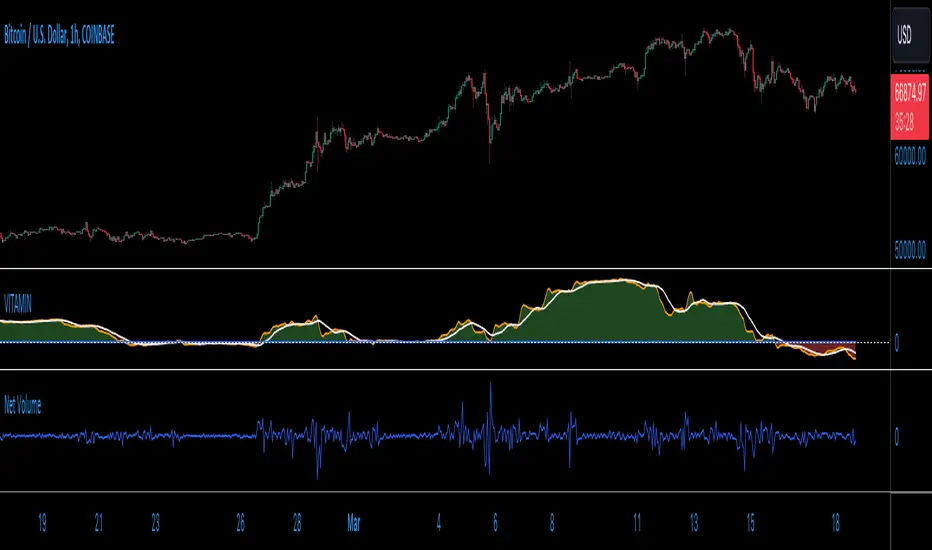
VITAMIN: Volume Insight Trend Analyzer - Multilayered INdicator)Meet VITAMIN, an indicator created mainly to function as a confirmation volume indicator to integrate into strategies as a signal filter, but it can also be used as a general-purpose indicator to enhance market analysis through volume trend insights.
The name was choses to help with recall, with VITAMIN short for "Volume Insight Trend Analyzer - Multilayered INdicator".
The indicator is grounded in the net volume calculation, using TradingView's built-in Net Volume indicator as a starting point, and taking as a series of simple Moving Averages based on the Net Volume data.
Core Features:
Multilayered Analysis: VITAMIN layers multiple moving averages on top of net volume—volume adjusted for price movement direction—to filter market noise and reveal clearer volume trends.
Foundation in Net Volume: The starting point is net volume, which combines volume magnitude with the direction of price changes, offering a baseline for momentum analysis.
Visual Trend Indicators: The indicator uses green and red shading between its moving average layers and a reference zero line to visually denote bullish (green) and bearish (red) volume trends, simplifying the interpretation of market sentiment.
Utility of VITAMIN:
Volume plays a crucial role in market analysis, but interpreting volume directly can be complex due to inherent market noise. Net Volume in particular features a great deal of noise, as a sequence of spikes and dips from bar to bar. My purpose with this indicator was to separate the signal from the noise. VITAMIN's multilayered moving averages provide a smoother, more interpretable trend line that distinguishes significant market moves from short-term fluctuations.
Applications:
Confirming Trends: VITAMIN can help validate price trends. A price uptrend paired with a bullish volume trend indicated by VITAMIN may reinforce the strength of the movement.
Identifying Divergences: Observing discrepancies between price trends and VITAMIN's volume trends can highlight potential reversals or continuations.
Assessing Market Sentiment: The overall trend and colour shading within VITAMIN aims to provide insight into market sentiment.
VITAMIN is designed for simplicity and effectiveness, aiming to provide deeper insights into volume trends, supporting more informed decisions.
Like any indicator featuring moving averages, and averages of those averages, there is a built-in lag to this indicator, but this is the trade-off for removing noise from the signal. Adjust the user inputs to suit your time frame.
Support & Resistance IndicatorThe MACD Support & Resistance indicator is an enhanced tool to better visualize potential supply (resistance) and demand (support) zones based on the MACD indicator. It combines the strength of the MACD with recent price highs and lows to depict potential breakout or reversal areas in the market.
Features:
MACD Settings: Users can adjust the fast length, slow length, source of MACD, signal smoothing, and MA type for both the oscillator and the signal line.
Dynamic Color Settings: Customize the color of supply boxes, demand boxes, and closed boxes for improved visualization.
Table View: An optional table can be displayed showing the average MACD high and low values, with customizable table position, size, background color, and text color.
Historical MACD Average: The indicator uses a historical average of MACD pivot highs and lows to determine potential support and resistance zones.
Real-Time Zone Detection: The indicator plots 'High Boxes' when the MACD crosses above its average high and 'Low Boxes' when it crosses below its average low, which signifies potential breakout or reversal zones.
How It Works:
The MACD line is calculated using user-defined moving average types (either EMA or SMA).
Pivot highs and pivot lows of the MACD are identified over a specified period.
Historical MACD highs and lows are stored and managed for average calculation. The average MACD high and low values are then used to determine potential trading zones.
When the MACD crosses over its average high, a 'High Box' (representing a potential breakout zone) is plotted from the recent high price to the candle top.
Conversely, when the MACD crosses under its average low, a 'Low Box' (indicating a potential reversal zone) is plotted from the recent low price to the candle base.
As price progresses, the boxes can either extend (if price stays within the zone) or close if a breakout happens.
For those who prefer a tabular view, an optional table displays the average MACD high and low, enhancing the on-chart data representation.
Use Cases:
Traders can use this indicator as an additional tool to spot potential breakout or reversal areas based on the MACD's behavior against its historical average. The visual representation in the form of boxes can assist in making better trading decisions by offering a clear picture of potential supply and demand zones.
Note: As with all trading indicators, it's advisable to use this tool in conjunction with other technical analysis methods or indicators for more informed decision-making.

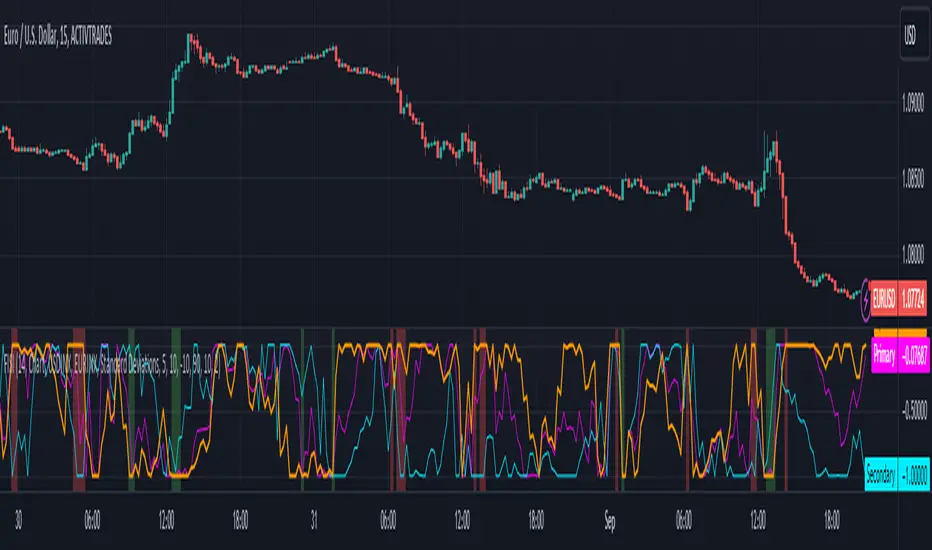
Zaree - FX Index Spread IndicatorDescription:
The "Zaree - FX Index Spread Indicator" (FISI) is a powerful technical analysis tool designed to provide insights into the spread between two selected currency indices. By calculating and visualizing the percentage difference between the values of a primary and a secondary currency index, traders can gain valuable information about potential market dynamics and trends.
Details of the Indicator:
The indicator calculates the spread percentage between a primary and a secondary currency index, allowing traders to understand the relative strength of the two indices.
Traders can choose from a list of currency indices to use as the primary and secondary indices for comparison.
The indicator offers multiple methods for setting thresholds to identify potential trading opportunities, including standard deviations, percentile ranks, historical highs and lows, and fixed thresholds.
Users can customize the length of the calculation period and choose whether to display the primary index, secondary index, and the spread percentage on the chart.
Shaded areas on the chart indicate regions where the spread percentage is above or below predefined thresholds, helping traders identify potential trading signals.
How to Use the Indicator:
Select the primary and secondary currency indices you want to compare from the provided dropdown menus. These indices will be used to calculate the spread percentage.
Choose the method for setting thresholds by selecting one of the options: "Standard Deviations," "Percentile Ranks," "Historical Highs and Lows," or "Fixed Thresholds."
Depending on the selected method, configure the relevant threshold parameters, such as historical threshold percentage, upper and lower fixed thresholds, upper and lower percentile thresholds, or the standard deviation multiplier.
Choose whether to visualize the primary index, secondary index, and spread percentage on the chart by enabling the respective options.
Observe the chart to identify potential trading signals based on the interactions between the spread percentage and the predefined thresholds.
Example of Usage:
Suppose you're interested in trading currency pairs involving the US Dollar (USD) and Euro (EUR), and you want to monitor the spread between the USD Index (USDINX) and the EUR Index (EURINX). Here's how you can use the FISI indicator:
Select "USDINX" as the primary index and "EURINX" as the secondary index.
Choose the method for setting thresholds based on your strategy. For instance, you can select "Standard Deviations" and adjust the standard deviation multiplier.
Enable the visualization of the primary index, secondary index, and spread percentage on the chart.
Observe the shaded areas on the chart. If the spread percentage crosses above the upper threshold, it may indicate a potential market overextension. Conversely, if the spread percentage crosses below the lower threshold, it could suggest an oversold market condition.
Look for instances where the spread percentage approaches or crosses the predefined thresholds. Consider these instances as potential entry or exit points for your trades.
Remember that the FISI indicator is a tool to assist you in your analysis. It's recommended to combine its insights with other technical and fundamental factors before making trading decisions. Adjust the indicator settings and thresholds based on your trading strategy and preferences.
As with any trading tool, practice and observation are key. Over time, you can refine your trading strategy by analyzing historical data and observing how the indicator performs in different market conditions.
Feel free to experiment with different settings and methods to find the configuration that aligns best with your trading style and goals.
BTC bottom top MACRO indicator based on: Cost per transaction(w)Predicting tops and bottoms in any market is a challenging task, and the Bitcoin market is no exception. Many traders and analysts use a combination of various indicators and models to help them make educated guesses about where the market might be heading. One such metric that can provide valuable insights is the Bitcoin cost per transaction indicator.
Here's how it could potentially be superior to just using price action for predicting macro tops and bottoms:
Transaction Cost as an Indicator of Network Activity: The cost per transaction on the Bitcoin network can give an indication of how much activity is taking place. When transaction costs are high, it may signal increased network usage, which often coincides with periods of market enthusiasm or FOMO (Fear of Missing Out) that can precede market tops. Conversely, lower transaction costs might indicate reduced network activity, potentially signaling a lack of investor interest that might precede market bottoms.
Reflects Real-World Use and Demand: Unlike price action, which can be influenced by speculative trading and may not always reflect the underlying fundamentals, the cost per transaction is directly tied to the use of the Bitcoin network. It offers a more fundamental approach to understanding market dynamics.
Complements Price Action Analysis: While price action can give signals about potential tops and bottoms based on historical price patterns and technical analysis, the cost per transaction can add an additional layer of information by reflecting network activity. In this way, the two can be used together to give a more complete picture of the market.
May Precede Price Changes: Changes in transaction costs could potentially precede price changes, giving advanced warning of tops and bottoms. For instance, a sudden increase in transaction costs might indicate a surge in network activity and investor interest, potentially signaling a market top. On the other hand, a decrease in transaction costs might suggest declining network activity and investor interest, potentially signaling a market bottom.
However, it's important to note that while the cost per transaction can provide valuable insights, it's not a foolproof method for predicting market tops and bottoms. Like all indicators, it should be used in conjunction with other tools and analysis methods, and traders should also consider the broader market context. As always, past performance is not indicative of future results, and all trading and investment strategies carry the risk of loss.
