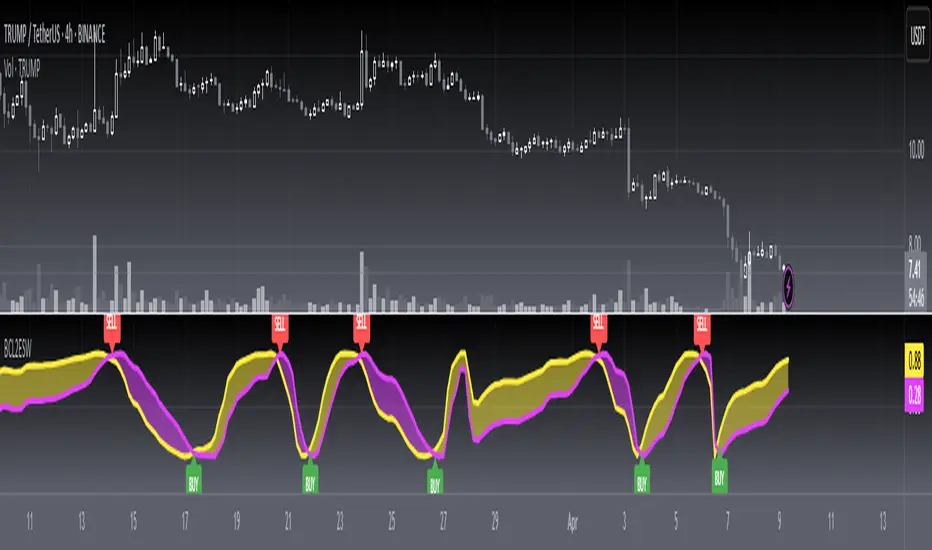
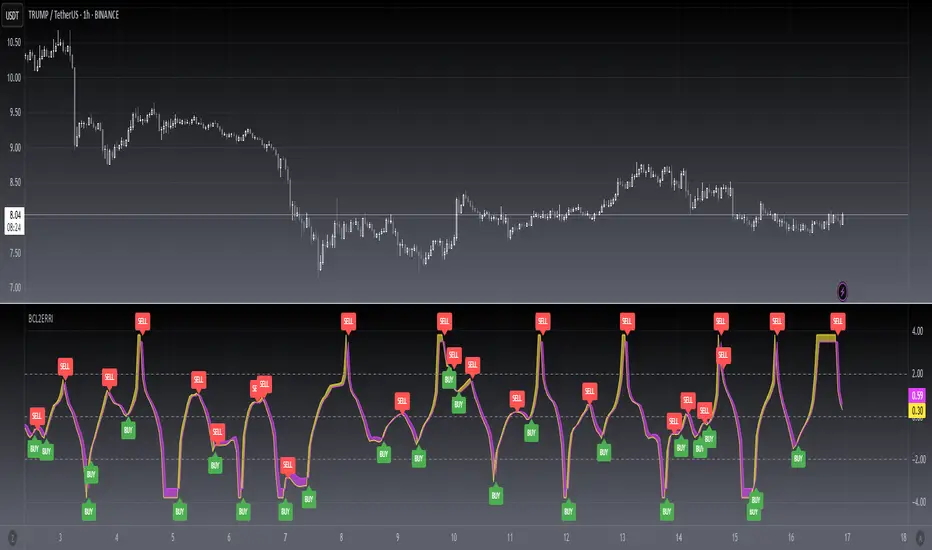
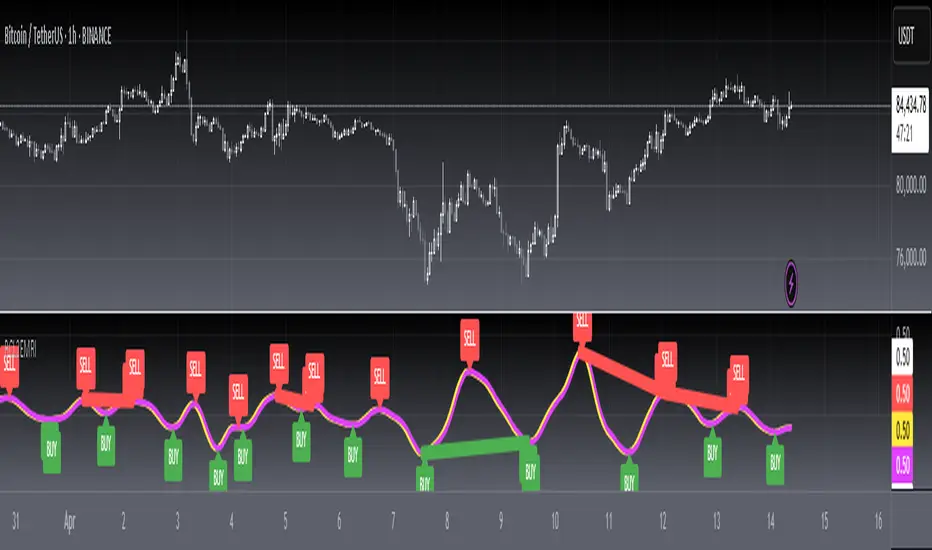
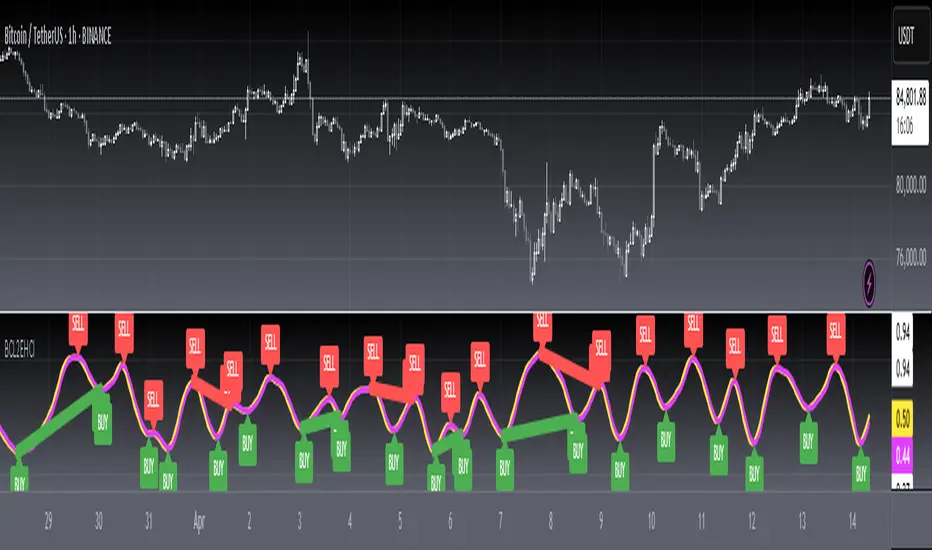
BT Leading Candle IndicatorThe oscillator display consists of 3 lines (K, D and J - hence the name of the display) and 2 levels. K and D are the same lines you see when using the stochastic oscillator. The J line in turn represents the deviation of the D value from the K value. The convergence of these lines indicates new trading opportunities. Just like the Stochastic Oscillator, oversold and overbought levels correspond to the times when the trend is likely to reverse.
Function
BT Leading KDJ Candle Indicator use candles to indicate KD relationship. E.g. yellow candles for bull (K>=D) and fuchsia candles for bear (K=D and fuchsia for K KDJ K value
d --> KDJ D value
buysig --> KD buy signal in green triangle
selsig --> KD sell signal in red triangle
leadingline --> colorful leading line for KDJ
Pros and Cons
Pros:
1. Candle height can indicates the strength of trend and different colors are used for indicating KD relationship
2. a leading line is added as aux method to confirm KDJ signal
Cons:
1. It may satruate for extreme conditions of long and short as described in the chart, which is inherent KDJ shortcoming.
2. Not accurate for long and short entries and need filtering out noise and fake signal.
Remarks
More direct to observe and confirm trend with the leading line.
Read me
In real life, I am a prolific inventor. I have successfully applied for more than 60 international and regional patents in the past 12 years. But in the past two years or so, I have tried to transfer my creativity to the development of trading strategies. Trading view is the ideal platform for me. I am selecting and contributing some of the hundreds of scripts to publish in Trading view community. Welcome everyone to interact with me to discuss these interesting pine scripts.
The scripts posted are categorized into 5 levels according to my efforts or man hours put into these works.
Level 1 : interesting script snippets or distinctive improvement from classic indicators or strategy. Level 1 scripts can usually appear in more complex indicators as a function module or element.
Level 2 : composite indicator/strategy. By selecting or combining several independent or dependent functions or sub indicators in proper way, the composite script exhibits a resonance phenomenon which can filter out noise or fake trading signal to enhance trading confidence level.
Level 3 : comprehensive indicator/strategy. They are simple trading systems based on my strategies. They are commonly containing several or all of entry signal, close signal, stop loss, take profit, re-entry, risk management, and position sizing techniques. Even some interesting fundamental and mass psychological aspects are incorporated.
Level 4 : script snippets or functions that do not disclose source code. Interesting element that can reveal market laws and work as raw material for indicators and strategies. If you find Level 1~2 scripts are helpful, Level 4 is a private version that took me far more efforts to develop.
Level 5 : indicator/strategy that do not disclose source code. private version of Level 3 script with my accumulated script processing skills or a large number of custom functions. I had a private function library built in past two years. Level 5 scripts use many
חפש סקריפטים עבור "indicator"
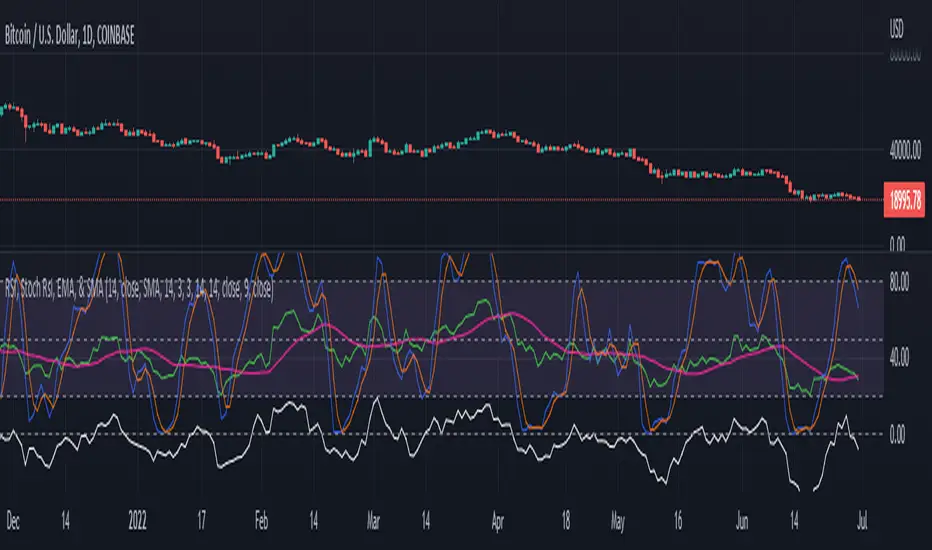
RSI, Stoch Rsi, EMA, SMA, & ROCThis indicator is simply an enhanced version of the RSI followed up by a few extra indicators that pair strongly with the RSI. This indicator allows the user to interact with various inputs based off the indicators provided. All indicators include moving average, relative strength index, stochastic relative strength index, simple moving average, exponential moving average, and rate of change. This program is unique as it is very versatile allowing the user to use as little or as many indicators as needed interchangeably.
Buffett Indicator: Wilshire 5000 to GDP Ratio [WhaleCrew]Our Implementation of the famous Buffett Indicator a long-term valuation indicator for stocks.
Calculation: Wilshire 5000 Index divided by US GDP (Gross Domestic Product)

MTF Stochastic Zones w/ Candle and Swing Hi/Lo IndicatorsMTF Stochastic Zones w/ Candle and Swing Hi/Lo Indicators by // © KaizenTraderB
This indicator will display the Stochastic RSI as color zones utilizing 3 Timeframes of your choice as well as key reversal candles:
Entry Timeframe StochRSI Crossovers and Long Wick Reversal Candles (Hammer and Hanging Man) and Engulfing Candles
That correlate with Swing Highs and Lows.
When the higher timeframe is bullish it will be green and when bullish, red.
When the middle timeframe is counter the higher, it will appear brownish.
The entry timeframe will print Candle Labels and Swing Highs and Lows at bullish and bearish Stochastic RSI crossovers when oversold and overbought, respectively,
In the direction of the higher timeframe directional bias when the middle timeframe is counter that direction to catch reversals in corrections.
(It also prints Bull/Bear StochRSI Crossovers that correlated with Swing Highs and Lows that are not Hammers, Hanging Men or Engulfing Candles.)
The options allow you to turn the zones, swing highs and lows, candle indicators and entry StochRSI Crossovers on and off, as well as which Timeframes you choose to view.
Entry - 1Hr, 15m, 5m or 1m Middle Timeframe - Daily, 4Hr, 1Hr or 15m Higher Timeframe - Monthly, Weekly, Daily, 4Hr or 1Hr
You can change the Swing High and Low Lookback periods, as well as
The Stochastic RSI Lookback for each of the three timeframes and the level of Overbought and Oversold:
When 8 is chosen for RSI Lookback, Stochastic Lookback = 5, SmoothK = 3, Smooth D = 3 For 13 - 8, 5, 5 For 21 - 13, 8, 8 For 34 - 21, 13, 13
Its good practice to adjust settings so Higher Timeframe zones (green/red) correlate with longer trend movements,
Medium Timeframe with corrections and reversal areas (brown) and Entry Timeframe with key reversal candles.
For example, to adjust the Daily Higher Timeframe, turn the Higher Timeframe to Daily, turn off the others and bring up the Daily Chart.
Look at chart for last 200 bars or so and go through the different settings until you find the one that best correlates with recent past price action.
Do the same procedure for the Middle and Entry Timeframe. Once all the settings are how you prefer, view the Indicator on the Entry Timeframe to find trades.
Coding included to prevent repainting
Can be used in conjunction with the MTF Stochastic RSI w/ Zones which is displayed in the lower panel.
Need the same settings in both indicators for them to correlate or use different settings for different views,
Message me with feedback to improve upon this indicator or requested additions.
I will soon be releasing a Strategy based on this indicator!

Bitcoin Risk Long Term indicatorOBJECTIVE:
The purpose of this indicator is to synthesize via an average several indicators from a wide choice with in order to simplify the reading of the bitcoin price and that on a long term vision.
Useful for those who want to see things simply, typically to make a smart DCA based on risk.
I originally used this script as a sandbox to understand and test the usefulness of several indicators, and to develop my PineScript skills, but finally the Risk Indicator output seems relevant so I decided to share it.
USAGE:
The selected indicators are the ones that I think give the best market bottoms, but the idea here is that anyone can try and use any set of indicators based on those preferences (post in comments if you find a relevant config)
Most of the indicator inputs are configurable. And some are not taken into account in the calculation of the Risk indicator because I consider them not relevant, this script is also a test more than a final version.
NOTES :
If you have any idea of adding an indicator, modification, criticism, bug found: share them, it is appreciated!
In the future I will create another more versatile Risk indicator that will not be focused on bitcoin in weekly. (this indicator is still usable on other assets and timeframe)
THANKS:
to Benjamin Cowen for inspiring me with his Bitcoin Risk metric
to Lazybear for his Wavetrend Indicator and all the scripts he shares
to Mabonyi for his Bitcoin Logarithmic Growth Curves & Zones script
to VuManChu for his VMC Cypher B Divergence
to the Trading view team for developing TV and PineScript
And to all the community for all the published codes that allowed me to progress and create this script
---- FR ----
OBJECTIF :
L'objectif de cet indicateur est de synthétiser via une moyenne plusieurs indicateurs parmi un large choix avec afin de simplifier la lecture du cours de bitcoin et cela sur une vision longue terme.
Utile pour ceux qui veulent voir les choses simplement, typiquement faire un DCA intelligent en fonction du risque.
À la base j'ai utilisé ce script comme un bac à sable pour comprendre puis tester l'utilité de plusieurs indicateurs, et développer mes compétences PineScript, mais finalement l'output Risk Indicateur me semble pertinent donc autant le partager.
UTILISATION :
Les indicateurs sélectionnés sont ceux qui permettent selon moi d'avoir les meilleurs point bas de marché, mais l'idée ici est que chacun puisse essayer et utiliser n'importe quel ensemble d'indicateur en fonction de ces préférences (poster en commentaire si vous trouvez une configuration pertinente)
La plupart des inputs indicateurs sont paramétrables. Et certains ne sont pas pris en compte dans le calcul du Risk indicateur car je les estime non pertinent, ce script est aussi un essai plus qu'une version finale.
NOTES :
Si vous avez la moindre idée d'ajout d'indicateur, modification, critique, bug trouvé : partagez-les, c'est apprécié !
à l'avenir je créerais un autre Risk indicator plus polyvalent qui ne sera pas focalisé sur bitcoin en weekly. (cet indicateur est tout de même utilisable sur d'autre actif et timeframe)
REMERCIEMENT :
à Benjamin Cowen pour m'avoir inspiré avec son Bitcoin Risk metric
à Lazybear pour son Wavetrend Indicator et globalement tout les scripts qu'il partage
à Mabonyi pour son script Bitcoin Logarithmic Growth Curves & Zones
à VuManChu pour son VMC Cypher B Divergence
à l'équipe Trading view pour avoir développé TV et PineScript
Et à toute la communauté pour tous les codes publiés qui m'ont permis de progresser et de créer ce script

DMI RSI AO 3 indicators in 1 overlayThis is simple indicators that plot 3 indicators DMI, RSI and AO on 1 pane
How to use: you can add on your chart and edit color and display in setting page of indicators
The directional movement index (DMI) is an indicator developed by J. Welles Wilder in 1978 that identifies in which direction the price of an asset is moving. The indicator does this by comparing prior highs and lows and drawing two lines: a positive directional movement line (+DI) and a negative directional movement line (-DI). An optional third line, called the average directional index (ADX), can also be used to gauge the strength of the uptrend or downtrend.
When +DI is above -DI, there is more upward pressure than downward pressure in the price. Conversely, if -DI is above +DI, then there is more downward pressure on the price. This indicator may help traders assess the trend direction. Crossovers between the lines are also sometimes used as trade signals to buy or sell.
The relative strength index (RSI) is a momentum indicator used in technical analysis that measures the magnitude of recent price changes to evaluate overbought or oversold conditions in the price of a stock or other asset. The RSI is displayed as an oscillator (a line graph that moves between two extremes) and can have a reading from 0 to 100. The indicator was originally developed by J. Welles Wilder Jr. and introduced in his seminal 1978 book, “New Concepts in Technical Trading Systems.”1
Traditional interpretation and usage of the RSI are that values of 70 or above indicate that a security is becoming overbought or overvalued and may be primed for a trend reversal or corrective pullback in price. An RSI reading of 30 or below indicates an oversold or undervalued condition.
Awesome Oscillator is developed by famous technical analyst and charting enthusiast Bill Williams. Awesome Oscillator (AO) is an indicator that is non-limiting oscillator, providing insight into the weakness or the strength of a stock. The Awesome Oscillator is used to measure market momentum and to affirm trends or to anticipate possible reversals. It does this by effectively comparing the recent market momentum, with the general momentum over a wider frame of reference.

Half-Pi Cycle CKB top indicator (insanely experimental)This is an insanely experimental script. It's a modified version of the Bitcoin pi-cycle top indicator.
It changes the Bitcoin pi-cycle top formula by halving the number of days in the two DMAs used in calculation, from 350/111 to 175/56. So I call it the half-pi cycle. It correctly picked the top of CKB (Nervos Network) vs USDT on Huobi in spring 2021 within three days.
It probably is a coincidence, and could very easily not pick the next cycle peak correctly at all. Using such a short number of days makes it a little dubious, but I had no choice since there's only so much price history for this coin. I strongly advise you to not make any trades based on this script ! I cannot be held accountable if you lose money due to this script. It hasn't been shown to be accurate multiple times like the Bitcoin pi-cycle top indicator. I simply find this interesting and want to see if it works next time.

Up/Down Indicator - DurbtradeA simple but unique indicator to show ONLY whether there is an increase or a decrease in price compared to the previous value.
Also includes a customizable SMA or EMA based "Smoothing Length" variable,
allowing the indicator to show whether the SMA or the EMA of the price
is up or down compared to the previous value.
An offset option is also included if you need it.
Settings :
Personal thoughts :
I wanted to have an indicator that showed ONLY whether the price is UP or DOWN from the previous value.
My logic was that I could have a more accurate perception of general up or down trend direction
if I removed the AMOUNT of increase or decrease happening from moment to moment over time.
From there, I added the SMA/EMA "Smoothing Length" and "Smoothing Type" variables into the script.
By increasing the value of the smoothing length above 1,
the indicator act as a color-changing moving average, except without showing an actual value.
"Smooth Length" acts just like the length of any other moving average...
When the value of the "Smooth Length" is = 1, the indicator shows whether PRICE is up or down.
When the value of the "Smooth Length" is = 50, the indicator shows whether the MOVING AVERAGE with a length of 50 is up or down.
When the value of the "Smooth Type" is = 1, the indicator is SMA based.
When the value of the "Smooth Type" is = 2, the indicator is EMA based.
As you can see in the main chart above, or in the picture below, I show the indicator in 2 different ways...
The indicator on the top shows price up/down action,
and the indicator on the bottom shows the 50 SMA up/down action :
Other key points :
The indicator height can be smashed down as small as possible and still remain 100% functional...
which is very important when chart real-estate is limited.
Here is an example of my main layout setup, with the Up/Down indicator on the top left :
As you can see, it takes up very little space, but still remains fully functional.
In the example above, I have it overlayed on the left chart price panel,
with the price visibility turned off.
If it is overlayed on the price panel like so, and you want to see both the indicator and price,
simply turn the price visibility on to see both.
Since the indicator displays itself merely by changing the color of the background,
layer order has no effect, and the indicator is always drawn in the background.
The Up/Down indicator can also be used in conjunction with other candle types
that sometimes display candle color differently than standard candles, such as heikin-ashi candles.
Just take note that the colors of the indicator may not match the colors of the heikin-ashi candles.
Finally, I looked very hard to find an indicator like this on TradingView, and found absolutely nothing.
I know that it is a simple concept, but I'm honestly surprised I couldn't find anything like it.
I have been using it for awhile now, and I'm proud of the results...
therefore, I'd like to share it with the community, along with my previously published indicators,
in the hope that you find it useful!
Outro :
A) As with my previous indicators,
this one was written while keeping information, color, clarity, chart real-estate, and customization in mind.
B) It is optimized to be displayed on all display setups...
for use on your own personal television, laptop, or cellular phone screen...
and on all chart zoom levels and layout styles.
C) Please feel free to comment your thoughts, critiques, or suggestions. They are all very helpful!
D) Check out my previous pine script indicators if you like this one. They work really well together.
E) I hope that you find this script useful.
F) Enjoy!
// Durbtrade

Bubble indicatorA simple and accurate indicator that signals the end of the Bitcoin's bull run. This indicator is an inverted lower Bollinger band , taken from a weekly chart. An interesting observation led to the creation of this indicator: on the weekly chart the lower band takes negative values (the red zone in the indicator) at the end of the Bitcoin's bull run. The advantage of this indicator is that the signal comes in advance.

[blackcat] L1 Ehlers Phasor IndicatorLevel: 1
Background
This script was requested by @pips_v1. "A cycle is one market characteristic that can be scientifically measured. Although they can be measured, they are still maddening because they are in essence ephemeral; they come and they go. Our recent research, however, indicates there is a fundamental cycle parameter that leads us to the correct trading strategy for any current market mode." by John Ehlers
Function
John Ehlers describe the principle of phasor indicator as "One easy way to picture a cycle is as an indicator arrow bolted to a rotating shaft, as can be seen in a phasor diagram. Each time the arrowhead sweeps through one complete rotation, a cycle is completed. The phase increases uniformly throughout the cycle. The phase continues for the next cycle but is usually drawn as reset to zero to start the next cycle." The parameter we use is the phase of the cycle. The measured phase tells us with great sensitivity when we are in the trend mode, enabling the capture of a large fraction of the trend movement.
Key Signal
Phase --> Ehlers Phasor signal
Pros and Cons
100% John F. Ehlers definition translation of his publications, even variable names are the same. This help readers who would like to use pine to read his book.
Remarks
The 102th script for Blackcat1402 John F. Ehlers Week publication.
Readme
In real life, I am a prolific inventor. I have successfully applied for more than 60 international and regional patents in the past 12 years. But in the past two years or so, I have tried to transfer my creativity to the development of trading strategies. Tradingview is the ideal platform for me. I am selecting and contributing some of the hundreds of scripts to publish in Tradingview community. Welcome everyone to interact with me to discuss these interesting pine scripts.
The scripts posted are categorized into 5 levels according to my efforts or manhours put into these works.
Level 1 : interesting script snippets or distinctive improvement from classic indicators or strategy. Level 1 scripts can usually appear in more complex indicators as a function module or element.
Level 2 : composite indicator/strategy. By selecting or combining several independent or dependent functions or sub indicators in proper way, the composite script exhibits a resonance phenomenon which can filter out noise or fake trading signal to enhance trading confidence level.
Level 3 : comprehensive indicator/strategy. They are simple trading systems based on my strategies. They are commonly containing several or all of entry signal, close signal, stop loss, take profit, re-entry, risk management, and position sizing techniques. Even some interesting fundamental and mass psychological aspects are incorporated.
Level 4 : script snippets or functions that do not disclose source code. Interesting element that can reveal market laws and work as raw material for indicators and strategies. If you find Level 1~2 scripts are helpful, Level 4 is a private version that took me far more efforts to develop.
Level 5 : indicator/strategy that do not disclose source code. private version of Level 3 script with my accumulated script processing skills or a large number of custom functions. I had a private function library built in past two years. Level 5 scripts use many of them to achieve private trading strategy.

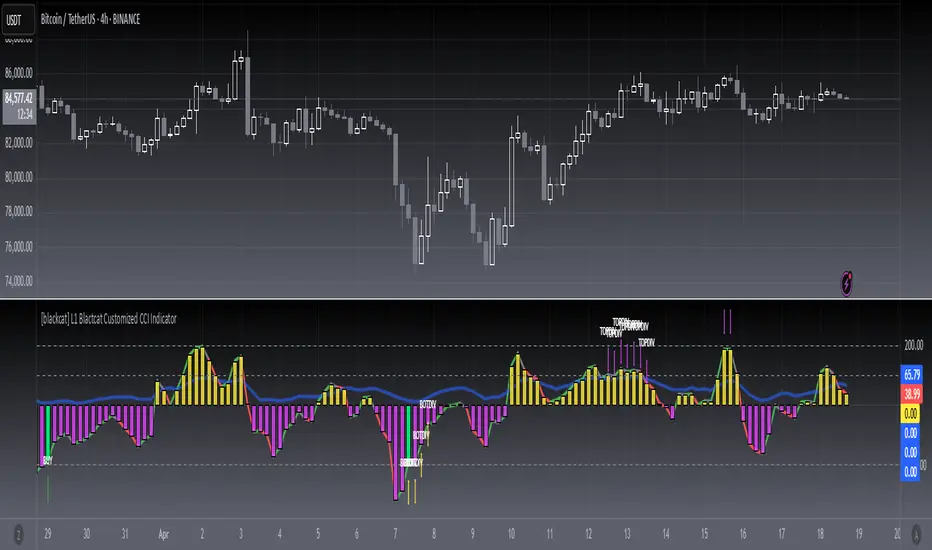
[blackcat] L1 Blackcat Customized CCI IndicatorLevel: 1
Background
This CCI indicator is blackcat customized version with enhanced features.
Function
This CCI use green line to indicate strong long trend with cci values > 0 and red line to indicate weak long trend with cci values <0. It also use yellow and fuchsia candles to present the strong and weak long trend. A green candle is used to indicate long entry, while a red candle is usded to indicate long flatten signal.
Key Signal
green line --> strong long trend
red line --> weak long trend
blue line --> trend strength indicator
SELL label --> flatten long or short entry
BUY label --> long entry
TOPDIV label --> top divergence indicator
BOTDIV label --> bottom divergence indicator
Remarks
Feedbacks are appreciated.
Readme
In real life, I am a prolific inventor. I have successfully applied for more than 60 international and regional patents in the past 12 years. But in the past two years or so, I have tried to transfer my creativity to the development of trading strategies. Tradingview is the ideal platform for me. I am selecting and contributing some of the hundreds of scripts to publish in Tradingview community. Welcome everyone to interact with me to discuss these interesting pine scripts.
The scripts posted are categorized into 5 levels according to my efforts or manhours put into these works.
Level 1 : interesting script snippets or distinctive improvement from classic indicators or strategy. Level 1 scripts can usually appear in more complex indicators as a function module or element.
Level 2 : composite indicator/strategy. By selecting or combining several independent or dependent functions or sub indicators in proper way, the composite script exhibits a resonance phenomenon which can filter out noise or fake trading signal to enhance trading confidence level.
Level 3 : comprehensive indicator/strategy. They are simple trading systems based on my strategies. They are commonly containing several or all of entry signal, close signal, stop loss, take profit, re-entry, risk management, and position sizing techniques. Even some interesting fundamental and mass psychological aspects are incorporated.
Level 4 : script snippets or functions that do not disclose source code. Interesting element that can reveal market laws and work as raw material for indicators and strategies. If you find Level 1~2 scripts are helpful, Level 4 is a private version that took me far more efforts to develop.
Level 5 : indicator/strategy that do not disclose source code. private version of Level 3 script with my accumulated script processing skills or a large number of custom functions. I had a private function library built in past two years. Level 5 scripts use many of them to achieve private trading strategy.
[blackcat] L2 Ehlers MESA Stochastic IndicatorLevel: 2
Background
John F. Ehlers introuced MESA Stochastic Indicator in Jan, 2014.
Function
The MESA Stochastic oscillator, a stochastic successor that removes the effect of spectral dilation through the use of a roofing filter.
Key Signal
MESAStochastic --> Ehlers MESA Stochastic Indicator fast line
Trigger --> Ehlers MESA Stochastic Indicator slow line
Pros and Cons
100% John F. Ehlers definition translation, even variable names are the same. This help readers who would like to use pine to read his book.
Remarks
The 101th script for Blackcat1402 John F. Ehlers Week publication.
Readme
In real life, I am a prolific inventor. I have successfully applied for more than 60 international and regional patents in the past 12 years. But in the past two years or so, I have tried to transfer my creativity to the development of trading strategies. Tradingview is the ideal platform for me. I am selecting and contributing some of the hundreds of scripts to publish in Tradingview community. Welcome everyone to interact with me to discuss these interesting pine scripts.
The scripts posted are categorized into 5 levels according to my efforts or manhours put into these works.
Level 1 : interesting script snippets or distinctive improvement from classic indicators or strategy. Level 1 scripts can usually appear in more complex indicators as a function module or element.
Level 2 : composite indicator/strategy. By selecting or combining several independent or dependent functions or sub indicators in proper way, the composite script exhibits a resonance phenomenon which can filter out noise or fake trading signal to enhance trading confidence level.
Level 3 : comprehensive indicator/strategy. They are simple trading systems based on my strategies. They are commonly containing several or all of entry signal, close signal, stop loss, take profit, re-entry, risk management, and position sizing techniques. Even some interesting fundamental and mass psychological aspects are incorporated.
Level 4 : script snippets or functions that do not disclose source code. Interesting element that can reveal market laws and work as raw material for indicators and strategies. If you find Level 1~2 scripts are helpful, Level 4 is a private version that took me far more efforts to develop.
Level 5 : indicator/strategy that do not disclose source code. private version of Level 3 script with my accumulated script processing skills or a large number of custom functions. I had a private function library built in past two years. Level 5 scripts use many of them to achieve private trading strategy.

[blackcat] L2 Ehlers Rocket RSI IndicatorLevel: 2
Background
John F. Ehlers introuced Rocket RSI Indicator in May, 2018.
Function
In “RocketRSI—A Solid Propellant For Your Rocket Science Trading” in May, 2018, John Ehlers introduces a new take on the classic RSI indicator originally developed by J. Welles Wilder. Ehlers begins by introducing a new version of the RSI based on a simple accumulation of up and down closes rather than averages. To this he applies a Fisher transform. He tells us that the resultant output is statistically significant spikes that indicate cyclic turning points with precision.
With this indicator, overbought and oversold conditions are clear:
## Oversold Entry Condition: Indicator crosses value (RocketRSI crosses over -2.00)
## Overbought Exit Condition: Indicator crosses value (RocketRSI crosses under 2.00)
Note the used “crosses under 2.00” for the exit condition, rather than “crosses above 2.00.” This lets the winning positions ride further, and resulted in a better overall return in backtesting.
Key Signal
RocketRSI --> Ehlers Rocket RSI Indicator fast line
Trigger --> Ehlers Rocket RSI Indicator slow line
Pros and Cons
100% John F. Ehlers definition translation, even variable names are the same. This help readers who would like to use pine to read his book.
Remarks
The 90th script for Blackcat1402 John F. Ehlers Week publication.
Readme
In real life, I am a prolific inventor. I have successfully applied for more than 60 international and regional patents in the past 12 years. But in the past two years or so, I have tried to transfer my creativity to the development of trading strategies. Tradingview is the ideal platform for me. I am selecting and contributing some of the hundreds of scripts to publish in Tradingview community. Welcome everyone to interact with me to discuss these interesting pine scripts.
The scripts posted are categorized into 5 levels according to my efforts or manhours put into these works.
Level 1 : interesting script snippets or distinctive improvement from classic indicators or strategy. Level 1 scripts can usually appear in more complex indicators as a function module or element.
Level 2 : composite indicator/strategy. By selecting or combining several independent or dependent functions or sub indicators in proper way, the composite script exhibits a resonance phenomenon which can filter out noise or fake trading signal to enhance trading confidence level.
Level 3 : comprehensive indicator/strategy. They are simple trading systems based on my strategies. They are commonly containing several or all of entry signal, close signal, stop loss, take profit, re-entry, risk management, and position sizing techniques. Even some interesting fundamental and mass psychological aspects are incorporated.
Level 4 : script snippets or functions that do not disclose source code. Interesting element that can reveal market laws and work as raw material for indicators and strategies. If you find Level 1~2 scripts are helpful, Level 4 is a private version that took me far more efforts to develop.
Level 5 : indicator/strategy that do not disclose source code. private version of Level 3 script with my accumulated script processing skills or a large number of custom functions. I had a private function library built in past two years. Level 5 scripts use many of them to achieve private trading strategy.
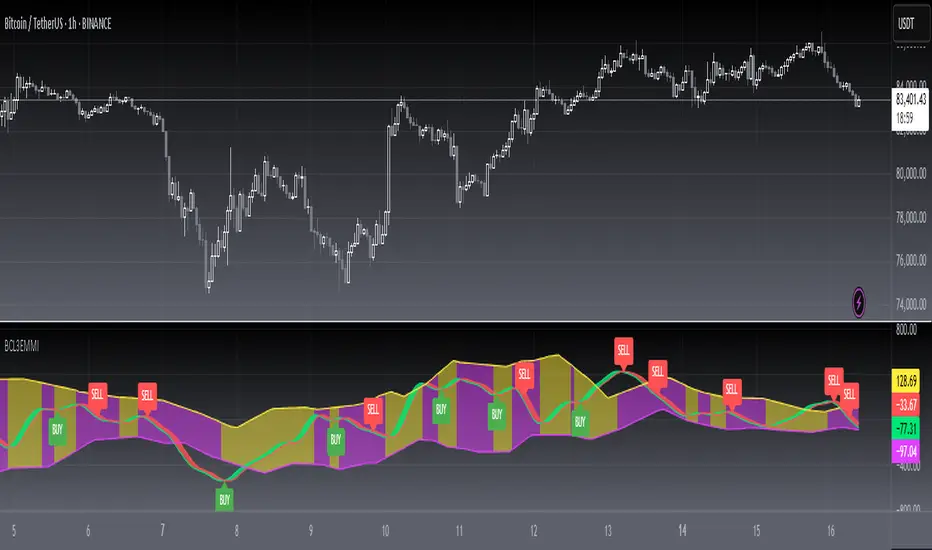
[blackcat] L3 Ehlers Market Mode IndicatorLevel: 3
Background
John F. Ehlers introuced Market Mode Indicator on April, 2012.
Function
This indicator is used to determine whether the market is in a trending or a cyclical mode. This is accomplished by comparing the average value of price, after being filtered to the peaks and valleys of that filtered price. The filter used in this indicator is a second order butterworth filter. For more information on this calculation see "Introducing SwamiCharts" (March 2012) and "Empirical Mode Decomposition" (March 2010) from Technical Analysis of Stocks and Commodities by Dr. Ehlers.
Key Signal
MeanCalc --> short term fast line
MeanCalc(2) --> short term slow line
long ---> long entry signal
short ---> short entry signal
Pros and Cons
NOT 100% John F. Ehlers definition translation, even variable names are the same. This help readers who would like to use pine to read his book.
Remarks
The 80th script for Blackcat1402 John F. Ehlers Week publication.
I kept the core of Ehlers market mode indicator, but add conditons for long and short entries which i think they are reasonable.
Readme
In real life, I am a prolific inventor. I have successfully applied for more than 60 international and regional patents in the past 12 years. But in the past two years or so, I have tried to transfer my creativity to the development of trading strategies. Tradingview is the ideal platform for me. I am selecting and contributing some of the hundreds of scripts to publish in Tradingview community. Welcome everyone to interact with me to discuss these interesting pine scripts.
The scripts posted are categorized into 5 levels according to my efforts or manhours put into these works.
Level 1 : interesting script snippets or distinctive improvement from classic indicators or strategy. Level 1 scripts can usually appear in more complex indicators as a function module or element.
Level 2 : composite indicator/strategy. By selecting or combining several independent or dependent functions or sub indicators in proper way, the composite script exhibits a resonance phenomenon which can filter out noise or fake trading signal to enhance trading confidence level.
Level 3 : comprehensive indicator/strategy. They are simple trading systems based on my strategies. They are commonly containing several or all of entry signal, close signal, stop loss, take profit, re-entry, risk management, and position sizing techniques. Even some interesting fundamental and mass psychological aspects are incorporated.
Level 4 : script snippets or functions that do not disclose source code. Interesting element that can reveal market laws and work as raw material for indicators and strategies. If you find Level 1~2 scripts are helpful, Level 4 is a private version that took me far more efforts to develop.
Level 5 : indicator/strategy that do not disclose source code. private version of Level 3 script with my accumulated script processing skills or a large number of custom functions. I had a private function library built in past two years. Level 5 scripts use many of them to achieve private trading strategy.
Fractal Dimension Indicator - FDIThis script adds two hline parameters to an existing Fractal Dimension Indicator:
New Trend and End of Trend Line
When the FDI value goes above 1.55 a new trend is starting (either bullish or bearish).
When the FDI value goes below 1.35 an existing trend is ending (either bullish or bearish).
The FDI does not tell us which way prices will break, only that a break should be coming soon.

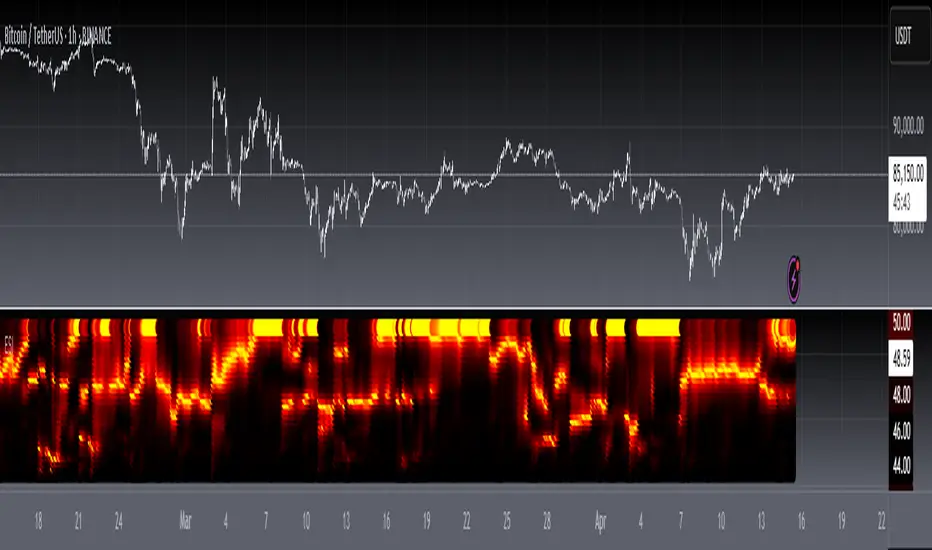
[blackcat] L3 Ehlers Spectrogram IndicatorLevel: 3
Background
John F. Ehlers introuced Dominant Cycle and Spectrogram Indicator in Mar, 2008.
Function
In "Measuring Cycle Periods" in Mar, 2008, John Ehlers presented a very interesting technique of measuring dominant market cycle periods by means of multiple bandpass filtering. By utilizing an approach similar to audio equalizers, the signal (here, the price series) is fed into a set of simple second-order infinite impulse response bandpass filters. Filters are tuned to 8,9,10,...,50 periods. The filter with the highest output represents the dominant cycle. This script implements a high-pass filter and a six-tap low-pass Fir filter on input, then 42 parallel Iir band-pass filters. Finally, it plots the Ehlers spectrogram as a heat map.
Ehlers Spectrogram indicates market power status:
With high market power, the spectrogram become fuzzy;
With low market power, the spectrogram become distinct.
It also discloses market dominant cycles and subcycles, which indicates the major rhythm. Regarding the rhythm of the market, Chinese and Western cultures have reached a consensus: Dr. Ehlers can find the main harmonic components of the market through DSP analysis via spectrum; Master Zen compares the market rhythm to Bach’s fugue from a philosophical perspective, where there is a rhythm of life.
Finally, please allow me to quote Master Zen’s statement on market rhythm:
"The market is cruel. For those who try to violate the market rhythm, the market is their death place; the market is beautiful, and the market is Bach’s fugue. There is a rhythm of life. Rhythm is always the rhythm of the market. A market participant without a sense of rhythm is always torturing. Put aside your greed and fear and listen to the rhythm of the market. In the weekend, let go of everything, but listen to the rhythm of nature, the rhythm of life, the rhythm of music, and then come back to listen to the rhythm of the market. Dancing with the market, your greed and fear are peeled off one by one, you will become very bright."
Key Signal
DomCyc--> Ehlers Dominant Cycle
Plot2~Plot60--> Ehlers Spectrum Heat Map
Pros and Cons
100% John F. Ehlers definition translation, even variable names are the same. This help readers who would like to use pine to read his book.
Remarks
The 73th script for Blackcat1402 John F. Ehlers Week publication.
Readme
In real life, I am a prolific inventor. I have successfully applied for more than 60 international and regional patents in the past 12 years. But in the past two years or so, I have tried to transfer my creativity to the development of trading strategies. Tradingview is the ideal platform for me. I am selecting and contributing some of the hundreds of scripts to publish in Tradingview community. Welcome everyone to interact with me to discuss these interesting pine scripts.
The scripts posted are categorized into 5 levels according to my efforts or manhours put into these works.
Level 1 : interesting script snippets or distinctive improvement from classic indicators or strategy. Level 1 scripts can usually appear in more complex indicators as a function module or element.
Level 2 : composite indicator/strategy. By selecting or combining several independent or dependent functions or sub indicators in proper way, the composite script exhibits a resonance phenomenon which can filter out noise or fake trading signal to enhance trading confidence level.
Level 3 : comprehensive indicator/strategy. They are simple trading systems based on my strategies. They are commonly containing several or all of entry signal, close signal, stop loss, take profit, re-entry, risk management, and position sizing techniques. Even some interesting fundamental and mass psychological aspects are incorporated.
Level 4 : script snippets or functions that do not disclose source code. Interesting element that can reveal market laws and work as raw material for indicators and strategies. If you find Level 1~2 scripts are helpful, Level 4 is a private version that took me far more efforts to develop.
Level 5 : indicator/strategy that do not disclose source code. private version of Level 3 script with my accumulated script processing skills or a large number of custom functions. I had a private function library built in past two years. Level 5 scripts use many of them to achieve private trading strategy.
[blackcat] L2 Ehlers Squelch IndicatorLevel: 2
Background
John F. Ehlers introuced the squelch indicator in Sep, 2000.
Function
This the squelch indicator code is identical to the Hilbert period code , with the addition of the squelch threshold and the display being implemented as a paintbar -- that is, a bar on the chart being colored, depending on the squelch threshold value.
The Pine v4 code for displaying the squelch control as a paintbar for John Ehlers's article, "Squelch Those Whipsaws," can be reproduced in Tradingview by breaking the steps into separate functions. For example, functions can be written to calculate the "InPhase" and "Quadrature" variables, which can then be used in the calculation of the "Phase," "DeltaPhase," and "InstPeriod."
Although paintbars are not a feature of Tradingview, a similar effect can be displayed in a chart by writing a function to determine whether the period is less than 20. This function can then be displayed in main chart to highlight whether the price is in a trend mode or a cycle mode. The squelch period should also prove useful as an input for neural network predictions.
Key Signal
Plot1--> Highlight Period smaller than Squelch Threshold
Plot2--> Highlight Period smaller than Squelch Threshold
Pros and Cons
100% John F. Ehlers definition translation, even variable names are the same. This help readers who would like to use pine to read his book.
Remarks
The 65th script for Blackcat1402 John F. Ehlers Week publication.
Readme
In real life, I am a prolific inventor. I have successfully applied for more than 60 international and regional patents in the past 12 years. But in the past two years or so, I have tried to transfer my creativity to the development of trading strategies. Tradingview is the ideal platform for me. I am selecting and contributing some of the hundreds of scripts to publish in Tradingview community. Welcome everyone to interact with me to discuss these interesting pine scripts.
The scripts posted are categorized into 5 levels according to my efforts or manhours put into these works.
Level 1 : interesting script snippets or distinctive improvement from classic indicators or strategy. Level 1 scripts can usually appear in more complex indicators as a function module or element.
Level 2 : composite indicator/strategy. By selecting or combining several independent or dependent functions or sub indicators in proper way, the composite script exhibits a resonance phenomenon which can filter out noise or fake trading signal to enhance trading confidence level.
Level 3 : comprehensive indicator/strategy. They are simple trading systems based on my strategies. They are commonly containing several or all of entry signal, close signal, stop loss, take profit, re-entry, risk management, and position sizing techniques. Even some interesting fundamental and mass psychological aspects are incorporated.
Level 4 : script snippets or functions that do not disclose source code. Interesting element that can reveal market laws and work as raw material for indicators and strategies. If you find Level 1~2 scripts are helpful, Level 4 is a private version that took me far more efforts to develop.
Level 5 : indicator/strategy that do not disclose source code. private version of Level 3 script with my accumulated script processing skills or a large number of custom functions. I had a private function library built in past two years. Level 5 scripts use many of them to achieve private trading strategy.

[blackcat] L2 Ehlers Hilbert Transformer IndicatorLevel: 2
Background
John F. Ehlers introuced Hilbert Transformer Indicator in his "Cycle Analytics for Traders" chapter 14 on 2013.
Function
Basically, the real component moves with the general direction of the prices, and the imaginary component is a predictive indicator for the real component in the same sense that a cosine wave is a predictor of a sine wave. Although the default LPPeriod input is set to 20 bars in an attempt to smooth the indicator the imaginary component is still too erratic to be useful.
Key Signal
Imag --> Quadrature phase output signal
Real --> In-phase output signal
Pros and Cons
100% John F. Ehlers definition translation, even variable names are the same. This help readers who would like to use pine to read his book.
Remarks
The 58th script for Blackcat1402 John F. Ehlers Week publication.
Readme
In real life, I am a prolific inventor. I have successfully applied for more than 60 international and regional patents in the past 12 years. But in the past two years or so, I have tried to transfer my creativity to the development of trading strategies. Tradingview is the ideal platform for me. I am selecting and contributing some of the hundreds of scripts to publish in Tradingview community. Welcome everyone to interact with me to discuss these interesting pine scripts.
The scripts posted are categorized into 5 levels according to my efforts or manhours put into these works.
Level 1 : interesting script snippets or distinctive improvement from classic indicators or strategy. Level 1 scripts can usually appear in more complex indicators as a function module or element.
Level 2 : composite indicator/strategy. By selecting or combining several independent or dependent functions or sub indicators in proper way, the composite script exhibits a resonance phenomenon which can filter out noise or fake trading signal to enhance trading confidence level.
Level 3 : comprehensive indicator/strategy. They are simple trading systems based on my strategies. They are commonly containing several or all of entry signal, close signal, stop loss, take profit, re-entry, risk management, and position sizing techniques. Even some interesting fundamental and mass psychological aspects are incorporated.
Level 4 : script snippets or functions that do not disclose source code. Interesting element that can reveal market laws and work as raw material for indicators and strategies. If you find Level 1~2 scripts are helpful, Level 4 is a private version that took me far more efforts to develop.
Level 5 : indicator/strategy that do not disclose source code. private version of Level 3 script with my accumulated script processing skills or a large number of custom functions. I had a private function library built in past two years. Level 5 scripts use many of them to achieve private trading strategy.
[blackcat] L2 Ehlers Autocorrelation IndicatorLevel: 2
Background
John F. Ehlers introduced Autocorrelation Indicator in his "Cycle Analytics for Traders" chapter 8 on 2013.
Function
If we correlate a waveform composed of perfectly random numbers by itself, the correlation will be perfect. However, if we lag one of the data streams by just one bar, the correlation will be dramatically reduced. In a long memory process with normally distributed random numbers the autocorrelation follows the power law.
One of the underlying principles of technical analysis is that market data do not follow this power law of an efficient market, and we therefore can extract information from the partial correlation of the autocorrelation function. For example, assume the data being examined is a perfect sine wave whose period is 20 bars. The autocorrelation with zero lag, averaged over one full period of the sine wave, is unity. That is, the correlation is perfect. Introducing a lag of one bar in the autocorrelation process causes the average correlation to be decreased slightly. Introducing another bar of lag further decreases the average correlation, and so on. That is, until a lag of 10 bars is reached. In this case, the positive alternation of the sine wave is correlated with the negative alternation of the lagged waveform and the negative alternation of the sine wave is correlated with the positive alternation of the lagged waveform, with the result that perfect anticorrelation has been reached. Continued lag increases causes the average correlation to increase until a lag of 20 bars is reached. When the lag is equal to the period of the sine wave waveform, the correlation is again perfect. In this theoretical example, the correlation values as a function of lag vary exactly as a sine wave.
Market data are considerably messier than purely random numbers or perfect sine waves but contain features of both. However, the characteristics that are uncovered by autocorrelation offer unique trading perspectives. Aside from appearing psychedelic, there are two distinct characteristics of the autocorrelation indicator using minimum averaging. First, there is a sharp reversal from red to yellow and from yellow to red at the timing of price reversals for all periods of lag. Second, there is a variation of the thickness of the bars and the number of bars over the vertical range of the indicator as a function of time.
Key Signal
Corr --> Pearson correlation data array
Pros and Cons
I am sorry this script is NOT 100% as original Ehlers works but I modified it accordingly which demostrated with better visual effect.
Remarks
The 47th script for Blackcat1402 John F. Ehlers Week publication.
Courtesy of @RicardoSantos for RGB functions.
Readme
In real life, I am a prolific inventor. I have successfully applied for more than 60 international and regional patents in the past 12 years. But in the past two years or so, I have tried to transfer my creativity to the development of trading strategies. Tradingview is the ideal platform for me. I am selecting and contributing some of the hundreds of scripts to publish in Tradingview community. Welcome everyone to interact with me to discuss these interesting pine scripts.
The scripts posted are categorized into 5 levels according to my efforts or manhours put into these works.
Level 1 : interesting script snippets or distinctive improvement from classic indicators or strategy. Level 1 scripts can usually appear in more complex indicators as a function module or element.
Level 2 : composite indicator/strategy. By selecting or combining several independent or dependent functions or sub indicators in proper way, the composite script exhibits a resonance phenomenon which can filter out noise or fake trading signal to enhance trading confidence level.
Level 3 : comprehensive indicator/strategy. They are simple trading systems based on my strategies. They are commonly containing several or all of entry signal, close signal, stop loss, take profit, re-entry, risk management, and position sizing techniques. Even some interesting fundamental and mass psychological aspects are incorporated.
Level 4 : script snippets or functions that do not disclose source code. Interesting element that can reveal market laws and work as raw material for indicators and strategies. If you find Level 1~2 scripts are helpful, Level 4 is a private version that took me far more efforts to develop.
Level 5 : indicator/strategy that do not disclose source code. private version of Level 3 script with my accumulated script processing skills or a large number of custom functions. I had a private function library built in past two years. Level 5 scripts use many of them to achieve private trading strategy.

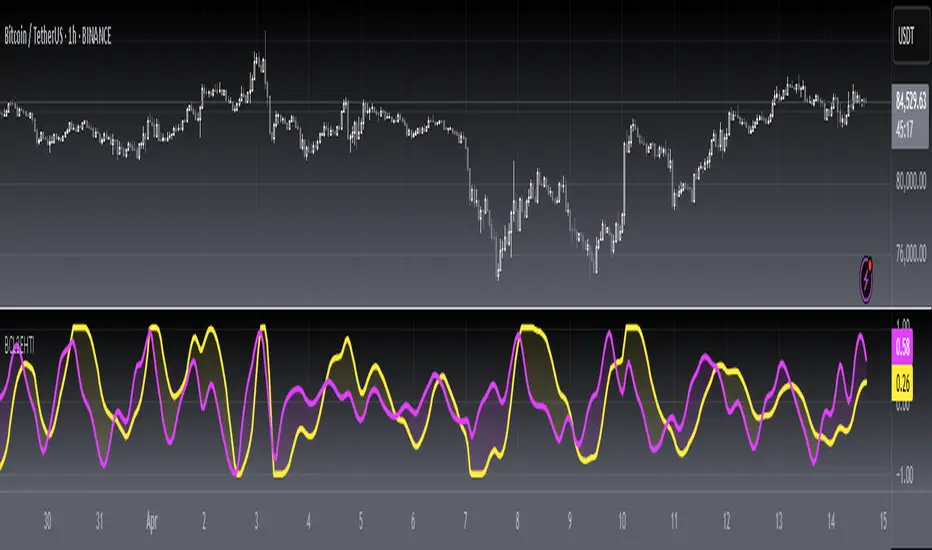
[blackcat] L2 Ehlers Modified RSI IndicatorLevel: 2
Background
John F. Ehlers introuced Modified RSI Indicator in his "Cycle Analytics for Traders" chapter 7 on 2013.
Function
The RSI is the percentage of the sum of the delta closes up to the sum of all the delta closes over the observation period. The only variable here is the observation period. To have maximum effectiveness the observation period should be half of the measured period. If the observation period is half the dominant cycle, then for a pure sine wave, the closes up is exactly equal to the total closes during part of the cycle from the valley to the peak. In this case, the RSI would have a value of 100. During another part of the cycle—the next half cycle—there would be no closes up. During this half cycle, the RSI would have a value of zero. So, in principle, half the measured cycle is the correct choice for the RSI observation period.
A modified RSI that is a standard RSI preceded by a SuperSmoother filter. The modified RSI is far more responsive and has less lag because the low frequency components have have been removed by the high-pass part of the SuperSmoother filter. The RSI is functionally the same as a single-pole high-pass filter because the CU term in the numerator is just a summation of one-bar differences.
Key Signal
MyRSI --> Modified RSI Indicator fast line
Trigger --> Modified RSI Indicator slow line
Pros and Cons
100% John F. Ehlers definition translation of original work, even variable names are the same. This help readers who would like to use pine to read his book. If you had read his works, then you will be quite familiar with my code style.
Remarks
The 45th script for Blackcat1402 John F. Ehlers Week publication.
Readme
In real life, I am a prolific inventor. I have successfully applied for more than 60 international and regional patents in the past 12 years. But in the past two years or so, I have tried to transfer my creativity to the development of trading strategies. Tradingview is the ideal platform for me. I am selecting and contributing some of the hundreds of scripts to publish in Tradingview community. Welcome everyone to interact with me to discuss these interesting pine scripts.
The scripts posted are categorized into 5 levels according to my efforts or manhours put into these works.
Level 1 : interesting script snippets or distinctive improvement from classic indicators or strategy. Level 1 scripts can usually appear in more complex indicators as a function module or element.
Level 2 : composite indicator/strategy. By selecting or combining several independent or dependent functions or sub indicators in proper way, the composite script exhibits a resonance phenomenon which can filter out noise or fake trading signal to enhance trading confidence level.
Level 3 : comprehensive indicator/strategy. They are simple trading systems based on my strategies. They are commonly containing several or all of entry signal, close signal, stop loss, take profit, re-entry, risk management, and position sizing techniques. Even some interesting fundamental and mass psychological aspects are incorporated.
Level 4 : script snippets or functions that do not disclose source code. Interesting element that can reveal market laws and work as raw material for indicators and strategies. If you find Level 1~2 scripts are helpful, Level 4 is a private version that took me far more efforts to develop.
Level 5 : indicator/strategy that do not disclose source code. private version of Level 3 script with my accumulated script processing skills or a large number of custom functions. I had a private function library built in past two years. Level 5 scripts use many of them to achieve private trading strategy.
[blackcat] L2 Ehlers Hurst Coefficient IndicatorLevel: 2
Background
John F. Ehlers introuced Hurst Coefficient Indicator in his "Cycle Analytics for Traders" chapter 6 on 2013.
Function
The Hurst coefficient is one way to attempt to get a handle on the slope of the power density of market data. The Hurst coefficient varies between 0 and 1, and is related to the α power coefficient as H = 1 − α/2. The Hurst coefficient is more estimated than computed. Dr. Ehlers found the estimate using the fractal dimension was the most practical for shorter-term market data. The Hurst coefficient is related to the fractal dimension as H = 2 − D. Dr. Ehlers would like to make it perfectly clear that the Hurst coefficient or the fractal dimension has no direct practical application to trading not only because it is an estimate, but also because it has no predictive value. These computations only reflect the general structure of the market, and the answer you get is dependent on your assumptions. For example, the Hurst coefficient changes dramatically with the length of data used in making the estimate.
The only user input is the length of data to be used. The number can be arbitrarily large if you have sufficient data. The results are critically dependent on the input data length selected. After declaring variables, the coefficients of a 20-bar SuperSmoother filter are computed. The computations of N1, N2, and N3 are as described in the previous section. The fractal dimension is then converted to the Hurst coefficient, which is subsequently smoothed in the SuperSmoother filter.
Key Signal
SmoothHurst --> Hurst Coefficient Indicator fast line
Trigger --> Hurst Coefficient Indicator slow line
Pros and Cons
100% John F. Ehlers definition translation of original work, even variable names are the same. This help readers who would like to use pine to read his book. If you had read his works, then you will be quite familiar with my code style.
Remarks
The 40th script for Blackcat1402 John F. Ehlers Week publication.
Readme
In real life, I am a prolific inventor. I have successfully applied for more than 60 international and regional patents in the past 12 years. But in the past two years or so, I have tried to transfer my creativity to the development of trading strategies. Tradingview is the ideal platform for me. I am selecting and contributing some of the hundreds of scripts to publish in Tradingview community. Welcome everyone to interact with me to discuss these interesting pine scripts.
The scripts posted are categorized into 5 levels according to my efforts or manhours put into these works.
Level 1 : interesting script snippets or distinctive improvement from classic indicators or strategy. Level 1 scripts can usually appear in more complex indicators as a function module or element.
Level 2 : composite indicator/strategy. By selecting or combining several independent or dependent functions or sub indicators in proper way, the composite script exhibits a resonance phenomenon which can filter out noise or fake trading signal to enhance trading confidence level.
Level 3 : comprehensive indicator/strategy. They are simple trading systems based on my strategies. They are commonly containing several or all of entry signal, close signal, stop loss, take profit, re-entry, risk management, and position sizing techniques. Even some interesting fundamental and mass psychological aspects are incorporated.
Level 4 : script snippets or functions that do not disclose source code. Interesting element that can reveal market laws and work as raw material for indicators and strategies. If you find Level 1~2 scripts are helpful, Level 4 is a private version that took me far more efforts to develop.
Level 5 : indicator/strategy that do not disclose source code. private version of Level 3 script with my accumulated script processing skills or a large number of custom functions. I had a private function library built in past two years. Level 5 scripts use many of them to achieve private trading strategy.
[blackcat] L2 Ehlers Leading IndicatorLevel: 2
Background
John F. Ehlers introuced Leading Indicator in his "Cybernetic Analysis for Stocks and Futures" chapter 16 on 2004.
Function
The leading characteristic is present in the net filte.As predicted, the lead is one bar at very low frequencies. That is, the trend indication will lead by one bar. However, the net filter has a lag of approximately 2.5 bars for cycle components near 20-bar cycles. Also, higher-frequency lag settles down to be about half a bar. The interpretation of the lag response is that the filter predicts a continuation of a trend by 1 bar, lags abrupt changes by about 0.5 bars, and lags smooth changes that can be fitted by segments of a 20-bar sinewave by as much as 2.5 bars. That’s the law of physics—you cannot get something for nothing. Causal filters can have a predictive capability over some portion of the frequency response, but not at all frequencies. There is no magic predictor.
Key Signal
NetLead ---> Leading Indicator fast line
EMA ---> Leading Indicator slow line
Pros and Cons
100% John F. Ehlers definition translation of original work, even variable names are the same. This help readers who would like to use pine to read his book. If you had read his works, then you will be quite familiar with my code style.
Remarks
The 35th script for Blackcat1402 John F. Ehlers Week publication.
Readme
In real life, I am a prolific inventor. I have successfully applied for more than 60 international and regional patents in the past 12 years. But in the past two years or so, I have tried to transfer my creativity to the development of trading strategies. Tradingview is the ideal platform for me. I am selecting and contributing some of the hundreds of scripts to publish in Tradingview community. Welcome everyone to interact with me to discuss these interesting pine scripts.
The scripts posted are categorized into 5 levels according to my efforts or manhours put into these works.
Level 1 : interesting script snippets or distinctive improvement from classic indicators or strategy. Level 1 scripts can usually appear in more complex indicators as a function module or element.
Level 2 : composite indicator/strategy. By selecting or combining several independent or dependent functions or sub indicators in proper way, the composite script exhibits a resonance phenomenon which can filter out noise or fake trading signal to enhance trading confidence level.
Level 3 : comprehensive indicator/strategy. They are simple trading systems based on my strategies. They are commonly containing several or all of entry signal, close signal, stop loss, take profit, re-entry, risk management, and position sizing techniques. Even some interesting fundamental and mass psychological aspects are incorporated.
Level 4 : script snippets or functions that do not disclose source code. Interesting element that can reveal market laws and work as raw material for indicators and strategies. If you find Level 1~2 scripts are helpful, Level 4 is a private version that took me far more efforts to develop.
Level 5 : indicator/strategy that do not disclose source code. private version of Level 3 script with my accumulated script processing skills or a large number of custom functions. I had a private function library built in past two years. Level 5 scripts use many of them to achieve private trading strategy.

[blackcat] L2 Ehlers Sine Wave IndicatorLevel: 2
Background
John F. Ehlers introuced Sine Wave Indicator in his "Rocket Science for Traders" chapter 9.
Function
blackcat L2 Ehlers Sine Wave Indicator compared to conventional oscillators such as the Stochastic or Relative Strength Indicator (RSI), the Sinewave Indicator has two major advantages. These are
1. The Sinewave Indicator anticipates the Cycle Mode turning point rather than waiting for confirmation.
2. The phase does not advance when the market is in a Trend Mode. Therefore, the Sinewave Indicator tends to not give false whipsaw signals when the market is in a Trend Mode.
An additional advantage is that the anticipation signal is obtained strictly by mathematically advancing the phase. Momentum is not employed. Therefore, the Sinewave Indicator signals are no more noisy than the original signal.
Key Signal
Smooth --> 4 bar WMA w/ 1 bar lag
Detrender --> The amplitude response of a minimum-length HT can be improved by adjusting the filter coefficients by
trial and error. HT does not allow DC component at zero frequency for transformation. So, Detrender is used to remove DC component/ trend component.
Q1 --> Quadrature phase signal
I1 --> In-phase signal
Period --> Dominant Cycle in bars
SmoothPeriod --> Period with complex averaging
DCPhase ---> dominant cycle phase for sine wave
Pros and Cons
100% John F. Ehlers definition translation of original work, even variable names are the same. This help readers who would like to use pine to read his book. If you had read his works, then you will be quite familiar with my code style.
Remarks
The 8th script for Blackcat1402 John F. Ehlers Week publication.
Readme
In real life, I am a prolific inventor. I have successfully applied for more than 60 international and regional patents in the past 12 years. But in the past two years or so, I have tried to transfer my creativity to the development of trading strategies. Tradingview is the ideal platform for me. I am selecting and contributing some of the hundreds of scripts to publish in Tradingview community. Welcome everyone to interact with me to discuss these interesting pine scripts.
The scripts posted are categorized into 5 levels according to my efforts or manhours put into these works.
Level 1 : interesting script snippets or distinctive improvement from classic indicators or strategy. Level 1 scripts can usually appear in more complex indicators as a function module or element.
Level 2 : composite indicator/strategy. By selecting or combining several independent or dependent functions or sub indicators in proper way, the composite script exhibits a resonance phenomenon which can filter out noise or fake trading signal to enhance trading confidence level.
Level 3 : comprehensive indicator/strategy. They are simple trading systems based on my strategies. They are commonly containing several or all of entry signal, close signal, stop loss, take profit, re-entry, risk management, and position sizing techniques. Even some interesting fundamental and mass psychological aspects are incorporated.
Level 4 : script snippets or functions that do not disclose source code. Interesting element that can reveal market laws and work as raw material for indicators and strategies. If you find Level 1~2 scripts are helpful, Level 4 is a private version that took me far more efforts to develop.
Level 5 : indicator/strategy that do not disclose source code. private version of Level 3 script with my accumulated script processing skills or a large number of custom functions. I had a private function library built in past two years. Level 5 scripts use many of them to achieve private trading strategy.