HMA Z-Score Probability Indicator by Erika BarkerThis indicator is a modified version of SteverSteves's original work, enhanced by Erika Barker. It visually represents asset price movements in terms of standard deviations from a Hull Moving Average (HMA), commonly known as a Z-Score.
Key Features:
Z-Score Calculation: Measures how many standard deviations the current price is from its HMA.
Hull Moving Average (HMA): This moving average provides a more responsive baseline for Z-Score calculations.
Flexible Display: Offers both area and candlestick visualization options for the Z-Score.
Probability Zones: Color-coded areas showing the statistical likelihood of prices based on their Z-Score.
Dynamic Price Level Labels: Displays actual price levels corresponding to Z-Score values.
Z-Table: An optional table showing the probability of occurrence for different Z-Score ranges.
Standard Deviation Lines: Horizontal lines at each standard deviation level for easy reference.
How It Works:
The indicator calculates the Z-Score by comparing the current price to its HMA and dividing by the standard deviation. This Z-Score is then plotted on a separate pane below the main chart.
Green areas/candles: Indicate prices above the HMA (positive Z-Score)
Red areas/candles: Indicate prices below the HMA (negative Z-Score)
Color-coded zones:
Green: Within 1 standard deviation (high probability)
Yellow: Between 1 and 2 standard deviations (medium probability)
Red: Beyond 2 standard deviations (low probability)
The HMA line (white) shows the trend of the Z-Score itself, offering insight into whether the asset is becoming more or less volatile over time.
Customization Options:
Adjust lookback periods for Z-Score and HMA calculations
Toggle between area and candlestick display
Show/hide probability fills, Z-Table, HMA line, and standard deviation bands
Customize text color and decimal rounding for price levels
Interpretation:
This indicator helps traders identify potential overbought or oversold conditions based on statistical probabilities. Extreme Z-Score values (beyond ±2 or ±3) often suggest a higher likelihood of mean reversion, while consistent Z-Scores in one direction may indicate a strong trend.
By combining the Z-Score with the HMA and probability zones, traders can gain a nuanced understanding of price movements relative to recent trends and their statistical significance.
חפש סקריפטים עבור "indicator"

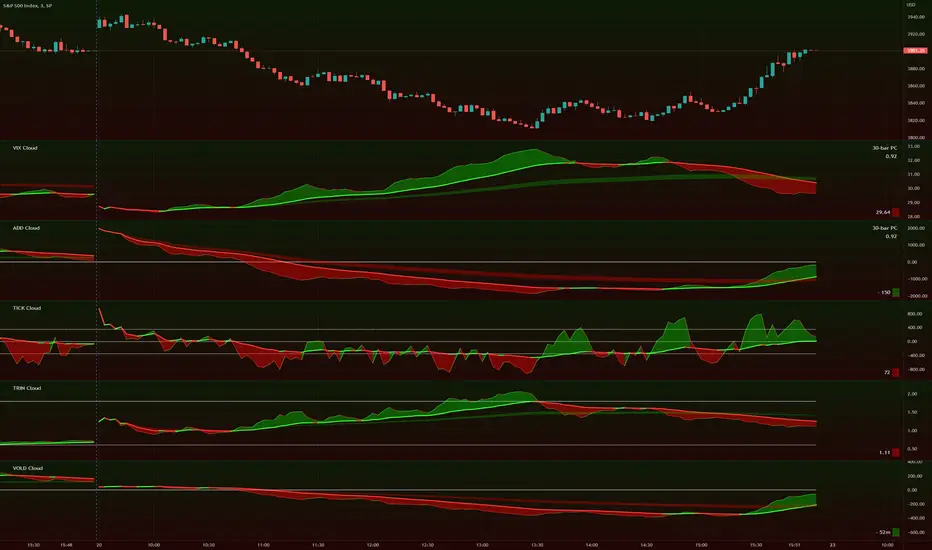
TIG's Market Internals Clouds Indicator v2.0=================================
== GENERAL INTRODUCTION
=================================
If you find market internals inform your intraday trading decisions (SPX, ES futures, SPY or more generally) this may be helpful.
Currently available internals are:
- ADD
- TICK
- TRIN
- VIX
- VOLD
Also, you can display your favorite alternative market internal (or BTC, if you want?!) by entering the relevant ticker in the 'Custom' field
=================================
== NOTES
=================================
The default EMA lengths seem to work reasonably well for 1, 2, 3-minute timeframes (except for TICK - you may wish to apply a bit more smoothing to TICK to reduce the noise)
Of course; you can add this indicator to your chart multiple times, and display a different internal each time.
The default Text Color is set as a mid-grey, which is readable in both TV color schemes. I prefer dark mode, and so I change the text color to white. You can't see the scheme setting from within a script, unfortunately, so this can't be automated.
=================================
== EXPERIMENTAL FEATURE
=================================
As a free bonus, the indicator can display the 30-bar (default) Pearson Correlation Coefficient between the internal, and price action (based on the super-fast EMA, to give a bit of smoothing). This may give a clue as to whether or not the market is aligned with what the internal is doing, or if the market (today) is not correlated with the particular internal.
Very roughly speaking:
- 0.50 means that 50% of the price action can be explained by reference to the internal. This is about the same level of correlation between VIX and Actual Move
- 0.80 suggests pretty strong correlation
I don't know why (yet) but sometimes this works, and sometimes it doesn't display a sensible figure.
=================================
== QUESTIONS AND FEEDBACK
=================================
If you have any general questions about market internals, Google is your friend.
If you have any specific queries, bug reports, feature requests or general feedback about this indicator please leave a comment below, and I'll get back to you ASAP!
CRYPTO MARKET SESSION ANALYZER INDICATORCrypto Market Session Analyzer is an easy-to-use yet powerful analysis tool that helps the trader visualize and analyze price movements over three different trading sessions:
1) European Session
2) US session
3) Asian session
Automatically tracks the corresponding levels for each market session.
This indicator can be used on all timeframes equal to or less than 15 minutes.
Although this is a simple indicator to use, some care must be taken when using it. The trader must be careful to set the correct times for each session according to his UTC timezone. By default the indicator uses UTC. If your console is set to UTC + 2 for example, you will need to take this into account and align the times correctly. You can adjust the time for each session from the user interface. Following the example, if the opening of the UE session is set to 9 and UTC of your console is set to UTC + 2, the script will proceed to create the level at opening time 11.
HOW IT WORK
The indicator automatically draws a horizontal line at the open and a horizontal line at the close of each session. The indicator clears past support and resistance every 24 hours to provide a clean and easy-to-read chart, updating new levels session after session.
Blue indicates the EU session.
Orange indicates the US session.
Purple indicates the Asian session.

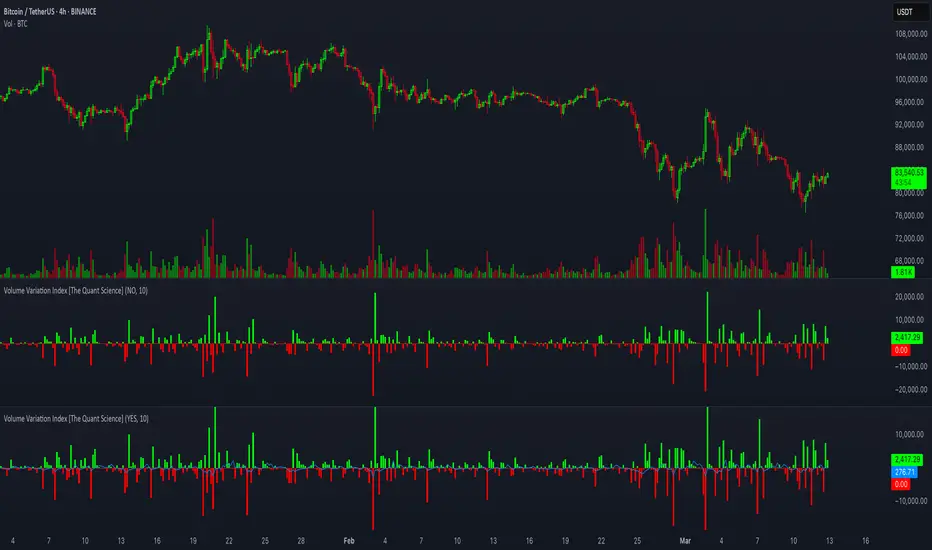
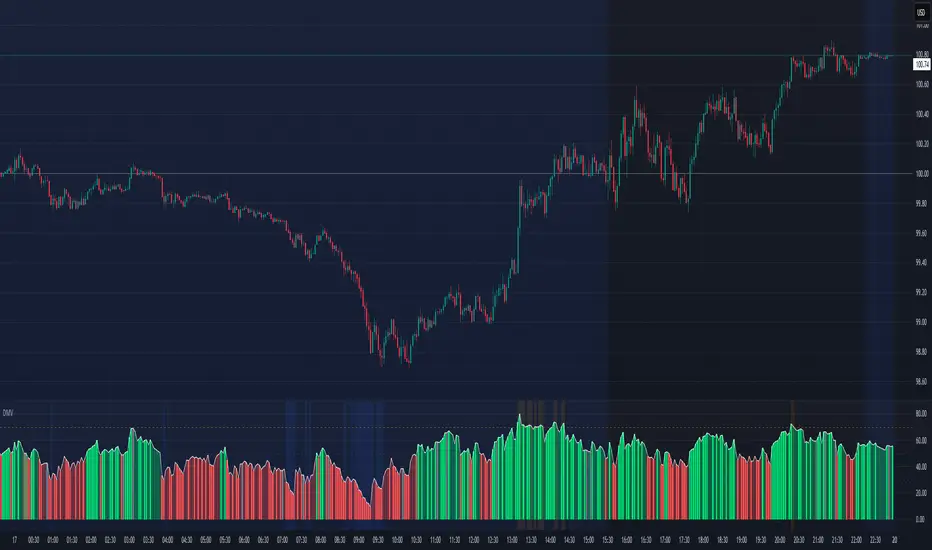
Volume Variation Index IndicatorThis tool is a quantitative tip for analysts who study volumes or create volume based trading strategies.
Like all our projects, we start with a statistical logic to which we add coding logic.
This indicator can save a huge amount of time in calculating the variation of volume between sessions .
How it work
The indicator calculates the difference between the volume of the last closing bar and the volume of the previous closing bar. It shows the difference between the trading volumes.
The session in which the trading volume is up are represented in green.
Red session represent trading volume down.
We have added a third function.
Through the User Interface the trader can activate or deactivate the variation average.
The indicator is able to calculate the average of the volume changes by representing it with a blue line.
To activate the average, simply set it to ON in the User Interface.
By default, the indicator calculates the average of the last 10 periods, but you are free to set this parameter in the User Interface.
Data access
To access the data, simply move the cursor. When you move the cursor over the green bars, the increase data will be displayed in green. By hovering the cursor over the red bars you will see the decrease data in red. By hovering the cursor over the average will show you the average data in blue.
The data is displayed in the top left corner of the indicator dashboard.
If you found this indicator helpful, please like our script.
Anomaly Indicator V1.1 The Anomaly Indicator is an idea I recently come up with. Its very simple, yet it can be extremely useful. The Anomaly indicator detects the current and general trend channels. When the yellow line which is the current channel, exits the general channel this will usually mean an anomaly. Anomalies can vary within meaning, from a trend reversal, a market change (trending or rangebound) and lastly it can also give you an entering point. You can even use it to know the volatility of the market.
This is a very early version of the indicator and has pre-set values. I personally use it among a 5 minute chart for daytrading.
NOTE : Have in mind my indicator as ny other is not perfect, it might give fake signals. I suggest using Williams Alligator, and RSI with it. Best of luck. Follow my predictions under your own risk.

Action Section, Volatility Choppiness Indicator (by ChartArt)Here is a solution to find entry points to trade. This indicator highlights price sections with low choppiness, where both the ADX (Average Directional Index) indicator shows strong movement (up or down!) in the price and a customized Money Flow indicator (which uses only the change of the volume not the change of the price, hence a Volume Flow indicator), also shows volatility is present. Using higher filter values than the default setting of "30" reduces the noise, but also shows less 'action sections'. Vice versa using values lower than "30" increases the amount and duration of action sections which are shown.
The "action section" indicator does not show the direction if the price is going up or down. It shows if there is enough action worthy the time to trade (lower odds of a neutral sideways trend). Therefore in addition a Heikin-Ashi based price change indicator can optionally be plotted, which shows the actual direction of the price.
Action Section, High Volume Volatility & Low Price Choppiness Indicator
This indicator works only on charts which have volume data.

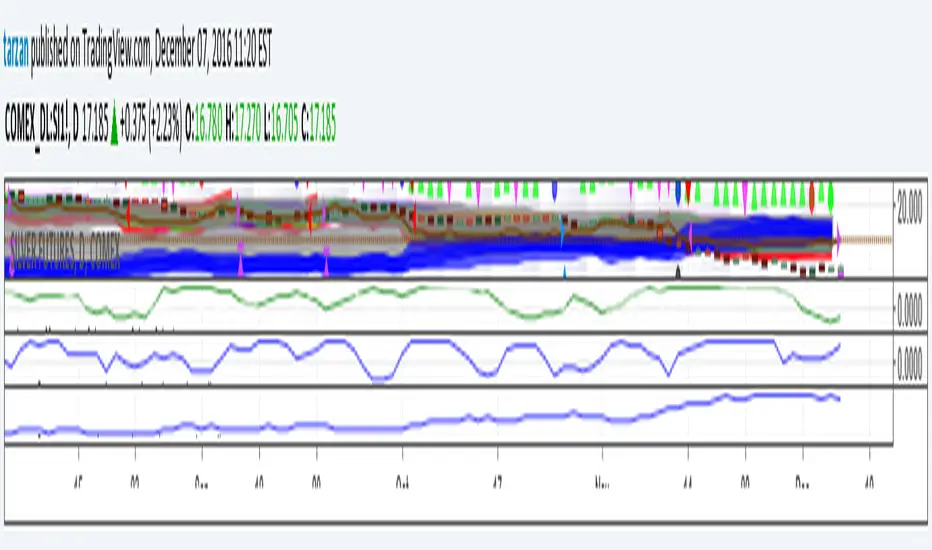
Tarzan's spread ratio indicator - DeLuxeThis indicator plots any two securities as a spread ratio using either +,-,/, or *.
It also allows you to use a simple moving average of length 1 to n for your spread ratio.
If you know what you want to do but don't know how to code it, we can work it out, you can float me some cheese on paypal and I'll do a nice job. This indicator is yours for free.
Tarzan = noprism@hushmail.com
Peace
BB and RSI Indicator Alert v0.3 by JustUncleLI have just recently revised this indicator alert for public release. This is for the 60sec Bollinger Band break Binary Option traders.
This indicator alert is a variation of one found in a well known Broker's marketing videos. It uses Bollinger bands, RSI and moving averages. Included is a pre-warning alert condition. The strategy and settings are designed for 1min charts and Binary Options, but it could work for up to 15 min charts.
The default settings are BB(14,2) and RSI(11) with 75/25 Levels boundaries. To be a valid trade the RSI needs to be within 75/25 channel. The optional Market direction filter is enabled by default and is calculated by two EMA (200 and 50):
When 200ema rising and 50ema above 200ema then market going up.
When 200ema falling and 50ema below 200ema then market going down.
A potential Bollinger Break reversal trades identified by shapes: The purple diamond is the pre-warning purple alert and the green and red pointers with the PUT/CALL labels are the trade alerts. Make Binary Option trade in specified direction 60sec (or can also use 120sec trade without Martingale).
* Notes and Hints *
The original videos specified a Martingale money management strategy, be careful using this management. When I use Martingale I recommend go to 3 levels: 10, 25, 65 if no win at 65 stop trading this alert and start next alert back at 10, you should recovery loss by future wins given you are able to get a reasonable ITM rate with this strategy. Alternatively instead of using Martingale use 120sec Binary Option trade.
Be wary of break alerts on a steep Bollinger, they tend to keep running away for awhile, especially if steep on both sides of Bollinger channel.
As with most of this style of indicator the alert conditions will redraw until the candle is closed. For me this is okay, as it is an Alert is only to a potential trade and final decision to trade is made by me.
You need to practise this and be aware of market news, sessions boundaries, slow trading periods etc. Plan your periods of when you should trade, I prefer Asian session before lunch and London sessions.

Currency Strength IndicatorSimple but effective don't pay $300 for an MT4 indicator when you can use this for free. Feel free to make it your own!

KDJ Indicator - @iamaltcoinThis indicator is a mimic of the same used by bitcoinwisdom.
There seems to be several different formulas to calculate KDJ, however, i have yet to find this one on tradingview.
The background color is green when J>D and red when J

TTM Scalper Indicator v2.0 TTM scalper indicator of John Carter’s Scalper Buys and Sells. The methodology
is a close approximation of the one described in his book Mastering the Trade.
The book is highly recommended. Note the squares are not real-time but will
show up once the third bar has confirmed a reversal.

TTM Scalper Indicator TTM scalper indicator of John Carter’s Scalper Buys and Sells. The methodology
is a close approximation of the one described in his book Mastering the Trade.
The book is highly recommended. Note the squares are not real-time but will
show up once the third bar has confirmed a reversal.

Indicator 102#M3indicator based on Daily and weekly fib Level. Initial Breakout and breakdowns have been denoted as well

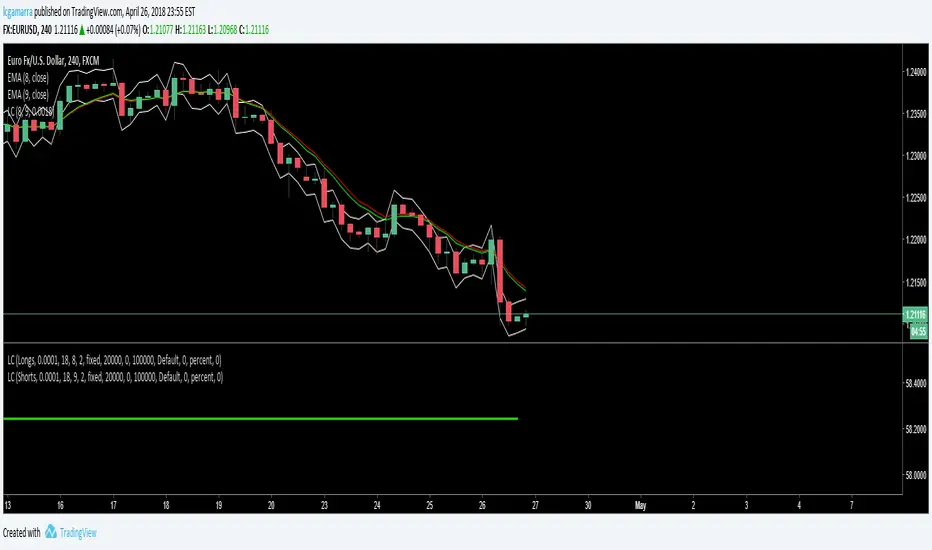
Indicator for Short & Long EntriesIndicator for Short & Long Entries based on:
- Volume
- Close Price
- Ema
- RSI
Feel free to test it out. The parameters are:
- Back Bars Long.- number of bars back to consider for long entries
- Back Bars Short.- number of bars back to consider for long entries
These are used to calculate the ema and rsi.
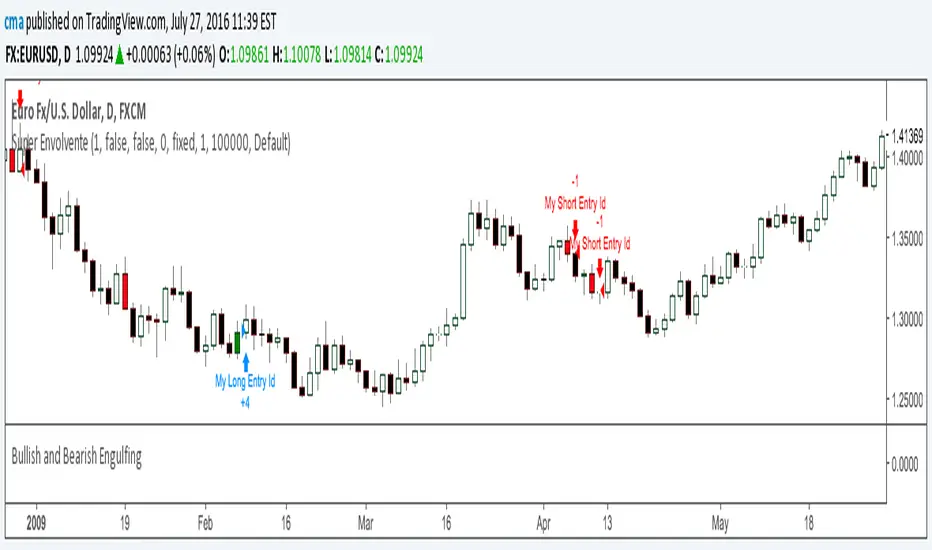
Bullish and Bearish EngulfingIndicator that changes the bar's color to green if there is a Bullish Engulfing or Red if there a Bearish Engulfing Patterns.

Bullish and Bearish EngulfingIndicator that changes the bar's color to green if there is a Bullish Engulfing or Red if there a Bearish Engulfing Patterns.
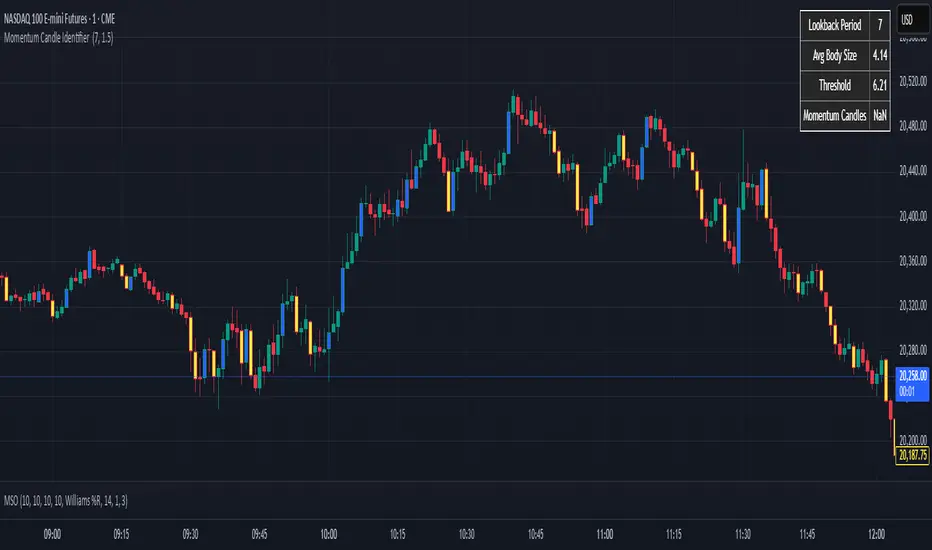
Momentum Candle Identifier # Momentum Candle Identifier
This indicator helps traders identify significant momentum candles by analyzing candle body size relative to recent price action (think after consolidation periods). Unlike traditional volatility indicators, this tool specifically focuses on price movement captured by the candle body (open to close distance), filtering out potentially misleading wicks.
## How It Works
- The indicator calculates the average candle body size over a user-defined lookback period
- Momentum candles are identified when their body size exceeds the average by a customizable threshold multiplier
- Bullish momentum candles (close > open) are highlighted in a user defined color
- Bearish momentum candles (close < open) are highlighted in a user defined color
- A real-time information panel displays key metrics including current average body size and threshold values
## Key Features
- Focus on candle body size rather than full range (high to low)
- Custom lookback period to adapt to different timeframes
- Adjustable threshold multiplier to fine-tune sensitivity
- Customizable colors for bullish and bearish momentum candles
- Optional labels for momentum candles
- Information panel showing lookback settings, average size, and momentum candle count
## Usage Tips
- Use shorter lookback periods (3-5) for more signals in choppy markets
- Use longer lookback periods (8-20) to identify only the most significant momentum moves
- Higher threshold multipliers (2.0+) will identify only the strongest momentum candles
- Combine with trend indicators to find potential reversal or continuation signals
- Look for clusters of momentum candles to identify strong shifts in market sentiment
This indicator helps identify candles that represent significant price movement relative to recent activity, potentially signaling changes in market momentum, sentiment shifts, or the beginning of new trends.
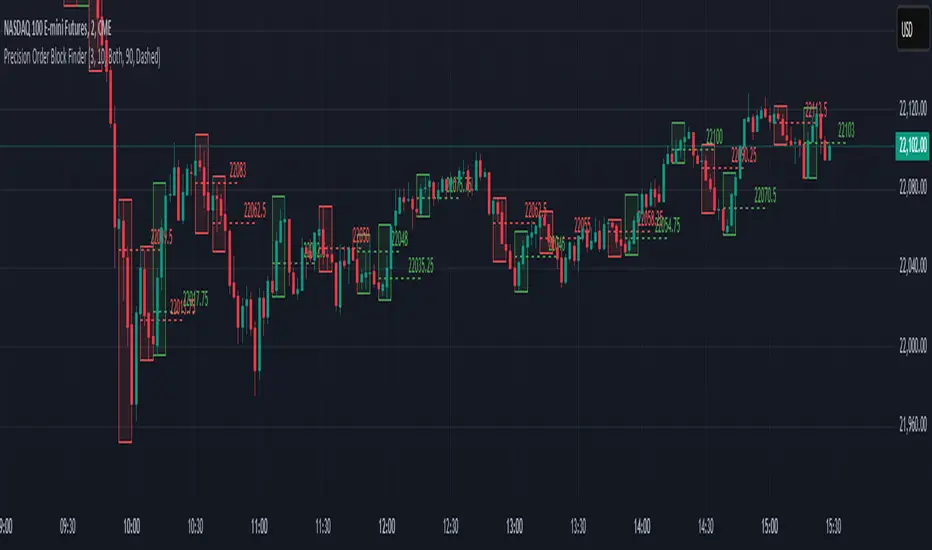
Precision Order Block FinderPrecision Order Block Finder
This advanced indicator identifies high-probability Order Block patterns with customizable confirmation parameters for increased precision and reliability. Unlike basic Order Block indicators, this tool allows you to specify the exact confirmation criteria needed before marking a pattern as valid.
Key Features:
Detects both bullish and bearish Order Block patterns
Customizable confirmation candle settings (1:3 ratio by default)
Adjustable visual properties including transparency and line styles
Optional price labels for quick reference
Filter options to display only bullish, bearish, or both pattern types
How It Works:
The indicator identifies potential Order Blocks by locating a trigger candle (bearish for bullish patterns, bullish for bearish patterns) followed by your specified number of confirmation candles in the opposite direction. This multi-candle confirmation approach helps filter out false signals and focuses on the most reliable trading opportunities.
Perfect for both swing and intraday traders looking to identify key market turning points with greater accuracy. The visual representation clearly highlights potential entry zones and price targets to streamline your trading decisions.
Adjust the settings to match your trading style and timeframe preferences for optimal results.
Directional Momentum VisualizerDescription
This script provides a color-coded column visualization of a classic momentum oscillator that measures relative strength and weakness. Instead of a single line, it uses conditional coloring to make directional changes easier to identify at a glance.
The tool is designed for clarity and adaptability, offering both column and line displays, with optional overbought, oversold, and midpoint guides.
How It Works
The script evaluates the oscillator’s value relative to a midpoint and its previous reading.
Depending on whether it’s above or below the midpoint — and whether it’s rising or falling — each column changes color:
Strong upward momentum (above midpoint and rising) → bright green
Fading upward momentum (above midpoint but falling) → pale green
Strong downward momentum (below midpoint and falling) → bright red
Fading downward momentum (below midpoint but rising) → pale red
Unchanged from the previous value → gray
This structure makes momentum shifts instantly visible without relying on line crossings or alerts.
Key Features
Color-coded momentum columns for instant visual interpretation
Adjustable midpoint, overbought, and oversold levels
Optional line overlay for smoother reference
Dynamic background highlighting in extreme zones
Works on any symbol or timeframe
Inputs Overview
Length: Controls the sensitivity of the oscillator calculation.
Source: Selects the price source (Close, HL2, etc.).
Midpoint Level: Defines the central reference level separating bullish and bearish momentum.
Show Line: Toggles visibility of the traditional line overlay.
Overbought / Oversold Levels: Define upper and lower boundaries for potential exhaustion zones.
How to Use
Add the script to your chart from the Indicators tab.
Adjust the midpoint and level settings to fit your preferred configuration.
Observe how column colors shift to reflect strength or weakness in momentum.
Use these transitions as visual context, not as trade signals.
How it Helps
This visual approach offers a clearer perspective on momentum dynamics by replacing the traditional single-line display with color-coded columns. The conditional coloring instantly reveals whether momentum is strengthening or weakening around a chosen midpoint, making trend shifts and fading pressure easier to interpret at a glance. It helps reduce visual noise and allows for quicker, more intuitive analysis of market behavior.
This tool is intended purely as a visual aid to help identify changing momentum conditions at a glance. It is not a buy or sell signal generator and should be used in combination with other forms of analysis and sound risk management.
⚠️ Disclaimer:
This script is provided for educational and informational purposes only. It is not financial advice and should not be considered a recommendation to buy, sell, or hold any financial instrument. Trading involves significant risk of loss and is not suitable for every investor. Users should perform their own due diligence and consult with a licensed financial advisor before making any trading decisions. The author does not guarantee any profits or results from using this script, and assumes no liability for any losses incurred. Use this script at your own risk.
Market Efficiency DashboardDescription
This indicator is an analytical tool designed to visualize the relationship between price action and market efficiency. Based on the Choppiness Index (CI), this indicator identifies whether the market is in a state of Range Contraction (Consolidation) or Range Expansion (Trending) . This implementation introduces a unique 50-pivot baseline to better differentiate between these two market characters, providing traders with an objective view of volatility cycles.
Key Features
Volatility Cycle Logic: A refined implementation of the Choppiness Index that assists in filtering market noise during low-volatility periods.
Pivot-50 Visualization: A custom geometric layout that separates range contraction from trend expansion for faster visual interpretation.
Multi-Timeframe (MTF) Data Handling: Enables the monitoring of higher-timeframe efficiency cycles without switching charts.
Trend Context Filter: Integrates a 200-period EMA to provide a directional baseline relative to the current market state.
Real-Time Status Dashboard: A real-time data table providing a summary of current market efficiency and trend bias.
Signal Refinement: Includes optional smoothing (EMA/SMA/WMA) to reduce calculation "jitter" and provide clearer structural signals.
Inputs Overview
Choppiness Length: Sets the lookback period for the efficiency calculation (Default: 14).
Calculation Timeframe: Allows the user to select the source timeframe for the index data.
Smoothing Method: Users can choose between multiple moving average types to filter the raw index output.
Threshold Levels: Customizable Fibonacci-based levels (61.8 and 38.2) used to define the boundaries of "Choppy" and "Trending" environments.
EMA Filter: Toggle for the 200-period Exponential Moving Average used for directional bias.
How to Use
Context Identification: Observe the histogram’s position relative to the 50-pivot. Bars expanding upward toward the 61.8 level indicate the market is coiling/congested.
Trend Confirmation: Bars expanding downward toward the 38.2 level indicate the market is moving efficiently in a specific direction.
Bias Alignment: When the Trend Bias is Bullish and the state is Trending, price discovery is likely occurring to the upside. Conversely, a Bearish bias in a Trending state suggests efficient movement to the downside.
Risk Management: Rising choppiness levels often precede a period of trend exhaustion or reversal, signaling a potential time to reduce exposure.
How it Helps
This tool is designed to assist in objective decision-making by identifying the current "market character." By distinguishing between trending and non-trending environments, it helps traders select the appropriate strategy for the current context—avoiding trend-following entries during sideways markets and identifying when a market has entered a period of price expansion.
Alerts
Trend Starting: Triggers when the index crosses below the lower threshold, suggesting a transition into an efficient trend.
Squeeze/Consolidation: Notifies the user when the index crosses above the upper threshold, indicating range contraction.
Midpoint Cross: Signals when the index crosses the 50-level, marking a shift in market momentum.
⚠️ Disclaimer:
This script/indicator is not endorsed by, affiliated with, sponsored by, or connected to TradingView in any manner. The author is not a TradingView partner.
This script/indicator and all related content are provided “as is” and “as available,” without any warranties of any kind, express or implied. The content is strictly for educational and informational purposes and does not constitute financial, investment, trading, or legal advice.
The author makes no representations or guarantees regarding accuracy, reliability, profitability, or future performance. Use of this script/indicator is entirely at the user’s own risk, and the author assumes no liability for any losses, damages, or financial consequences arising from its use.

Candlestick Patterns Dashboard Pro+ [ULTIMATE]Unleash the power of automated candlestick analysis with the most comprehensive and customizable pattern detection tool on TradingView. This is not just another pattern scanner; it's a complete trading dashboard designed to identify, score, and confirm high-probability setups, saving you hours of manual chart analysis.
Built with performance and reliability in mind, this script goes beyond simple detection by introducing a unique reliability score for every pattern, advanced confirmation filters, and a powerful on-screen dashboard to keep you informed.
Key Features
📈 Comprehensive Pattern Detection: Automatically identifies 13 of the most effective candlestick patterns, including Bullish/Bearish Engulfing, Hammer, Shooting Star, Doji, Morning/Evening Star, and more.
🔟 Dynamic Reliability Scoring: Every pattern is assigned a score from 1-10 based on its confirmation strength. Factors include candle body size, volume confirmation, trend alignment, and higher-timeframe confluence, giving you a quantifiable measure of a pattern's potential.
📊 The Ultimate Dashboard: Your at-a-glance command center. The on-screen dashboard provides a complete summary of all active patterns, showing you exactly when they last occurred and highlighting the most recent signals. It also includes an "Overall Bias" meter for a quick sentiment check.
🛡️ Trade Smarter with Advanced Confirmation Filters: Eliminate low-quality signals and focus on what matters.
Trend Alignment: Use SMA(50) and SMA(200) to only show patterns that agree with the dominant market trend.
Volume Confirmation: Validate patterns by requiring a surge in volume.
Non-Repainting HTF Confirmation: Ensure your patterns align with the trend on a higher timeframe (e.g., Daily trend for a 4H signal) using a reliable, non-repainting method.
Market Condition Filter: Isolate patterns that occur only in "Trending" or "Ranging" markets.
Time Filter: Restrict pattern detection to specific trading sessions.
🔧 ‘Fuzzy Logic’ for Real-World Trading: Textbook patterns are rare. Use the "Fuzzy Logic" settings to adjust the criteria for patterns like the Hammer, Piercing Line, and Doji, allowing you to catch imperfect but still valid real-world formations.
⚙️ Fully Customizable Scoring: You decide what's important! Adjust the bonus scores for volume, trend, and other factors to create a scoring system that perfectly aligns with your trading strategy.
🚨 Powerful & Customizable Alerts: Never miss an opportunity.
Create alerts for any individual pattern.
Get notified of "Pattern Clusters" when multiple bullish or bearish signals appear in close succession.
Customize the alert messages to be compatible with your favorite trading automation services.
🚀 Performance Optimized: A "Max Bars Back" setting ensures the script runs smoothly and efficiently, even on lower-end devices or extensive historical data.
How To Use This Indicator
For Confirmation: The primary strength of this tool is for confirmation. Do not trade based on patterns alone. Use the detected signals to confirm your own analysis, such as a pattern appearing at a key support/resistance level, a trendline, or a Fibonacci retracement. A Bullish Engulfing pattern at a major support level is a much stronger signal than one appearing in the middle of a range.
For Discovery: Use the Dashboard to quickly scan through your favorite assets. A dashboard full of recent bullish signals on one asset, and bearish on another, can instantly help you focus your attention for the day.
Customizing for Your Style:
Start with the Market Presets ("Forex," "Stocks," "Crypto") for a solid baseline.
Dive into the Scoring Weights to tell the indicator what you value most. A pure volume trader might increase the Volume Bonus score.
Adjust the Fuzzy Logic settings based on your market's volatility. A volatile crypto market might require a more lenient Doji definition than a stable blue-chip stock.
Setting Up Alerts:
Add the indicator to your chart.
Click the "Alert" button in the TradingView toolbar.
Set the "Condition" to "Candlestick Patterns Dashboard Pro+ ".
Choose the specific alert you want from the dropdown (e.g., "Bullish Pattern Detected," "Bearish Pattern Cluster").
Customize the message if needed and click "Create."
A Note of Thanks
This script began as a personal project and has evolved into this ultimate version thanks to invaluable community feedback, bug reports, and suggestions. A special thank you to the users who helped identify and fix critical bugs related to syntax and variable scope. This collaborative effort has made the indicator more robust and reliable for everyone.
Disclaimer: This tool is for educational and analytical purposes only. All trading involves substantial risk. Past performance is not indicative of future results. Please trade responsibly.

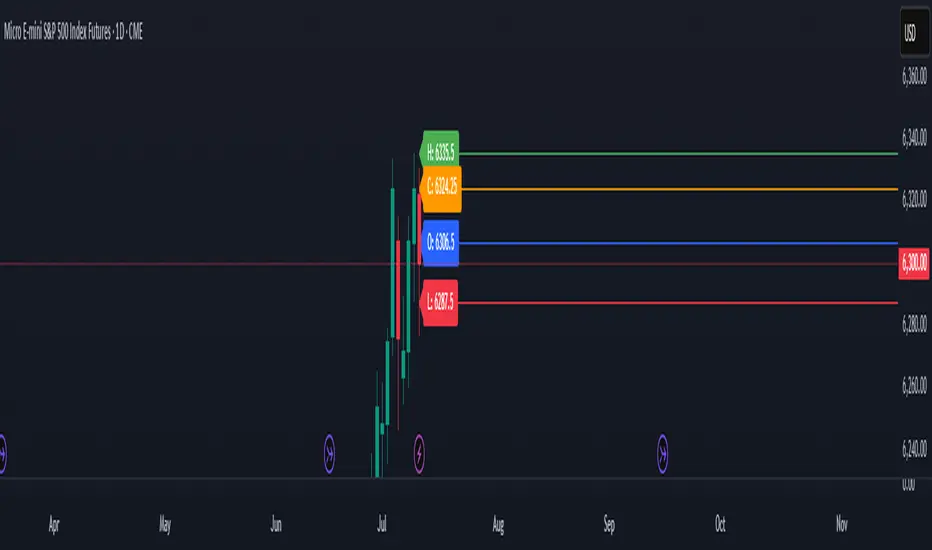
Previous Day OHLC# Previous Day OHLC Levels Indicator
## Overview
The Previous Day OHLC indicator is a simple yet powerful tool that plots the Open, High, Low, and Close levels from previous trading sessions. This indicator helps traders identify key support and resistance levels based on historical price action, making it easier to spot potential reversal zones and breakout levels.
## Key Features
### 📊 **Previous Day OHLC Levels**
- Displays the Open, High, Low, and Close prices from 1-5 days ago
- Lines automatically extend to the right for easy visualization
- Updates daily to show the most relevant levels
### 🎨 **Fully Customizable Styling**
- **Individual Line Colors**: Choose unique colors for each OHLC level
- **Line Styles**: Select from Solid, Dashed, or Dotted lines for each level
- **Line Width**: Adjust thickness from 1-4 pixels for better visibility
- **Price Labels**: Display actual price values on each line with customizable sizing
### ⚙️ **Flexible Settings**
- **Lookback Period**: Choose to display levels from 1-5 days ago (maximum safety limit)
- **Label Control**: Toggle price labels on/off and adjust their size
- **Performance Optimized**: Clean code that won't slow down your charts
## How to Use
1. **Add to Chart**: Apply the indicator to any timeframe chart
2. **Customize Settings**: Adjust colors, styles, and lookback period to your preference
3. **Identify Levels**: Use the plotted lines as potential support/resistance zones
4. **Trade Setup**: Look for price reactions at these key levels for entry/exit signals
## Best Practices
- **Day Trading**: Use 1-day lookback for intraday support/resistance
- **Swing Trading**: Extend lookback to 2-5 days for broader context
- **Multi-Timeframe**: Combine with other timeframe analysis for confirmation
- **Risk Management**: Use these levels for stop-loss and take-profit placement
## Color Coding (Default)
- **Open**: Blue - Starting price of the previous session
- **High**: Green - Highest price reached
- **Low**: Red - Lowest price reached
- **Close**: Orange - Final price of the session
## Why This Indicator Works
Previous day OHLC levels are among the most watched price points by professional traders. These levels often act as:
- **Support/Resistance**: Price tends to react at these historical levels
- **Breakout Confirmation**: Strong moves beyond these levels can signal trend continuation
- **Reversal Zones**: Price often bounces from these key levels
- **Psychological Levels**: Market participants remember these important price points
## Technical Specifications
- **Pine Script Version**: v6
- **Overlay**: Yes (plots directly on price chart)
- **Performance**: Optimized for smooth chart operation
- **Compatibility**: Works on all timeframes and instruments
Perfect for traders of all experience levels who want to incorporate previous day levels into their technical analysis toolkit!
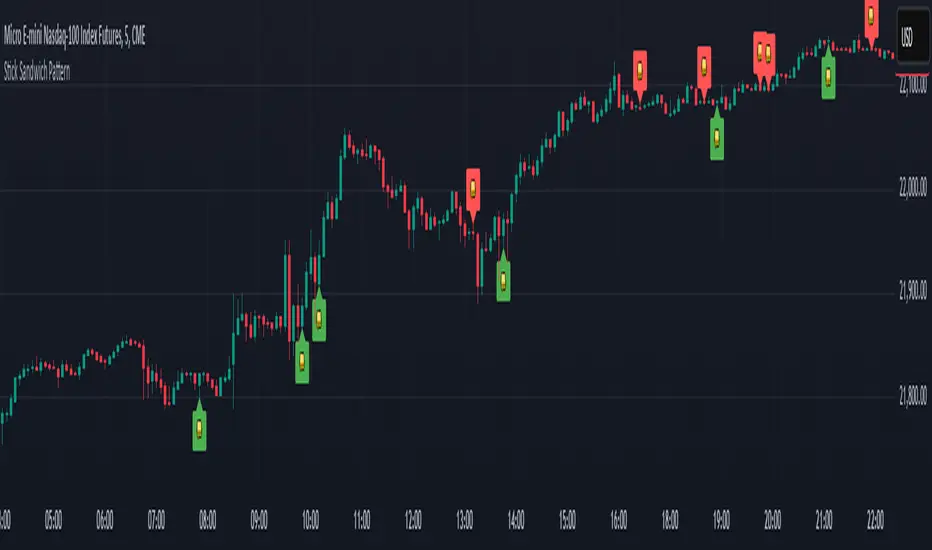
Stick Sandwich Pattern# Stick Sandwich Pattern Indicator
## Description
The Stick Sandwich Pattern Indicator is a custom TradingView script that identifies specific three-candle patterns in financial markets. The indicator uses a sandwich emoji (🥪) to mark pattern occurrences directly on the chart, making it visually intuitive and easy to spot potential trading opportunities.
## Pattern Types
### Bullish Stick Sandwich
A bullish stick sandwich pattern is identified when:
- First candle: Bullish (close > open)
- Second candle: Bearish (close < open)
- Third candle: Bullish (close > open)
- The closing price of the third candle is within 10% of the first candle's range from its closing price
### Bearish Stick Sandwich
A bearish stick sandwich pattern is identified when:
- First candle: Bearish (close < open)
- Second candle: Bullish (close > open)
- Third candle: Bearish (close < open)
- The closing price of the third candle is within 10% of the first candle's range from its closing price
## Technical Implementation
- Written in Pine Script v5
- Runs as an overlay indicator
- Uses a 10% tolerance range for closing price comparison
- Implements rolling pattern detection over the last 3 candles
- Break statement ensures only the most recent pattern is marked
## Visual Features
- Bullish patterns: Green sandwich emoji above the pattern
- Bearish patterns: Red sandwich emoji below the pattern
- Label size: Small
- Label styles:
- Bullish: Label points upward
- Bearish: Label points downward
## Usage
1. Add the indicator to your TradingView chart
2. Look for sandwich emojis that appear above or below price bars
3. Green emojis indicate potential bullish reversals
4. Red emojis indicate potential bearish reversals
## Code Structure
- Main indicator function with overlay setting
- Two separate functions for pattern detection:
- `bullishStickSandwich()`
- `bearishStickSandwich()`
- Pattern scanning loop that checks the last 3 candles
- Built-in label plotting for visual identification
## Formula Details
The closing price comparison uses the following tolerance calculation:
```
Tolerance = (High - Low of first candle) * 0.1
Valid if: |Close of third candle - Close of first candle| <= Tolerance
```
## Notes
- The indicator marks patterns in real-time as they form
- Only the most recent pattern within the last 3 candles is marked
- Pattern validation includes both candle direction and closing price proximity
- The 10% tolerance helps filter out weak patterns while catching meaningful ones
## Disclaimer
This indicator is for informational purposes only. Always use proper risk management and consider multiple factors when making trading decisions.