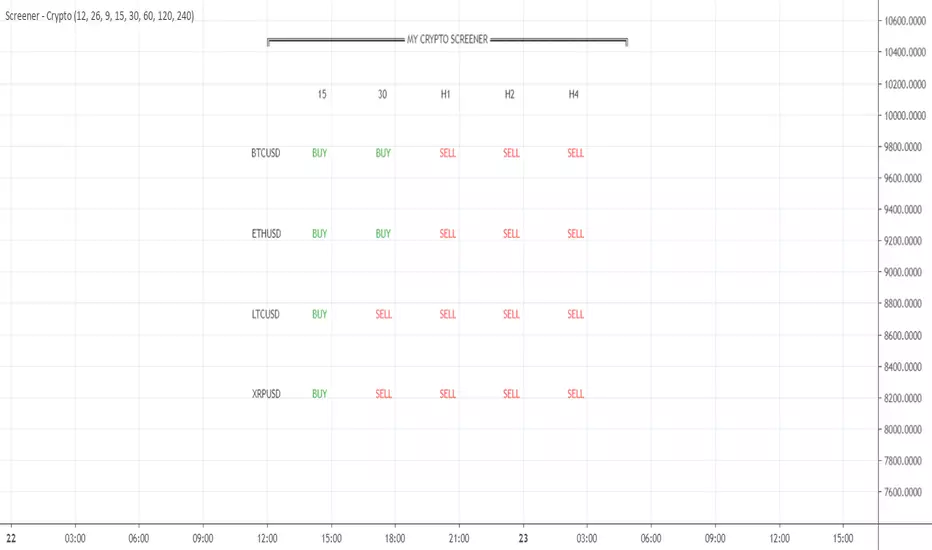
Your CRYPTO Screener - MACD 0 LAG editionHello traders
What's good?
1 - Quick introduction
This script is to demonstrate a proof-of-concept - showing you again what you thought wasn't possible might become (with some tricks) in the realm of possibles !!!.
I get requests for people who want a custom screener because the native TradingView Stocks/Forex/Crypto screeners don't allow to plug external indicators. (example: www.tradingview.com
This is entirely true and I have also good news for you, we can hack the system one more time. As Hackerman would say, "IT"S HACKING TIME !!!" (ref : KUNG FURY . (#geek #reference #done #for #today)
What if you could build your own personalized screener based on your custom indicator? "No Dave stop smoking, that's not possible, go back to eating your baguette". Say no more, let me present you my new script called YOUR CRYPTO Screener (MACD 0 LAG)
2 - What is a MACD ZERO LAG?
We'll all agree this indicator is NOT in the TradingView screeners so I'm not cheating here :)
A MACD ZERO LAG is a MACD that .... suspens.... wait for it.... DOES NOT lag.
The traditional MACD is based on exponential moving averages and as moving averages are lagging, then the MACD is lagging also. I'll spare you all the maths behind the MACD ZERO LAG but in short, this is a way more reactive indicator than the traditional MACD
I shared before the version that I personally use for my own trading : MACD 0 LAG nTREND coloring
3 - Crypto Screener specifications
If I could do a screener as complete as the native one, this would be wonderful but ... we cannot and this is due to technical reasons. To call indicators from different timeframes, I have to use the security function. And we're limited to 40 security calls per indicator.
That explains why I selected 4 crypto assets and 5 timeframes and the MACD zero lag output for each asset/timeframe - which gives a total of 4 * 5 * 2 = 40
You'll be able to select from the interface the 5 timeframes that you want for your screener
In this script, you'll get a :
- BUY whenever the MACD ZERO LAG for your asset/timeframe is green.
- SELL whenever the MACD ZERO LAG for your asset/timeframe is red.
4 - Can you hack it even more?
If you want to add other timeframes or assets, you can either, change the code or add the indicator on another chart.
I made the source code generic enough so that you can update it yourself easily
Example:
Chart 1 will list BTCUSD, ETHUSD, LTCUSD, and XRPUSD in m5/m15/m30/H1/H4 and Chart2 could list BTCUSD, ETHUSD, LTCUSD and XRPUSD in H6/H8/H12/Daily, etc...
Once again the sky (and your computer RAM capacity) is the limit
5 - Can you super hack it even more?
1/ This script is only a proof-of-concept that you can build your own custom screener. Imagine having the Algorithm Builder and being able to connect it in a single click to a custom screener using your own configuration :)
How coooooooooooooooool would that be!!!
This screener version will be available on my website in a few weeks along with all the tools I'm spamming you about since the beginning of July (#shameless #self-advertising)
2/ For a nicer scripter, let's keep in mind that TradingView just enabled Webhooks this week. This will allow my company to offer custom screeners design and hosted on your own website. Those screeners will be for sure nicer than the indicator version
That's it for today and for this week
I won't even touch the laptop this weekend and will enjoy life a bit
Love you all
Dave
____________________________________________________________
Be sure to hit the thumbs up. Building those indicators take a lot of time and likes are always rewarding for me :) (tips are accepted too)
- If you want to suggest some indicators that I can develop and share with the community, please use my personal TRELLO board
- I'm an officially approved PineEditor/LUA/MT4 approved mentor on codementor. You can request a coaching with me if you want and I'll teach you how to build kick-ass indicators and strategies
Jump on a 1 to 1 coaching with me
- You can also hire for a custom dev of your indicator/strategy/bot/chrome extension/python
חפש סקריפטים עבור "indicators"
TRAILING STOP LOSS TO LONG AND SHORT##THIS SCRIPT IS ON GITHUB
This TradingView strategy it is designed to integrate with other strategies with indicators.
It performs a trailing stop loss from entry and exit conditions.
In this strategy you can add conditions for long and short positions.
The strategy will ride up your stop loss when price moviment 1%.
The strategy will close your operation when the market price crossed the stop loss.
Also is possible to select the period that strategy will execute the backtest.
The strategy has the following parameters:
+ **INITIAL STOP LOSS** - Where can isert the value to first stop.
+ **POSITION TYPE** - Where can to select trade position.
+ **BACKTEST PERIOD** - To select range.
## DISCLAIMER
1. I am not licensed financial advisors or broker dealers. I do not tell you when or what to buy or sell. I developed this software which enables you execute manual or automated trades multiple trades using TradingView. The software allows you to set the criteria you want for entering and exiting trades.
2. Do not trade with money you cannot afford to lose.
3. I do not guarantee consistent profits or that anyone can make money with no effort. And I am not selling the holy grail.
4. Every system can have winning and losing streaks.
5. Money management plays a large role in the results of your trading. For example: lot size, account size, broker leverage, and broker margin call rules all have an effect on results. Also, your Take Profit and Stop Loss settings for individual pair trades and for overall account equity have a major impact on results. If you are new to trading and do not understand these items, then I recommend you seek education materials to further your knowledge.
**YOU NEED TO FIND AND USE THE TRADING SYSTEM THAT WORKS BEST FOR YOU AND YOUR TRADING TOLERANCE.**
**I HAVE PROVIDED NOTHING MORE THAN A TOOL WITH OPTIONS FOR YOU TO TRADE WITH THIS PROGRAM ON TRADINGVIEW.**
## NOTE
I accept suggestions to improve the script.
If you encounter any problems I will be happy to share with me.
+ Authors: @exit490
+ Revision: v1.0.0
+ Date: 03-Aug-2019
+ Pinescript version: 4
## LICENSE
Copyright 2019 Mauricio Pimenta / exit490
Trailing Stop Loss script may be freely distributed under the MIT license .

Weight of Evidence BF**For Stocks (requires volume data) **
The premise of this indicator is that the wisdom of many is greater than one. The idea is you can throw out most of your indicators and simply adopt the Weight of the Evidence instead.
Eight indicators and five periods combine to give forty separate readings on a stock. These are all checked against a threshold to give a pass or fail score. The total is taken and a score is given out of 100 in increments of 2.5.
Four indicators are momentum-based: EMA, RSI, PercentRank, Lower Donchian Channel
Three are price-volume based:On Balance Volume, Price Volume Trend, Accumulation/Distribution
One is volatility-based: (Simplified) Volatility Stop
I have tried to make things simple with the entered periods being applied to all indicators. For some like on balance volume its actually a look back period for comparison of values. For the volatility stop I use the 3rd period for lookback and combine with 1 to 5 times ATR.
As this is a stepped function which can react rapidly it makes sense to smooth it with something like a 3-bar EMA, which is included by default.
Play around with the periods and different bar lengths to find something you like. I actually chose the default values with daily bars in mind but it seems to work well on weeklies! If you have other preferred indicators you could edit this script and substitute your own, although it is easiest to stick with the built-in functions as I have done.
Let me know how you get on with this and good trading to all!

CM Willams %R and CCI BackGround HighlightCM_Willams %R and CCI BackGround Highlight
Created By User Request
Indicator Highlights:
Creates Red BackGround Highlight if CCI Or Williams %R are Above Upper Line (User Defined)
Creates Green BackGround Highlight if CCI Or Williams %R are Below Lower Line (User Defined)
Ability to Turn On/Off either Williams %R or CCI Highlights in Inputs Tab via Check Boxes.
Ability To Set All Parameters for CCI and Williams %R in Inputs Tab.
Ability to Set High/Low “Threshold” Lines for Both CCI and Williams %R in Inputs Tab.
***I was asked if you could plot Back Ground Highlights on Two Individual Indicators AND have it show if BOTH Indicators were Overbought and Oversold.
***The answer is Yes. On the Chart Above I have the same Shade of Red and Green for Both Indicators. However, you will notice when Both Indicators Show OverBought…Both Plot Red Back Ground Highlights Which = a Brighter Red. The same is True for Oversold Conditions. The Green Shows a Brighter Shade of Green.
***VERY IMPORTANT - It is difficult for a programmer to release Indicators with this feature because depending on what color background you use on your charts…THE COLORS LOOK COMPLETELY DIFFERENT. So If You Don’t Use The Black Back Ground Shown Above You Most Likely Will Need To Adjust The Transparency, and Possibly The Colors Themselves!!!!
Reference Page

Smart Money Structure | GainzAlgo📊 OVERVIEW:
================
Smart Money Structure Analysis is a professional-grade market structure and order-flow system designed to identify institutional trading behavior through volatility-adaptive logic, multi-timeframe trend alignment, and volume-based confirmation.
This indicator implements original mathematical models to detect Change of Character (CHoCH), Break of Structure (BOS), cumulative volume dynamics, and trend convergence across seven timeframes — delivering high-probability trade signals with significantly reduced noise.
Unlike basic indicator combinations, this system functions as a unified trading framework, where volatility adaptation, structure analysis, and volume confirmation continuously reinforce each other to provide precise, context-aware signals.
⭐ WHY THIS SYSTEM IS UNIQUE AND WORTHY OF PUBLICATION:
=====================================================
This is not a collection of common indicators placed together.
Smart Money Structure Analysis represents a cohesive institutional methodology, engineered so that:
- Volatility adjusts signal sensitivity in real time
- Multi-timeframe trends define directional bias
- Market structure determines timing
- Volume confirms institutional participation
- Advanced filters eliminate low-quality setups
Each component is mathematically linked to the others, creating a workflow that cannot be replicated by stacking separate indicators.
🔗 SYNERGISTIC INTEGRATION – HOW THE SYSTEM WORKS TOGETHER:
==========================================================
🧠 1. CONTEXT-AWARE VOLATILITY ADAPTATION
ATR-based volatility logic dynamically adjusts all momentum thresholds:
- Higher volatility → stronger confirmation required
- Lower volatility → sensitivity increases to capture valid moves
This prevents over-signaling in choppy markets and under-signaling during expansion phases — a core flaw in static indicators.
📐 2. MULTI-TIMEFRAME TREND CONVERGENCE ENGINE
Seven timeframes are analyzed simultaneously:
1M • 5M • 15M • 30M • 1H • 4H • 1D
Each timeframe is scored using EMA + VWAP alignment, producing a composite Trend Strength Score from -100 to +100.
The stronger the alignment across timeframes, the higher the probability of continuation — instantly visible through the real-time dashboard.
🏗️ 3. INSTITUTIONAL MARKET STRUCTURE (CHoCH & BOS)
The system automatically identifies the two core smart money concepts:
- CHoCH (Change of Character):
Signals potential trend exhaustion or reversal zones
- BOS (Break of Structure):
Confirms trend continuation and institutional commitment
Structure zones are visualized with persistent, color-coded levels and clouds, providing precise contextual timing rather than lagging signals.
📊 4. CUMULATIVE VOLUME DELTA (CVD) CONFIRMATION
CVD tracks the cumulative difference between buying and selling pressure:
- Rising CVD → accumulation
- Falling CVD → distribution
- Divergence vs price → early reversal warning
Volume participation is categorized into Low / Medium / High, adding depth beyond simple volume bars.
🛡️ 5. SIX-LAYER PROFESSIONAL SIGNAL FILTERING
Every signal must pass through up to six independent confirmation layers:
1. Volatility-adjusted momentum
2. Higher timeframe trend alignment
3. Lower timeframe conflict prevention
4. Institutional volume confirmation
5. Structural breakout validation
6. Repeated-signal restriction
This dramatically reduces false positives while preserving only high-quality institutional setups.
🧮 DETAILED CORE SYSTEMS:
========================
📏 ADAPTIVE MOMENTUM FORMULA
- Momentum Threshold = Base × (1 + (ATR ÷ Price) × 2)
- Pre-Momentum Factor = Base × (1 − (ATR ÷ Price) × 0.5)
📊 TREND STRENGTH CALCULATION
- Trend Strength = (Sum of 7 timeframe scores ÷ 7) × 100
📦 CVD LOGIC
- Close > Previous Close → Buy volume added
- Close < Previous Close → Sell volume subtracted
- Cumulative sum reveals institutional intent
🧠 STRUCTURE DETECTION
- Pivot-based swing logic
- Candle confirmation
- Configurable lookback periods
- Non-repainting visualization
🧩 ADVANCED ANALYSIS TOOLS:
==========================
🧲 LIQUIDITY ZONE DETECTION
Identifies probable retail stop-loss clusters where institutions often initiate stop hunts before true directional moves.
📦 MARKET PROFILE & ORDER FLOW IMBALANCE
Detects buy/sell dominance using volume ratios, highlighting accumulation and distribution zones before large price moves.
🔄 RSI DIVERGENCE SCANNER
Identifies bullish and bearish divergences that frequently precede structure shifts and trend reversals.
🎨 VISUAL SYSTEM & DASHBOARD:
============================
📊 SMART MONEY MATRIX
- Composite trend strength
- System confidence %
- CVD value
- Directional grid for all timeframes
📈 TREND PREDICTION MATRIX (Optional)
Forecasts short-term directional bias using trend, momentum, and volatility data.
🏷️ SIGNAL LABELS
- BUY / SELL → Fully confirmed entries
- READY → Momentum building
- BOS / CHoCH → Structure events
- FLOW / LIQ / BULL / BEAR → Advanced confirmations
⚙️ CORE FEATURES:
================
1. Multi-Timeframe Trend Convergence
2. Smart Money Structure Detection (CHoCH & BOS)
3. Adaptive Volatility-Based Momentum
4. Cumulative Volume Delta (CVD)
5. Six-Layer Signal Filtering
6. Liquidity Zone Detection
7. Order Flow & Market Profile Analysis
8. Divergence Scanner
9. Dynamic Trendlines
10. Institutional-Grade Dashboard
📘 WHO THIS INDICATOR IS FOR:
============================
- Scalpers: Noise-filtered precision on lower timeframes
- Day Traders: High-probability continuation setups
- Swing Traders: Multi-timeframe alignment & structure zones
- Reversal Traders: Divergence + CHoCH confirmation
⚠️ IMPORTANT DISCLAIMER:
========================
This indicator is a technical analysis and educational tool only.
It does not provide financial advice or trade recommendations.
Trading involves substantial risk, and losses are a natural part of trading.
Past performance does not guarantee future results.
All trading decisions remain the sole responsibility of the user.

Piv X# Piv X Pro - Multi-Layer Reversal Detection System
## Overview
Piv X Pro is an advanced technical analysis indicator that combines dynamic pivot detection, Williams %R momentum divergence analysis, and multiple VWAP anchoring methods to identify high-probability mean reversion opportunities. Unlike simple indicator combinations, this script implements a layered filtration system where each component validates and refines signals from the previous layer, resulting in significantly fewer but higher-quality reversal setups.
## Core Methodology
### 1. Dynamic ATR-Based Pivot Detection
The script uses an adaptive pivot detection algorithm that adjusts sensitivity based on market volatility. Instead of fixed lookback periods, pivot strength is calculated dynamically using Average True Range (ATR):
**Calculation:** `pivot_strength = max(min_strength, min(ATR / mintick * multiplier, max_strength))`
This ensures:
- More sensitive pivots in low volatility (smaller ATR)
- More significant pivots in high volatility (larger ATR)
- Automatic adaptation across different market conditions and timeframes
**Significance Filtering:** Pivots must exceed a minimum ATR distance from recent price action (default 0.3 ATR) to filter noise. This prevents minor price fluctuations from being marked as significant pivots.
**Volume Confirmation (Optional):** Pivots can optionally require volume spikes (default 1.5x average volume) to ensure institutional participation.
### 2. Williams %R Momentum Divergence Engine
The script detects classic and hidden divergences between price pivots and Williams %R oscillator readings:
**Bullish Divergence Detection:**
- Price makes a lower low (confirmed pivot low)
- Williams %R makes a higher low (momentum improving)
- Divergence occurs in oversold zone (Williams %R ≤ -80)
- Lookback range: 60 bars maximum
**Bearish Divergence Detection:**
- Price makes a higher high (confirmed pivot high)
- Williams %R makes a lower high (momentum weakening)
- Divergence occurs in overbought zone (Williams %R ≥ -20)
- Lookback range: 60 bars maximum
**Divergence-Anchored VWAPs:** When a divergence is detected, a new VWAP calculation begins from that point, tracking institutional positioning relative to the momentum shift. This provides a dynamic mean reversion target that resets at each confirmed divergence.
### 3. Confluence Scoring System
Each detected pivot receives a numerical score (0-150+ points) based on multiple independent confirmation factors:
**Scoring Components:**
- Base Pivot Detection: 10 points
- Volume Spike Confirmation: 15 points
- Higher Timeframe Trend Alignment (4H EMA): 20 points
- RSI Extreme Levels (oversold/overbought): 25 points
- Mean Reversion Distance (>2.5 ATR from HTF MA): 20 points
- Exhaustion Patterns (price move + volume spike): 10 points
- ATR Price Confirmation: 10 points
- RSI Divergence: 15 points
- Swing Failure Pattern (SFP): 15 points
- Liquidity Sweep: 10 points
- Candle Reversal Confirmation: 10 points
- Key Level Alignment (previous day/week highs/lows): 10 points
- Fair Value Gap (FVG) Fill: 10 points
- Session Weighting (London/NY sessions): 10 points
- Multi-Timeframe Pivot Confluence: 15 points
**Zone Classification:**
- Regular Zones: Score 60-89 (green/purple boxes)
- Golden Zones: Score 90+ (yellow boxes with thicker borders)
Higher scores indicate stronger confluence and higher probability setups, but no prediction is guaranteed.
### 4. Mean Reversion Distance Filter
The script calculates how far price has stretched from the higher timeframe moving average:
**Calculation:** `distance_from_htf_ma = (close - HTF_EMA) / ATR`
**Mean Reversion Condition:**
- For long setups: Price >2.5 ATR below HTF EMA when HTF trend is up
- For short setups: Price >2.5 ATR above HTF EMA when HTF trend is down
This ensures pivots are only highlighted when price is statistically stretched and likely to revert toward the mean.
### 5. Multi-Period VWAP Framework
The script provides multiple VWAP calculations for different analysis purposes:
**Extreme VWAPs:**
- Bottom VWAP: Anchored to the absolute lowest low in the lookback period (default 50 bars)
- Top VWAP: Anchored to the absolute highest high in the lookback period
**Periodic VWAPs:**
- 4D VWAP: Resets every 4 days
- 9D VWAP: Resets every 9 days
- 4H VWAP: Resets every 4 hours
- 8H VWAP: Resets every 8 hours
- Weekly VWAP: Resets at the start of each week
- Monthly VWAP: Resets at the start of each month
- Yearly VWAP: Resets at the start of each year
**Previous Period VWAPs:**
- Previous Weekly, Monthly, and Yearly VWAPs are displayed as reference levels for support/resistance
**Divergence VWAPs:**
- Bullish Divergence VWAP: Resets at each bullish Williams %R divergence
- Bearish Divergence VWAP: Resets at each bearish Williams %R divergence
### 6. IBSS Pro Mean Reversion System
An integrated scalping system that provides entry signals within high-probability pivot zones:
**Components:**
- Dual EMA System: Fast EMA (12) and Slow EMA (26) with color-coded trend visualization
- RSI Oversold/Overbought Detection: Configurable levels (default 30/70)
- Zone-Based Entry: Signals only trigger when price is within active pivot zones (0.3 ATR around confirmed pivots)
- ATR-Based Dynamic Stops: Stop losses trail with position using ATR multiplier
**Signal Generation:**
- Buy signals: RSI crosses above oversold + Fast EMA > Slow EMA + Price in pivot low zone
- Sell signals: RSI crosses below overbought + Fast EMA < Slow EMA + Price in pivot high zone
## Why This Combination is Unique
This is not a simple indicator mashup. The components work together in a specific hierarchy:
1. **Williams %R Divergence** identifies momentum shifts before price confirms the reversal
2. **Dynamic Pivots** mark actual price structure extremes with ATR-based significance filtering
3. **Confluence Scoring** quantifies setup quality using 10+ independent confirmation factors
4. **Mean Reversion Distance** confirms price is statistically stretched (>2.5 ATR from HTF MA)
5. **VWAP Framework** tracks institutional positioning and provides objective mean levels
6. **IBSS Signals** provide precise entries within high-probability zones
Each layer filters the previous one, resulting in significantly fewer but higher-quality signals than any single indicator alone. The divergence-anchored VWAPs are unique - they reset at momentum shifts rather than arbitrary time periods, providing more relevant mean reversion targets.
## How to Use This Indicator
### For Swing Trading (15m-1H Charts)
1. Wait for a major pivot to form (diamond marker appears below/above bars)
2. Check the confluence score displayed in the zone label
3. Look for Golden Zones (score 90+, yellow boxes with thicker borders)
4. Enter when price enters the pivot zone (0.3 ATR around the pivot)
5. Use the nearest VWAP level as first target
6. Set stop loss beyond the pivot zone (typically 0.5-1 ATR)
### For Scalping (5m-15m Charts)
1. Enable IBSS Pro Signals in settings
2. Wait for price to enter an active pivot zone (colored boxes appear)
3. Take IBSS diamond signals that form within zones
4. Use ATR-based stop losses (dashed lines appear automatically if enabled)
5. Exit at pivot VWAP or opposite zone edge
### Visual Elements Explained
- **White/Purple Crosses**: Williams Divergence VWAPs (momentum-based mean reversion targets)
- **Green/Red Crosses**: Bottom/Top VWAPs (absolute extreme levels)
- **Colored Boxes**: Pivot reversal zones (opacity indicates confluence score)
- **Yellow Boxes**: Golden zones (90+ score, highest probability setups)
- **Small Diamonds**: Regular pivot detections
- **Green/Red Tiny Diamonds**: IBSS scalp entry signals (if enabled)
- **White/Purple MAs**: IBSS trend filter (12/26 EMA with cloud)
- **Dotted Lines**: Structure lines connecting consecutive pivots of same type
- **Blue Dashed Lines**: Market Structure Shift (CHoCH) markers
### Recommended Settings
**Conservative (Lower Timeframes 1m-5m):**
- ATR Pivot Strength: 0.8-1.0
- Volume Threshold: 2.0
- Min Pivot Significance: 0.4-0.5
- Enable ATR Confirmation: Yes
- Real-Time Mode: Off
- Score Threshold: 80+
**Aggressive (Higher Timeframes 15m-1H):**
- ATR Pivot Strength: 0.6-0.8
- Volume Threshold: 1.5
- Min Pivot Significance: 0.3
- Enable ATR Confirmation: No
- Real-Time Mode: On
- Score Threshold: 60+
## Chart Requirements
This indicator should be used **alone on a clean chart** with:
- Standard candlestick or bar chart type (NO Heikin Ashi, Renko, Point & Figure, or Range charts)
- No other indicators overlaid (all functionality is self-contained)
- Symbol and timeframe clearly visible in chart
- Full indicator name "Piv X Pro" visible in chart legend
## Important Disclaimers
- Past performance does not guarantee future results
- All signals are probabilistic indicators, not trading guarantees
- Use proper risk management and position sizing
- Test thoroughly on demo accounts before live trading
- Higher confluence scores indicate better setups but no prediction is certain
- Mean reversion strategies work best in ranging/choppy markets; may underperform in strong trending markets
- The lookahead bias warning: HTF EMA uses `barmerge.lookahead_on` for trend filtering only (not for signal generation), which may cause historical bars to show different trend states than real-time
## Key Differentiators
Unlike basic pivot or VWAP indicators:
- **Dynamic ATR-based pivot detection** vs static lookback periods
- **Quantified confluence scoring** vs subjective interpretation
- **Mean reversion distance filtering** (>2.5 ATR from HTF MA) vs all pivots shown
- **Divergence-anchored VWAPs** vs static period VWAPs
- **Multi-layer confirmation system** (10+ independent factors) vs single signal generation
- **Integrated scalping system** that only triggers in high-probability zones
This script is open-source and available for educational purposes. Users are encouraged to understand the methodology before using it for live trading decisions.

Smart Wedge Pattern [The_lurker]🔺 Smart Wedge Pattern نموذج الوتد الذكي
Advanced & Intelligent Wedge Detection Engine
This is not a traditional indicator that simply draws wedge lines — it is a comprehensive intelligent engine (system) for detecting and analyzing wedge patterns (Rising & Falling Wedge) based on price geometry, market context, and statistical quality of the pattern.
This indicator was designed to address the biggest problems in common wedge indicators:
❌ Too many false patterns
❌ Ignoring prior trend
❌ No real quality assessment for patterns
A comprehensive intelligent system that combines:
Adaptive algorithm that self-calibrates automatically according to market conditions
7 strict validation layers that filter out weak patterns and keep only the highest quality
Quality scoring system that evaluates each pattern from 0 to 100
3D visualization that makes patterns visually clear in an exceptional way
Smart targets based on Fibonacci ratios with real-time achievement tracking
The Result:
➡️ Fewer patterns
➡️ Cleaner, more accurate and reliable signals
➡️ Higher quality
➡️ Real practical use
═════════════════════════════════════════════════════════════
🎯 What Are Wedge Patterns?
1- Falling Wedge — Bullish Reversal Pattern
The falling wedge forms when price moves in a converging downward channel — meaning both the upper resistance line and the lower support line are declining, but the support line declines at a less steep angle, gradually narrowing the channel.
Why does the bullish breakout occur?
Declining highs show continuous selling pressure
But rising lows (P2 < P4) reveal that buyers are entering at higher levels
Convergence indicates decreasing bearish momentum
At a certain point, buying pressure overcomes and the breakout occurs
2- Rising Wedge — Bearish Reversal Pattern
The rising wedge is the exact opposite of the falling wedge — a converging upward channel where both lines rise, but the resistance line rises at a less steep angle.
Why does the bearish breakout occur?
Rising lows show continuous buying pressure
But declining highs (P2 > P4) reveal that sellers are entering at lower levels
Convergence indicates decreasing bullish momentum
At a certain point, selling pressure overcomes and the breakout occurs
═════════════════════════════════════════════════════════════
🧠 Adaptive Pivot System — The Heart of the Smart Indicator
The Problem with Traditional Indicators
Traditional indicators use a fixed value for pivot detection (like 5 bars left and 5 bars right). This means:
In quiet markets → Many delayed signals
In volatile markets → Few missed signals
No adaptation to the nature of each market or timeframe
The Solution: Smart Adaptation Algorithm
The indicator calculates optimal pivot sensitivity on each bar using 5 weighted factors:
Final Score = (Volatility_Score × 0.30) + (Trend_Score × 0.25) +
(Stability_Score × 0.20) + (Percentile_Context × 0.15) +
(Range_Score × 0.10)
Factor Weight How It's Calculated Why It's Important
Volatility Score 30% ATR(10) / ATR(50) Detects sudden changes in volatility
Trend Score 25% ADX(14) / 50 Trending markets need different sensitivity
Stability Score 20% StdDev(ATR) / Mean(ATR) Measures volatility consistency
Percentile Context 15% ATR / Percentile(ATR, 50) Places volatility in historical context
Range Score 10% Current_Range / Average_Range Detects unusual bars
The Result: The indicator uses low sensitivity (fewer, more important pivots) in quiet markets, and high sensitivity (more pivots, faster response) in volatile markets (more accurate pivots = correct geometric patterns).
═════════════════════════════════════════════════════════════
✅ Seven Validation Layers — Why This Indicator Is Different
Every detected pattern passes through 7 strict tests before being displayed:
1- Geometric Structure Validation
Validates:
P1 precedes P2 precedes P3 precedes P4 chronologically
Distance between each two points ≥ minimum threshold
Pattern width (P1→P4) within allowed range
Highs and lows order is correct for the wedge type
2- True Convergence Check
A true wedge must show convergence:
├── Gap at P4 < Gap at P1
├── Convergence ratio = End_Gap / Start_Gap
└── Ratio must be < defined convergence threshold (default 75%)
3- Slope Validation
For Falling Wedge:
├── Resistance line slope < 0 (declining)
├── Support line slope < 0 (declining)
└── Resistance slope < Support slope (convergence)
For Rising Wedge:
├── Resistance line slope > 0 (rising)
├── Support line slope > 0 (rising)
└── Support slope > Resistance slope (convergence)
4- Prior Trend Filter
Reversal patterns need a prior trend to reverse from:
├── Measures price movement during a defined period before P1
├── Normalizes movement using ATR for fair comparison
├── Falling wedge requires prior downtrend
└── Rising wedge requires prior uptrend
5- Channel Respect
Normal mode (close check):
└── Every close between P1 and P4 must be within wedge boundaries
Strict mode (high/low check):
├── Every high must be below resistance line (+ tolerance)
└── Every low must be above support line (- tolerance)
6- Post-P4 Validation
After the fourth point forms:
├── For falling wedge: Price doesn't break support or drop below P4
└── For rising wedge: Price doesn't break resistance or rise above P4
7- Quality Scoring System
Quality = (Convergence_Score × 0.30) + (Slope_Score × 0.25) +
(Width_Score × 0.20) + (Trend_Score × 0.15) +
(Height_Score × 0.10)
├── Convergence Score: More convergence = higher quality
├── Slope Score: Consistency of upper and lower line slopes
├── Width Score: Patterns with 40-100 bar width are ideal
├── Trend Score: Prior trend strength
└── Height Score: Pattern height relative to ATR
═════════════════════════════════════════════════════════════
✅ Pattern Lifecycle Management
The indicator doesn't just draw and disappear — it follows the complete pattern:
Pattern detection
Post-fourth point monitoring
Breakout confirmation
Target calculation
Target achievement tracking
Success or cancellation marking
❌ Pattern is automatically cancelled if:
Breakout fails
Channel is broken in reverse direction
Waiting period exceeded
═════════════════════════════════════════════════════════════
✅ Smart Targets + Success Level
After breakout:
Target is calculated based on pattern height
3 target modes:
Conservative (0.618)
Balanced (1.0)
Aggressive (1.618)
Independent Success level to measure move strength before target
═════════════════════════════════════════════════════════════
🎨 Advanced Visual Display (3D Visualization)
Three-dimensional pattern representation
Visual depth reflecting pattern size
3D target zone
Dynamic colors upon target achievement
🎨 The purpose of 3D is not decoration
But reading the pattern visually with speed and clarity
═════════════════════════════════════════════════════════════
⚙️ Key Features
✅ Automatic wedge detection
✅ Smart filtering reduces false signals
✅ Real quality assessment for each pattern
✅ Realistic and customizable targets
✅ Full support for Rising & Falling Wedge
✅ Works on all markets and timeframes
✅ Professional design and high performance
═════════════════════════════════════════════════════════════
📊 Usage Scenarios
🟢 Scalping
Timeframes: 1–15 minutes
Quality ≥ 60
Conservative targets
🔵 Day Trading
Timeframes: 15m–1h
Quality ≥ 50
Balanced targets
🟣 Swing Trading
Timeframes: 4h–Daily
Quality ≥ 40
Strict channel
Aggressive targets
🟠 Cryptocurrencies
Strict convergence
Strict channel
Quality ≥ 65
═════════════════════════════════════════════════════════════
🔔 Alerts
Falling wedge breakout ⇒ Buy
Rising wedge breakout ⇒ Sell
Any wedge breakout
═════════════════════════════════════════════════════════════
⚠️ Disclaimer
This indicator is for educational and analytical purposes only. It does not represent financial, investment, or trading advice. Use it in conjunction with your own strategy and risk management. Neither TradingView nor the developer is responsible for any financial decisions or losses.
═════════════════════════════════════════════════════════════
🔺 Smart Wedge Pattern نموذج الوتد الذكي
Advanced & Intelligent Wedge Detection Engine
ليس مؤشرًا تقليديًا يرسم خطوط وتد فقط ، بل هو محرك (نظام) ذكي متكامل لاكتشاف وتحليل نماذج الوتد (Rising & Falling Wedge) اعتمادًا على الهندسة السعرية ، السياق السوقي ، والجودة الإحصائية للنموذج.
تم تصميم هذا المؤشر لمعالجة أكبر مشكلة في مؤشرات الوتد الشائعة:
❌ كثرة النماذج الوهمية
❌ تجاهل الاتجاه السابق
❌ عدم وجود تقييم حقيقي لجودة النموذج
نظام ذكي متكامل يجمع بين:
خوارزمية تكيفية تُعاير نفسها تلقائياً حسب ظروف السوق
7 طبقات تحقق صارمة تُصفّي الأنماط الضعيفة وتُبقي فقط الأعلى جودة
نظام تسجيل جودة يُقيّم كل نموذج من 0 إلى 100
تصور ثلاثي الأبعاد يجعل الأنماط واضحة بصرياً بشكل استثنائي
أهداف ذكية مبنية على نسب فيبوناتشي مع تتبع التحقق الآني
النتيجة:
➡️ نماذج أقل
➡️ إشارات أنظف أكثر دقة وموثوقية
➡️ جودة أعلى
➡️ استخدام عملي حقيقي
═════════════════════════════════════════════════════════════
🎯 ما هي نماذج الأوتاد؟
1- الوتد الهابط (Falling Wedge) — نموذج انعكاسي صعودي
الوتد الهابط يتشكل عندما يتحرك السعر في قناة هابطة متقاربة — أي أن خط المقاومة العلوي وخط الدعم السفلي كلاهما يهبطان، لكن خط الدعم يهبط بزاوية أقل حدة، مما يُضيّق القناة تدريجياً.
لماذا يحدث الكسر الصعودي؟
القمم الهابطة تُظهر ضغطاً بيعياً مستمراً
لكن القيعان الصاعدة (P2 < P4) تكشف أن المشترين يدخلون عند مستويات أعلى
التقارب يُشير إلى تناقص الزخم الهبوطي
عند نقطة معينة، يتغلب ضغط الشراء ويحدث الكسر
2- الوتد الصاعد (Rising Wedge) — نموذج انعكاسي هبوطي
الوتد الصاعد هو عكس الهابط تماماً — قناة صاعدة متقاربة حيث يصعد كلا الخطين، لكن خط المقاومة يصعد بزاوية أقل حدة.
لماذا يحدث الكسر الهبوطي؟
القيعان الصاعدة تُظهر ضغطاً شرائياً مستمراً
لكن القمم الهابطة (P2 > P4) تكشف أن البائعين يدخلون عند مستويات أدنى
التقارب يُشير إلى تناقص الزخم الصعودي
عند نقطة معينة، يتغلب ضغط البيع ويحدث الكسر
═════════════════════════════════════════════════════════════
🧠 نظام المحاور التكيفي — قلب المؤشر الذكي
المشكلة مع المؤشرات التقليدية
المؤشرات التقليدية تستخدم قيمة ثابتة لاكتشاف المحاور (مثل 5 شموع يسار و5 شموع يمين). هذا يعني:
في الأسواق الهادئة → إشارات كثيرة ومتأخرة
في الأسواق المتقلبة → إشارات قليلة وضائعة
لا تكيف مع طبيعة كل سوق أو إطار زمني
الحل: خوارزمية التكيف الذكي
المؤشر يحسب حساسية المحور المثلى في كل شمعة باستخدام 5 عوامل مرجحة:
النتيجة النهائية = (درجة_التقلب × 0.30) + (درجة_الاتجاه × 0.25) +
(درجة_الاستقرار × 0.20) + (السياق_المئوي × 0.15) +
(درجة_النطاق × 0.10)
العامل الوزن كيف يُحسب لماذا مهم
درجة التقلب 30% ATR(10) / ATR(50) يكشف التغير المفاجئ في التقلب
درجة الاتجاه 25% ADX(14) / 50 الأسواق الاتجاهية تحتاج حساسية مختلفة
درجة الاستقرار 20% StdDev(ATR) / Mean(ATR) يقيس ثبات التقلب
السياق المئوي 15% ATR / Percentile(ATR, 50) يضع التقلب في سياقه التاريخي
درجة النطاق 10% النطاق_الحالي / متوسط_النطاق يكشف الشموع غير العادية
النتيجة: المؤشر يستخدم حساسية منخفضة (محاور أقل، أكثر أهمية) في الأسواق الهادئة، وحساسية عالية (محاور أكثر، استجابة أسرع) في الأسواق المتقلبة (محاور أدق = نماذج هندسية صحيحة).
═════════════════════════════════════════════════════════════
✅ طبقات التحقق السبع — لماذا هذا المؤشر مختلف
كل نموذج مُكتشف يمر عبر 7 اختبارات صارمة قبل عرضه:
1- التحقق من البنية الهندسية
يتحقق من:
P1 يسبق P2 يسبق P3 يسبق P4 زمنياً
المسافة بين كل نقطتين ≥ الحد الأدنى المحدد
عرض النموذج (P1→P4) ضمن النطاق المسموح
ترتيب القمم والقيعان صحيح حسب نوع الوتد
2- فحص التقارب الحقيقي
الوتد الحقيقي يجب أن يُظهر تقارباً:
├── الفجوة عند P4 < الفجوة عند P1
├── نسبة التقارب = الفجوة_النهائية / الفجوة_الابتدائية
└── النسبة يجب أن تكون < عتبة التقارب المحددة (افتراضي 75%)
3- التحقق من الميل
للوتد الهابط:
├── ميل خط المقاومة < 0 (هابط)
├── ميل خط الدعم < 0 (هابط)
└── ميل المقاومة < ميل الدعم (تقارب)
للوتد الصاعد:
├── ميل خط المقاومة > 0 (صاعد)
├── ميل خط الدعم > 0 (صاعد)
└── ميل الدعم > ميل المقاومة (تقارب)
4- فلتر الاتجاه السابق
النماذج الانعكاسية تحتاج اتجاهاً سابقاً لتنعكس منه:
├── يقيس حركة السعر خلال فترة محددة قبل P1
├── يُطبّع الحركة باستخدام ATR لمقارنة عادلة
├── الوتد الهابط يحتاج اتجاهاً هابطاً سابقاً
└── الوتد الصاعد يحتاج اتجاهاً صاعداً سابقاً
5- احترام القناة
وضع عادي (فحص الإغلاق):
└── كل إغلاق بين P1 و P4 يجب أن يكون داخل حدود الوتد
وضع صارم (فحص القمة/القاع):
├── كل قمة يجب أن تكون تحت خط المقاومة (+ نسبة تسامح)
└── كل قاع يجب أن يكون فوق خط الدعم (- نسبة تسامح)
6- التحقق بعد P4
بعد تشكل النقطة الرابعة:
├── للوتد الهابط: السعر لا يكسر خط الدعم أو ينزل تحت P4
└── للوتد الصاعد: السعر لا يكسر خط المقاومة أو يصعد فوق P4
7- نظام تسجيل الجودة
الجودة = (درجة_التقارب × 0.30) + (درجة_الميل × 0.25) +
(درجة_العرض × 0.20) + (درجة_الاتجاه × 0.15) +
(درجة_الارتفاع × 0.10)
├── درجة التقارب: كلما زاد التقارب، زادت الجودة
├── درجة الميل: تناسق ميل الخطين العلوي والسفلي
├── درجة العرض: الأنماط بعرض 40-100 شمعة مثالية
├── درجة الاتجاه: قوة الاتجاه السابق
└── درجة الارتفاع: ارتفاع النموذج نسبة لـ ATR
═════════════════════════════════════════════════════════════
✅ إدارة دورة حياة النموذج (Pattern Lifecycle)
المؤشر لا يرسم ثم يختفي، بل يتابع النموذج كاملًا:
اكتشاف النموذج
مراقبة ما بعد النقطة الرابعة
تأكيد الاختراق
حساب الهدف
تتبع الوصول للهدف
تمييز النجاح أو الإلغاء
❌ يتم إلغاء النموذج تلقائيًا إذا:
فشل في الاختراق
كُسرت القناة عكسيًا
تجاوز مدة الانتظار المحددة
═════════════════════════════════════════════════════════════
✅ أهداف ذكية + Success Level
بعد الاختراق:
يتم حساب الهدف بناءً على ارتفاع النموذج
3 أوضاع للأهداف:
Conservative (0.618)
Balanced (1.0)
Aggressive (1.618)
مستوى Success مستقل لقياس قوة الحركة قبل الهدف
═════════════════════════════════════════════════════════════
🎨 عرض بصري متقدم (3D Visualization)
تمثيل ثلاثي الأبعاد للنموذج
عمق بصري يعكس حجم النموذج
منطقة هدف ثلاثية الأبعاد
ألوان ديناميكية عند تحقق الهدف
🎨 الهدف من 3D ليس الزينة
بل قراءة النموذج بصريًا بسرعة ووضوح
═════════════════════════════════════════════════════════════
⚙️ أهم المميزات
✅ اكتشاف تلقائي للأوتاد
✅ فلترة ذكية تقلل الإشارات الوهمية
✅ تقييم جودة حقيقي لكل نموذج
✅ أهداف واقعية وقابلة للتخصيص
✅ دعم كامل لـ Rising & Falling Wedge
✅ يعمل على جميع الأسواق والفريمات
✅ تصميم احترافي وأداء عالي
═════════════════════════════════════════════════════════════
📊 سيناريوهات الاستخدام
🟢 المضاربة السريعة
أطر: 1–15 دقيقة
جودة ≥ 60
أهداف محافظة
🔵 التداول اليومي
أطر: 15د–1س
جودة ≥ 50
أهداف متوازنة
🟣 التداول المتأرجح
أطر: 4س–يومي
جودة ≥ 40
قناة صارمة
أهداف عدوانية
🟠 العملات الرقمية
تقارب صارم
قناة صارمة
جودة ≥ 65
═════════════════════════════════════════════════════════════
🔔 التنبيهات
كسر وتد هابط ⇒ شراء
كسر وتد صاعد ⇒ بيع
أي كسر وتد
═════════════════════════════════════════════════════════════
⚠️ إخلاء المسؤولية
هذا المؤشر لأغراض تعليمية وتحليلية فقط. لا يُمثل نصيحة مالية أو استثمارية أو تداولية. استخدمه بالتزامن مع استراتيجيتك الخاصة وإدارة المخاطر. لا يتحمل TradingView ولا المطور مسؤولية أي قرارات مالية أو خسائر.

Master Crypto Overlay [R2D2]The Gemini Master Crypto Overlay: User Guide
1. Introduction
The Gemini Master Crypto Overlay is a professional-grade TradingView script designed to consolidate six powerful institutional indicators into a single, clean "heads-up display" (HUD).
Instead of cluttering your chart with multiple sub-windows (which shrinks your view of the price), this script uses smart overlays and a data dashboard to provide actionable data instantly. It is optimized for the Daily timeframe as requested, but functions on all timeframes.
Included Indicators:
Ichimoku Cloud: Identifies the primary trend and support/resistance zones.
MACD (Custom Crypto Settings): Optimized (3-10-16) for catching fast crypto moves.
WaveTrend Oscillator: Visual signals for Overbought/Oversold entries.
Supertrend: A trailing stop-loss line to keep you in profitable trades.
Ultimate RSI (MTF): Multi-timeframe analysis to ensure you are trading with the higher trend.
Volume Reference (VWAP): An on-chart proxy for Volume Profile to spot fair value.
2. Installation Instructions
Step 1: Open Pine Editor
Launch your chart on TradingView.
At the bottom of the screen, click the tab labeled Pine Editor.
Step 2: Paste the Code
Delete any text currently in the editor window.
Copy the code block at the bottom of this response.
Paste it into the editor.
Step 3: Save and Add
Click "Save" (top right of the editor) and name it "Master Crypto Overlay".
Click "Add to chart".
Note: You may hide the "Pine Editor" panel now by clicking the arrow at the bottom center of the screen.
3. How to Use the Interface
The script is designed to be intuitive. Here is what you are looking at:
A. The Dashboard (Bottom Right)
This is your "Confluence Checker." It summarizes the status of the major indicators in real-time.
GREEN: Bullish (Buy/Hold)
RED: Bearish (Sell/Short)
GRAY: Neutral/Choppy (Stay out)
Pro Tip: Do not enter a trade unless at least 3 out of 4 signals on the dashboard match your direction.
B. On-Chart Signals
Clouds (Red/Green): If the cloud is Green and rising, only look for Long trades. If Red, only look for Short trades.
Supertrend Line: This continuous line trails the price. If price is above it (Green line), you are safe. If price closes below it, the trend has reversed.
MACD Labels: Small "MACD" text appears when momentum flips.
WaveTrend Circles:
Blue Circle (Bottom): Price is "Oversold." Good time to buy if the trend is up.
Orange Circle (Top): Price is "Overbought." Good time to take profit.
4. Strategy: Maximizing Trading Returns
To make money with this script, you need a rule-based system. Do not just blindly click when you see a label. Use this "Trend & Trigger" strategy:
The "Golden Entry" (High Probability Long)
Trend Check: Ensure price is ABOVE the Ichimoku Cloud.
Dashboard Check: Verify the RSI Status says "BULL (>50)".
The Trigger: Wait for a pullback where price touches the Supertrend Line (Green) or the top of the Cloud.
The Entry: Enter the trade when a Blue WaveTrend Circle appears OR a MACD Buy Label prints.
Stop Loss: Place your stop loss slightly below the Supertrend line.
The "Exit Strategy" (Protecting Profits)
Conservative: Sell half your position when an Orange WaveTrend Circle appears.
Trend Follower: Hold the rest of your position until the Supertrend Line turns RED.

Multi-MA SuiteMulti-MA Suite - Customizable Moving Averages Indicator
Overview
Multi-MA Suite is a comprehensive moving average indicator that combines both Exponential Moving Averages (EMAs) and Simple Moving Averages (SMAs) in a single, highly customizable tool. Designed for traders who rely on multiple timeframe analysis, this indicator provides up to 9 moving averages (5 EMAs + 4 SMAs) with full control over visibility, color schemes, and parameters.
Key Features
✓ Dual MA Types:
5 Exponential Moving Averages (EMAs) - Responsive to recent price action, ideal for short to medium timeframes
4 Simple Moving Averages (SMAs) - Slow and stable, specifically designed for long timeframe analysis
✓ Full Customization:
Individual toggle switches to show/hide each moving average
Custom color picker for each MA line
Adjustable length and source for all moving averages
Progressive line width (thicker lines for longer periods)
✓ Pre-configured Defaults:
EMA: 9, 21, 50, 100, 200 (common swing trading periods)
SMA: 50, 100, 200, 300 (institutional reference levels for long-term trends)
Color-coded scheme: Warm colors (yellow-orange) for EMAs, Cool colors (blue-purple) for SMAs
✓ Clean Interface:
Organized input groups for easy navigation
Clear labeling and logical parameter ordering
Minimal chart clutter with toggle controls
Key Difference - Speed & Timeframe:
EMAs: Fast and reactive → Best for short to medium timeframes (1-min to 4-hour charts)
SMAs: Slow and smooth → Best for long timeframes (daily, weekly, monthly charts)
Recommended Settings
Day Trading (Short Timeframes):
Focus on EMAs: 9, 21, 50
Use 1-minute to 15-minute charts
SMAs react too slowly for intraday timeframes
Swing Trading (Medium Timeframes):
Use all EMAs with SMA 50 and 200
1-hour to daily charts work best
Mix of EMAs for entries, SMAs for trend context
Position Trading (Long Timeframes):
Focus primarily on SMAs: 50, 100, 200, 300
Daily to weekly charts recommended
SMAs excel here due to their slow, stable nature
Can add EMA 200 for comparison
Investment Analysis (Very Long Timeframes):
SMAs only: 100, 200, 300
Weekly to monthly charts
SMA's slow calculation filters noise perfectly for long-term trends
EMA Timeframe-Specific Recommendations
📌 Important Notes on EMA Usage by Timeframe:
Small Timeframes (5-minute and 15-minute charts):
Use 9 EMA and 21 EMA
These fast EMAs respond quickly to price changes
Perfect for scalping and day trading
The 9/21 EMA crossover is a popular day trading strategy
Medium Timeframes (1-hour to 4-hour charts):
Use 21 EMA and 50 EMA
Balances responsiveness with trend reliability
Ideal for swing trading and intraday position holding
The 21/50 EMA combination filters out noise while staying responsive
Long Timeframes (Daily and Weekly charts):
Use 50 EMA and 200 EMA
The classic trend-following combination
50 EMA for medium-term trend, 200 EMA for major trend
The 50/200 EMA crossover is known as the "Golden Cross" (bullish) or "Death Cross" (bearish)
For very long-term analysis on these timeframes, consider using SMAs instead
Quick Reference Guide:
5m / 15m: EMA 9 & 21
1h / 4h: EMA 21 & 50
1D / 1W: EMA 50 & 200 (or switch to SMAs for even smoother signals)
Practical Trading Strategy with EMAs
📌 Why Use EMAs for Active Trading:
For active trading, use EMAs because they have faster movement compared to SMAs. This faster response to price changes allows you to catch trends earlier and exit trades before major reversals occur.
Three-EMA Trading System:
1. 9 EMA - Quick Trend Recognition:
Use the 9 EMA to understand the trend quickly
When price is above 9 EMA = Short-term uptrend
When price is below 9 EMA = Short-term downtrend
The 9 EMA reacts immediately to price momentum changes
Perfect for entry timing and quick trend identification
2. 21 EMA - Exit Signal and Trend Confirmation:
When the 21 EMA breaks (price crosses it), exit your trade
This is critical because when the 21 EMA breaks, the trend will likely reverse
The 21 EMA acts as your "stop-loss line"
Breaking the 21 EMA signals that the short-term momentum has shifted
Example: In an uptrend, when price crosses below 21 EMA, exit longs immediately
Example: In a downtrend, when price crosses above 21 EMA, exit shorts immediately
3. 50 EMA - Full Correction Understanding:
Use the 50 EMA to understand the complete correction
The 50 EMA shows where the full pullback or correction might end
When price reaches the 50 EMA, it often bounces (in a strong trend)
Breaking the 50 EMA indicates a deeper correction or potential trend reversal
Use it to gauge the strength of the overall trend
Customization Tips
Toggle unnecessary MAs off to reduce chart clutter based on your trading style and timeframe
For the 3-EMA trading strategy, enable only 9, 21, and 50 EMAs
For long timeframes (daily+), disable EMAs and use only SMAs to avoid over-reactive signals
Match your EMA selection to your timeframe using the guide above
Adjust colors to match your chart theme or to highlight specific MAs
Modify lengths to fit specific market conditions or asset volatility
Change source from close to high/low/HL2 for alternative perspectives
Use thicker lines for key decision MAs (edit linewidth in settings)
Color Scheme Rationale
EMAs (Warm Colors):
Yellow → Orange progression represents increasing timeframes while maintaining visual cohesion. The warm palette signals "active" or "fast-reacting" nature of EMAs, perfect for shorter timeframes and active trading.
SMAs (Cool Colors):
Blue → Purple progression provides clear visual distinction from EMAs. The cool palette suggests "stable," "slow," and "smooth" characteristics of SMAs, ideal for long timeframe analysis.
What Makes This Different?
Unlike basic MA indicators, Multi-MA Suite provides:
Both EMA and SMA in one indicator (saves indicator slots)
Optimized MA selection based on speed characteristics - fast EMAs for short timeframes, slow SMAs for long timeframes
Clear timeframe-specific EMA recommendations for immediate use
Practical trading strategy included - 9 EMA for trend, 21 EMA for exit, 50 EMA for corrections
Individual control over each MA (toggle, color, parameters)
Thoughtful default settings based on widely-used trading periods
Color-coded system for instant visual differentiation
Clean, organized interface for efficient workflow
Installation & Usage
Add the indicator to your chart
Open indicator settings to customize
For active trading: Enable 9, 21, and 50 EMAs (the recommended trading system)
Select appropriate MAs for your timeframe (use the EMA timeframe guide above)
Toggle MAs on/off based on your analysis needs
Adjust colors if desired to match your chart theme
Modify lengths and sources as needed for your strategy
⚠️ IMPORTANT DISCLAIMER
EDUCATIONAL AND INFORMATIONAL PURPOSES ONLY
This indicator and its accompanying documentation are provided for educational and informational purposes only. The content does not constitute financial advice, investment advice, trading advice, or any other sort of advice, and you should not treat any of the indicator's content as such.
NO GUARANTEE OF RESULTS
Past performance is not indicative of future results. The strategies, techniques, and concepts discussed herein are provided "as is" without any warranty of any kind. Trading and investing in financial markets involves substantial risk of loss and is not suitable for every investor.
RISK ACKNOWLEDGMENT
You can lose money trading: Trading stocks, forex, futures, options, cryptocurrencies, and other financial instruments carries a high level of risk and may not be suitable for all investors. You may sustain a total loss of your investment.
No guaranteed profits: The use of moving averages or any technical indicator does not guarantee profitable trades. Markets can remain irrational longer than you can remain solvent.
Lagging indicators: All moving averages are lagging indicators based on historical price data and may not predict future price movements.
False signals: Moving averages can produce false signals, especially in choppy, sideways, or low-volume market conditions.
YOUR RESPONSIBILITY
Do your own research: Before making any trading or investment decision, you should conduct your own research and due diligence.
Consult professionals: Consider seeking advice from qualified financial advisors, certified public accountants, or licensed professionals before making financial decisions.
Risk management: Always use proper risk management, including stop-losses, position sizing, and diversification.
Demo trading: Test any strategy on a demo account before risking real capital.
Understand the markets: Ensure you fully understand the markets you're trading and the risks involved.
PERSONAL TRADING DECISIONS
All trading decisions are made at your own discretion and at your own risk. You are solely responsible for all trading decisions you make. The strategies mentioned (including the 9/21/50 EMA system) are examples only and should not be followed blindly without proper testing and risk assessment.
MARKET CONDITIONS VARY
Market conditions change constantly. What works in one market condition may not work in another. Trending strategies (like the ones discussed) typically perform poorly in ranging markets. Adapt your approach based on current market conditions.
USE AT YOUR OWN RISK
By using this indicator, you acknowledge that you have read this disclaimer and agree to be bound by its terms. If you do not agree with any part of this disclaimer, do not use this indicator.

LuxyEnergyIndexThe Luxy Energy Index (LEI) library provides functions to measure price movement exhaustion by analyzing three dimensions: Extension (distance from fair value), Velocity (speed of movement), and Volume (confirmation level).
LEI answers a different question than traditional momentum indicators: instead of "how far has price gone?" (like RSI), LEI asks "how tired is this move?"
This library allows Pine Script developers to integrate LEI calculations into their own indicators and strategies.
How to Import
//@version=6
indicator("My Indicator")
import OrenLuxy/LuxyEnergyIndex/1 as LEI
Main Functions
`lei(src)` → float
Returns the LEI value on a 0-100 scale.
src (optional): Price source, default is `close`
Returns : LEI value (0-100) or `na` if insufficient data (first 50 bars)
leiValue = LEI.lei()
leiValue = LEI.lei(hlc3) // custom source
`leiDetailed(src)` → tuple
Returns LEI with all component values for detailed analysis.
= LEI.leiDetailed()
Returns:
`lei` - Final LEI value (0-100)
`extension` - Distance from VWAP in ATR units
`velocity` - 5-bar price change in ATR units
`volumeZ` - Volume Z-Score
`volumeModifier` - Applied modifier (1.0 = neutral)
`vwap` - VWAP value used
Component Functions
| Function | Description | Returns |
|-----------------------------------|---------------------------------|---------------|
| `calcExtension(src, vwap)` | Distance from VWAP / ATR | float |
| `calcVelocity(src)` | 5-bar price change / ATR | float |
| `calcVolumeZ()` | Volume Z-Score | float |
| `calcVolumeModifier(volZ)` | Volume modifier | float (≥1.0) |
| `getVWAP()` | Auto-detects asset type | float |
Signal Functions
| Function | Description | Returns |
|---------------------------------------------|----------------------------------|-----------|
| `isExhausted(lei, threshold)` | LEI ≥ threshold (default 70) | bool |
| `isSafe(lei, threshold)` | LEI ≤ threshold (default 30) | bool |
| `crossedExhaustion(lei, threshold)` | Crossed into exhaustion | bool |
| `crossedSafe(lei, threshold)` | Crossed into safe zone | bool |
Utility Functions
| Function | Description | Returns |
|----------------------------|-------------------------|-----------|
| `getZone(lei)` | Zone name | string |
| `getColor(lei)` | Recommended color | color |
| `hasEnoughHistory()` | Data check | bool |
| `minBarsRequired()` | Required bars | int (50) |
| `version()` | Library version | string |
Interpretation Guide
| LEI Range | Zone | Meaning |
|-------------|--------------|--------------------------------------------------|
| 0-30 | Safe | Low exhaustion, move may continue |
| 30-50 | Caution | Moderate exhaustion |
| 50-70 | Warning | Elevated exhaustion |
| 70-100 | Exhaustion | High exhaustion, increased reversal risk |
Example: Basic Usage
//@version=6
indicator("LEI Example", overlay=false)
import OrenLuxy/LuxyEnergyIndex/1 as LEI
// Get LEI value
leiValue = LEI.lei()
// Plot with dynamic color
plot(leiValue, "LEI", LEI.getColor(leiValue), 2)
// Reference lines
hline(70, "High", color.red)
hline(30, "Low", color.green)
// Alert on exhaustion
if LEI.crossedExhaustion(leiValue) and barstate.isconfirmed
alert("LEI crossed into exhaustion zone")
Technical Details
Fixed Parameters (by design):
Velocity Period: 5 bars
Volume Period: 20 bars
Z-Score Period: 50 bars
ATR Period: 14
Extension/Velocity Weights: 50/50
Asset Support:
Stocks/Forex: Uses Session VWAP (daily reset)
Crypto: Uses Rolling VWAP (50-bar window) - auto-detected
Edge Cases:
Returns `na` until 50 bars of history
Zero volume: Volume modifier defaults to 1.0 (neutral)
Credits and Acknowledgments
This library builds upon established technical analysis concepts:
VWAP - Industry standard volume-weighted price measure
ATR by J. Welles Wilder Jr. (1978) - Volatility normalization
Z-Score - Statistical normalization method
Volume analysis principles from Volume Spread Analysis (VSA) methodology
Disclaimer
This library is provided for **educational and informational purposes only**. It does not constitute financial advice. Past performance does not guarantee future results. The exhaustion readings are probabilistic indicators, not guarantees of price reversal. Always conduct your own research and use proper risk management when trading.

Impulse Reactor RSI-SMA Trend Indicator [ApexLegion]Impulse Reactor RSI-SMA Trend Indicator
Introduction and Theoretical Background
Design Rationale
Standard indicators frequently generate binary 'BUY' or 'SELL' signals without accounting for the broader market context. This often results in erratic "Flip-Flop" behavior, where signals are triggered indiscriminately regardless of the prevailing volatility regime.
Impulse Reactor was engineered to address this limitation by unifying two critical requirements: Quantitative Rigor and Execution Flexibility.
The Solution
Composite Analytical Framework This script is not a simple visual overlay of existing indicators. It is an algorithmic synthesis designed to function as a unified decision-making engine. The primary objective was to implement rigorous quantitative analysis (Volatility Normalization, Structural Filtering) directly within an alert-enabled framework. This architecture is designed to process signals through strict, multi-factor validation protocols before generating real-time notifications, allowing users to focus on structurally validated setups without manual monitoring.
How It Works
This is not a simple visual mashup. It utilizes a cross-validation algorithm where the Trend Structure acts as a gatekeeper for Momentum signals:
Logic over Lag: Unlike simple moving average crossovers, this script uses a 15-layer Gradient Ribbon to detect "Laminar Flow." If the ribbon is knotted (Compression), the system mathematically suppresses all signals.
Volatility Normalization: The core calculation adapts to ATR (Average True Range). This means the indicator automatically expands in volatile markets and contracts in quiet ones, maintaining accuracy without constant manual tweaking.
Adaptive Signal Thresholding: It incorporates an 'Anti-Greed' algorithm (Dynamic Thresholding) that automatically adjusts entry criteria based on trend duration. This logic aims to mitigate the risk of entering positions during periods of statistical trend exhaustion.
Why Use It?
Market State Decoding: The gradient Ribbon visualizes the underlying trend phase in real-time.
◦ Cyan/Blue Flow: Strong Bullish Trend (Laminar Flow).
◦ Magenta/Pink Flow: Strong Bearish Trend.
◦ Compressed/Knotted: When the ribbon lines are tightly squeezed or overlapping, it signals Consolidation. The system filters signals here to avoid chop.
Noise Reduction: The goal is not to catch every pivot, but to isolate high-confidence setups. The logic explicitly filters out minor fluctuations to help maintain position alignment with the broader trend.
⚖️ Chapter 1: System Architecture
Introduction: Composite Analytical Framework
System Overview
Impulse Reactor serves as a comprehensive technical analysis engine designed to synthesize three distinct market dimensions—Momentum, Volatility, and Trend Structure—into a unified decision-making framework. Unlike traditional methods that analyze these metrics in isolation, this system functions as a central processing unit that integrates disparate data streams to construct a coherent model of market behavior.
Operational Objective
The primary objective is to transition from single-dimensional signal generation to a multi-factor assessment model. By fusing data from the Impulse Core (Volatility), Gradient Oscillator (Momentum), and Structural Baseline (Trend), the system aims to filter out stochastic noise and identify high-probability trade setups grounded in quantitative confluence.
Market Microstructure Analysis: Limitations of Conventional Models
Extensive backtesting and quantitative analysis have identified three critical inefficiencies in standard oscillator-based strategies:
• Bounded Oscillator Limitations (The "Oscillation Trap"): Traditional indicators such as RSI or Stochastics are mathematically constrained between fixed values (0 to 100). In strong trending environments, these metrics often saturate in "overbought" or "oversold" zones. Consequently, traders relying on static thresholds frequently exit structurally valid positions prematurely or initiate counter-trend trades against prevailing momentum, resulting in suboptimal performance.
• Quantitative Blindness to Quality: Standard moving averages and trend indicators often fail to distinguish the qualitative nature of price movement. They treat low-volume drift and high-velocity expansion identically. This inability to account for "Volatility Quality" leads to delayed responsiveness during critical market events.
• Fractal Dissonance (Timeframe Disconnect): Financial markets exhibit fractal characteristics where trends on lower timeframes may contradict higher timeframe structures. Manual integration of multi-timeframe analysis increases cognitive load and susceptibility to human error, often resulting in conflicting biases at the point of execution.
Core Design Principles
To mitigate the aforementioned systemic inefficiencies, Impulse Reactor employs a modular architecture governed by three foundational principles:
Principle A:
Volatility Precursor Analysis Market mechanics demonstrate that volatility expansion often functions as a leading indicator for directional price movement. The system is engineered to detect "Volatility Deviation" — specifically, the divergence between short-term and long-term volatility baselines—prior to its manifestation in price action. This allows for entry timing aligned with the expansion phase of market volatility.
Principle B:
Momentum Density Visualization The system replaces singular momentum lines with a "Momentum Density" model utilizing a 15-layer Simple Moving Average (SMA) Ribbon.
• Concept: This visualization represents the aggregate strength and consistency of the trend.
• Application: A fully aligned and expanded ribbon indicates a robust trend structure ("Laminar Flow") capable of withstanding minor counter-trend noise, whereas a compressed ribbon signals consolidation or structural weakness.
Principle C:
Adaptive Confluence Protocols Signal validity is strictly governed by a multi-dimensional confluence logic. The system suppresses signal generation unless there is synchronized confirmation across all three analytical vectors:
1. Volatility: Confirmed expansion via the Impulse Core.
2. Momentum: Directional alignment via the Hybrid Oscillator.
3. Structure: Trend validation via the Baseline. This strict filtering mechanism significantly reduces false positives in non-trending (choppy) environments while maintaining sensitivity to genuine breakouts.
🔍 Chapter 2: Core Modules & Algorithmic Logic
Module A: Impulse Core (Normalized Volatility Deviation)
Operational Logic The Impulse Core functions as a volatility-normalized momentum gauge rather than a standard oscillator. It is designed to identify "Volatility Contraction" (Squeeze) and "Volatility Expansion" phases by quantifying the divergence between short-term and long-term volatility states.
Volatility Z-Score Normalization
The formula implements a custom normalization algorithm. Unlike standard oscillators that rely on absolute price changes, this logic calculates the Z-Score of the Volatility Spread.
◦ Numerator: (atr_f - atr_s) captures the raw momentum of volatility expansion.
◦ Denominator: (std_f + 1e-6) standardizes this value against historical variance.
◦ Result: This allows the indicator scales consistently across assets (e.g., Bitcoin vs. Euro) without manual recalibration.
f_impulse() =>
atr_f = ta.atr(fastLen) // Fast Volatility Baseline
atr_s = ta.atr(slowLen) // Slow Volatility Baseline
std_f = ta.stdev(atr_f, devLen) // Volatility Standard Deviation
(atr_f - atr_s) / (std_f + 1e-6) // Normalized Differential Calculation
Algorithmic Framework
• Differential Calculation: The system computes the spread between a Fast Volatility Baseline (ATR-10) and a Slow Volatility Baseline (ATR-30).
• Normalization Protocol: To standardize consistency across diverse asset classes (e.g., Forex vs. Crypto), the raw differential is divided by the standard deviation of the volatility itself over a 30-period lookback.
• Signal Generation:
◦ Contraction (Squeeze): When the Fast ATR compresses below the Slow ATR, it registers a potential volatility buildup phase.
◦ Expansion (Release): A rapid divergence of the Fast ATR above the Slow ATR signals a confirmed volatility expansion, validating the strength of the move.
Module B: Gradient Oscillator (RSI-SMA Hybrid)
Design Rationale To mitigate the "noise" and "false reversal" signals common in single-line oscillators (like standard RSI), this module utilizes a 15-Layer Gradient Ribbon to visualize momentum density and persistence.
Technical Architecture
• Ribbon Array: The system generates 15 sequential Simple Moving Averages (SMA) applied to a volatility-adjusted RSI source. The length of each layer increases incrementally.
• State Analysis:
Momentum Alignment (Laminar Flow): When all 15 layers are expanded and parallel, it indicates a robust trend where buying/selling pressure is distributed evenly across multiple timeframes. This state helps filter out premature "overbought/oversold" signals.
• Consolidation (Compression): When the distance between the fastest layer (Layer 1) and the slowest layer (Layer 15) approaches zero or the layers intersect, the system identifies a "Non-Tradable Zone," preventing entries during choppy market conditions.
// Laminar Flow Validation
f_validate_trend() =>
// Calculate spread between Ribbon layers
ribbon_spread = ta.stdev(ribbon_array, 15)
// Only allow signals if Ribbon is expanded (Laminar Flow)
is_flowing = ribbon_spread > min_expansion_threshold
// If compressed (Knotted), force signal to false
is_flowing ? signal : na
Module C: Adaptive Signal Filtering (Behavioral Bias Mitigation)
This subsystem, operating as an algorithmic "Anti-Greed" Mechanism, addresses the statistical tendency for signal degradation following prolonged trends.
Dynamic Threshold Adjustment
• Win Streak Detection: The algorithm internally tracks the outcome of closed trade cycles.
• Sensitivity Multiplier: Upon detecting consecutive successful signals in the same direction, a Penalty_Factor is applied to the entry logic.
• Operational Impact: This effectively raises the Required_Slope threshold for subsequent signals. For example, after three consecutive bullish signals, the system requires a 30% steeper trend angle to validate a fourth entry. This enforces stricter discipline during extended trends to reduce the probability of entering at the point of trend exhaustion.
Anti-Greed Logic: Dynamic Threshold Calculation
f_adjust_threshold(base_slope, win_streak) =>
// Adds a 10% penalty to the difficulty for every consecutive win
penalty_factor = 0.10
risk_scaler = 1 + (win_streak * penalty_factor)
// Returns the new, harder-to-reach threshold
base_slope * risk_scaler
Module D: Trend Baseline (Triple-Smoothed Structure)
The Trend Baseline serves as the structural filter for all signals. It employs a Triple-Smoothed Hybrid Algorithm designed to balance lag reduction with noise filtration.
Smoothing Stages
1. Volatility Banding: Utilizes a SuperTrend-based calculation to establish the upper and lower boundaries of price action.
2. Weighted Filter: Applies a Weighted Moving Average (WMA) to prioritize recent price data.
3. Exponential Smoothing: A final Exponential Moving Average (EMA) pass is applied to create a seamless baseline curve.
Functionality
This "Heavy" baseline resists minor intraday volatility spikes while remaining responsive to sustained structural shifts. A signal is only considered valid if the price action maintains structural integrity relative to this baseline
🚦 Chapter 3: Risk Management & Exit Protocols
Quantitative Risk Management (TP/SL & Trailing)
Foundational Architecture: Volatility-Adjusted Geometry Unlike strategies relying on static nominal values, Impulse Reactor establishes dynamic risk boundaries derived from quantitative volatility metrics. This design aligns trade invalidation levels mathematically with the current market regime.
• ATR-Based Dynamic Bracketing:
The protocol calculates Stop-Loss and Take-Profit levels by applying Fibonacci coefficients (Default: 0.786 for SL / 1.618 for TP) to the Average True Range (ATR).
◦ High Volatility Environments: The risk bands automatically expand to accommodate wider variance, preventing premature exits caused by standard market noise.
◦ Low Volatility Environments: The bands contract to tighten risk parameters, thereby dynamically adjusting the Risk-to-Reward (R:R) geometry.
• Close-Validation Protocol ("Soft Stop"):
Institutional algorithms frequently execute liquidity sweeps—driving prices briefly below key support levels to accumulate inventory.
◦ Mechanism: When the "Soft Stop" feature is enabled, the system filters out intraday volatility spikes. The stop-loss is conditional; execution is triggered only if the candle closes beyond the invalidation threshold.
◦ Strategic Advantage: This logic distinguishes between momentary price wicks and genuine structural breakdowns, preserving positions during transient volatility.
• Step-Function Trailing Mechanism:
To protect unrealized PnL while allowing for normal price breathing, a two-phase trailing methodology is employed:
◦ Phase 1 (Activation): The trailing function remains dormant until the price advances by a pre-defined percentage threshold.
◦ Phase 2 (Dynamic Floor): Once armed, the stop level creates a moving floor, adjusting relative to price action while maintaining a volatility-based (ATR) buffer to systematically protect unrealized PnL.
• Algorithmic Exit Protocols (Dynamic Liquidity Analysis)
◦ Rationale: Inefficiencies of Static Targets Static "Take Profit" levels often result in suboptimal exits. They compel traders to close positions based on arbitrary figures rather than evolving market structure, potentially capping upside during significant trends or retaining positions while the underlying trend structure deteriorates.
◦ Solution: Structural Integrity Assessment The system utilizes a Dynamic Liquidity Engine to continuously audit the validity of the position. Instead of targeting a specific price point, the algorithm evaluates whether the trend remains statistically robust.
Multi-Factor Exit Logic (The Tri-Vector System)
The Smart Exit protocol executes only when specific algorithmic invalidation criteria are met:
• 1. Momentum Exhaustion (Confluence Decay): The system monitors a 168-hour rolling average of the Confluence Score. A significant deviation below this historical baseline indicates momentum exhaustion, signaling that the driving force behind the trend has dissipated prior to a price reversal. This enables preemptive exits before a potential drawdown.
• 2. Statistical Over-Extension (Mean Reversion): Utilizing the core volatility logic, the system identifies instances where price deviates beyond 2.0 standard deviations from the mean. While the trend may be technically bullish, this statistical anomaly suggests a high probability of mean reversion (elastic snap-back), triggering a defensive exit to capitalize on peak valuation.
• 3. Oscillator Rejection (Immediate Pivot): To manage sudden V-shaped volatility, the system monitors RSI pivots. If a sharp "Pivot High" or divergence is detected, the protocol triggers an immediate "Peak Exit," bypassing standard trend filters to secure liquidity during high-velocity reversals.
🎨 Chapter 4: Visualization Guide
Gradient Oscillator Ribbon
The 15-layer SMA ribbon visualized via plot(r1...r15) represents the "Momentum Density" of the market.
• Visuals:
◦ Cyan/Blue Ribbon: Indicates Bullish Momentum.
◦ Pink/Magenta Ribbon: Indicates Bearish Momentum.
• Interpretation:
◦ Laminar Flow: When the ribbon expands widely and flows in parallel, it signifies a robust trend where momentum is distributed evenly across timeframes. This is the ideal state for trend-following.
◦ Compression (Consolidation): If the ribbon becomes narrow, twisted, or knotted, it indicates a "Non-Tradable Zone" where the market lacks a unified direction. Traders are advised to wait for clarity.
◦ Over-Extension: If the top layer crosses the Overbought (85) or Oversold (15) lines, it visually warns of potential market overheating.
Trend Baseline
The thick, color-changing line plotted via plot(baseline) represents the Structural Backbone of the market.
• Visuals: Changes color based on the trend direction (Blue for Bullish, Pink for Bearish).
• Interpretation:
Structural Filter: Long positions are statistically favored only when price action sustains above this baseline, while short positions are favored below it.
Dynamic Support/Resistance: The baseline acts as a dynamic support level during uptrends and resistance during downtrends.
Entry Signals & Labels
Text labels ("Long Entry", "Short Entry") appear when the system detects high-probability setups grounded in quantitative confluence.
• Visuals: Labeled signals appear above/below specific candles.
• Interpretation:
These signals represent moments where Volatility (Expansion), Momentum (Alignment), and Structure (Trend) are synchronized.
Smart Exit: Labels such as "Smart Exit" or "Peak Exit" appear when the system detects momentum exhaustion or structural decay, prompting a defensive exit to preserve capital.
Dynamic TP/SL Boxes
The semi-transparent colored zones drawn via fill() represent the risk management geometry.
• Visuals: Colored boxes extending from the entry point to the Take Profit (TP) and Stop Loss (SL) levels.
• Function:
Volatility-Adjusted Geometry: Unlike static price targets, these boxes expand during high volatility (to prevent wicks from stopping you out) and contract during low volatility (to optimize Risk-to-Reward ratios).
SAR + MACD Glow
Small glowing shapes appearing above or below candles.
• Visuals: Triangle or circle glows near the price bars.
• Interpretation:
This visual indicates a secondary confirmation where Parabolic SAR and MACD align with the main trend direction. It serves as an additional confluence factor to increase confidence in the trade setup.
Support/Resistance Table
A small table located at the bottom-right of the chart.
• Function: Automatically identifies and displays recent Pivot Highs (Resistance) and Pivot Lows (Support).
• Interpretation: These levels can be used as potential targets for Take Profit or invalidation points for manual Stop Loss adjustments.
🖥️ Chapter 5: Dashboard & Operational Guide
Integrated Analytics Panel (Dashboard Overview)
To facilitate rapid decision-making without manual calculation, the system aggregates critical market dimensions into a unified "Heads-Up Display" (HUD). This panel monitors real-time metrics across multiple timeframes and analytical vectors.
A. Intermediate Structure (12H Trend)
• Function: Anchors the intraday analysis to the broader market structure using a 12-hour rolling window.
• Interpretation:
◦ Bullish (> +0.5%): Indicates a positive structural bias. Long setups align with the macro flow.
◦ Bearish (< -0.5%): Indicates structural weakness. Short setups are statistically favored.
◦ Neutral: Represents a ranging environment where the Confluence Score becomes the primary weighting factor.
B. Composite Confluence Score (Signal Confidence)
• Definition: A probability metric derived from the synchronization of Volatility (Impulse Core), Momentum (Ribbon), and Trend (Baseline).
• Grading Scale:
Strong Buy/Sell (> 7.0 / < 3.0): Indicates full alignment across all three vectors. Represents a "Prime Setup" eligible for standard position sizing.
Buy/Sell (5.0–7.0 / 3.0–5.0): Indicates a valid trend but with moderate volatility confirmation.
Neutral: Signals conflicting data (e.g., Bullish Momentum vs. Bearish Structure). Trading is not recommended ("No-Trade Zone").
C. Statistical Deviation Status (Mean Reversion)
• Logic: Utilizes Bollinger Band deviation principles to quantify how far price has stretched from the statistical mean (20 SMA).
• Alert States:
Over-Extended (> 2.0 SD): Warning that price is statistically likely to revert to the mean (Elastic Snap-back), even if the trend remains technically valid. New entries are discouraged in this zone.
Normal: Price is within standard distribution limits, suitable for trend-following entries.
D. Volatility Regime Classification
• Metric: Compares current ATR against a 100-period historical baseline to categorize the market state.
• Regimes:
Low Volatility (Lvl < 1.0): Market Compression. Often precedes volatility expansion events.
Mid Volatility (Lvl 1.0 - 1.5): Standard operating environment.
High Volatility (Lvl > 1.5): Elevated market stress. Risk parameters should be adjusted (e.g., reduced position size) to account for increased variance.
E. Performance Telemetry
• Function: Displays the historical reliability of the Trend Baseline for the current asset and timeframe.
• Operational Threshold: If the displayed Win Rate falls below 40%, it suggests the current market behavior is incoherent (choppy) and does not respect trend logic. In such cases, switching assets or timeframes is recommended.
Operational Protocols & Signal Decoding
Visual Interpretation Standards
• Laminar Flow (Trade Confirmation): A valid trend is visually confirmed when the 15-layer SMA Ribbon is fully expanded and parallel. This indicates distributed momentum across timeframes.
• Consolidation (No-Trade): If the ribbon appears twisted, knotted, or compressed, the market lacks a unified directional vector.
• Baseline Interaction: The Triple-Smoothed Baseline acts as a dynamic support/resistance filter. Long positions remain valid only while price sustains above this structure.
System Calibration (Settings)
• Adaptive Signal Filtering (Prev. Anti-Greed): Enabled by default. This logic automatically raises the required trend slope threshold following consecutive wins to mitigate behavioral bias.
• Impulse Sensitivity: Controls the reactivity of the Volatility Core. Higher settings capture faster moves but may introduce more noise.
⚙️ Chapter 6: System Configuration & Alert Guide
This section provides a complete breakdown of every adjustable setting within Impulse Reactor to assist you in tailoring the engine to your specific needs.
🌐 LANGUAGE SETTINGS (Localization)
◦ Select Language (Default: English):
Function: Instantly translates all chart labels, dashboard texts into your preferred language.
Supported: English, Korean, Chinese, Spanish
⚡ IMPULSE CORE SETTINGS (Volatility Engine)
◦ Deviation Lookback (Default: 30): The period used to calculate the standard deviation of volatility.
Role: Sets the baseline for normalizing momentum. Higher values make the core smoother but slower to react.
◦ Fast Pulse Length (Default: 10): The short-term ATR period.
Role: Detects rapid volatility expansion.
◦ Slow Pulse Length (Default: 30): The long-term ATR baseline.
Role: Establishes the background volatility level. The core signal is derived from the divergence between Fast and Slow pulses.
🎯 TP/SL SETTINGS (Risk Management)
◦ SL/TP Fibonacci (Default: 0.786 / 1.618): Selects the Fibonacci ratio used for risk calculation.
◦ SL/TP Multiplier (Default: 1.5 / 2): Applies a multiplier to the ATR-based bands.
Role: Expands or contracts the Take Profit and Stop Loss boxes. Increase these values for higher volatility assets (like Altcoins) to avoid premature stop-outs.
◦ ATR Length (Default: 14): The lookback period for calculating the Average True Range used in risk geometry.
◦ Use Soft Stop (Close Basis):
Role: If enabled, Stop Loss alerts only trigger if a candle closes beyond the invalidation level. This prevents being stopped out by wick manipulations.
🔊 RIBBON SETTINGS (Momentum Visualization)
◦ Show SMA Ribbon: Toggles the visibility of the 15-layer gradient ribbon.
◦ Ribbon Line Count (Default: 15): The number of SMA lines in the ribbon array.
◦ Ribbon Start Length (Default: 2) & Step (Default: 1): Defines the spread of the ribbon.
Role: Controls the "thickness" of the momentum density visualization. A wider step creates a broader ribbon, useful for higher timeframes.
📎 DISPLAY OPTIONS
◦ Show Entry Lines / TP/SL Box / Position Labels / S/R Levels / Dashboard: Toggles individual visual elements on the chart to reduce clutter.
◦ Show SAR+MACD Glow: Enables the secondary confirmation shapes (triangles/circles) above/below candles.
📈 TREND BASELINE (Structural Filter)
◦ Supertrend Factor (Default: 12) & ATR Period (Default: 90): Controls the sensitivity of the underlying Supertrend algorithm used for the baseline calculation.
◦ WMA Length (40) & EMA Length (14): The smoothing periods for the Triple-Smoothed Baseline.
◦ Min Trend Duration (Default: 10): The minimum number of bars the trend must be established before a signal is considered valid.
🧠 SMART EXIT (Dynamic Liquidity)
◦ Use Smart Exit: Enables the momentum exhaustion logic.
◦ Exit Threshold Score (Default: 3): The sensitivity level for triggering a Smart Exit. Lower values trigger earlier exits.
◦ Average Period (168) & Min Hold Bars (5): Defines the rolling window for momentum decay analysis and the minimum duration a trade must be held before Smart Exit logic activates.
🛡️ TRAILING STOP (Step)
◦ Use Trailing Stop: Activates the step-function trailing mechanism.
◦ Step 1 Activation % (0.5) & Offset % (0.5): The price must move 0.5% in your favor to arm the first trail level, which sets a stop 0.5% behind price.
◦ Step 2 Activation % (1) & Offset % (0.2): Once price moves 1%, the trail tightens to 0.2%, securing the position.
🌀 SAR & MACD SETTINGS (Secondary Confirmation)
◦ SAR Start/Increment/Max: Standard Parabolic SAR parameters.
◦ SAR Score Scaling (ATR): Adjusts how much weight the SAR signal has in the overall confluence score.
◦ MACD Fast/Slow/Signal: Standard MACD parameters used for the "Glow" signals.
🔄 ANTI-GREED LOGIC (Behavioral Bias)
◦ Strict Entry after Win: Enables the negative feedback loop.
◦ Strict Multiplier (Default: 1.1): Increases the entry difficulty by 10% after each win.
Role: Prevents overtrading and entering at the top of an extended trend.
🌍 HTF FILTER (Multi-Timeframe)
◦ Use Auto-Adaptive HTF Filter: Automatically selects a higher timeframe (e.g., 1H -> 4H) to filter signals.
◦ Bypass HTF on Steep Trigger: Allows an entry even against the HTF trend if the local momentum slope is exceptionally steep (catch powerful reversals).
📉 RSI PEAK & CHOPPINESS
◦ RSI Peak Exit (Instant): Triggers an immediate exit if a sharp RSI pivot (V-shape) is detected.
◦ Choppiness Filter: Suppresses signals if the Choppiness Index is above the threshold (Default: 60), indicating a flat market.
📐 SLOPE TRIGGER LOGIC
◦ Force Entry on Steep Slope: Overrides other filters if the price angle is extremely vertical (high velocity).
◦ Slope Sensitivity (1.5): The angle required to trigger this override.
⛔ FLAT MARKET FILTER (ADX & ATR)
◦ Use ADX Filter: Blocks signals if ADX is below the threshold (Default: 20), indicating no trend.
◦ Use ATR Flat Filter: Blocks signals if volatility drops below a critical level (dead market).
🔔 Alert Configuration Guide
Impulse Reactor is designed with a comprehensive suite of alert conditions, allowing you to automate your trading or receive real-time notifications for specific market events.
How to Set Up:
Click the "Alert" (Clock) icon in the TradingView toolbar.
Select "Impulse Reactor " from the Condition dropdown.
Choose one of the specific trigger conditions below:
🚀 Entry Signals (Trend Initiation)
Long Entry:
Trigger: Fires when a confirmed Bullish Setup is detected (Momentum + Volatility + Structure align).
Usage: Use this to enter new Long positions.
Short Entry:
Trigger: Fires when a confirmed Bearish Setup is detected.
Usage: Use this to enter new Short positions.
🎯 Profit Taking (Target Levels)
Long TP:
Trigger: Fires when price hits the calculated Take Profit level for a Long trade.
Usage: Automate partial or full profit taking.
Short TP:
Trigger: Fires when price hits the calculated Take Profit level for a Short trade.
Usage: Automate partial or full profit taking.
🛡️ Defensive Exits (Risk Management)
Smart Exit:
Trigger: Fires when the system detects momentum decay or statistical exhaustion (even if the trend hasn't fully reversed).
Usage: Recommended for tightening stops or closing positions early to preserve gains.
Overbought / Oversold:
Trigger: Fires when the ribbon extends into extreme zones.
Usage: Warning signal to prepare for a potential reversal or pullback.
💡 Secondary Confirmation (Confluence)
SAR+MACD Bullish:
Trigger: Fires when Parabolic SAR and MACD align bullishly with the main trend.
Usage: Ideal for Pyramiding (adding to an existing winning position).
SAR+MACD Bearish:
Trigger: Fires when Parabolic SAR and MACD align bearishly.
Usage: Ideal for adding to short positions.
⚠️ Chapter 7: Conclusion & Risk Disclosure
Methodological Synthesis
Impulse Reactor represents a shift from reactive price tracking to proactive energy analysis. By decomposing market activity into its atomic components — Volatility, Momentum, and Structure — and reconstructing them into a coherent decision model, the system aims to provide a quantitative framework for market engagement. It is designed not to predict the future, but to identify high-probability conditions where kinetic energy and trend structure align.
Disclaimer & Risk Warnings
◦ Educational Purpose Only
This indicator, including all associated code, documentation, and visual outputs, is provided strictly for educational and informational purposes. It does not constitute financial advice, investment recommendations, or a solicitation to buy or sell any financial instruments.
◦ No Guarantee of Performance
Past performance is not indicative of future results. All metrics displayed on the dashboard (including "Win Rate" and "P&L") are theoretical calculations based on historical data. These figures do not account for real-world trading factors such as slippage, liquidity gaps, spread costs, or broker commissions.
◦ High-Risk Warning
Trading cryptocurrencies, futures, and leveraged financial products involves a substantial risk of loss. The use of leverage can amplify both gains and losses. Users acknowledge that they are solely responsible for their trading decisions and should conduct independent due diligence before executing any trades.
◦ Software Limitations
The software is provided "as is" without warranty. Users should be aware that market data feeds on analysis platforms may experience latency or outages, which can affect signal generation accuracy.

VMDM - Volume, Momentum & Divergence Master [BullByte]VMDM - Volume, Momentum and Divergence Master
Educational Multi-Layer Market Structure Analysis System
Multi-factor divergence engine that scores RSI momentum, volume pressure, and institutional footprints into one non-repainting confluence rating (0-100).
WHAT THIS INDICATOR IS
VMDM is an educational indicator designed to teach traders how to recognize high-probability reversal and continuation patterns by analyzing four independent market dimensions simultaneously. Instead of relying on a single indicator that may produce frequent false signals, VMDM creates a confluence-based scoring system that weights multiple confirmation factors, helping you understand which setups have stronger technical backing and which are lower quality.
This is NOT a trading system or signal generator. It is a learning tool that visualizes complex market structure concepts in an accessible format for both coders and non-coders.
THE PROBLEM IT SOLVES
Most traders face these common challenges:
Challenge 1 - Indicator Overload: Running RSI, volume analysis, and divergence detection separately creates chart clutter and conflicting signals. You waste time cross-referencing multiple windows trying to determine if all factors align.
Challenge 2 - False Divergences: Standard divergence indicators trigger on every minor pivot, creating noise. Many divergences fail because they lack supporting evidence from volume or market structure.
Challenge 3 - Missed Context: A bullish RSI divergence means nothing if it occurs during weak volume or in the middle of strong distribution. Context determines quality.
Challenge 4 - Repainting Confusion: Many divergence scripts repaint, showing perfect historical signals that never actually triggered in real-time, leading to false confidence.
Challenge 5 - Institutional Pattern Recognition: Absorption zones, stop hunts, and exhaustion patterns are taught in trading education but difficult to identify systematically without manual analysis.
VMDM addresses all five challenges by combining complementary analytical layers into one transparent, non-repainting, confluence-weighted system with visual clarity.
WHY THIS SPECIFIC COMBINATION - MASHUP JUSTIFICATION
This indicator is NOT a random mashup of popular indicators. Each of the four layers serves a specific analytical purpose and together they create a complete market structure assessment framework.
THE FOUR ANALYTICAL LAYERS
LAYER 1 - RSI MOMENTUM DIVERGENCE (Trend Exhaustion Detection)
Purpose: Identifies when price momentum is weakening before price itself reverses.
Why RSI: The Relative Strength Index measures momentum on a bounded 0-100 scale, making divergence detection mathematically consistent across all assets and timeframes. Unlike raw price oscillators, RSI normalizes momentum regardless of volatility regime.
How It Contributes: Divergence between price pivots and RSI pivots reveals early momentum exhaustion. A lower price low with a higher RSI low (bullish regular divergence) signals sellers are losing strength even as price makes new lows. This is the PRIMARY signal generator in VMDM.
Limitation If Used Alone: RSI divergence by itself produces many false signals because momentum can remain weak during continued trends. It needs confirmation from volume and structural evidence.
LAYER 2 - VOLUME PRESSURE ANALYSIS (Buying vs Selling Intensity)
Purpose: Quantifies whether the current bar's volume reflects buying pressure or selling pressure based on where price closed within the bar's range.
Methodology: Instead of just measuring volume size, VMDM calculates WHERE in the bar range the close occurred. A close near the high on high volume indicates strong buying absorption. A close near the low indicates selling pressure. The calculation accounts for wick size (wicks reduce pressure quality) and uses percentile ranking over a lookback period to normalize pressure strength on a 0-100 scale.
Formula Concept:
Buy Pressure = Volume × (Close - Low) / (High - Low) × Wick Quality Factor
Sell Pressure = Volume × (High - Close) / (High - Low) × Wick Quality Factor
Net Pressure = Buy Pressure - Sell Pressure
Pressure Strength = Percentile Rank of Net Pressure over lookback period
Why Percentile Ranking: Absolute volume varies by asset and session. Percentile ranking makes 85th percentile pressure on low-volume crypto comparable to 85th percentile pressure on high-volume forex.
How It Contributes: When a bullish divergence occurs at a pivot low AND pressure strength is above 60 (strong buying), this adds 25 confluence points. It confirms that the divergence is occurring during actual accumulation, not just weak selling.
Limitation If Used Alone: Pressure analysis shows current bar intensity but cannot identify trend exhaustion or reversal timing. High buying pressure can exist during a strong uptrend with no reversal imminent.
LAYER 3 - BEHAVIORAL FOOTPRINT PATTERNS (Volume Anomaly Detection)
CRITICAL DISCLAIMER: The terms "institutional footprint," "absorption," "stop hunt," and "exhaustion" used in this indicator are EDUCATIONAL LABELS for specific price and volume behavioral patterns. These patterns are detected through technical analysis of publicly available price, volume, and bar structure data. This indicator does NOT have access to actual institutional order flow, market maker data, broker stop-loss locations, or any non-public data source. These pattern names are used because they are common terminology in trading education to describe these technical behaviors. The analysis is interpretive and based on observable price action, not privileged information.
Purpose: Detect volume anomalies and price patterns that historically correlate with potential reversal zones or trend continuation failure.
Pattern Type 1 - Absorption (Labeled as "ACCUMULATION" or "DISTRIBUTION")
Detection Criteria: Volume is more than 2x the moving average AND bar range is less than 50 percent of the average bar range.
Interpretation: High volume compressed into a tight range suggests large participants are absorbing supply (accumulation) or distribution (distribution) without allowing price to move significantly. This often precedes directional moves once absorption completes.
Visual: Colored box zone highlighting the absorption area.
Pattern Type 2 - Stop Hunt (Labeled as "BULL HUNT" or "BEAR HUNT")
Detection Criteria: Price penetrates a recent 10-bar high or low by a small margin (0.2 percent), then closes back inside the range on above-average volume (1.5x+).
Interpretation: Price briefly spikes beyond recent structure (likely triggering stop losses placed just beyond obvious levels) then reverses. This is a classic false breakout pattern often seen before reversals.
Visual: Label at the wick extreme showing hunt direction.
Pattern Type 3 - Exhaustion (Labeled as "SELL EXHAUST" or "BUY EXHAUST")
Detection Criteria: Lower wick is more than 2.5x the body size with volume above 1.8x average and RSI below 35 (sell exhaustion), OR upper wick more than 2.5x body size with volume above 1.8x average and RSI above 65 (buy exhaustion).
Interpretation: Large wicks with high volume and extreme RSI suggest aggressive buying or selling was met with equally aggressive rejection. This exhaustion often marks short-term extremes.
Visual: Label showing exhaustion type.
How These Contribute: When a divergence forms at a pivot AND one of these behavioral patterns is active, the confluence score increases by 20 points. This confirms the divergence is occurring during structural anomaly activity, not just normal price flow.
Limitation If Used Alone: These patterns can occur mid-trend and do not indicate direction without momentum context. Absorption in a strong uptrend may just be continuation accumulation.
LAYER 4 - CONFLUENCE SCORING MATRIX (Quality Weighting System)
Purpose: Translate all detected conditions into a single 0-100 quality score so you can objectively compare setups.
Scoring Breakdown:
Divergence Present: +30 points (primary signal)
Pressure Confirmation: +25 points (volume supports direction)
Behavioral Footprint Active: +20 points (structural anomaly present)
RSI Extreme: +15 points (RSI below 30 or above 70 at pivot)
Volume Spike: +10 points (current volume above 1.5x average)
Maximum Possible Score: 100 points
Why These Weights: The weights reflect reliability hierarchy based on backtesting observation. Divergence is the core signal (30 points), but without volume confirmation (25 points) many fail. Behavioral patterns add meaningful context (20 points). RSI extremes and volume spikes are secondary confirmations (15 and 10 points).
Quality Tiers:
90-100: TEXTBOOK (all factors aligned)
75-89: HIGH QUALITY (strong confluence)
60-74: VALID (meets minimum threshold)
Below 60: DEVELOPING (not displayed unless threshold lowered)
How It Contributes: The confluence score allows you to filter noise. You can set your minimum quality threshold in settings. Higher thresholds (75+) show fewer but higher-quality patterns. Lower thresholds (50-60) show more patterns but include lower-confidence setups. This teaches you to distinguish strong setups from weak ones.
Limitation: Confluence scoring is historical observation-based, not predictive guarantee. A 95-point setup can still fail. The score represents technical alignment, not future certainty.
WHY THIS COMBINATION WORKS TOGETHER
Each layer addresses a limitation in the others:
RSI Divergence identifies WHEN momentum is exhausting (timing)
Volume Pressure confirms WHETHER the exhaustion is accompanied by opposite-side accumulation (confirmation)
Behavioral Footprint shows IF structural anomalies support the reversal hypothesis (context)
Confluence Scoring weights ALL factors into an objective quality metric (filtering)
Using only RSI divergence gives you timing without confirmation. Using only volume pressure gives you intensity without directional context. Using only pattern detection gives you anomalies without trend exhaustion context. Using all four together creates a complete analytical framework where each layer compensates for the others' weaknesses.
This is not a mashup for the sake of combining indicators. It is a structured analytical system where each component has a defined role in a multi-dimensional market assessment process.
HOW TO READ THE INDICATOR - VISUAL ELEMENTS GUIDE
VMDM displays up to five visual layer types. You can enable or disable each layer independently in settings under "Visual Layers."
VISUAL LAYER 1 - MARKET STRUCTURE (Pivot Points and Lines)
What You See:
Small labels at swing highs and lows marked "PH" (Pivot High) and "PL" (Pivot Low) with horizontal dashed lines extending right from each pivot.
What It Means:
These are CONFIRMED pivots, not real-time. A pivot low appears AFTER the required right-side confirmation bars pass (default 3 bars). This creates a delay but prevents repainting. The pivot only appears once it is mathematically confirmed.
The horizontal lines represent support (from pivot lows) and resistance (from pivot highs) levels where price previously found significant rejection.
Color Coding:
Green label and line: Pivot Low (potential support)
Red label and line: Pivot High (potential resistance)
How To Use:
These pivots are the foundation for divergence detection. Divergence is only calculated between confirmed pivots, ensuring all signals are non-repainting. The lines help you see historical structure levels.
VISUAL LAYER 2 - PRESSURE ZONES (Background Color)
What You See:
Subtle background color shading on bars - light green or light red tint.
What It Means:
This visualizes volume pressure strength in real-time.
Color Coding:
Light Green Background: Pressure Strength above 70 (strong buying pressure - price closing near highs on volume)
Light Red Background: Pressure Strength below 30 (strong selling pressure - price closing near lows on volume)
No Color: Neutral pressure (pressure between 30-70)
How To Use:
When a bullish divergence pattern appears during green pressure zones, it suggests the divergence is forming during accumulation. When a bearish divergence appears during red zones, distribution is occurring. Pressure zones help you filter divergences - those forming in supportive pressure environments have higher probability.
VISUAL LAYER 3 - DIVERGENCE LINES (Dotted Connectors)
What You See:
Dotted lines connecting two pivot points (either two pivot lows or two pivot highs).
What It Means:
A divergence has been detected between those two pivots. The line connects the price pivots where RSI showed opposite behavior.
Color Coding:
Bright Green Line: Bullish divergence (regular or hidden)
Bright Red Line: Bearish divergence (regular or hidden)
How To Use:
The divergence line appears ONLY after the second pivot is confirmed (delayed by right-side confirmation bars). This is intentional to prevent repainting. When you see the line appear, it means:
For Bullish Regular Divergence:
Price made a lower low (second pivot lower than first)
RSI made a higher low (RSI at second pivot higher than first)
Interpretation: Downtrend losing momentum
For Bullish Hidden Divergence:
Price made a higher low (second pivot higher than first)
RSI made a lower low (RSI at second pivot lower than first)
Interpretation: Uptrend continuation likely (pullback within uptrend)
For Bearish Regular Divergence:
Price made a higher high (second pivot higher than first)
RSI made a lower high (RSI at second pivot lower than first)
Interpretation: Uptrend losing momentum
For Bearish Hidden Divergence:
Price made a lower high (second pivot lower than first)
RSI made a higher high (RSI at second pivot higher than first)
Interpretation: Downtrend continuation likely (bounce within downtrend)
If "Show Consolidated Analysis Label" is disabled, a small label will appear on the divergence line showing the divergence type abbreviation.
VISUAL LAYER 4 - BEHAVIORAL FOOTPRINT MARKERS
What You See:
Boxes, labels, and markers at specific bars showing pattern detection.
ABSORPTION ZONES (Boxes):
Colored rectangular boxes spanning one or more bars.
Purple Box: Accumulation absorption zone (high volume, tight range, bullish close)
Red Box: Distribution absorption zone (high volume, tight range, bearish close)
If absorption continues for multiple consecutive bars, the box extends and a counter appears in the label showing how many bars the absorption lasted.
What It Means: Large volume is being absorbed without significant price movement. This often precedes directional breakouts once the absorption phase completes.
STOP HUNT MARKERS (Labels):
Small labels below or above wicks labeled "BULL HUNT" or "BEAR HUNT" (may show bar count if consecutive).
What It Means:
BULL HUNT : Price spiked below recent lows then reversed back up on volume - likely triggered sell stops before reversing
BEAR HUNT : Price spiked above recent highs then reversed back down on volume - likely triggered buy stops before reversing
EXHAUSTION MARKERS (Labels):
Labels showing "SELL EXHAUST" or "BUY EXHAUST."
What It Means:
SELL EXHAUST : Large lower wick with high volume and low RSI - aggressive selling met with strong rejection
BUY EXHAUST : Large upper wick with high volume and high RSI - aggressive buying met with strong rejection
How To Use:
These markers help you identify WHERE structural anomalies occurred. When a divergence signal appears AT THE SAME TIME as one of these patterns, the confluence score increases. You are looking for alignment - divergence + behavioral pattern + pressure confirmation = high-quality setup.
VISUAL LAYER 5 - CONSOLIDATED ANALYSIS LABEL (Main Pattern Signal)
What You See:
A large label appearing at pivot points (or in real-time mode, at current bar) containing full pattern analysis.
Label Appearance:
Depending on your "Use Compact Label Format" setting:
COMPACT MODE (Single Line):
Example: "BULLISH REGULAR | Q:HIGH QUALITY C:82"
Breakdown:
BULLISH REGULAR: Divergence type detected
Q:HIGH QUALITY: Pattern quality tier
C:82: Confluence score (82 out of 100)
FULL MODE (Multi-Line Detailed):
Example:
PATTERN DETECTED
-------------------
BULLISH REGULAR
Quality: HIGH QUALITY
Price: Lower Low
Momentum: Higher Low
Signal: Weakening Downtrend
CONFLUENCE: 82/100
-------------------
Divergence: 30
Pressure: 25
Institutional: 20
RSI Extreme: 0
Volume: 10
Breakdown:
Top section: Pattern type and quality
Middle section: Divergence explanation (what price did vs what RSI did)
Bottom section: Confluence score with itemized breakdown showing which factors contributed
Label Position:
In Confirmed modes: Label appears AT the pivot point (delayed by confirmation bars)
In Real-time mode: Label appears at current bar as conditions develop
Label Color:
Gold: Textbook quality (90+ confluence)
Green: High quality (75-89 confluence)
Blue: Valid quality (60-74 confluence)
How To Use:
This is your primary decision-making label. When it appears:
Check the divergence type (regular divergences are reversal signals, hidden divergences are continuation signals)
Review the quality tier (textbook and high quality have better historical win rates)
Examine the confluence breakdown to see which factors are present and which are missing
Look at the chart context (trend, support/resistance, timeframe)
Use this information to assess whether the setup aligns with your strategy
The label does NOT tell you to buy or sell. It tells you a technical pattern has formed and provides the quality assessment. Your trading decision must incorporate risk management, market context, and your strategy rules.
UNDERSTANDING THE THREE DETECTION MODES
VMDM offers three signal detection modes in settings to accommodate different trading styles and learning objectives.
MODE 1: "Confluence Only (Real-Time)"
How It Works: Displays signals AS THEY DEVELOP on the current bar without waiting for pivot confirmation. The system calculates confluence score from pressure, volume, RSI extremes, and behavioral patterns. Divergence signals are NOT required in this mode.
Delay: ZERO - signals appear immediately.
Use Case: Real-time scanning for high-confluence zones without divergence requirement. Useful for intraday traders who want immediate alerts when multiple factors align.
Tradeoff: More frequent signals but includes setups without confirmed divergence. Higher false signal rate. Signals can change as the bar develops (not repainting in historical bars, but current bar updates).
Visual Behavior: Labels appear at the current bar. No divergence lines unless divergence happens to be present.
MODE 2: "Divergence + Confluence (Confirmed)" - DEFAULT RECOMMENDED
How It Works: Full system engagement. Signals appear ONLY when:
A pivot is confirmed (requires right-side confirmation bars to pass)
Divergence is detected between current pivot and previous pivot
Total confluence score meets or exceeds your minimum threshold
Delay: Equal to your "Pivot Right Bars" setting (default 3 bars). This means signals appear 3 bars AFTER the actual pivot formed.
Use Case: Highest-quality, non-repainting signals for swing traders and learners who want to study confirmed pattern completion.
Tradeoff: Delayed signals. You will not receive the signal until confirmation occurs. In fast-moving markets, price may have already moved significantly by the time the signal appears.
Visual Behavior: Labels appear at the historical pivot location (in the past). Divergence lines connect the two pivots. This is the most educational mode because it shows completed, confirmed patterns.
Non-Repainting Guarantee: Yes. Once a signal appears, it never disappears or changes.
MODE 3: "Divergence + Confluence (Relaxed)"
How It Works: Same as Confirmed mode but with adaptive thresholds. If confluence is very high (10 points above threshold), the signal may appear even if some factors are weak. If divergence is present but confluence is slightly below threshold (within 10 points), it may still appear.
Delay: Same as Confirmed mode (right-side confirmation bars).
Use Case: Slightly more signals than Confirmed mode for traders willing to accept near-threshold setups.
Tradeoff: More signals but lower average quality than Confirmed mode.
Visual Behavior: Same as Confirmed mode.
DASHBOARD GUIDE - READING THE METRICS
The dashboard appears in the corner of your chart (position selectable in settings) and provides real-time market state analysis.
You can choose between four dashboard detail levels in settings: Off, Compact, Optimized (default), Full.
DASHBOARD ROW EXPLANATIONS
ROW 1 - Header Information
Left: Current symbol and timeframe
Center: "VMDM "
Right: Version number
ROW 2 - Mode and Delay
Shows which detection mode you are using and the signal delay.
Example: "CONFIRMED | Delay: 3 bars"
This reminds you that signals in confirmed mode appear 3 bars after the pivot forms.
ROW 3 - Market Regime
Format: "TREND UP HV" or "RANGING NV"
First Part - Trend State:
TREND UP: 20 EMA above 50 EMA with strong separation
TREND DOWN: 20 EMA below 50 EMA with strong separation
RANGING: EMAs close together, low trend strength
TRANSITION: Between trending and ranging states
Second Part - Volatility State:
HV: High Volatility (current ATR more than 1.3x the 50-bar average ATR)
NV: Normal Volatility (current ATR between 0.7x and 1.3x average)
LV: Low Volatility (current ATR less than 0.7x average)
Third Column: Volatility ratio (example: "1.45x" means current ATR is 1.45 times normal)
How To Use: Regime context helps you interpret signals. Reversal divergences are more reliable in ranging or transitional regimes. Continuation divergences (hidden) are more reliable in trending regimes. High volatility means wider stops may be needed.
ROW 4 - Pressure
Shows current volume pressure state.
Format: "BUYING | ██████████░░░░░░░░░"
States:
BUYING : Pressure strength above 60 (closes near highs)
SELLING : Pressure strength below 40 (closes near lows)
NEUTRAL : Pressure strength between 40-60
Bar Visualization: Each block represents 10 percentile points. A full bar (10 filled blocks) = 100th percentile pressure.
Color: Green for buying, red for selling, gray for neutral.
How To Use: When pressure aligns with divergence direction (bullish divergence during buying pressure), confluence is stronger.
ROW 5 - Volume and RSI
Format: "1.8x | RSI 68 | OB"
First Value: Current volume ratio (1.8x = volume is 1.8 times the moving average)
Second Value: Current RSI reading
Third Value: RSI state
OB: Overbought (RSI above 70)
OS: Oversold (RSI below 30)
Blank: Neutral RSI
How To Use: Volume spikes (above 1.5x) during divergence formation add confluence. RSI extremes at pivots add confluence.
ROW 6 - Behavioral Footprint
Format: "BULL HUNT | 2 bars"
Shows the most recent behavioral pattern detected and how long ago.
States:
ACCUMULATION / DISTRIBUTION: Absorption detected
BULL HUNT / BEAR HUNT: Stop hunt detected
SELL EXHAUST / BUY EXHAUST: Exhaustion detected
SCANNING: No recent pattern
NOW: Pattern is active on current bar
How To Use: When footprint activity is recent (within 50 bars) or active now, it adds context to divergence signals forming in that area.
ROW 7 - Current Pattern
Shows the divergence type currently detected (if any).
Examples: "BULLISH REGULAR", "BEARISH HIDDEN", "Scanning..."
Quality: Shows pattern quality (TEXTBOOK, HIGH QUALITY, VALID)
How To Use: This tells you what type of signal is active. Regular divergences are reversal setups. Hidden divergences are continuation setups.
ROW 8 - Session Summary
Format: "14 events | A3 H8 E3"
First Value: Total institutional events this session
Breakdown:
A: Absorption events
H: Stop hunt events
E: Exhaustion events
How To Use: High event counts suggest an active, volatile session with frequent structural anomalies. Low counts suggest quiet, orderly price action.
ROW 9 - Confluence Score (Optimized/Full mode only)
Format: "78/100 | ████████░░"
Shows current real-time confluence score even if no pattern is confirmed yet.
How To Use: Watch this in real-time to see how close you are to pattern formation. When it exceeds your threshold and divergence forms, a signal will appear (after confirmation delay).
ROW 10 - Patterns Studied (Optimized/Full mode only)
Format: "47 patterns | 12 bars ago"
First Value: Total confirmed patterns detected since chart loaded
Second Value: How many bars since the last confirmed pattern appeared
How To Use: Helps you understand pattern frequency on your selected symbol and timeframe. If many bars have passed since last pattern, market may be trending without reversal opportunities.
ROW 11 - Bull/Bear Ratio (Optimized/Full mode only)
Format: "28:19 | BULL"
Shows count of bullish vs bearish patterns detected.
Balance:
BULL: More bullish patterns detected (suggests market has had more bullish reversals/continuations)
BEAR: More bearish patterns detected
BAL: Equal counts
How To Use: Extreme imbalances can indicate directional bias in the studied period. A heavily bullish ratio in a downtrend might suggest frequent failed rallies (bearish continuation). Context matters.
ROW 12 - Volume Ratio Detail (Optimized/Full mode only)
Shows current volume vs average volume in absolute terms.
Example: "1.4x | 45230 / 32300"
How To Use: Confirms whether current activity is above or below normal.
ROW 13 - Last Institutional Event (Full mode only)
Shows the most recent institutional pattern type and how many bars ago it occurred.
Example: "DISTRIBUTION | 23 bars"
How To Use: Tracks recency of last anomaly for context.
SETTINGS GUIDE - EVERY PARAMETER EXPLAINED
PERFORMANCE SECTION
Enable All Visuals (Master Toggle)
Default: ON
What It Does: Master kill switch for ALL visual elements (labels, lines, boxes, background colors, dashboard). When OFF, only plot outputs remain (invisible unless you open data window).
When To Change: Turn OFF on mobile devices, 1-second charts, or slow computers to improve performance. You can still receive alerts even with visuals disabled.
Impact: Dramatic performance improvement when OFF, but you lose all visual feedback.
Maximum Object History
Default: 50 | Range: 10-100
What It Does: Limits how many of each object type (labels, lines, boxes) are kept in memory. Older objects beyond this limit are deleted.
When To Change: Lower to 20-30 on fast timeframes (1-minute charts) to prevent slowdown. Increase to 100 on daily charts if you want more historical pattern visibility.
Impact: Lower values = better performance but less historical visibility. Higher values = more history visible but potential slowdown on fast timeframes.
Alert Cooldown (Bars)
Default: 5 | Range: 1-50
What It Does: Minimum number of bars that must pass before another alert of the same type can fire. Prevents alert spam when multiple patterns form in quick succession.
When To Change: Increase to 20+ on 1-minute charts to reduce noise. Decrease to 1-2 on daily charts if you want every pattern alerted.
Impact: Higher cooldown = fewer alerts. Lower cooldown = more alerts.
USER EXPERIENCE SECTION
Show Enhanced Tooltips
Default: ON
What It Does: Enables detailed hover-over tooltips on labels and visual elements.
When To Change: Turn OFF if you encounter Pine Script compilation errors related to tooltip arguments (rare, platform-specific issue).
Impact: Minimal. Just adds helpful hover text.
MARKET STRUCTURE DETECTION SECTION
Pivot Left Bars
Default: 3 | Range: 2-10
What It Does: Number of bars to the LEFT of the center bar that must be higher (for pivot low) or lower (for pivot high) than the center bar for a pivot to be valid.
Example: With value 3, a pivot low requires the center bar's low to be lower than the 3 bars to its left.
When To Change:
Increase to 5-7 on noisy timeframes (1-minute charts) to filter insignificant pivots
Decrease to 2 on slow timeframes (daily charts) to catch more pivots
Impact: Higher values = fewer, more significant pivots = fewer signals. Lower values = more frequent pivots = more signals but more noise.
Pivot Right Bars
Default: 3 | Range: 2-10
What It Does: Number of bars to the RIGHT of the center bar that must pass for confirmation. This creates the non-repainting delay.
Example: With value 3, a pivot is confirmed 3 bars AFTER it forms.
When To Change:
Increase to 5-7 for slower, more confirmed signals (better for swing trading)
Decrease to 2 for faster signals (better for intraday, but still non-repainting)
Impact: Higher values = longer delay but more reliable confirmation. Lower values = faster signals but less confirmation. This setting directly controls your signal delay in Confirmed and Relaxed modes.
Minimum Confluence Score
Default: 60 | Range: 40-95
What It Does: The threshold score required for a pattern to be displayed. Patterns with confluence scores below this threshold are not shown.
When To Change:
Increase to 75+ if you only want high-quality textbook setups (fewer signals)
Decrease to 50-55 if you want to see more developing patterns (more signals, lower average quality)
Impact: This is your primary signal filter. Higher threshold = fewer, higher-quality signals. Lower threshold = more signals but includes weaker setups. Recommended starting point is 60-65.
TECHNICAL PERIODS SECTION
RSI Period
Default: 14 | Range: 5-50
What It Does: Lookback period for RSI calculation.
When To Change:
Decrease to 9-10 for faster, more sensitive RSI that detects shorter-term momentum changes
Increase to 21-28 for slower, smoother RSI that filters noise
Impact: Lower values make RSI more volatile (more frequent extremes and divergences). Higher values make RSI smoother (fewer but more significant divergences). 14 is industry standard.
Volume Moving Average Period
Default: 20 | Range: 10-200
What It Does: Lookback period for calculating average volume. Current volume is compared to this average to determine volume ratio.
When To Change:
Decrease to 10-14 for shorter-term volume comparison (more sensitive to recent volume changes)
Increase to 50-100 for longer-term volume comparison (smoother, less sensitive)
Impact: Lower values make volume ratio more volatile. Higher values make it more stable. 20 is standard.
ATR Period
Default: 14 | Range: 5-100
What It Does: Lookback period for Average True Range calculation used for volatility measurement and label positioning.
When To Change: Rarely needs adjustment. Use 7-10 for faster volatility response, 21-28 for slower.
Impact: Affects volatility ratio calculation and visual label spacing. Minimal impact on signals.
Pressure Percentile Lookback
Default: 50 | Range: 10-300
What It Does: Lookback period for calculating volume pressure percentile ranking. Your current pressure is ranked against the pressure of the last X bars.
When To Change:
Decrease to 20-30 for shorter-term pressure context (more responsive to recent changes)
Increase to 100-200 for longer-term pressure context (smoother rankings)
Impact: Lower values make pressure strength more sensitive to recent bars. Higher values provide more stable, long-term pressure assessment. Capped at 300 for performance reasons.
SIGNAL DETECTION SECTION
Signal Detection Mode
Default: "Divergence + Confluence (Confirmed)"
Options:
Confluence Only (Real-time)
Divergence + Confluence (Confirmed)
Divergence + Confluence (Relaxed)
What It Does: Selects which detection logic mode to use (see "Understanding The Three Detection Modes" section above).
When To Change: Use Confirmed for learning and non-repainting signals. Use Real-time for live scanning without divergence requirement. Use Relaxed for slightly more signals than Confirmed.
Impact: Fundamentally changes when and how signals appear.
VISUAL LAYERS SECTION
All toggles default to ON. Each controls visibility of one visual layer:
Show Market Structure: Pivot markers and support/resistance lines
Show Pressure Zones: Background color shading
Show Divergence Lines: Dotted lines connecting pivots
Show Institutional Footprint Markers: Absorption boxes, hunt labels, exhaustion labels
Show Consolidated Analysis Label: Main pattern detection label
Use Compact Label Format
Default: OFF
What It Does: Switches consolidated label between single-line compact format and multi-line detailed format.
When To Change: Turn ON if you find full labels too large or distracting.
Impact: Visual clarity vs. information density tradeoff.
DASHBOARD SECTION
Dashboard Mode
Default: "Optimized"
Options: Off, Compact, Optimized, Full
What It Does: Controls how much information the dashboard displays.
Off: No dashboard
Compact: 8 rows (essential metrics only)
Optimized: 12 rows (recommended balance)
Full: 13 rows (every available metric)
Dashboard Position
Default: "Top Right"
Options: Top Right, Top Left, Bottom Right, Bottom Left
What It Does: Screen corner where dashboard appears.
HOW TO USE VMDM - PRACTICAL WORKFLOW
STEP 1 - INITIAL SETUP
Add VMDM to your chart
Select your detection mode (Confirmed recommended for learning)
Set your minimum confluence score (start with 60-65)
Adjust pivot parameters if needed (default 3/3 is good for most timeframes)
Enable the visual layers you want to see
STEP 2 - CHART ANALYSIS
Let the indicator load and analyze historical data
Review the patterns that appear historically
Examine the confluence scores - notice which patterns had higher scores
Observe which patterns occurred during supportive pressure zones
Notice the divergence line connections - understand what price vs RSI did
STEP 3 - PATTERN RECOGNITION LEARNING
When a consolidated analysis label appears:
Read the divergence type (regular or hidden, bullish or bearish)
Check the quality tier (textbook, high quality, or valid)
Review the confluence breakdown - which factors contributed
Look at the chart context - where is price relative to structure, trend, etc.
Observe the behavioral footprint markers nearby - do they support the pattern
STEP 4 - REAL-TIME MONITORING
Watch the dashboard for real-time regime and pressure state
Monitor the current confluence score in the dashboard
When it approaches your threshold, be alert for potential pattern formation
When a new pattern appears (after confirmation delay), evaluate it using the workflow above
Use your trading strategy rules to decide if the setup aligns with your criteria
STEP 5 - POST-PATTERN OBSERVATION
After a pattern appears:
Mark the level on your chart
Observe what price does after the pattern completes
Did price respect the reversal/continuation signal
What was the confluence score of patterns that worked vs. those that failed
Learn which quality tiers and confluence levels produce better results on your specific symbol and timeframe
RECOMMENDED TIMEFRAMES AND ASSET CLASSES
VMDM is timeframe-agnostic and works on any asset with volume data. However, optimal performance varies:
BEST TIMEFRAMES
15-Minute to 1-Hour: Ideal balance of signal frequency and reliability. Pivot confirmation delay is acceptable. Sufficient volume data for pressure analysis.
4-Hour to Daily: Excellent for swing trading. Very high-quality signals. Lower frequency but higher significance. Recommended for learning because patterns are clearer.
1-Minute to 5-Minute: Works but requires adjustment. Increase pivot bars to 5-7 for filtering. Decrease max object history to 30 for performance. Expect more noise.
Weekly/Monthly: Works but very infrequent signals. Increase confluence threshold to 70+ to ensure only major patterns appear.
BEST ASSET CLASSES
Forex Majors: Excellent volume data and clear trends. Pressure analysis works well.
Crypto (Major Pairs): Good volume data. High volatility makes divergences more pronounced. Works very well.
Stock Indices (SPY, QQQ, etc.): Excellent. Clean price action and reliable volume.
Individual Stocks: Works well on high-volume stocks. Low-volume stocks may produce unreliable pressure readings.
Commodities (Gold, Oil, etc.): Works well. Clear trends and reactions.
WHAT THIS INDICATOR CANNOT DO - LIMITATIONS
LIMITATION 1 - It Does Not Predict The Future
VMDM identifies when technical conditions align historically associated with potential reversals or continuations. It does not predict what will happen next. A textbook 95-confluence pattern can still fail if fundamental events, news, or larger timeframe structure override the setup.
LIMITATION 2 - Confirmation Delay Means You Miss Early Entry
In Confirmed and Relaxed modes, the non-repainting design means you receive signals AFTER the pivot is confirmed. Price may have already moved significantly by the time you receive the signal. This is the tradeoff for non-repainting reliability. You can use Real-time mode for faster signals but sacrifice divergence confirmation.
LIMITATION 3 - It Does Not Tell You Position Sizing or Risk Management
VMDM provides technical pattern analysis. It does not calculate stop loss levels, take profit targets, or position sizing. You must apply your own risk management rules. Never risk more than you can afford to lose based on a technical signal.
LIMITATION 4 - Volume Pressure Analysis Requires Reliable Volume Data
On assets with thin volume or unreliable volume reporting, pressure analysis may be inaccurate. Stick to major liquid assets with consistent volume data.
LIMITATION 5 - It Cannot Detect Fundamental Events
VMDM is purely technical. It cannot predict earnings reports, central bank decisions, geopolitical events, or other fundamental catalysts that can override technical patterns.
LIMITATION 6 - Divergence Requires Two Pivots
The indicator cannot detect divergence until at least two pivots of the same type have formed. In strong trends without pullbacks, you may go long periods without signals.
LIMITATION 7 - Institutional Pattern Names Are Interpretive
The behavioral footprint patterns are named using common trading education terminology, but they are detected through technical analysis, not actual institutional data access. The patterns are interpretations based on price and volume behavior.
CONCEPT FOUNDATION - WHY THIS APPROACH WORKS
MARKET PRINCIPLE 1 - Momentum Divergence Precedes Price Reversal
Price is the final output of market forces, but momentum (the rate of change in those forces) shifts first. When price makes a new low but the momentum behind that move is weaker (higher RSI low), it signals that sellers are losing strength even though they temporarily pushed price lower. This precedes reversal. This is a fundamental principle in technical analysis taught by Charles Dow, widely observed in market behavior.
MARKET PRINCIPLE 2 - Volume Reveals Conviction
Price can move on low volume (low conviction) or high volume (high conviction). When price makes a new low on declining volume while RSI shows improving momentum, it suggests the new low is not confirmed by participant conviction. Adding volume pressure analysis to momentum divergence adds a confirmation layer that filters false divergences.
MARKET PRINCIPLE 3 - Anomalies Mark Structural Extremes
When volume spikes significantly but range contracts (absorption), or when price spikes beyond structure then reverses (stop hunt), or when aggressive moves are met with large-wick rejection (exhaustion), these anomalies often mark short-term extremes. Combining these structural observations with momentum analysis creates context.
MARKET PRINCIPLE 4 - Confluence Improves Probability
No single technical factor is reliable in isolation. RSI divergence alone fails frequently. Volume analysis alone cannot time entries. Combining multiple independent factors into a weighted system increases the probability that observed patterns have structural significance rather than random noise.
THE EDUCATIONAL VALUE
By visualizing all four layers simultaneously and breaking down the confluence scoring transparently, VMDM teaches you to think in terms of multi-dimensional analysis rather than single-indicator reliance. Over time, you will learn to recognize these patterns manually and understand which combinations produce better results on your traded assets.
INSTITUTIONAL TERMINOLOGY - IMPORTANT CLARIFICATION
This indicator uses the following terms that are common in trading education:
Institutional Footprint
Absorption (Accumulation / Distribution)
Stop Hunt
Exhaustion
CRITICAL DISCLAIMER:
These terms are EDUCATIONAL LABELS for specific price action and volume behavior patterns detected through technical analysis of publicly available chart data (open, high, low, close, volume). This indicator does NOT have access to:
Actual institutional order flow or order book data
Market maker positions or intentions
Broker stop-loss databases
Non-public trading data
Proprietary institutional information
The patterns labeled as "institutional footprint" are interpretations based on observable price and volume behavior that educational trading literature often associates with potential large-participant activity. The detection is algorithmic pattern recognition, not privileged data access.
When this indicator identifies "absorption," it means it detected high volume within a small range - a condition that MAY indicate large orders being filled but is not confirmation of actual institutional participation.
When it identifies a "stop hunt," it means price briefly penetrated a structural level then reversed - a pattern that MAY have triggered stop losses but is not confirmation that stops were specifically targeted.
When it identifies "exhaustion," it means high volume with large rejection wicks - a pattern that MAY indicate aggressive participation meeting strong opposition but is not confirmation of institutional involvement.
These are technical analysis interpretations, not factual statements about market participant identity or intent.
DISCLAIMER AND RISK WARNING
EDUCATIONAL PURPOSE ONLY
This indicator is designed as an educational tool to help traders learn to recognize technical patterns, understand multi-factor analysis, and practice systematic market observation. It is NOT a trading system, signal service, or financial advice.
NO PERFORMANCE GUARANTEE
Past pattern behavior does not guarantee future results. A pattern that historically preceded price movement in one direction may fail in the future due to changing market conditions, fundamental events, or random variance. Confluence scores reflect historical technical alignment, not future certainty.
TRADING INVOLVES SUBSTANTIAL RISK
Trading financial instruments involves substantial risk of loss. You can lose more than your initial investment. Never trade with money you cannot afford to lose. Always use proper risk management including stop losses, position sizing, and portfolio diversification.
NO PREDICTIVE CLAIMS
This indicator does NOT predict future price movement. It identifies when technical conditions align in patterns that historically have been associated with potential reversals or continuations. Market behavior is probabilistic, not deterministic.
BACKTESTING LIMITATIONS
If you backtest trading strategies using this indicator, ensure you account for:
Realistic commission costs
Realistic slippage (difference between signal price and actual fill price)
Sufficient sample size (minimum 100 trades for statistical relevance)
Reasonable position sizing (risking no more than 1-2 percent of account per trade)
The confirmation delay inherent in the indicator (you cannot enter at the exact pivot in Confirmed mode)
Backtests that do not account for these factors will produce unrealistic results.
AUTHOR LIABILITY
The author (BullByte) is not responsible for any trading losses incurred using this indicator. By using this indicator, you acknowledge that all trading decisions are your sole responsibility and that you understand the risks involved.
NOT FINANCIAL ADVICE
Nothing in this indicator, its code, its description, or its visual outputs constitutes financial, investment, or trading advice. Consult a licensed financial advisor before making investment decisions.
FREQUENTLY ASKED QUESTIONS
Q: Why do signals appear in the past, not at the current bar
A: In Confirmed and Relaxed modes, signals appear at confirmed pivots, which requires waiting for right-side confirmation bars (default 3). This creates a delay but prevents repainting. Use Real-time mode if you want current-bar signals without pivot confirmation.
Q: Can I use this for automated trading
A: You can create alert-based automation, but understand that Confirmed mode signals appear AFTER the pivot with delay, so your entry will not be at the pivot price. Real-time mode signals can change as the current bar develops. Automation requires careful consideration of these factors.
Q: How do I know which confluence score to use
A: Start with 60. Observe which patterns work on your symbol/timeframe. If too many false signals, increase to 70-75. If too few signals, decrease to 55. Quality vs. quantity tradeoff.
Q: Do regular divergences mean I should enter a reversal trade immediately
A: No. Regular divergences indicate momentum exhaustion, which is a WARNING sign that trend may reverse, not a confirmation that it will. Use confluence score, market context, support/resistance, and your strategy rules to make entry decisions. Many divergences fail.
Q: What's the difference between regular and hidden divergence
A: Regular divergence = price and momentum move in opposite directions at extremes = potential reversal signal. Hidden divergence = price and momentum move in opposite directions during pullbacks = potential continuation signal. Hidden divergence suggests the pullback is just a correction within the larger trend.
Q: Why does the pressure zone color sometimes conflict with the divergence direction
A: Pressure is real-time current bar analysis. Divergence is confirmed pivot analysis from the past. They measure different things at different times. A bullish divergence confirmed 3 bars ago might appear during current selling pressure. This is normal.
Q: Can I use this on stocks without volume data
A: No. Volume is required for pressure analysis and behavioral pattern detection. Use only on assets with reliable volume reporting.
Q: How often should I expect signals
A: Depends on timeframe and settings. Daily charts might produce 5-10 signals per month. 1-hour charts might produce 20-30. 15-minute charts might produce 50-100. Adjust confluence threshold to control frequency.
Q: Can I modify the code
A: Yes, this is open source. You can modify for personal use. If you publish a modified version, please credit the original and ensure your publication meets TradingView guidelines.
Q: What if I disagree with a pattern's confluence score
A: The scoring weights are based on general observations and may not suit your specific strategy or asset. You can modify the code to adjust weights if you have data-driven reasons to do so.
Final Notes
VMDM - Volume, Momentum and Divergence Master is an educational multi-layer market analysis system designed to teach systematic pattern recognition through transparent, confluence-weighted signal detection. By combining RSI momentum divergence, volume pressure quantification, behavioral footprint pattern recognition, and quality scoring into a unified framework, it provides a comprehensive learning environment for understanding market structure.
Use this tool to develop your analytical skills, understand how multiple technical factors interact, and learn to distinguish high-quality setups from noise. Remember that technical analysis is probabilistic, not predictive. No indicator replaces proper education, risk management, and trading discipline.
Trade responsibly. Learn continuously. Risk only what you can afford to lose.
-BullByte

Multi Condition Stock Screener & Alert SystemMulti Condition Stock Screener & Strategy Builder
This script is a comprehensive Stock Screener and Strategy Builder designed to scan predefined groups of stocks (specifically focused on BIST/Istanbul Stock Exchange symbols) or a custom list of symbols based on user-defined technical conditions.
It allows users to combine multiple technical indicators to create complex entry or exit conditions without writing code. The script iterates through a list of symbols and triggers alerts when the conditions are met.
Key Features
• Custom Strategy Building: Users can define up to 6 separate conditions. • Logical Operators: Conditions can be linked using logical operators (AND / OR) to create flexible strategies. • Predefined Groups: Includes 14 groups of stocks (covering BIST symbols) for quick scanning. • Custom Scanner: Users can select the "SPECIAL" group to manually input up to 40 custom symbols to scan. • Directional Scanning: Capable of scanning for both Buy/Long and Sell/Short signals. • Alert Integration: Generates JSON-formatted alert messages suitable for webhook integrations (e.g., sending notifications to Telegram bots).
Supported Indicators for Conditions
The script utilizes built-in ta.* functions to calculate the following indicators:
• MA (Moving Average): Supports EMA, SMA, RMA, and WMA. • RSI (Relative Strength Index) • CCI (Commodity Channel Index) • ATR (Average True Range) • BBW (Bollinger Bands Width) • ADX (Average Directional Index) • MFI (Money Flow Index) • MOM (Momentum)
How it Works
The script uses request.security() to fetch data for the selected group of symbols based on the current timeframe. It evaluates the user-defined logic (Condition 1 to 6) for each symbol.
• Comparison Logic: You can compare an indicator against a value (e.g., RSI > 50 ) or against another indicator (e.g., MA1 CrossOver MA2 ). • Signal Generation: If the logical result is TRUE based on the "AND/OR" settings, a visual label is plotted on the chart, and an alert condition is triggered.
Alert Configuration
The script produces a JSON output containing the Ticker, Signal Type, Period, and Price. This is optimized for users who want to parse alerts programmatically or send them to external messaging apps via webhooks.
Disclaimer This tool is for informational purposes only and does not constitute financial advice. Since it uses request.security across multiple symbols, please allow time for the script to load data on the chart.

The Ultimate Price Action & SMC Toolkit: Delta Zones, MTF IndicaThis is an All-in-One Pine Script indicator that seamlessly combines three advanced trading concepts:
Delta Zones (Wick Pressure): Uses Standard Deviation to identify extreme buying/selling pressure within the candlestick wicks, signaling potential stop hunts or liquidity absorption. These are plotted as critical Buy/Sell Boxes.
Multi-Timeframe (MTF) Indicators: Confirms signals using popular indicators (RSI, CCI, Stochastic) calculated from a separate, user-selected Timeframe or the current chart timeframe. This adds a crucial layer of context and momentum confirmation.
Smart Money Concepts (SMC): Automatically detects and plots Orderblocks (OBs) and Breaker Blocks based on confirmed Market Structure Breaks (MSB). This helps locate high-probability Supply and Demand zones.
Key Features:
Integrated plotting for combined indicator signals.
Flexible MTF selection for all standard oscillators.
Automatic Swing High/Low detection for SMC analysis.
Comprehensive Alert system for Delta Pressure, Orderblocks, and Breaker Zones.
Option 2: Focusing on SMC and Flow (Concise)
Title: "SMC Delta Flow: Advanced Orderblock, Breaker, and Wick Reversal Zones with MTF Filter."
Description:
An essential tool for sophisticated SMC traders. This indicator provides high-precision zones:
Smart Money Blocks: Plots Orderblocks and Breaker Blocks following Market Structure Shifts (MSS). Includes a "Chop Control" feature to invalidate re-used or weak Breakers.
Delta Reversal Zones: Pinpoints candles showing extreme high-deviation wick pressure. Use these zones to confirm reversals and identify precise entry points where liquidity was captured.
MTF Confirmation: Incorporates configurable Multi-Timeframe (MTF) RSI, CCI, and Stochastic indicators to act as a momentum filter or confirmation tool.
Add this indicator to unify your analysis of Liquidity, Market Structure, and Momentum on a single chart!
SMC, SmartMoneyConcepts, Orderblock, BreakerBlock, MTF, MultiTimeframe, Delta, Wick, Liquidity, PriceAction, RSI, Stochastic, CCI

MA SMART Angle
### 📊 WHAT IS MA SMART ANGLE?
**MA SMART Angle** is an advanced momentum and trend detection indicator that analyzes the angles (slopes) of multiple moving averages to generate clear, non-repainting BUY and SELL signals.
**Original Concept Credit:** This indicator builds upon the "MA Angles" concept originally created by **JD** (also known as Duyck). The core angle calculation methodology and Jurik Moving Average (JMA) implementation by **Everget** are preserved from the original open-source work. The angle calculation formula was contributed by **KyJ**. This enhanced version is published with respect to the open-source nature of the original indicator.
Original indicator reference: "ma angles - JD" by Duyck
---
## 🎯 ORIGINALITY & VALUE PROPOSITION
### **What Makes This Different from the Original:**
While the original "MA Angles" by **JD** provided excellent angle visualization, it lacked actionable entry signals. **MA SMART Angle** addresses this by adding:
**1. Clear Entry/Exit Signals**
- Explicit BUY/SELL arrows based on angle crossovers, momentum confirmation, and MA alignment
- No guessing when to enter trades - the indicator tells you exactly when conditions align
**2. Non-Repainting Logic**
- All signals use confirmed historical data (shifted by 2 bars minimum)
- Critical for backtesting reliability and live trading confidence
- Original indicator could repaint signals on current bar
**3. Dual Signal System**
- **Simple Mode:** More frequent signals based on angle crossovers + momentum (for active traders)
- **Strict Mode:** Requires full multi-MA alignment + momentum confirmation (for conservative traders)
- Adaptable to different trading styles and risk tolerances
**4. Smart Signal Filtering**
- **Anti-spam cooldown:** Prevents duplicate signals within configurable bar count
- **No-trade zone detection:** Filters out low-conviction sideways markets automatically
- **Multi-timeframe MA alignment:** Ensures all moving averages agree on direction before signaling
**5. Enhanced Visualization**
- Large, clear BUY/SELL arrows with descriptive labels
- Color-coded backgrounds for market states (trending vs. ranging)
- Momentum histogram showing acceleration/deceleration in real-time
- Live status table displaying trend strength, angle value, momentum, and MA alignment
**6. Professional Alert System**
- Four distinct alert conditions: BUY Signal, SELL Signal, Strong BUY, Strong SELL
- Enables automated trade notifications and strategy integration
**7. Modified MA Periods**
- Original used EMA(27), EMA(83), EMA(278)
- Enhanced version uses faster EMA(3), EMA(8), EMA(13) for more responsive signals
- Better suited for modern volatile markets and shorter timeframes
---
## 📐 HOW IT WORKS - TECHNICAL EXPLANATION
### **Core Methodology:**
The indicator calculates angles (slopes) for five key moving averages:
- **JMA (Jurik Moving Average)** - Smooth, lag-reduced trend line (original implementation by **Everget**)
- **JMA Fast** - Responsive momentum indicator with higher power parameter
- **MA27 (EMA 3)** - Primary fast-moving average for signal generation
- **MA83 (EMA 8)** - Medium-term trend confirmation
- **MA278 (EMA 13)** - Slower trend filter
### **Angle Calculation Formula (by KyJ):**
```
angle = arctan((MA - MA ) / ATR(14)) × (180 / π)
```
**Why ATR normalization?**
- Makes angles comparable across different instruments (forex, stocks, crypto)
- Makes angles comparable across different timeframes
- Accounts for volatility - a 10-point move in different assets has different significance
**Angle Interpretation:**
- **> 15°** = Strong trend (momentum accelerating)
- **0° to 15°** = Weak trend (momentum present but moderate)
- **-2° to +2°** = No-trade zone (sideways/choppy market)
- **< -15°** = Strong downtrend
### **Signal Generation Logic:**
#### **BUY Signal Conditions:**
1. MA27 angle crosses above 0° (upward momentum initiates)
2. All three EMAs (3, 8, 13) pointing upward (trend alignment confirmed)
3. Momentum is positive for 2+ bars (acceleration, not deceleration)
4. Angle exceeds minimum threshold (not in no-trade zone)
5. Cooldown period passed (prevents signal spam)
#### **SELL Signal Conditions:**
1. MA27 angle crosses below 0° (downward momentum initiates)
2. All three EMAs pointing downward (downtrend alignment)
3. Momentum is negative for 2+ bars
4. Angle below negative threshold (not in no-trade zone)
5. Cooldown period passed
#### **Strong BUY+ / SELL+ Signals:**
Additional entry opportunities when JMA Fast crosses JMA Slow while maintaining strong directional angle - indicates momentum acceleration within established trend.
---
## 🔧 HOW TO USE
### **Recommended Settings by Trading Style:**
**Scalpers / Day Traders:**
- Signal Type: **Simple**
- Minimum Angle: **3-5°**
- Cooldown Bars: **3-5 bars**
- Timeframes: 1m, 5m, 15m
**Swing Traders:**
- Signal Type: **Strict**
- Minimum Angle: **7-10°**
- Cooldown Bars: **8-12 bars**
- Timeframes: 1H, 4H, Daily
**Position Traders:**
- Signal Type: **Strict**
- Minimum Angle: **10-15°**
- Cooldown Bars: **15-20 bars**
- Timeframes: Daily, Weekly
### **Parameter Descriptions:**
**1. Source** (default: OHLC4)
- Price data used for MA calculations
- OHLC4 provides smoothest angles
- Close is more responsive but noisier
**2. Threshold for No-Trade Zones** (default: 2°)
- Angles below this are considered sideways/ranging
- Increase for stricter filtering of choppy markets
- Decrease to allow signals in quieter trending periods
**3. Signal Type** (Simple vs. Strict)
- **Simple:** Angle crossover OR (trend + momentum)
- **Strict:** Angle crossover AND all MAs aligned AND momentum confirmed
- Start with Simple, switch to Strict if too many false signals
**4. Minimum Angle for Signal** (default: 5°)
- Only generate signals when angle exceeds this threshold
- Higher values = stronger trends required
- Lower values = more sensitive to momentum changes
**5. Cooldown Bars** (default: 5)
- Minimum bars between consecutive signals
- Prevents spam during volatile chop
- Scale with your timeframe (higher TF = more bars)
**6. Color Bars** (default: true)
- Colors chart bars based on signal state
- Green = bullish conditions, Red = bearish conditions
- Can disable if you prefer clean price bars
**7. Background Colors**
- **Yellow background** = No-trade zone (low angle, ranging market)
- **Green flash** = BUY signal generated
- **Red flash** = SELL signal generated
- All customizable or can be disabled
---
## 📊 INTERPRETING THE INDICATOR
### **Visual Elements:**
**Main Chart Window:**
- **Thick Lime/Fuchsia Line** = MA27 angle (primary signal line)
- **Medium Green/Red Line** = MA83 angle (trend confirmation)
- **Thin Green/Red Line** = MA278 angle (slow trend filter)
- **Aqua/Orange Line** = JMA Fast (momentum detector)
- **Green/Red Area** = JMA slope (overall trend context)
- **Blue/Purple Histogram** = Momentum (angle acceleration/deceleration)
**Signal Arrows:**
- **Large Green ▲ "BUY"** = Primary buy signal (all conditions met)
- **Small Green ▲ "BUY+"** = Strong momentum buy (JMA fast cross)
- **Large Red ▼ "SELL"** = Primary sell signal (all conditions met)
- **Small Red ▼ "SELL+"** = Strong momentum sell (JMA fast cross)
**Status Table (Top Right):**
- **Angle:** Current MA27 angle in degrees
- **Trend:** Classification (STRONG UP/DOWN, UP/DOWN, FLAT)
- **Momentum:** Acceleration state (ACCEL UP/DN, Up/Down)
- **MAs:** Alignment status (ALL UP/DOWN, Mixed)
- **Zone:** Trading zone status (ACTIVE vs. NO TRADE)
- **Last:** Bars since last signal
### **Trading Strategies:**
**Strategy 1: Pure Signal Following**
- Enter LONG on BUY signal
- Exit on SELL signal
- Use stop-loss at recent swing low/high
- Works best on trending instruments
**Strategy 2: Confirmation with Price Action**
- Wait for BUY signal + bullish candlestick pattern
- Wait for SELL signal + bearish candlestick pattern
- Increases win rate by filtering premature signals
- Recommended for beginners
**Strategy 3: Momentum Acceleration**
- Use BUY+/SELL+ signals for adding to positions
- Only take these in direction of primary signal
- Scalp quick moves during momentum spikes
- For experienced traders
**Strategy 4: Mean Reversion in No-Trade Zones**
- When status shows "NO TRADE", fade extremes
- Wait for angle to exit no-trade zone for reversal
- Contrarian approach for range-bound markets
- Requires tight stops
---
## ⚠️ LIMITATIONS & DISCLAIMERS
**What This Indicator DOES:**
✅ Measures momentum direction and strength via angle analysis
✅ Generates signals when multiple conditions align
✅ Filters out low-conviction sideways markets
✅ Provides visual clarity on trend state
**What This Indicator DOES NOT:**
❌ Predict future price movements with certainty
❌ Guarantee profitable trades (no indicator can)
❌ Work equally well on all instruments/timeframes
❌ Replace proper risk management and position sizing
**Known Limitations:**
- **Lagging Nature:** Like all moving averages, signals occur after momentum begins
- **Whipsaw Risk:** Can generate false signals in volatile, directionless markets
- **Optimization Required:** Parameters need adjustment for different assets
- **Not a Complete System:** Should be combined with risk management, position sizing, and other analysis
**Best Performance Conditions:**
- Strong trending markets (crypto bull runs, stock breakouts)
- Liquid instruments (major forex pairs, large-cap stocks)
- Appropriate timeframe selection (match to trading style)
- Used alongside support/resistance and volume analysis
---
## 🔔 ALERT SETUP
The indicator includes four alert conditions:
**1. BUY SIGNAL**
- Message: "MA SMART Angle: BUY SIGNAL! Angle crossed up with momentum"
- Use for: Primary long entries
**2. SELL SIGNAL**
- Message: "MA SMART Angle: SELL SIGNAL! Angle crossed down with momentum"
- Use for: Primary short entries or long exits
**3. Strong BUY**
- Message: "MA SMART Angle: Strong BUY momentum - JMA fast crossed up"
- Use for: Adding to longs or aggressive entries
**4. Strong SELL**
- Message: "MA SMART Angle: Strong SELL momentum - JMA fast crossed down"
- Use for: Adding to shorts or aggressive exits
**Setting Up Alerts:**
1. Right-click indicator → "Add Alert on MA SMART Angle"
2. Select desired condition from dropdown
3. Choose notification method (popup, email, webhook)
4. Set alert expiration (typically "Once Per Bar Close")
---
## 📚 EDUCATIONAL VALUE
This indicator serves as an excellent learning tool for understanding:
**1. Angle-Based Momentum Analysis**
- Traditional indicators show MA crossovers
- This shows the *rate of change* (velocity) of MAs
- Teaches traders to think in terms of momentum acceleration
**2. Multi-Timeframe Confirmation**
- Shows how fast, medium, and slow MAs interact
- Demonstrates importance of trend alignment
- Helps develop patience for high-probability setups
**3. Signal Quality vs. Quantity Tradeoff**
- Simple mode = more signals, more noise
- Strict mode = fewer signals, higher quality
- Teaches discretionary filtering skills
**4. Market State Recognition**
- Visual distinction between trending and ranging markets
- Helps traders avoid trading choppy conditions
- Develops "market context" awareness
---
## 🔄 DIFFERENCES FROM OTHER MA INDICATORS
**vs. Traditional MA Crossovers:**
- Measures momentum (angle) rather than just price crossing MA
- Provides earlier signals as angles change before price crosses
- Filters better for sideways markets using no-trade zones
**vs. MACD:**
- Uses multiple MAs instead of just two
- ATR normalization makes it universal across instruments
- Visual angle representation more intuitive than histogram
**vs. Supertrend:**
- Not based on ATR bands but on MA slope analysis
- Provides graduated strength indication (not just binary trend)
- Less prone to whipsaw in low volatility
**vs. Original "MA Angles" by JD:**
- Adds explicit entry/exit signals (original had none)
- Implements no-repaint logic for reliability
- Includes signal filtering and quality controls
- Provides dual signal systems (Simple/Strict)
- Enhanced visualization and status monitoring
- Uses faster MA periods (3/8/13 vs 27/83/278) for modern markets
---
## 📖 CODE STRUCTURE (for Pine Script learners)
This indicator demonstrates:
**Advanced Pine Script Techniques:**
- Custom function implementation (JMA, angle calculation)
- Var declarations for stateful tracking
- Table creation for HUD display
- Multi-condition signal logic
- Alert system integration
- Proper use of historical references for no-repaint
**Code Organization:**
- Modular function definitions (JMA, angle)
- Clear separation of concerns (inputs, calculations, plotting, alerts)
- Extensive commenting for maintainability
- Best practices for Pine Script v5
**Learning Resources:**
- Study the JMA function to understand adaptive smoothing
- Examine angle calculation for ATR normalization technique
- Review signal logic for multi-condition confirmation patterns
- Analyze anti-spam filtering for state management
The code is open-source - feel free to study, modify, and improve upon it!
---
## 🙏 CREDITS & ATTRIBUTION
**Original Concepts:**
- **"ma angles - JD" by JD (Duyck)** - Core angle calculation methodology and indicator concept
Original open-source indicator on TradingView Community Scripts
- **JMA (Jurik Moving Average) implementation by Everget** - Smooth, low-lag moving average function
Acknowledged in original JD indicator code
- **Angle Calculation formula by KyJ** - Mathematical formula for converting MA slope to degrees using ATR normalization
Acknowledged in original JD indicator code comments
**Enhancements in This Version:**
- Signal generation logic - Original implementation for this indicator
- No-repaint confirmation system - Original implementation
- Dual signal modes (Simple/Strict) - Original implementation
- Visual enhancements and status table - Original implementation
- Alert system and signal filtering - Original implementation
- Modified MA periods (3/8/13 instead of 27/83/278) - Optimization for modern markets
**Open Source Philosophy:**
This indicator follows the open-source spirit of TradingView and the Pine Script community. The original "ma angles - JD" by JD (Duyck) was published as open-source, enabling this enhanced version. Similarly, this code is published as open-source to allow further community improvements.
---
## ⚡ QUICK START GUIDE
**For New Users:**
1. Add indicator to chart
2. Start with default settings (Simple mode)
3. Wait for BUY signal (green arrow)
4. Observe how price behaves after signal
5. Check status table to understand market state
6. Adjust parameters based on your instrument/timeframe
**For Experienced Traders:**
1. Switch to Strict mode for higher quality signals
2. Increase cooldown bars to reduce frequency
3. Raise minimum angle threshold for stronger trends
4. Combine with your existing strategy for confirmation
5. Set up alerts for desired signal types
6. Backtest on your preferred instruments
---
## 🎓 RECOMMENDED COMBINATIONS
**Works Well With:**
- **Volume Analysis:** Confirm signals with volume spikes
- **Support/Resistance:** Take signals near key levels
- **RSI/Stochastic:** Avoid overbought/oversold extremes
- **ATR:** Size positions based on volatility
- **Price Action:** Wait for candlestick confirmation
**Complementary Indicators:**
- Order Flow / Footprint (for institutional confirmation)
- Volume Profile (for identifying value areas)
- VWAP (for intraday mean reversion reference)
- Fibonacci Retracements (for target setting)
---
## 📈 PERFORMANCE EXPECTATIONS
**Realistic Win Rates:**
- Simple Mode: 45-55% (higher frequency, moderate accuracy)
- Strict Mode: 55-65% (lower frequency, higher accuracy)
- Combined with price action: 60-70%
**Best Asset Classes:**
1. **Cryptocurrencies** (strong trends, clear signals)
2. **Forex Major Pairs** (smooth price action, good angles)
3. **Large-Cap Stocks** (trending behavior, liquid)
4. **Index Futures** (trending instruments)
**Challenging Conditions:**
- Low volatility consolidation periods
- News-driven erratic movements
- Thin/illiquid instruments
- Counter-trending markets
---
## 🛡️ RISK DISCLAIMER
**IMPORTANT LEGAL NOTICE:**
This indicator is for **educational and informational purposes only**. It is **NOT financial advice** and does not constitute a recommendation to buy or sell any financial instrument.
**Trading Risks:**
- Trading carries substantial risk of loss
- Past performance does not guarantee future results
- No indicator can predict market movements with certainty
- You can lose more than your initial investment (especially with leverage)
**User Responsibilities:**
- Conduct your own research and due diligence
- Understand the instruments you trade
- Never risk more than you can afford to lose
- Use proper position sizing and risk management
- Consider consulting a licensed financial advisor
**Indicator Limitations:**
- Signals are based on historical data only
- No guarantee of accuracy or profitability
- Parameters must be optimized for your specific use case
- Results vary significantly by market conditions
By using this indicator, you acknowledge and accept all trading risks. The author is not responsible for any financial losses incurred through use of this indicator.
---
## 📧 SUPPORT & FEEDBACK
**Found a bug?** Please report it in the comments with:
- Chart symbol and timeframe
- Parameter settings used
- Description of unexpected behavior
- Screenshot if possible
**Have suggestions?** Share your ideas for improvements!
**Enjoying the indicator?** Leave a like and follow for updates!

Composite Buy/Sell Score [-100 to +100] by LMComposite Buy/Sell Score (Stabilized + Sensitivity) by LM
Description:
This indicator calculates a composite trend strength score ranging from -100 to +100 by combining multiple popular technical indicators into a single, smoothed metric. It is designed to give traders a clear view of bullish and bearish trends, while filtering out short-term noise.
The score incorporates signals from:
PPO (Percentage Price Oscillator) – measures momentum via the difference between fast and slow EMAs.
ADX (Average Directional Index) – detects trend strength.
RSI (Relative Strength Index) – identifies short-term momentum swings.
Stochastic RSI – measures RSI momentum and speed of change.
MACD (Moving Average Convergence Divergence) – detects momentum shifts using EMA crossovers.
Williams %R – highlights overbought/oversold conditions.
Each component is weighted, smoothed, and optionally confirmed across a configurable number of bars, producing a stabilized composite score that reacts more reliably to significant trend changes.
Key Features:
Smoothed Composite Score
The final score is smoothed using an EMA to reduce volatility and emphasize meaningful trends.
A Sensitivity Multiplier allows traders to exaggerate the score for stronger trend signals or dampen it for quieter markets.
Customizable Inputs
You can adjust each indicator’s parameters, smoothing lengths, and confirm bars to suit your preferred timeframe and trading style.
The sensitivity multiplier allows fine-tuning the responsiveness of the trend line without changing underlying indicator calculations.
Visual Representation
Score Line: Green for positive (bullish) trends, red for negative (bearish) trends, gray near neutral.
Reference Lines:
0 = neutral
+100 = maximum bullish
-100 = maximum bearish
Adaptive Background: Optionally highlights the background intensity proportional to trend strength. Strong green for bullish trends, strong red for bearish trends.
Multi-Indicator Integration
Combines momentum, trend, and overbought/oversold signals into a single metric.
Helps identify clear entry/exit trends while avoiding whipsaw noise common in individual indicators.
Recommended Use:
Trend Identification: Look for sustained movement above 0 for bullish trends and below 0 for bearish trends.
Exaggerated Trends: Use the Sensitivity Multiplier to emphasize strong trends.
Filtering Noise: The smoothed score and confirmBars settings help reduce false signals from minor price fluctuations.
Inputs Overview:
Input Purpose
PPO Fast EMA / Slow EMA / Signal Controls PPO momentum sensitivity
ADX Length / Threshold Detects trend strength
RSI Length / Overbought / Oversold Measures short-term momentum
Stoch RSI Length / %K / %D Measures speed of RSI changes
MACD Fast / Slow / Signal Measures momentum crossover
Williams %R Length Detects overbought/oversold conditions
Final Score Smoothing Length EMA smoothing for final composite score
Confirm Bars for Each Signal Number of bars used to confirm individual indicator signals
Sensitivity Multiplier Scales the final composite score for exaggerated trend response
Highlight Background by Trend Strength Enables adaptive background coloring
This indicator is suitable for traders looking for a single, clear trend metric derived from multiple indicators. It can be applied to any timeframe and can help identify both strong and emerging trends in the market.

Mean Reversion Oscillator [Alpha Extract]An advanced composite oscillator system specifically designed to identify extreme market conditions and high-probability mean reversion opportunities, combining five proven oscillators into a single, powerful analytical framework.
By integrating multiple momentum and volume-based indicators with sophisticated extreme level detection, this oscillator provides precise entry signals for contrarian trading strategies while filtering out false reversals through momentum confirmation.
🔶 Multi-Oscillator Composite Framework
Utilizes a comprehensive approach that combines Bollinger %B, RSI, Stochastic, Money Flow Index, and Williams %R into a unified composite score. This multi-dimensional analysis ensures robust signal generation by capturing different aspects of market extremes and momentum shifts.
// Weighted composite (equal weights)
normalized_bb = bb_percent
normalized_rsi = rsi
normalized_stoch = stoch_d_val
normalized_mfi = mfi
normalized_williams = williams_r
composite_raw = (normalized_bb + normalized_rsi + normalized_stoch + normalized_mfi + normalized_williams) / 5
composite = ta.sma(composite_raw, composite_smooth)
🔶 Advanced Extreme Level Detection
Features a sophisticated dual-threshold system that distinguishes between moderate and extreme market conditions. This hierarchical approach allows traders to identify varying degrees of mean reversion potential, from moderate oversold/overbought conditions to extreme levels that demand immediate attention.
🔶 Momentum Confirmation System
Incorporates a specialized momentum histogram that confirms mean reversion signals by analyzing the rate of change in the composite oscillator. This prevents premature entries during strong trending conditions while highlighting genuine reversal opportunities.
// Oscillator momentum (rate of change)
osc_momentum = ta.mom(composite, 5)
histogram = osc_momentum
// Momentum confirmation
momentum_bullish = histogram > histogram
momentum_bearish = histogram < histogram
// Confirmed signals
confirmed_bullish = bullish_entry and momentum_bullish
confirmed_bearish = bearish_entry and momentum_bearish
🔶 Dynamic Visual Intelligence
The oscillator line adapts its color intensity based on proximity to extreme levels, providing instant visual feedback about market conditions. Background shading creates clear zones that highlight when markets enter moderate or extreme territories.
🔶 Intelligent Signal Generation
Generates precise entry signals only when the composite oscillator crosses extreme thresholds with momentum confirmation. This dual-confirmation approach significantly reduces false signals while maintaining sensitivity to genuine mean reversion opportunities.
How It Works
🔶 Composite Score Calculation
The indicator simultaneously tracks five different oscillators, each normalized to a 0-100 scale, then combines them into a smoothed composite score. This approach eliminates the noise inherent in single-oscillator analysis while capturing the consensus view of multiple momentum indicators.
// Mean reversion entry signals
bullish_entry = ta.crossover(composite, 100 - extreme_level) and composite < (100 - extreme_level)
bearish_entry = ta.crossunder(composite, extreme_level) and composite > extreme_level
// Bollinger %B calculation
bb_basis = ta.sma(src, bb_length)
bb_dev = bb_mult * ta.stdev(src, bb_length)
bb_percent = (src - bb_lower) / (bb_upper - bb_lower) * 100
🔶 Extreme Zone Identification
The system automatically identifies when markets reach statistically significant extreme levels, both moderate (65/35) and extreme (80/20). These zones represent areas where mean reversion has the highest probability of success based on historical market behavior.
🔶 Momentum Histogram Analysis
A specialized momentum histogram tracks the velocity of oscillator changes, helping traders distinguish between healthy corrections and potential trend reversals. The histogram's color-coded display makes momentum shifts immediately apparent.
🔶 Divergence Detection Framework
Built-in divergence analysis identifies situations where price and oscillator movements diverge, often signaling impending reversals. Diamond-shaped markers highlight these critical divergence patterns for enhanced pattern recognition.
🔶 Real-Time Information Dashboard
An integrated information table provides instant access to current oscillator readings, market status, and individual component values. This dashboard eliminates the need to manually check multiple indicators while trading.
🔶 Individual Component Display
Optional display of individual oscillator components allows traders to understand which specific indicators are driving the composite signal. This transparency enables more informed decision-making and deeper market analysis.
🔶 Adaptive Background Coloring
Intelligent background shading automatically adjusts based on market conditions, creating visual zones that correspond to different levels of mean reversion potential. The subtle color gradations make pattern recognition effortless.
1D
3D
🔶 Comprehensive Alert System
Multi-tier alert system covers confirmed entry signals, divergence patterns, and extreme level breaches. Each alert type provides specific context about the detected condition, enabling traders to respond appropriately to different signal strengths.
🔶 Customizable Threshold Management
Fully adjustable extreme and moderate levels allow traders to fine-tune the indicator's sensitivity to match different market volatilities and trading timeframes. This flexibility ensures optimal performance across various market conditions.
🔶 Why Choose AE - Mean Reversion Oscillator?
This indicator provides the most comprehensive approach to mean reversion trading by combining multiple proven oscillators with advanced confirmation mechanisms. By offering clear visual hierarchies for different extreme levels and requiring momentum confirmation for signals, it empowers traders to identify high-probability contrarian opportunities while avoiding false reversals. The sophisticated composite methodology ensures that signals are both statistically significant and practically actionable, making it an essential tool for traders focused on mean reversion strategies across all market conditions.

Extreme Pressure Zones Indicator (EPZ) [BullByte]Extreme Pressure Zones Indicator(EPZ)
The Extreme Pressure Zones (EPZ) Indicator is a proprietary market analysis tool designed to highlight potential overbought and oversold "pressure zones" in any financial chart. It does this by combining several unique measurements of price action and volume into a single, bounded oscillator (0–100). Unlike simple momentum or volatility indicators, EPZ captures multiple facets of market pressure: price rejection, trend momentum, supply/demand imbalance, and institutional (smart money) flow. This is not a random mashup of generic indicators; each component was chosen and weighted to reveal extreme market conditions that often precede reversals or strong continuations.
What it is?
EPZ estimates buying/selling pressure and highlights potential extreme zones with a single, bounded 0–100 oscillator built from four normalized components. Context-aware weighting adapts to volatility, trendiness, and relative volume. Visual tools include adaptive thresholds, confirmed-on-close extremes, divergence, an MTF dashboard, and optional gradient candles.
Purpose and originality (not a mashup)
Purpose: Identify when pressure is building or reaching potential extremes while filtering noise across regimes and symbols.
Originality: EPZ integrates price rejection, momentum cascade, pressure distribution, and smart money flow into one bounded scale with context-aware weighting. It is not a cosmetic mashup of public indicators.
Why a trader might use EPZ
EPZ provides a multi-dimensional gauge of market extremes that standalone indicators may miss. Traders might use it to:
Spot Reversals: When EPZ enters an "Extreme High" zone (high red), it implies selling pressure might soon dominate. This can hint at a topside reversal or at least a pause in rallies. Conversely, "Extreme Low" (green) can highlight bottom-fish opportunities. The indicator's divergence module (optional) also finds hidden bullish/bearish divergences between price and EPZ, a clue that price momentum is weakening.
Measure Momentum Shifts: Because EPZ blends momentum and volume, it reacts faster than many single metrics. A rising MPO indicates building bullish pressure, while a falling MPO shows increasing bearish pressure. Traders can use this like a refined RSI: above 50 means bullish bias, below 50 means bearish bias, but with context provided by the thresholds.
Filter Trades: In trend-following systems, one could require EPZ to be in the bullish (green) zone before taking longs, or avoid new trades when EPZ is extreme. In mean-reversion systems, one might specifically look to fade extremes flagged by EPZ.
Multi-Timeframe Confirmation: The dashboard can fetch a higher timeframe EPZ value. For example, you might trade a 15-minute chart only when the 60-minute EPZ agrees on pressure direction.
Components and how they're combined
Rejection (PRV) – Captures price rejection based on candle wicks and volume (see Price Rejection Volume).
Momentum Cascade (MCD) – Blends multiple momentum periods (3,5,8,13) into a normalized momentum score.
Pressure Distribution (PDI) – Measures net buy/sell pressure by comparing volume on up vs down candles.
Smart Money Flow (SMF) – An adaptation of money flow index that emphasizes unusual volume spikes.
Each of these components produces a 0–100 value (higher means more bullish pressure). They are then weighted and averaged into the final Market Pressure Oscillator (MPO), which is smoothed and scaled. By combining these four views, EPZ stands out as a comprehensive pressure gauge – the whole is greater than the sum of parts
Context-aware weighting:
Higher volatility → more PRV weight
Trendiness up (RSI of ATR > 25) → more MCD weight
Relative volume > 1.2x → more PDI weight
SMF holds a stable weight
The weighted average is smoothed and scaled into MPO ∈ with 50 as the neutral midline.
What makes EPZ stand out
Four orthogonal inputs (price action, momentum, pressure, flow) unified in a single bounded oscillator with consistent thresholds.
Adaptive thresholds (optional) plus robust extreme detection that also triggers on crossovers, so static thresholds work reliably too.
Confirm Extremes on Bar Close (default ON): dots/arrows/labels/alerts print on closed bars to avoid repaint confusion.
Clean dashboard, divergence tools, pre-alerts, and optional on-price gradients. Visual 3D layering uses offsets for depth only,no lookahead.
Recommended markets and timeframes
Best: liquid symbols (index futures, large-cap equities, major FX, BTC/ETH).
Timeframes: 5–15m (more signals; consider higher thresholds), 1H–4H (balanced), 1D (clear regimes).
Use caution on illiquid or very low TFs where wick/volume geometry is erratic.
Logic and thresholds
MPO ∈ ; 50 = neutral. Above 50 = bullish pressure; below 50 = bearish.
Static thresholds (defaults): thrHigh = 70, thrLow = 30; warning bands 5 pts inside extremes (65/35).
Adaptive thresholds (optional):
thrHigh = min(BaseHigh + 5, mean(MPO,100) + stdev(MPO,100) × ExtremeSensitivity)
thrLow = max(BaseLow − 5, mean(MPO,100) − stdev(MPO,100) × ExtremeSensitivity)
Extreme detection
High: MPO ≥ thrHigh with peak/slope or crossover filter.
Low: MPO ≤ thrLow with trough/slope or crossover filter.
Cooldown: 5 bars (default). A new extreme will not print until the cooldown elapses, even if MPO re-enters the zone.
Confirmation
"Confirm Extremes on Bar Close" (default ON) gates extreme markers, pre-alerts, and alerts to closed bars (non-repainting).
Divergences
Pivot-based bullish/bearish divergence; tags appear only after left/right bars elapse (lookbackPivot).
MTF
HTF MPO retrieved with lookahead_off; values can update intrabar and finalize at HTF close. This is disclosed and expected.
Inputs and defaults (key ones)
Core: Sensitivity=1.0; Analysis Period=14; Smoothing=3; Adaptive Thresholds=OFF.
Extremes: Base High=70, Base Low=30; Extreme Sensitivity=1.5; Confirm Extremes on Bar Close=ON; Cooldown=5; Dot size Small/Tiny.
Visuals: Heatmap ON; 3D depth optional; Strength bars ON; Pre-alerts OFF; Divergences ON with tags ON; Gradient candles OFF; Glow ON.
Dashboard: ON; Position=Top Right; Size=Normal; MTF ON; HTF=60m; compact overlay table on price chart.
Advanced caps: Max Oscillator Labels=80; Max Extreme Guide Lines=80; Divergence objects=60.
Dashboard: what each element means
Header: EPZ ANALYSIS.
Large readout: Current MPO; color reflects state (extreme, approaching, or neutral).
Status badge: "Extreme High/Low", "Approaching High/Low", "Bullish/Neutral/Bearish".
HTF cell (when MTF ON): Higher-timeframe MPO, color-coded vs extremes; updates intrabar, settles at HTF close.
Predicted (when MTF OFF): Simple MPO extrapolation using momentum/acceleration—illustrative only.
Thresholds: Current thrHigh/thrLow (static or adaptive).
Components: ASCII bars + values for PRV, MCD, PDI, SMF.
Market metrics: Volume Ratio (x) and ATR% of price.
Strength: Bar indicator of |MPO − 50| × 2.
Confidence: Heuristic gauge (100 in extremes, 70 in warnings, 50 with divergence, else |MPO − 50|). Convenience only, not probability.
How to read the oscillator
MPO Value (0–100): A reading of 50 is neutral. Values above ~55 are increasingly bullish (green), while below ~45 are increasingly bearish (red). Think of these as "market pressure".
Extreme Zones: When MPO climbs into the bright orange/red area (above the base-high line, default 70), the chart will display a dot and downward arrow marking that extreme. Traders often treat this as a sign to tighten stops or look for shorts. Similarly, a bright green dot/up-arrow appears when MPO falls below the base-low (30), hinting at a bullish setup.
Heatmap/Candles: If "Pressure Heatmap" is enabled, the background of the oscillator pane will fade green or red depending on MPO. Users can optionally color the price candles by MPO value (gradient candles) to see these extremes on the main chart.
Prediction Zone(optional): A dashed projection line extends the MPO forward by a small number of bars (prediction_bars) using current MPO momentum and acceleration. This is a heuristic extrapolation best used for short horizons (1–5 bars) to anticipate whether MPO may touch a warning or extreme zone. It is provisional and becomes less reliable with longer projection lengths — always confirm predicted moves with bar-close MPO and HTF context before acting.
Divergences: When price makes a higher high but EPZ makes a lower high (bearish divergence), the indicator can draw dotted lines and a "Bear Div" tag. The opposite (lower low price, higher EPZ) gives "Bull Div". These signals confirm waning momentum at extremes.
Zones: Warning bands near extremes; Extreme zones beyond thresholds.
Crossovers: MPO rising through 35 suggests easing downside pressure; falling through 65 suggests waning upside pressure.
Dots/arrows: Extreme markers appear on closed bars when confirmation is ON and respect the 5-bar cooldown.
Pre-alert dots (optional): Proximity cues in warning zones; also gated to bar close when confirmation is ON.
Histogram: Distance from neutral (50); highlights strengthening or weakening pressure.
Divergence tags: "Bear Div" = higher price high with lower MPO high; "Bull Div" = lower price low with higher MPO low.
Pressure Heatmap : Layered gradient background that visually highlights pressure strength across the MPO scale; adjustable intensity and optional zone overlays (warning / extreme) for quick visual scanning.
A typical reading: If the oscillator is rising from neutral towards the high zone (green→orange→red), the chart may see strong buying culminating in a stall. If it then turns down from the extreme, that peak EPZ dot signals sell pressure.
Alerts
EPZ: Extreme Context — fires on confirmed extremes (respects cooldown).
EPZ: Approaching Threshold — fires in warning zones if no extreme.
EPZ: Divergence — fires on confirmed pivot divergences.
Tip: Set alerts to "Once per bar close" to align with confirmation and avoid intrabar repaint.
Practical usage ideas
Trend continuation: In positive regimes (MPO > 50 and rising), pullbacks holding above 50 often precede continuation; mirror for bearish regimes.
Exhaustion caution: E High/E Low can mark exhaustion risk; many wait for MPO rollover or divergence to time fades or partial exits.
Adaptive thresholds: Useful on assets with shifting volatility regimes to maintain meaningful "extreme" levels.
MTF alignment: Prefer setups that agree with the HTF MPO to reduce countertrend noise.
Examples
Screenshots captured in TradingView Replay to freeze the bar at close so values don't fluctuate intrabar. These examples use default settings and are reproducible on the same bars; they are for illustration, not cherry-picking or performance claims.
Example 1 — BTCUSDT, 1h — E Low
MPO closed at 26.6 (below the 30 extreme), printing a confirmed E Low. HTF MPO is 26.6, so higher-timeframe pressure remains bearish. Components are subdued (Momentum/Pressure/Smart$ ≈ 29–37), with Vol Ratio ≈ 1.19x and ATR% ≈ 0.37%. A prior Bear Div flagged weakening impulse into the drop. With cooldown set to 5 bars, new extremes are rate-limited. Many traders wait for MPO to curl up and reclaim 35 or for a fresh Bull Div before considering countertrend ideas; if MPO cannot reclaim 35 and HTF stays weak, treat bounces cautiously. Educational illustration only.
Example 2 — ETHUSD, 30m — E High
A strong impulse pushed MPO into the extreme zone (≥ 70), printing a confirmed E High on close. Shortly after, MPO cooled to ~61.5 while a Bear Div appeared, showing momentum lag as price pushed a higher high. Volume and volatility were elevated (≈ 1.79x / 1.25%). With a 5-bar cooldown, additional extremes won't print immediately. Some treat E High as exhaustion risk—either waiting for MPO rollover under 65/50 to fade, or for a pullback that holds above 50 to re-join the trend if higher-timeframe pressure remains constructive. Educational illustration only.
Known limitations and caveats
The MPO line itself can change intrabar; extreme markers/alerts do not repaint when "Confirm Extremes on Bar Close" is ON.
HTF values settle at the close of the HTF bar.
Illiquid symbols or very low TFs can be noisy; consider higher thresholds or longer smoothing.
Prediction line (when enabled) is a visual extrapolation only.
For coders
Pine v6. MTF via request.security with lookahead_off.
Extremes include crossover triggers so static thresholds also yield E High/E Low.
Extreme markers and pre-alerts are gated by barstate.isconfirmed when confirmation is ON.
Arrays prune oldest objects to respect resource limits; defaults (80/80/60) are conservative for low TFs.
3D layering uses negative offsets purely for drawing depth (no lookahead).
Screenshot methodology:
To make labels legible and to demonstrate non-repainting behavior, the examples were captured in TradingView Replay with "Confirm Extremes on Bar Close" enabled. Replay is used only to freeze the bar at close so plots don't change intrabar. The examples use default settings, include both Extreme Low and Extreme High cases, and can be reproduced by scrolling to the same bars outside Replay. This is an educational illustration, not a performance claim.
Disclaimer
This script is for educational purposes only and does not constitute financial advice. Markets involve risk; past behavior does not guarantee future results. You are responsible for your own testing, risk management, and decisions.

Adaptive Market Regime Identifier [LuciTech]What it Does:
AMRI visually identifies and categorizes the market into six primary regimes directly on your chart using a color-coded background. These regimes are:
-Strong Bull Trend: Characterized by robust upward momentum and low volatility.
-Weak Bull Trend: Indicates upward momentum with less conviction or higher volatility.
-Strong Bear Trend: Defined by powerful downward momentum and low volatility.
-Weak Bear Trend: Suggests downward momentum with less force or increased volatility.
-Consolidation: Periods of low volatility and sideways price action.
-Volatile Chop: High volatility without clear directional bias, often seen during transitions or indecision.
By clearly delineating these states, AMRI helps traders quickly grasp the overarching market context, enabling them to apply strategies best suited for the current conditions (e.g., trend-following in strong trends, range-bound strategies in consolidation, or caution in volatile chop).
How it Works (The Adaptive Edge)
AMRI achieves its adaptive classification by continuously analyzing three core market dimensions, with each component dynamically adjusting to current market conditions:
1.Adaptive Moving Average (KAMA): The indicator utilizes the Kaufman Adaptive Moving Average (KAMA) to gauge trend direction and strength. KAMA is unique because it adjusts its smoothing period based on market efficiency (noise vs. direction). In trending markets, it becomes more responsive, while in choppy markets, it smooths out noise, providing a more reliable trend signal than static moving averages.
2.Adaptive Average True Range (ATR): Volatility is measured using an adaptive version of the Average True Range. Similar to KAMA, this ATR dynamically adjusts its sensitivity to reflect real-time changes in market volatility. This helps AMRI differentiate between calm, ranging markets and highly volatile, directional moves or chaotic periods.
3.Normalized Slope Analysis: The slope of the KAMA is normalized against the Adaptive ATR. This normalization provides a robust measure of trend strength that is relative to the current market volatility, making the thresholds for strong and weak trends more meaningful across different instruments and timeframes.
These adaptive components work in concert to provide a nuanced and responsive classification of the market regime, minimizing lag and reducing false signals often associated with fixed-parameter indicators.
Key Features & Originality:
-Dynamic Regime Classification: AMRI stands out by not just indicating trend or range, but by classifying the type of market regime, offering a higher-level analytical framework. This is a meta-indicator that provides context for all other trading tools.
-Adaptive Core Metrics: The use of KAMA and an Adaptive ATR ensures that the indicator remains relevant and responsive across diverse market conditions, automatically adjusting to changes in volatility and trend efficiency. This self-adjusting nature is a significant advantage over indicators with static lookback periods.
-Visual Clarity: The color-coded background provides an immediate, at-a-glance understanding of the current market regime, reducing cognitive load and allowing for quicker decision-making.
-Contextual Trading: By identifying the prevailing regime, AMRI empowers traders to select and apply strategies that are most effective for that specific environment, helping to avoid costly mistakes of using a trend-following strategy in a ranging market, or vice-versa.
-Originality: While components like KAMA and ATR are known, their adaptive integration into a comprehensive, multi-regime classification system, combined with normalized slope analysis for trend strength, offers a novel approach to market analysis not commonly found in publicly available indicators.
Volume Profile AnalysisThe Volume Profile Dashboard is a professional-grade analysis tool built for TradingView. It focuses on displaying a comprehensive volume profile breakdown within a dashboard format directly on the chart. The purpose of this tool is to help traders quickly assess buy versus sell volume dynamics, momentum, and sentiment in order to support informed trading decisions.
Instead of plotting simple bars, this indicator uses a detailed table and visual progress bar to summarize live and historical market activity. By condensing key metrics into a structured format, traders can analyse market behaviour without manually calculating or switching between multiple indicators.
________________________________________
How the Script Works
1. Data Gathering
The script uses lower-timeframe price and volume data to calculate buy volume, sell volume, and total traded volume for the current and previous candles.
2. Volume Allocation
Buy and sell volumes are estimated by looking at the candle’s range (high to low) and how the closing price aligns within that range. The closer the close is to the high, the stronger the buying pressure. The closer the close is to the low, the stronger the selling pressure.
3. Delta and Momentum
o Delta measures the difference between buy and sell volume.
o Volume momentum compares the current candle’s activity to the previous one, showing if interest is rising or fading.
4. Point of Control (POC)
An average of high, low, and close is calculated to give an approximate “point of control” level—an area of balance where buyers and sellers previously agreed on price.
5. Dashboard Visualization
All these calculations are displayed inside a clean dashboard table with separate rows for the current candle, previous candle, and a summary row. Icons, colors, and progress bars make it visually intuitive.
6. On-Chart Progress Indicator
A dynamic horizontal progress bar is plotted on the chart above price, showing the balance between buy and sell volume for the latest activity.
7. Alerts
Built-in alerts trigger when strong buying or selling pressure is detected or when there is a significant spike in total traded volume.
________________________________________
How This Tool Can Be Used
• Intraday Trading: Quickly gauge whether buyers or sellers are in control of the market at any moment.
• Swing Trading: Compare momentum shifts between candles to identify early trend reversals.
• Risk Management: Use delta and sentiment signals to confirm whether to hold or reduce exposure.
• Confirmation: Align the volume profile dashboard with other indicators (such as RSI, MACD, or trendlines) for stronger trading conviction.
________________________________________
Using Mixed Indicators for Decisions
This dashboard alone provides volume insights, but better decisions come when it is combined with other tools:
• Pairing it with an RSI can show whether heavy buying is happening in overbought conditions.
• Combining with a SuperTrend or moving averages can confirm if volume momentum aligns with the price trend.
• Overlaying support/resistance levels can identify whether strong buy/sell signals occur at critical levels.
Mixed indicators prevent relying on one signal alone, reducing false trades.
________________________________________
Importance of This Tool
• Clarity: Condenses complex volume data into a simple, visual format.
• Speed: Traders can react faster with pre-calculated buy/sell percentages.
• Precision: Highlights hidden imbalances that are not obvious from candles alone.
• Professional-grade dashboard: Offers an institutional-style view of market behavior directly within TradingView.
________________________________________
Parameters in the Dashboard Table
• Period: Shows whether the row is for the current or previous candle, along with trend arrows.
• Price Range: The high–low range of the candle.
• Total Volume: The sum of buy and sell activity.
• Buy Volume / Sell Volume: Separated distribution of transactions leaning bullish or bearish.
• Delta: The net difference between buy and sell volumes, highlighting pressure imbalance.
• Buy % / Sell %: The percentage contribution of each side to total volume.
• POC: An average reference level where market consensus was strongest.
• Progress: A graphical bar showing buy vs sell dominance.
• Signal: Simplified output like Strong Buy, Buy, Strong Sell, Sell, Neutral.
• Summary Row: Compares changes between the current and previous candles and gives overall market sentiment.
________________________________________
Stock Market Disclaimer
This tool is for educational and informational purposes only. It does not constitute financial advice, investment advice, or trading recommendations. The stock market and cryptocurrency markets involve high risk. Traders and investors should do their own research and consult licensed financial advisors before making investment decisions. Past performance is not indicative of future results.
________________________________________
Misuse Disclaimer
This script has been developed as per TradingView’s rules and is intended for responsible trading analysis only. Any misuse, redistribution, or modification outside of TradingView’s policies is discouraged. The author and platform are not responsible for financial losses, misinterpretation of signals, or misuse of the code.
________________________________________
Disclaimer
Training & Educational Only — This material and the indicator are provided for educational purposes only. Nothing here is investment advice or a solicitation to buy or sell financial instruments. Past simulated or historical performance does not predict future results. Always perform full back testing and risk management, and consider seeking advice from a qualified financial professional before trading with real capital.
________________________________________

Mutanabby_AI | Fresh Algo V24Mutanabby_AI | Fresh Algo V24: Advanced Multi-Mode Trading System
Overview
The Mutanabby_AI Fresh Algo V24 represents a sophisticated evolution of multi-component trading systems that adapts to various market conditions through advanced operational configurations and enhanced analytical capabilities. This comprehensive indicator provides traders with multiple signal generation approaches, specialized assistant functions, and dynamic risk management tools designed for professional market analysis across diverse trading environments.
Primary Signal Generation Framework
The Fresh Algo V24 operates through two fundamental signal generation approaches that accommodate different market perspectives and trading philosophies. The Trending Signals Mode serves as the primary trend-following mechanism, combining Wave Trend Oscillator analysis with Supertrend directional signals and Squeeze Momentum breakout detection. This mode incorporates ADX filtering that requires values exceeding 20 to ensure sufficient trend strength exists before signal activation, making it particularly effective during sustained directional market movements where momentum persistence creates profitable trading opportunities.
The Contrarian Signals Mode provides an alternative approach targeting reversal opportunities through extreme market condition identification. This mode activates when the Wave Trend Oscillator reaches critical threshold levels, specifically when readings surpass 65 indicating potential bearish reversal conditions or drop below 35 suggesting bullish reversal opportunities. This methodology proves valuable during overextended market phases where mean reversion becomes statistically probable.
Advanced Filtering Mechanisms
The system incorporates multiple sophisticated filtering mechanisms designed to enhance signal quality and reduce false positive occurrences. The High Volume Filter requires volume expansion confirmation before signal activation, utilizing exponential moving average calculations to ensure institutional participation accompanies price movements. This filter substantially improves signal reliability by eliminating low-conviction breakouts that lack adequate volume support from professional market participants.
The Strong Filter provides additional trend confirmation through 200-period exponential moving average analysis. Long position signals require price action above this benchmark level, while short position signals necessitate price action below it. This ensures strategic alignment with longer-term trend direction and reduces the probability of trading against major market movements that could invalidate shorter-term signals.
Cloud Filter Configuration System
The Fresh Algo V24 offers four distinct cloud filter configurations, each optimized for specific trading timeframes and market approaches. The Smooth Cloud Filter utilizes the mathematical relationship between 150-period and 250-period exponential moving averages, providing stable trend identification suitable for position trading strategies. This configuration generates signals exclusively when price action aligns with cloud direction, creating a more deliberate but highly reliable signal generation process.
The Swing Cloud Filter employs modified Supertrend calculations with parameters specifically optimized for swing trading timeframes. This filter achieves optimal balance between responsiveness and stability, adapting effectively to medium-term price movements while filtering excessive market noise that typically affects shorter-term analytical systems.
For active intraday traders, the Scalping Cloud Filter utilizes accelerated Supertrend calculations designed to capture rapid trend changes effectively. This configuration provides enhanced signal generation frequency suitable for compressed timeframe strategies. The advanced Scalping+ Cloud Filter incorporates Hull Moving Average confirmation, delivering maximum responsiveness for ultra-short-term trading while maintaining signal quality through additional momentum validation processes.
Specialized Assistant Functionality
The system includes two distinct assistant modes that provide supplementary market analysis capabilities. The Trend Assistant Mode activates advanced cloud analysis overlays that display dynamic support and resistance zones calculated through adaptive volatility algorithms. These levels automatically adjust to current market conditions, providing visual guidance for identifying trend continuation patterns and potential reversal areas with mathematical precision.
The Trend Tracker Mode concentrates on long-term trend identification by displaying major exponential moving averages with color-coded fill areas that clarify directional bias. This mode maintains visual simplicity while providing comprehensive trend context evaluation, enabling traders to quickly assess broader market direction and align shorter-term strategies accordingly.
Dynamic Risk Management System
The integrated risk management system automatically adapts across all operational modes, calculating stop loss and take profit targets using Average True Range multiples that adjust to current market volatility. This approach ensures consistent risk parameters regardless of selected operational mode while maintaining relevance to prevailing market conditions.
Stop loss placement occurs at dynamically calculated distances from entry points, while three progressive take profit targets establish at customizable ATR multiples respectively. The system automatically updates these levels upon trend direction changes, ensuring current market volatility influences all risk calculations and maintains appropriate risk-reward ratios throughout trade management.
Comprehensive Market Analysis Dashboard
The sophisticated dashboard provides real-time market analysis including volatility measurements, institutional activity assessment, and multi-timeframe trend evaluation across five-minute through four-hour periods. This comprehensive market context assists traders in selecting appropriate operational modes based on current market characteristics rather than relying exclusively on historical performance data.
The multi-timeframe analysis ensures mode selection considers broader market context beyond the primary trading timeframe, improving overall strategic alignment and reducing conflicts between different temporal market perspectives. The dashboard displays market state classification, volatility percentages, institutional activity levels, current trading session information, and trend pressure indicators with professional formatting and clear visual hierarchy.
Enhanced Trading Assistants
The Fresh Algo V24 includes specialized trading assistant features that complement the primary signal generation system. The Reversal Dot functionality identifies potential reversal points through Wave Trend Oscillator analysis, displaying visual indicators when crossover conditions occur at extreme levels. These reversal indicators provide early warning signals for potential trend changes before they appear in the primary signal system.
The Dynamic Take Profit Labels feature automatically identifies optimal profit-taking opportunities through RSI threshold analysis, marking potential exit points at multiple levels for long positions and corresponding levels for short positions. This automated profit management system helps traders optimize exit timing without requiring constant manual monitoring of technical indicators.
Advanced Alert System
The comprehensive alert system accommodates all operational modes while providing granular notification control for various signal types and risk management events. Traders can configure separate alerts for normal buy signals, strong buy signals, normal sell signals, strong sell signals, stop loss triggers, and individual take profit target achievements.
Cloud crossover alerts notify traders when trend direction changes occur, providing early indication of potential strategy adjustments. The alert system includes detailed trade setup information, timeframe data, and relevant entry and exit levels, ensuring traders receive complete context for informed decision-making without requiring constant chart monitoring.
Technical Foundation Architecture
The Fresh Algo V24 combines multiple proven technical analysis components including Wave Trend Oscillator for momentum assessment, Supertrend for directional bias determination, Squeeze Momentum for volatility analysis, and various exponential moving averages for trend confirmation. Each component contributes specific market insights while the unified system provides comprehensive market evaluation through their mathematical integration.
The multi-component approach reduces dependency on individual indicator limitations while leveraging the analytical strengths of each technical tool. This creates a robust analytical framework capable of adapting to diverse market conditions through appropriate mode selection and parameter optimization, ensuring consistent performance across varying market environments.
Market State Classification
The indicator incorporates advanced market state classification through ADX analysis, distinguishing between trending, ranging, and transitional market conditions. This classification system automatically adjusts signal sensitivity and filtering parameters based on current market characteristics, optimizing performance for prevailing conditions rather than applying static analytical approaches.
The volatility measurement system calculates current market activity levels as percentages, providing quantitative assessment of market energy and helping traders select appropriate operational modes. Institutional activity detection through volume analysis ensures signal generation aligns with professional market participation patterns.
Implementation Strategy Considerations
Successful implementation requires careful matching of operational modes to prevailing market conditions and individual trading objectives. Trending modes demonstrate optimal performance during directional markets with sustained momentum characteristics, while contrarian modes excel during range-bound or overextended market conditions where reversal probability increases.
The cloud filter configurations provide varying degrees of confirmation strength, with smoother settings reducing false signal occurrence at the expense of some responsiveness to price changes. Traders must balance signal quality against signal frequency based on their risk tolerance and available trading time, utilizing the comprehensive customization options to optimize performance for their specific requirements.
Multi-Timeframe Integration
The system provides seamless multi-timeframe analysis through the integrated dashboard, displaying trend alignment across multiple time horizons from five-minute through four-hour periods. This analysis helps traders understand broader market context and avoid conflicts between different temporal perspectives that could compromise trade outcomes.
Session analysis identifies current trading session characteristics, providing context for expected market behavior patterns and helping traders adjust their approach based on typical session volatility and participation levels. This geographic market awareness enhances strategic decision-making and improves timing for trade execution.
Advanced Visualization Features
The indicator includes sophisticated visualization capabilities through gradient candle coloring based on MACD analysis, providing immediate visual feedback on momentum strength and direction. This enhancement allows rapid market assessment without requiring detailed indicator analysis, improving efficiency for traders managing multiple instruments simultaneously.
The cloud visualization system uses color-coded fill areas to clearly indicate trend direction and strength, with automatic adaptation to selected operational modes. This visual clarity reduces analytical complexity while maintaining comprehensive market information display through professional chart presentation.
Performance Optimization Framework
The Fresh Algo V24 incorporates performance optimization features including signal strength classification, automatic parameter adjustment based on market conditions, and dynamic filtering that adapts to current volatility levels. These optimizations ensure consistent performance across varying market environments while maintaining signal quality standards.
The system automatically adjusts sensitivity levels based on selected operational modes, ensuring appropriate responsiveness for different trading approaches. This adaptive framework reduces the need for manual parameter adjustments while maintaining optimal performance characteristics for each operational configuration.
Conclusion
The Mutanabby_AI Fresh Algo V24 represents a comprehensive solution for professional trading analysis, combining multiple analytical approaches with advanced visualization and risk management capabilities. The system's strength lies in its adaptive multi-mode design and sophisticated filtering mechanisms, providing traders with versatile tools for various market conditions and trading styles.
Success with this system requires understanding the relationship between different operational modes and their optimal application scenarios. The comprehensive dashboard and alert system provide essential market context and trade management support, enabling systematic approach to market analysis while maintaining flexibility for individual trading preferences.
The indicator's sophisticated architecture and extensive customization options make it suitable for traders at all experience levels, from those seeking systematic signal generation to advanced practitioners requiring comprehensive market analysis tools. The multi-timeframe integration and adaptive filtering ensure consistent performance across diverse market conditions while providing clear guidelines for strategic implementation.

Hurst Exponent Adaptive Filter (HEAF) [PhenLabs]📊 PhenLabs - Hurst Exponent Adaptive Filter (HEAF)
Version: PineScript™ v6
📌 Description
The Hurst Exponent Adaptive Filter (HEAF) is an advanced Pine Script indicator designed to dynamically adjust moving average calculations based on real time market regimes detected through the Hurst Exponent. The intention behind the creation of this indicator was not a buy/sell indicator but rather a tool to help sharpen traders ability to distinguish regimes in the market mathematically rather than guessing. By analyzing price persistence, it identifies whether the market is trending, mean-reverting, or exhibiting random walk behavior, automatically adapting the MA length to provide more responsive alerts in volatile conditions and smoother outputs in stable ones. This helps traders avoid false signals in choppy markets and capitalize on strong trends, making it ideal for adaptive trading strategies across various timeframes and assets.
Unlike traditional moving averages, HEAF incorporates fractal dimension analysis via the Hurst Exponent to create a self-tuning filter that evolves with market conditions. Traders benefit from visual cues like color coded regimes, adaptive bands for volatility channels, and an information panel that suggests appropriate strategies, enhancing decision making without constant manual adjustments by the user.
🚀 Points of Innovation
Dynamic MA length adjustment using Hurst Exponent for regime-aware filtering, reducing lag in trends and noise in ranges.
Integrated market regime classification (trending, mean-reverting, random) with visual and alert-based notifications.
Customizable color themes and adaptive bands that incorporate ATR for volatility-adjusted channels.
Built-in information panel providing real-time strategy recommendations based on detected regimes.
Power sensitivity parameter to fine-tune adaptation aggressiveness, allowing personalization for different trading styles.
Support for multiple MA types (EMA, SMA, WMA) within an adaptive framework.
🔧 Core Components
Hurst Exponent Calculation: Computes the fractal dimension of price series over a user-defined lookback to detect market persistence or anti-persistence.
Adaptive Length Mechanism: Maps Hurst values to MA lengths between minimum and maximum bounds, using a power function for sensitivity control.
Moving Average Engine: Applies the chosen MA type (EMA, SMA, or WMA) to the adaptive length for the core filter line.
Adaptive Bands: Creates upper and lower channels using ATR multiplied by a band factor, scaled to the current adaptive length.
Regime Detection: Classifies market state with thresholds (e.g., >0.55 for trending) and triggers alerts on regime changes.
Visualization System: Includes gradient fills, regime-colored MA lines, and an info panel for at-a-glance insights.
🔥 Key Features
Regime-Adaptive Filtering: Automatically shortens MA in mean-reverting markets for quick responses and lengthens it in trends for smoother signals, helping traders stay aligned with market dynamics.
Custom Alerts: Notifies on regime shifts and band breakouts, enabling timely strategy adjustments like switching to trend-following in bullish regimes.
Visual Enhancements: Color-coded MA lines, gradient band fills, and an optional info panel that displays market state and trading tips, improving chart readability.
Flexible Settings: Adjustable lookback, min/max lengths, sensitivity power, MA type, and themes to suit various assets and timeframes.
Band Breakout Signals: Highlights potential overbought/oversold conditions via ATR-based channels, useful for entry/exit timing.
🎨 Visualization
Main Adaptive MA Line: Plotted with regime-based colors (e.g., green for trending) to visually indicate market state and filter position relative to price.
Adaptive Bands: Upper and lower lines with gradient fills between them, showing volatility channels that widen in random regimes and tighten in trends.
Price vs. MA Fills: Color-coded areas between price and MA (e.g., bullish green above MA in trending modes) for quick trend strength assessment.
Information Panel: Top-right table displaying current regime (e.g., "Trending Market") and strategy suggestions like "Follow trends" or "Trade ranges."
📖 Usage Guidelines
Core Settings
Hurst Lookback Period
Default: 100
Range: 20-500
Description: Sets the period for Hurst Exponent calculation; longer values provide more stable regime detection but may lag, while shorter ones are more responsive to recent changes.
Minimum MA Length
Default: 10
Range: 5-50
Description: Defines the shortest possible adaptive MA length, ideal for fast responses in mean-reverting conditions.
Maximum MA Length
Default: 200
Range: 50-500
Description: Sets the longest adaptive MA length for smoothing in strong trends; adjust based on asset volatility.
Sensitivity Power
Default: 2.0
Range: 1.0-5.0
Description: Controls how aggressively the length adapts to Hurst changes; higher values make it more sensitive to regime shifts.
MA Type
Default: EMA
Options: EMA, SMA, WMA
Description: Chooses the moving average calculation method; EMA is more responsive, while SMA/WMA offer different weighting.
🖼️ Visual Settings
Show Adaptive Bands
Default: True
Description: Toggles visibility of upper/lower bands for volatility channels.
Band Multiplier
Default: 1.5
Range: 0.5-3.0
Description: Scales band width using ATR; higher values create wider channels for conservative signals.
Show Information Panel
Default: True
Description: Displays regime info and strategy tips in a top-right panel.
MA Line Width
Default: 2
Range: 1-5
Description: Adjusts thickness of the main MA line for better visibility.
Color Theme
Default: Blue
Options: Blue, Classic, Dark Purple, Vibrant
Description: Selects color scheme for MA, bands, and fills to match user preferences.
🚨 Alert Settings
Enable Alerts
Default: True
Description: Activates notifications for regime changes and band breakouts.
✅ Best Use Cases
Trend-Following Strategies: In detected trending regimes, use the adaptive MA as a trailing stop or entry filter for momentum trades.
Range Trading: During mean-reverting periods, monitor band breakouts for buying dips or selling rallies within channels.
Risk Management in Random Markets: Reduce exposure when random walk is detected, using tight stops suggested in the info panel.
Multi-Timeframe Analysis: Apply on higher timeframes for regime confirmation, then drill down to lower ones for entries.
Volatility-Based Entries: Use upper/lower band crossovers as signals in adaptive channels for overbought/oversold trades.
⚠️ Limitations
Lagging in Transitions: Regime detection may delay during rapid market shifts, requiring confirmation from other tools.
Not a Standalone System: Best used in conjunction with other indicators; random regimes can lead to whipsaws if traded aggressively.
Parameter Sensitivity: Optimal settings vary by asset and timeframe, necessitating backtesting.
💡 What Makes This Unique
Hurst-Driven Adaptation: Unlike static MAs, it uses fractal analysis to self-tune, providing regime-specific filtering that's rare in standard indicators.
Integrated Strategy Guidance: The info panel offers actionable tips tied to regimes, bridging analysis and execution.
Multi-Regime Visualization: Combines adaptive bands, colored fills, and alerts in one tool for comprehensive market state awareness.
🔬 How It Works
Hurst Exponent Computation:
Calculates log returns over the lookback period to derive the rescaled range (R/S) ratio.
Normalizes to a 0-1 value, where >0.55 indicates trending, <0.45 mean-reverting, and in-between random.
Length Adaptation:
Maps normalized Hurst to an MA length via a power function, clamping between min and max.
Applies the selected MA type to close prices using this dynamic length.
Visualization and Signals:
Plots the MA with regime colors, adds ATR-based bands, and fills areas for trend strength.
Triggers alerts on regime changes or band crosses, with the info panel suggesting strategies like momentum riding in trends.
💡 Note:
For optimal results, backtest settings on your preferred assets and combine with volume or momentum indicators. Remember, no indicator guarantees profits—use with proper risk management. Access premium features and support at PhenLabs.

AI's Opinion Trading System V21. Complete Summary of the Indicator Script
AI’s Opinion Trading System V2 is an advanced, multi-factor trading tool designed for the TradingView platform. It combines several technical indicators (moving averages, RSI, MACD, ADX, ATR, and volume analysis) to generate buy, sell, and hold signals. The script features a customizable AI “consensus” engine that weighs multiple indicator signals, applies user-defined filters, and outputs actionable trade instructions with clear stop loss and take profit levels. The indicator also tracks sentiment, volume delta, and allows for advanced features like pyramiding (adding to positions), custom stop loss/take profit prices, and flexible signal confirmation logic. All key data and signals are displayed in a dynamic, color-coded table on the chart for easy review.
2. Full Explanation of the Table
The table is a real-time dashboard summarizing the indicator’s logic and recommendations for the most recent bars. It is color-coded for clarity and designed to help traders quickly understand market conditions and AI-driven trade signals.
Columns (from left to right):
Column Name What it Shows
Bar The time context: “Now” for the current bar, then “Bar -1”, “Bar -2”, etc. for previous bars.
Raw Consensus The raw AI consensus for each bar: “Buy”, “Sell”, or “-” (neutral).
Up Vol The amount of volume on up (rising) bars.
Down Vol The amount of volume on down (falling) bars.
Delta The difference between up and down volume. Green if positive, red if negative, gray if neutral.
Close The closing price for each bar, color-coded by price change.
Sentiment Diff The difference between the close and average sentiment price (a custom sentiment calculation).
Lookback The number of bars used for sentiment calculation (if enabled).
ADX The ADX value (trend strength).
ATR The ATR value (volatility measure).
Vol>Avg “Yes” (green) if volume is above average, “No” (red) otherwise.
Confirm Whether the AI signal is confirmed over the required bars.
Logic Output The AI’s interpreted signal after applying user-selected logic: “Buy”, “Sell”, or “-”.
Final Action The final signal after all filters: “Buy”, “Sell”, or “-”.
Trade Instruction A plain-English instruction: Buy/Sell/Add/Hold/No Action, with price, stop loss, and take profit.
Color Coding:
Green: Positive/bullish values or signals
Red: Negative/bearish values or signals
Gray: Neutral or inactive
Blue background: For all table cells, for visual clarity
White text: Default, except for color-coded cells
3. Full User Instructions for Every Input/Style Option
Below are plain-language instructions for every user-adjustable option in the indicator’s input and style pages:
Inputs
Table Location
What it does: Sets where the summary table appears on your chart.
How to use: Choose from 9 positions (Top Left, Top Center, Top Right, etc.) to avoid overlapping with other chart elements.
Decimal Places
What it does: Controls how many decimal places prices and values are displayed with.
How to use: Increase for assets with very small prices (e.g., SHIB), decrease for stocks or forex.
Show Sentiment Lookback?
What it does: Shows or hides the “Lookback” column in the table, which displays how many bars are used in the sentiment calculation.
How to use: Turn off if you want a simpler table.
AI View Mode
What it does: Selects the logic for how the AI combines signals from different indicators.
Majority: Follows the most common signal among all indicators.
Weighted: Uses custom weights for each type of signal.
Custom: Lets you define your own logic (see below).
How to use: Pick the logic style that matches your trading philosophy.
AI Consensus Weight / Vol Delta Weight / Sentiment Weight
What they do: When using “Weighted” AI View Mode, these let you set how much influence each factor (indicator consensus, volume delta, sentiment) has on the final signal.
How to use: Increase a weight to make that factor more important in the AI’s decision.
Custom AI View Logic
What it does: Lets advanced users write their own logic for when the AI should signal a trade (e.g., “ai==1 and delta>0 and sentiment>0”).
How to use: Only use if you understand basic boolean logic.
Use Custom Stop Loss/Take Profit Prices?
What it does: If enabled, you can enter your own fixed stop loss and take profit prices for buys and sells.
How to use: Turn on to override the auto-calculated SL/TP and enter your desired prices below.
Custom Buy/Sell Stop Loss/Take Profit Price
What they do: If custom SL/TP is enabled, these fields let you set exact prices for stop loss and take profit on both buy and sell trades.
How to use: Enter your preferred price, or leave at 0 for auto-calculation.
Sentiment Lookback
What it does: Sets how many bars the sentiment calculation should look back.
How to use: Increase to smooth out sentiment, decrease for faster reaction.
Max Pyramid Adds
What it does: Limits how many times you can add to an existing position (pyramiding).
How to use: Set to 1 for no adds, higher for more aggressive scaling in trends.
Signal Preset
What it does: Quick-sets a group of signal parameters (see below) for “Robust”, “Standard”, “Freedom”, or “Custom”.
How to use: Pick a preset, or select “Custom” to adjust everything manually.
Min Bars for Signal Confirmation
What it does: Sets how many bars a signal must persist before it’s considered valid.
How to use: Increase for more robust, less frequent signals; decrease for faster, but possibly less reliable, signals.
ADX Length
What it does: Sets the period for the ADX (trend strength) calculation.
How to use: Longer = smoother, shorter = more sensitive.
ADX Trend Threshold
What it does: Sets the minimum ADX value to consider a trend “strong.”
How to use: Raise for stricter trend confirmation, lower for more trades.
ATR Length
What it does: Sets the period for the ATR (volatility) calculation.
How to use: Longer = smoother volatility, shorter = more reactive.
Volume Confirmation Lookback
What it does: Sets how many bars are used to calculate the average volume.
How to use: Longer = more stable volume baseline, shorter = more sensitive.
Volume Confirmation Multiplier
What it does: Sets how much current volume must exceed average volume to be considered “high.”
How to use: Increase for stricter volume filter.
RSI Flat Min / RSI Flat Max
What they do: Define the RSI range considered “flat” (i.e., not trending).
How to use: Widen to be stricter about requiring a trend, narrow for more trades.
Style Page
Most style settings (such as plot colors, label sizes, and shapes) are preset in the script for visual clarity.
You can adjust plot visibility and colors (for signals, stop loss, take profit) in the TradingView “Style” tab as with any indicator.
Buy Signal: Shows as a green triangle below the bar when a buy is triggered.
Sell Signal: Shows as a red triangle above the bar when a sell is triggered.
Stop Loss/Take Profit Lines: Red and green lines for SL/TP, visible when a trade is active.
SL/TP Labels: Small colored markers at the SL/TP levels for each trade.
How to use:
Toggle visibility or change colors in the Style tab if you wish to match your chart theme or preferences.
In Summary
This indicator is highly customizable—you can tune every aspect of the AI logic, risk management, signal filtering, and table display to suit your trading style.
The table gives you a real-time, comprehensive view of all relevant signals, filters, and trade instructions.
All inputs are designed to be intuitive—hover over them in TradingView for tooltips, or refer to the explanations above for details.
