Liquidity Pool - TradingEDThe use of this indicator is restricted to private use, and it can be used only by invitation. Different functionalities have been added to the original codes, such as alerts and signals that seek to make trading much easier to interpret by any type of trading operator of any experience level, from beginner to intermediate and advanced .
Key components:
• Follow the liquidity levels, as they are going to attract the price sooner or later.
• Never open positions opposite to a liquidity level’s direction.
• During the price movement towards a liquidity level, there appears a high probability to cross that level.
• When a liquidity level is crossed, the reversal movement is quite a frequent consequence, as major players are not interested in a level anymore.
When support and resistance levels are held for a long time, the highest liquidity is cumulated above or below those levels, so this is why "Liquidity pools" occur around key support and resistance, or areas on the chart where a lot of trading activity takes place. If you trade, you need this trading activity to get your order filled. Most retail traders don’t have to worry about liquidity when it comes to getting filled. In fact, even some professional swing or trend traders may not have to worry about it. A string of order types cumulates an asset’s liquidity there. This is why investors drive prices into those areas, creating new liquidity levels.
Main functions of this indicator:
1) The SOURCE for the counts can be determined by the trader (close, open, etc).
2) The MEASURE can be based on a CANDLES count if you are trading OHLC Charts from 1D onwards, or if your trading is intraday, you can also select counts by MINUTES, HOURS or DAYS, depending on your trading style.
3) LENGTH, by default it will be loaded as in the STRATEGY, but considering the previous point, you can modify it according to your convenience.
חפש סקריפטים עבור "liquidity"

Liquidity Spike PoolThe “Liquidity Pools” indicator is a tool for market analysts that stands out for its ability to clearly project the intricate zones of manipulation present in financial markets. These crucial territories emerge when supply or demand takes over, resulting in long shadows (wicks) on the chart candles. Imagine these regions as "magnets" for prices, as they represent authentic "liquidity pools" where the flow of money into the market is significantly concentrated. But the value of the indicator goes beyond this simple visualization: these zones, when identified and interpreted correctly, can play a crucial role for traders looking for profitable entry points. They can mutate into important bastions of support or resistance, providing traders with key anchor points to make informed decisions within their trading strategies.
A key aspect to consider is the importance of different time frames in analyzing markets. Larger time frames, such as daily or 4h, tend to host larger and more relevant liquidity zones. Therefore, a successful strategy might involve identifying these areas of manipulation over longer time frames through the use of this indicator, and then applying these findings to shorter time frames. This approach allows you to turn manipulation zones into crucial reference points that merit constant surveillance while making trading decisions on shorter time frames.
The indicator uses color to convey information clearly and effectively:
- Dark blue lines highlight candles with significant upper wick, signaling the possible presence of an important manipulation area in the considered area.
- Dark red lines are reserved for sizable candlesticks with significant upper wick, emphasizing situations that are particularly relevant to traders.
- Dark gray lines highlight candles with significant lower wick, providing a valuable indication of manipulation zones where the bid may have prevailed.
- White lines highlight sizable candlesticks with significant lower wick, clearly indicating situations where demand has been predominant and may have helped form a liquidity pool.
This indicator constitutes an important resource for identifying and clearly displaying candles with significant wicks, allowing traders to distinguish between ordinary market conditions and circumstances particularly relevant to their trading strategies. Thanks to the distinctive colors of the lines, the indicator offers intuitive visual guidance, allowing traders to make more informed decisions while carrying out their analyses.

Liquidity Levels MTF - SonarlabThis indicator uses Pivot Points to identify Liquidity Levels in the market. Liquidity Levels are levels in the market where you would expect price to be pulled towards.
Liquidity Levels by Sonarlab also has an option to show Higher Timeframe Liquidity Levels.
Below are the indicators settings:
Liquidity Mitigation Options
The Indicator has options for you to choose what happens to the Liquidity line/boxes once it has been mitigated. Either Keep them on the chart, or remove them.
Display Styles
Choose how the levels are displayed, either with Lines or Boxes.
Set the your Extension options, by keeping the lines/boxes "short" or extend to current price, or maximum to the right
Colors and Styles
Set colors and styles for all lines and boxes

Liquidity Heatmap (Nephew_Sam_)Liquidity Heatmap
This indicator plots a heatmap of resting liquidity above and below swing lows and multiple timeframes
The darker the color is or the larger the zone is, the more liquidity is lying there. If you think there are too many zones, you can increase the timeframes in the settings or just disable it.
Liquidity simply means orders such as stoplosses, buy/sell stops.
Disclaimer: You are free to use this code but your should be open source too

Liquidity sweep (Redcrabice)This script was created by Redcrabicefx
this indicator was created to indicate price has broken a certain level of HIGH/LOW, this was created to assist me in identifying the Liquidity sweep of internal and external liquidity for entry confirmation.
Green label = sweep 5-10 previous High/Low
Blue label = sweep 15 - 20 previous High/Low
Purple label = sweep 50 previous High/Low
Orange label = sweep 100-200 Previous High/Low
Red/Black label = sweep +500 Previous High/Low
if price has only sweep 75 candles, it will only show purple label (50) since it has not reached Orange level (100) yet
you can also choose your color of choice for the LQ sweep lines in the setting.

Liquidity Pools (Nephew_Sam_)This indicator makes use of Pivot Points to identify liquidity pools. This simply means, highs and lows that the price should eventually take out (go towards) before reacting.
In this current version (v1), I implemented multi timeframe pivot points, each with a custom line style and color.
The x left/right bars are used to identify swing points, the number provided will find the highest/lowest candle in the provided left/right bars.
Upcoming
In the next update(s) we will add more features like - identifying relative highs/lows, closest liquidity pools, extending lines, adding labels etc

Liquidity StatusKey Points
The Liquidity Status (LS) indicator is designed to directly monitor liquidity conditions and determine if they are Bullish or Bearish.
If conditions are bullish, the candle is painted green (or whichever color is chosen by you to represent bullish liquidity) and the expected price action is up.
If conditions are bearish, the candle is painted red (or whichever color is chosen by you to represent bearish liquidity) and the expected price action is down.
LS allows you to monitor for when traders are absorbing or supplying liquidity and in which direction the liquidity is flowing.
LS works on equities, cryptocurrencies, forex, options data, and futures.
Summary
The Liquidity Status (LS) indicator measures liquidity directly without relying on bid/ask spreads, order-book information, or any other traditional means. The benefit of this non-traditional approach is a novel and unique way to interpret and analyze liquidity in the market.
LS is designed to be as straightforward as possible: when conditions are bullish then the outlook is bullish and the candles are painted the bullish color (default: green), and when conditions are bearish then the outlook is bearish and the candles are painted the bearish color (default: red).
This means the candles are not colored based on their price movements but rather based on their liquidity status.
Additionally, LS indicates Liquidity Flow (LF) as well. LF indicates where the source of liquidity is or is moving towards: either towards the Ask (if the Bid is requiring liquidity then the liquidity source becomes the Ask), or towards the Bid (if the Ask is requiring liquidity then the liquidity source becomes the Bid). This can be helpful in early identification of trend changes.
The default settings are designed to be streamlined but the Settings section below outlines how to add additional information and detail to your charts if desired.
Examples
An example of LS on default setting:
With Full and Declarative reporting:
ES Futures:
Details
In the default settings, LS indicates if conditions are:
Bullish : meaning that current liquidity is bullish and so too are outlooks, or
Bearish: meaning that current liquidity is bearish and so too are outlooks.
There are additional data that are provided via LS, if toggled on (as described below). They include:
Aggressive Bid / Ask : This indicates that there is an aggressive trader present. Aggressive traders are large liquidity absorbers and are defined as having a sense of urgency in their trading that will cause them to go where-ever (whichever price) they can in order to transact. A classic Aggressive Bid, for instance, is a short-seller currently being squeezed.
Eager Bid / Ask : This indicates that there is an eager trader present. Eager traders are defined by their willingness to “cross the isle” in order to transact. For example, an eager bid will move to the ask in order to transact whereas an organic bid would not.
Organic Bid / Ask : This indicates that transactions are occurring at the organic traders. Organic traders are defined as having a large time-horizon and are value-seekers. For instance, an organic ask will likely move price up in order to sell high (the second part of buy low, sell high).
Additionally, LS indicates LF by specifying which party has the demand for liquidity and which has the supply for liquidity.
Flow to Ask : This indicates that the demand to transact is flowing to the ask (i.e.: the bid needs to transact more than the ask) and thus the ask is becoming the liquidity supplier.
Flow to Bid : This indicates that the demand to transact is flowing to the bid (i.e.: the ask needs to transact more than the bid) and thus the bid is becoming the liquidity supplier.
Neutral : No discernable difference in liquidity demand.
In combination, these signals can produce powerful measurements of underlying liquidity activity. For instance:
If LS indicates “At Organic Ask” and LF indicates “Flow to Ask” then this means that (1) transactions are predominantly occurring at or near the organic ask and (2) the organic ask is the dominate liquidity supplier. The consequence is likely substantial price appreciation (remember: the organic ask wants to sell high and now they are setting the terms and conditions of transacting!).
Example - How it started: transactions started to occur at the Organic Ask with Flow to Ask:
Example - How it ended:
Conversely, “At Organic Bid” and “Flow to Bid” indicates that transactions are predominantly occurring at or near the organic bid (who wants to buy low) and they the ones fulfilling the demand to transact coming from the ask. The expected outlook? Price depreciation as the organic bid lowers their orders to average down!
Example - How it started: transactions started to occur at Organic Bid with Flow to Bid:
Example - How it ended:
Lastly, LS (in combination with Liquidity Triggers) can identify moments of high-risk for bull and bear traps (see FAQ for details on how traps are found).
Example: Bear-Trap (with LT displayed)
Example: Bull-Trap (with LT displayed)
Customization
LS has many customization options available.
Sensitivity Mode
LS comes in a variety of sensitivities (for the nerds: adjusting the Sensitivity vs. Specificity), outlined below:
Aggressive : The Aggressive sensitivity mode puts LS in a state of hyper-awareness for anything that might indicate a change in overall liquidity status (i.e.: Bullish to Bearish or Bearish to Bullish) is underway. The benefit of the Aggressive mode is that it does not take much for LS to change its mind about current conditions. The trade-off, however, is increase in false alarms.
Balance : The balanced setting works to balance specificity (how right LS is) with sensitivity (how much chang it takes to convince LS to change its mind).
Conservative : The conservative setting is prone to change slower than both Aggressive and Balance but is intended to be more “certain” of the changes when they are indicated. This can lower the sensitivity (early entrances to trend-changes might be delayed slightly) in exchange for greater confidence in the future.
Diamond : This is the most specific and least sensitive option. Designed for when you only want LS to indicate a change with the strictest of criteria met.
Examples:
Aggressive LS:
Balanced LS:
Conservative LS:
Diamond LS:
LS Detail Amount
Controls how much detail and information you want displayed.
Simplified : Keeps messaging straightforward: Bearish or Bullish.
Full : Parsing the data for greater detail about if conditions are Strong or Weak. Produces candles and text output.
LS Reporting Style
Interpretive : Text output from LS is kept as either Bullish or Bearish.
Declarative : Additional information regarding if the transactions are being performed by an Aggressive, Eager or Organic trader.
LS Candle Replacement
In order to have LS produce candles colored by liquidity, the `LS Candle Replacement` option must be selected, along with deselecting the charts candle-making by going to Settings -> Symbol and de-selecting `Body`, `Border`, and `Wick`.
Otherwise, LS’ colors will be over-ridden by the chart.
Alerts
LS comes with several alerts to help keep track of changing liquidity conditions in the market. They include:
Is Bullish / Bearish : fires at the start of the candle if conditions are bullish/bearish.
Has Become Bullish / Bearish : Fires at the end of the candle if conditions have swapped (as compared to the previous candle).
Flow is to Ask / Bid : Fires at the start of the candle to indicate which direction liquidity is flowing via LF.
Flow Switch to Bid / Ask : Fires if there is a change in the LF from one to the other.
Suspected Bear Trap : Fires if a bear trap is detected.
Suspected Bear Trap Ended : Fires if an on-going bear-trap has ended.
Suspected Bull Trap : Fires if a bull trap is detected.
Suspected Bull Trap Ended : Fires if an on-going bull-trap has ended.
Frequently Asked Questions
How can I get access to LS?
Please see the Author’s Instructions for more information.
Where can I get more information on LS?
Please see the Author’s Instructions for more information.
I tried to add LS to my chart but nothing is showing.
That’s no good! Be sure that the indicator hasn’t errored out (if there is a small red dot next to its name then it has errored out). If it has, then try re-applying the indicator to your chart.
If there is no error indicated, and you still do not see anything it may be likely that the requested symbol either:
Doesn’t have sufficient data to calculate LS on, or
Lacks the data for LS to be calculated completed.
To check, try using LS on a smaller interval. If LS starts to populate, it is likely that the needed data is present but just not enough for the timeframe you were interested in. If there is no LS even when moving to lower intervals, then it may be that the specified underlying lacks the required data.
How come LS is saying things are Bearish but price is going up?
Sometimes that can happen! But until LS indicates bullish liquidity, the expectation is that price will fall back down.
How come LS is saying things are Bullish but price is going down?
Sometimes that can happen! But until LS indicates bearish liquidity, the expectation is that price will recover and continue moving on upwards.
How do you locate Bear and Bull traps?
LS has LT (Liquidity Triggers) baked into it for alerts and uses LT to compare expected conditions with real conditions. If LS and LT are mismatched then a trap is detected. The LT conditions checked are:
If LT is in a bull-stack : that means LT(144) > LT(377) > LT(610), or
If LT is in a bear-stack : that means LT(610) < LT(377) < LT(144)
Then once the stack is determined, if LS disagrees:
LS is indicating Bullish while LT is in a bear-stack, or
LS is indicating Bearish while LT is in a bull-stack
Then the alert is triggered (based off of LT’s orientation). This means:
If conditions are Bullish but LT is showing a Bearish stack, then a Bull Trap is detected, and
If conditions are Bearish but LT is showing a Bullish Stack, then a Bear Trap is detected.
I have questions and maybe a bug!
Please reach out and report! Please refer to the Author’s Instructions for more information on how to reach out.
Does LS get updates?
Yup! Improvements come relatively frequently and if you have any suggestions for improvements, please don’t hesitate to reach out.

Liquidity Pro Map [ChartPrime]⯁ OVERVIEW
Liquidity Pro Map is a market-structure tool that simulates liquidity distribution by splitting price history into buy-side and sell-side profiles. Using candle volume and the standard deviation of close, the indicator builds two mirrored volume maps on the right-hand side of the chart. It also extends liquidity levels backwards in time until they are crossed by price, allowing you to see which zones remain untouched and where liquidity is most likely resting. Cumulative skew lines and highlighted POC levels give additional clarity on imbalance between buyers and sellers.
⯁ KEY FEATURES
Dual Liquidity Profiles: The chart is divided into buy-side (green) and sell-side (red) liquidity profiles, letting you instantly compare both sides of order flow.
Level Extension Logic: Each liquidity level is extended back in time until price crosses it. If not crossed, it persists all the way to the indicator’s lookback period, marking zones that remain “untapped.”
Dynamic Binning with Standard Deviation: The indicator distributes candle volumes into bins using close-price deviation, creating a more realistic liquidity map than static price levels.
priceDeviation = ta.stdev(close, 25) * 2
priceReference = close > open ? low - priceDeviation : high + priceDeviation
Cumulative Volume Skew Lines: Polylines on the right-hand side show the aggregated buy and sell volume profiles, making it easy to spot imbalance.
POC Identification: Highest-volume levels on both sides are marked as POC (Point of Control) , providing key zones of interest.
Clear Color Coding: Gradient shading intensifies with volume concentration—dark teal/green for buy zones, dark pink/red for sell zones.
⯁ HOW IT WORKS (UNDER THE HOOD)
Volume Distribution: Each bar’s volume is assigned to a price bin based on its reference price (close ± standard deviation offset).
Buy vs. Sell Splitting: If bins above last close price, volume is allocated to sell-side liquidity; otherwise, it’s allocated to buy-side liquidity.
Level Extension: Boxes marking liquidity bins extend back until crossed by price. If uncrossed, they anchor all the way to the start of the lookback window.
Cumulative Polylines: As bins are stacked, cumulative buy and sell values form skew polylines plotted at the right edge.
POC Levels: The highest-volume bin on each side is highlighted with labels and arrows, marking where the heaviest liquidity is concentrated.
⯁ USAGE
Use buy/sell profiles to see where liquidity is likely resting. Green shelves suggest potential support zones; red shelves suggest resistance or sell liquidity pools.
Watch untouched extended levels —these often become magnets for price as liquidity is swept.
Track POC levels as primary liquidity targets, where reactions or fakeouts are most common.
Compare cumulative skew lines to judge which side dominates in volume. Heavy buy skew may indicate absorption of sell pressure, and vice versa.
Adjust lookback period to switch between intraday liquidity maps and larger swing-based profiles.
Use separator feature to hide bins borders for better visual clarity.
Use as a confluence tool with OBs, support/resistance, and liquidity sweep setups.
⯁ CONCLUSION
Liquidity Pro Map transforms candle volume into a structured simulation of where liquidity may rest across the chart. By dividing buy vs. sell profiles, extending untouched levels, and marking cumulative skew and POC, it equips traders with a clear visual map of potential liquidity pools. This allows for better anticipation of sweeps, reversals, and areas of high market activity.

Liquidity mapLocate institutional daily, weekly, and monthly liquidity intervention zones in an innovative format that allows you to fractalize the degree of trend reversal opportunity across multiple lengths!
Far from the traditional formats to tell you "where's the high/low", we display with this map the grab levels relating to the amplitudes of the measured period.
You can check "show old levels" to backtest these potential fractal reversal areas.
Use the levels that interest you according to your working UT (scalping, intraweek, swing, etc.), or take all the elements into consideration for your trading management :
Confluence the information to optimize your entry and shelter your stop loss under strong levels rejections !
Default parameters are: display high/low weekly & monthly, display liquidities levels in daily.

Liquidity Price Depth Chart [LuxAlgo]The Liquidity Price Depth Chart is a unique indicator inspired by the visual representation of order book depth charts, highlighting sorted prices from bullish and bearish candles located on the chart's visible range, as well as their degree of liquidity.
Note that changing the chart's visible range will recalculate the indicator.
🔶 USAGE
The indicator can be used to visualize sorted bullish/bearish prices (in descending order), with bullish prices being highlighted on the left side of the chart, and bearish prices on the right. Prices are highlighted by dots, and connected by a line.
The displacement of a line relative to the x-axis is an indicator of liquidity, with a higher displacement highlighting prices with more volume.
These can also be easily identified by only keeping the dots, visible voids can be indicative of a price associated with significant volume or of a large price movement if the displacement is more visible for the price axis. These areas could play a key role in future trends.
Additionally, the location of the bullish/bearish prices with the highest volume is highlighted with dotted lines, with the returned horizontal lines being useful as potential support/resistances.
🔹 Liquidity Clusters
Clusters of liquidity can be spotted when the Liquidity Price Depth Chart exhibits more rectangular shapes rather than "V" shapes.
The steepest segments of the shape represent periods of non-stationarity/high volatility, while zones with clustered prices highlight zones of potential liquidity clusters, that is zones where traders accumulate positions.
🔹 Liquidity Sentiment
At the bottom of each area, a percentage can be visible. This percentage aims to indicate if the traded volume is more often associated with bullish or bearish price variations.
In the chart above we can see that bullish price variations make 63.89% of the total volume in the range visible range.
🔶 SETTINGS
🔹 Bullish Elements
Bullish Price Highest Volume Location: Shows the location of the bullish price variation with the highest associated volume using one horizontal and one vertical line.
Bullish Volume %: Displays the bullish volume percentage at the bottom of the depth chart.
🔹 Bearish Elements
Bearish Price Highest Volume Location: Shows the location of the bearish price variation with the highest associated volume using one horizontal and one vertical line.
Bearish Volume %: Displays the bearish volume percentage at the bottom of the depth chart.
🔹 Misc
Volume % Box Padding: Width of the volume % boxes at the bottom of the Liquidity Price Depth Chart as a percentage of the chart visible range

Liquidity Swing Points [BackQuant]Liquidity Swing Points
This tool marks recent swing highs and swing lows and turns them into persistent horizontal “liquidity” levels. These are places where resting orders often accumulate, such as stop losses above prior highs and below prior lows. The script detects confirmed pivots, records their prices, draws lines and labels, and manages their lifecycle on the chart so you can monitor potential sweep or breakout zones without manual redrawing.
What it plots
LQ-H at confirmed swing highs
LQ-L at confirmed swing lows
Horizontal levels that can optionally extend into the future
Timed removal of old levels to keep the chart clean
Each level stores its price, the bar where it was created, its type (high or low), plus a label and a line reference for efficient updates.
How it works
Pivot detection
A swing high is confirmed when the highest high has swing_length bars on both sides that are lower.
A swing low is confirmed when the lowest low has swing_length bars on both sides that are higher.
Pivots are only marked after they are confirmed, so they do not repaint.
Level creation
When a pivot confirms, the script records the price and the creation bar (offset by the right lookback).
A new line is plotted at that price, labeled LQ-H or LQ-L.
Rendering and extension
Levels can be drawn to the most recent bar only or extended to the right for forward reference.
Label size and line color/transparency are configurable.
Lifecycle management
On each confirmed bar, the script checks level age.
Levels older than a chosen bar count are removed automatically to reduce clutter.
How it can be used
Liquidity sweeps: Watch for price to probe beyond a level then close back inside. That behavior often signals a potential fade back into the prior range.
Breakout validation: If price pushes through a level and holds on closes, traders may treat that as continuation. Retests of the level from the other side can serve as structure checks.
Context for entries and exits: Use nearby LQ-H or LQ-L as reference for stop placement or partial-take zones, especially when other tools agree.
Multi-timeframe mapping: Plot swing points on higher timeframes, then drill down to time entries on lower timeframes as price interacts with those levels.
Why liquidity levels matter
Prior swing points are focal areas where many strategies set stops or pending orders. Price often revisits these zones, either to “sweep” resting liquidity before reversing, or to absorb it and trend. Marking these areas objectively helps frame scenarios like failed breaks, successful breakouts, and retests, and it reduces the subjectivity of eyeballing structure.
Settings to know
Swing Detection Length (swing_length), Controls sensitivity. Lower values find more local swings. Higher values find more significant ones.
Bars until removal (removeafter), Deletes levels after a fixed number of bars to prevent buildup.
Extend Levels Right (extend_levels), Keeps levels projected into the future for easier planning.
Label Size (label_size), Choose tiny to large for chart readability.
One color input controls both high and low levels with transparency for context.
Strengths
Objective marking of recent structure without hand drawing
No repaint after confirmation since pivots are locked once the right lookback completes
Lightweight and fast with simple lifecycle management
Clear visuals that integrate well with any price-action workflow
Practical tips
For scalping: use smaller swing_length to capture more granular liquidity. Keep removeafter short to avoid clutter.
For swing trading: increase swing_length so only more meaningful levels remain. Consider extending levels to the right for planning.
Combine with time-of-day filters, ATR for stop sizing, or a separate trend filter to bias trades taken at the levels.
Keep screenshots focused: one image showing a sweep and reversal, another showing a clean breakout and retest.
Limitations and notes
Levels appear after confirmation, so they are delayed by swing_length bars. This is by design to avoid repainting.
On very noisy or illiquid symbols, you may see many nearby levels. Increasing swing_length and shortening removeafter helps.
The script does not assess volume or session context. Consider pairing with volume or session tools if that is part of your process.

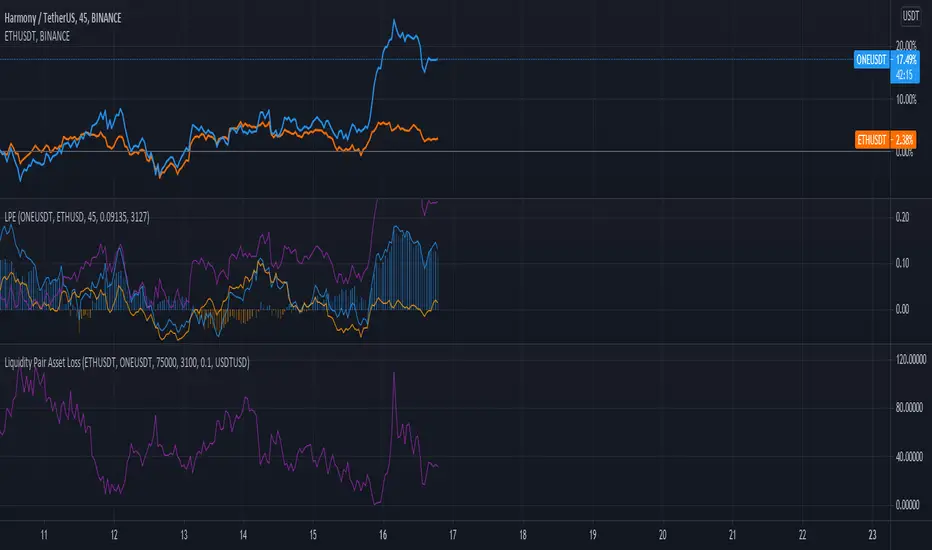
Liquidity Pair Impermanent Asset LossWith limited tracking of impermanent loss for liquidity pairs across all chains, I wanted a very simple display of live dollar value loss in an asset pair. This should allow you to set alerts based on how much you are down and take action if needed. The output column is by default set to show your losses in USD. For those that need it, I also setup an option to track the output in something other than USDT, e.g., GBP or ETH, etc..
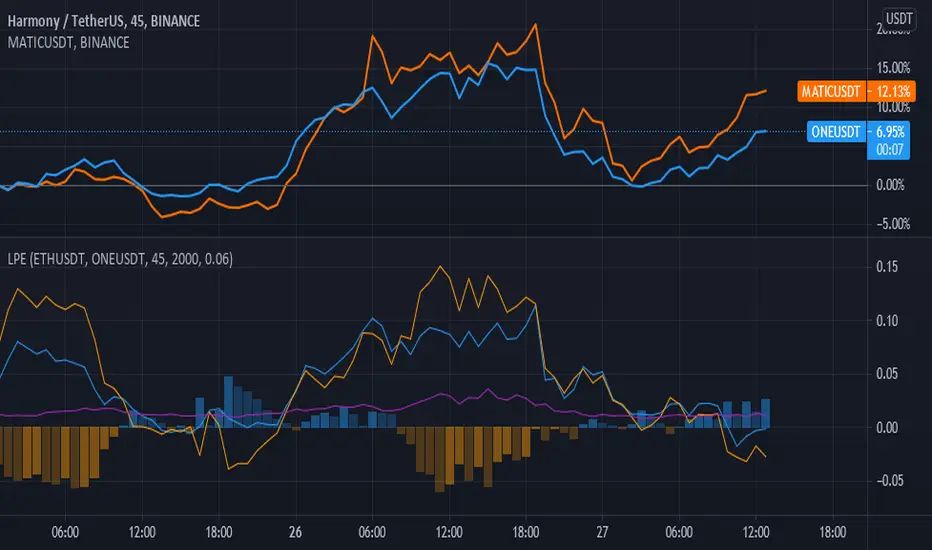
Liquidity Pair EvalWhile there are many tools for generating your impermanent loss in liquidity pools, depending on your choice of chain, I was mostly concerned about monitoring the creep between the pairs. This V0.1 attempt should give us a general comparison of the selected asset returns given your time period and also display the percent loss assuming the initial purchase price values are input correctly.
This is a work in progress and I am open to suggestions to make this even better.
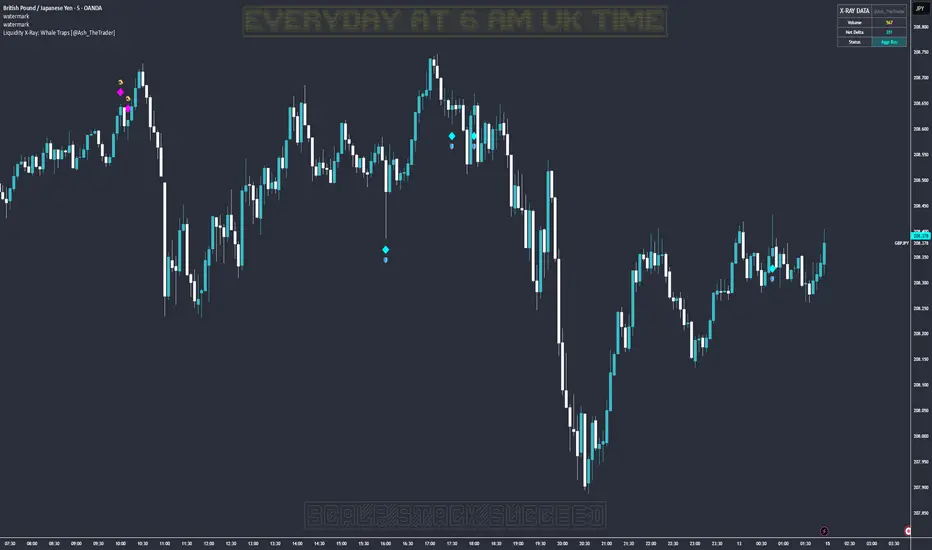
Liquidity X-Ray: Whale Traps [@Ash_TheTrader]👁️ Liquidity X-Ray: The Institutional Edge
Stop Trading Blind. See Inside the Candle.
Ninety percent of retail traders only see the outer shell of a candlestick—the Open, High, Low, and Close. They are trading blind to the actual battle that took place during that candle's formation.
Institutions, however, use expensive Order Flow software to see where aggressive buying or selling is happening in real-time.
The Liquidity X-Ray Strategy, developed by @Ash_TheTrader, levels the playing field. It uses advanced Intrabar Analysis to simulate institutional order flow footprints directly on your TradingView chart, automating powerful reversal signals based on "Absorption."
🧠 The Concept: Intrabar Analysis & Delta
How does it work?
Imagine a single 1-Hour candle. Inside that candle, there are sixty 1-Minute candles hidden from view.
This strategy performs an "X-Ray" scan. It tunnels into the lower timeframes (e.g., 5-minute data inside a 1-hour bar) to calculate the Net Delta—the difference between aggressive buying volume and aggressive selling volume.
Cyan Candles: Indicate that aggressive buyers (hitting the Ask) won the internal battle.
Magenta Candles: Indicate that aggressive sellers (hitting the Bid) won the internal battle.
But knowing who won isn't enough. The real edge comes from identifying Absorption.
🎯 The Signals: Detecting Traps & Shields
The core philosophy of this strategy by @Ash_TheTrader is simple: Identify where high effort yields low results.
When massive volume comes in, but price refuses to move, it means one side is being "absorbed" by a larger player. This is often the precursor to a violent reversal.
1. The Bear Trap (🪤)
What you see: A candle with massive volume and aggressive internal buying (positive Delta), yet the candle body remains small and fails to push price significantly higher.
The Psychology: Retail traders are FOMO-buying aggressively at a high. Institutional "Whales" are sitting on the other side, passively selling into this demand, absorbing all the buy orders without letting price rise.
The Result: Once the buyers are exhausted, the trap snaps shut, and price reverses downward.
Strategy Action: Enters a SHORT position.
2. The Bull Shield (🛡️)
What you see: A candle with massive volume and aggressive internal selling (negative Delta), yet the candle body remains small and fails to push price lower.
The Psychology: A "Stop Run" is occurring. Retail traders are panic-selling. Smart money is stepping in like a shield, absorbing all the sell pressure at a fixed level.
The Result: Once the sellers are exhausted, there is no one left to sell, and price rallies upward.
Strategy Action: Enters a LONG position.
⚡ Strategy Features & The Viral Dashboard
This isn't just an indicator; it's a complete, automated trading system.
Automated Execution: The script takes the trades for you when a Shield or Trap is confirmed upon candle close.
Smart Risk Management: It automatically places Stop Losses beyond the wick of the signal candle and targets a default 2:1 Risk/Reward ratio.
The Live Performance Panel: Look at the top right of your chart. The strategy features a built-in, professional-grade dashboard that displays real-time statistics. You can instantly see the strategy's Win Rate and Net Profit over the current historical data.
"Numbers don't lie. Don't just guess if a setup works; watch the win rate adjust in real-time." — @Ash_TheTrader
🛠️ How to Use This Strategy
For the best results, follow these institutional guidelines:
Timeframe: This strategy is most effective on Higher Timeframes where institutional volume is dominant. We recommend the 1-Hour (1H) or 4-Hour (4H) charts.
Intrabar Resolution (Settings): In the strategy settings, ensure the "Intrabar Resolution" is set lower than your chart timeframe. The default is 5 minutes, which is ideal for scanning inside 1H or 4H candles.
Confluence: While the strategy can be traded standalone, the best signals often occur near major support/resistance zones or key Fibonacci levels.
⚠️ Disclaimer
This strategy uses request.security_lower_tf to perform its calculations. While highly accurate, past performance on the dashboard does not guarantee future results. Always manage your risk responsibly.
Trade smart. See the liquidity.
~ @Ash_TheTrader
Liquidity Channels [TFO]This indicator was built to visually demonstrate the significance of major, untouched pivots. With traders commonly placing orders at or near significant pivots, these areas are commonly referred to as Resting Liquidity. If we attribute some factor of growth over time, we can quickly visualize that certain pivots originated much further away than others, if their channels appear larger.
A pivot in this case is validated by the Liquidity Strength parameter. If set to 50 for example, then a pivot high is validated if its high is greater than the high of the 50 bars to the left and right of itself. This also implies a delay in finding pivots, as the drawings won't actually appear until validation, which would occur 50 bars after the original high has formed in this case. This is typical of indicators using swing highs and lows, as one must wait some period of time to validate the pivots in question.
The Channel Growth parameter dictates how much the Liquidity Channels will expand over time. The following chart is an example, where the left-hand side is using a Channel Growth of 1, and the right-hand side is using a Channel Growth of 10.
When price reaches these levels, they become invalidated and will stop extending to the right. The other condition for invalidation is the Delete After (Bars) parameter which, when enabled, declares that untouched levels will be deleted if the distance from their origin exceeds this many bars.
This indicator also offers an option to Hide Expanding Channels for those who just want the actual levels on their chart, without the extra visuals, which would look something like the below chart.

Liquidity ToolkitKey Points:
Liquidity Toolkit is your liquidity companion for monitoring and anticipating price action.
Liquidity Toolkit combined the power of the Liquidity Status indicator with the potency of Price Triggers.
Liquidity Status indicates if the current current liquidity environment is bullish or bearish.
Price triggers highlight price levels where supports, resistances, and trend-changes are likely to occur.
Together, they create a comprehensive and actionable view of the market.
Summary
The Liquidity Toolkit (TK) is designed as a one-stop-shop indicator by combining novel liquidity metrics with traditional and impactful price measurements. In combination, TK grants unparalleled views of the market through effective yet simple displays.
The TK indicator contains two separate by synergistic algorithms: the Liquidity Status algorithm, which measures liquidity to determine if outlooks are bearish or bullish; and the Price Triggers algorithm which analyzes price-action to determine points of support and resistances.
Example 1 :
Example 2 :
Example 3 :
Details
Liquidity Status
Liquidity Status (LS) measures liquidity and produces either `Bullish` or `Bearish` indications depending on the current liquidity status.
Bullish indications indicate that the overall flow of liquidity is supportive of bullish price and bearish indications indicate that the overall flow of liquidity is supportive of bearish price action.
LS is displayed in two ways:
Candle-Coloring: if candles are green, liquidity status is bullish and if candles are red, liquidity status is bearish.
Text Display: Bearish and/or Bullish is displayed via text as well.
Price Triggers
Price Triggers (PT) measure price action and report their findings on several timeframes:
1-Minute
5-Minute
60-Minute
1-Day
1-Week
TK graphs the PTs based on the chart interval – only the higher PTs are display (i.e.: On the 1-Hour chart, the 5-, and 1-Min PTs will not be displayed).
Example 4
In additional to showing price-levels of support and resistance, Price Triggers also display the relative strength of these supports and resistances by displaying the Trigger Strengths. These represent areas of influence.
Opportunities often arise when PTs squeeze each other, often forcing spot to make a large move – as can be seen below:
Example 5
Frequently Asked Questions
How can I get access to the Liquidity Toolkit?
Please see the Author’s Instructions section at the top of the page for more details and information.
How can I get additional information on the indicators used?
Please see the Author’s Instructions section at the top of the page for more details and information.
I added the Liquidity Toolkit but I do not see all of the PT lines – where are they?
Depending on the chart interval, not all PT lines will be displayed. Those lower than the chart’s timeframe are hidden for clarity.
I added Liquidity Toolkit but the chart’s candles are not being filled by LS.
The chart will try to color over LS’ candles if you do not disable them. To disable, go to the Chart Settings then to Symbol and de-select Body, Borders and Wick.

Liquidity Spectrum Visualizer [BigBeluga]🔵 OVERVIEW
The Liquidity Spectrum Visualizer is a smart tool for exposing hidden liquidity zones by combining a dynamic volume profile, clear liquidity levels, and intuitive volume bubbles directly on your price chart. It shows you exactly where significant volume is clustering inside your chosen lookback period — highlighting where big market participants may be defending price or planning breakouts.
🔵 CONCEPTS
Volume Profile Bins: Breaks your custom lookback range into 100 fine price bins, calculating total volume per bin to create a precise vertical liquidity histogram.
Liquidity Levels: Bins with high relative volume automatically plot as horizontal lines — thicker and brighter lines signal stronger liquidity concentrations.
Dynamic Coloring: Profile bins and liquidity levels adjust their colors live based on whether current price is trading above (support) or below (resistance).
Volume Bubbles: Each candle displays a bubble at its HLC3 price —
- The bubble’s size shows relative candle volume.
- Its color gradient indicates bullish or bearish volume: greenish for bullish candles, orange for bearish.
Bubble Labels: The largest bubbles automatically label the actual volume amount, revealing big hidden flows.
Range Box High/Low: Marks the absolute swing high and low inside the lookback window, clearly framing the active liquidity zone.
🔵 FEATURES
Smart, auto-scaled volume profile up to 200 candles (or custom).
Liquidity levels with dynamic thickness and color based on real-time volume.
Bubbles sized and colored to show both volume magnitude and bullish/bearish bias.
Largest bubbles labeled for fast detection of high-impact bars.
High and low price labels clearly show the analyzed range.
Toggle Volume Profile, Liquidity Levels, and Bubbles independently.
🔵 HOW TO USE
Watch for thick, bright liquidity levels — these zones mark where large orders or stop clusters are likely hidden.
Use dynamic coloring: if price is above a level, it’s support; if below, it’s resistance.
Pay special attention to big bubbles: these mark sudden spikes in traded volume and can signal absorption, traps, breakouts or significant price levels.
Combine with your existing confluence tools to confirm breakouts or fakeouts around visible liquidity clusters.
🔵 CONCLUSION
The Liquidity Spectrum Visualizer transforms hidden order flow into an intuitive, color-coded map. You see at a glance where price is absorbing, consolidating, or ready to break — all powered by real-time volume behavior and smart visuals. It’s a must-have tool for traders who want to read liquidity and react ahead of the crowd.

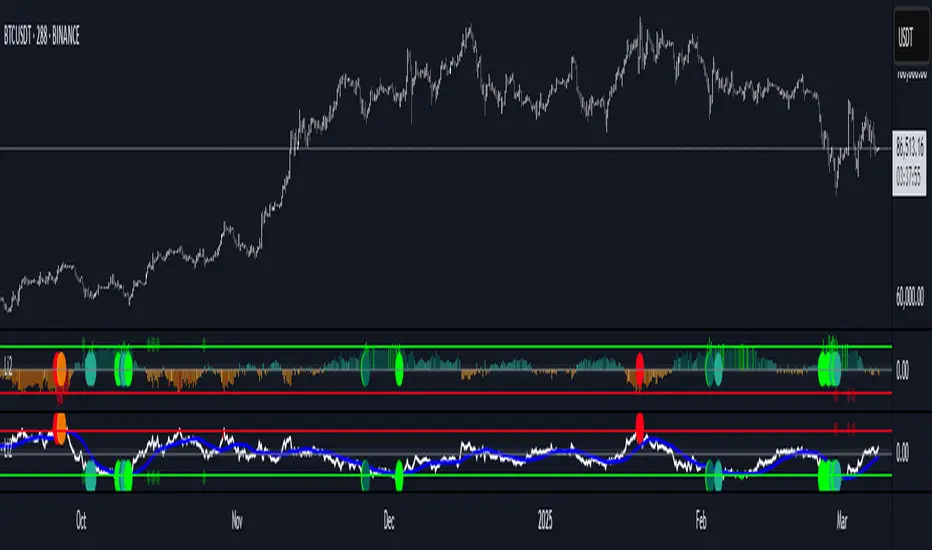
Liquidity Imbalance Index (Li2)How to Use the Liquidity Imbalance Index (Li2)
The Liquidity Imbalance Index (Li2) is designed to track market liquidity and identify significant imbalances between buyers and sellers. Here's how to effectively use this indicator in your trading:
Understanding the Main Components
1. Liquidity Delta Histogram/Line:
- Shows the difference between buy and sell liquidity
- Green bars/line: Buying pressure dominates
- Red bars/line: Selling pressure dominates
- The intensity of color shows the strength of the imbalance
2. Threshold Lines:
- Upper (green) threshold: Marks significant buy pressure
- Lower (red) threshold: Marks significant sell pressure
- Neutral zone: Area between the dotted lines where neither buyers nor sellers dominate
3. Liquidity Zones (circles shown on top/bottom):
- Green circles on upper threshold: Historical bull zones (significant buying interest)
- Red circles on lower threshold: Historical bear zones (significant selling interest)
- These zones require multiple hits, consecutive signals, and optionally volume confirmation
Trading Strategies
For Trend Trading
1. Look for when the Liquidity Delta crosses above the upper threshold for bullish signals
2. Look for when the Liquidity Delta crosses below the lower threshold for bearish signals
3. Especially powerful when crossing occurs with acceleration (darker histogram colors)
For Support and Resistance
1. Identify where the significant bull/bear zones appear (green/red circles)
2. These often align with important price levels where orders cluster
3. Use these zones as potential reversal or confirmation points
For Divergence
1. Watch for price making new highs/lows while liquidity shows the opposite
2. Divergence between price and liquidity can signal potential reversals
Volume Confirmation
1. Pay attention to volume-confirmed signals (small circles at zero line)
2. These indicate stronger conviction behind the liquidity imbalance
Optimal Settings
- For day trading or volatile markets, consider reducing lookback periods and increasing thresholds
- For swing trading, the default settings work well to capture significant zones
- In ranging markets, focus on the zones as they often mark the range boundaries
- In trending markets, follow the overall direction of the liquidity delta
Reading Acceleration Signals
The indicator shows color intensity variations to highlight acceleration in liquidity flows:
- Dark green/red: Strong acceleration (rapid shift in order flow)
- Medium green/red: Medium acceleration
- Light green/red: Weak acceleration
These acceleration signals often precede significant price movements.
Liquidity Location Detector [BigBeluga]
This indicator helps traders identify potential liquidity zones by detecting significant volume levels at key highs and lows. By using color intensity and scoring numbers, it visually highlights areas where liquidity concentration may be highest while incorporating trend analysis through EMAs.
🔵Key Features:
Liquidity Zone Detection: Automatically detects and marks areas where significant volume has accumulated at swing highs and lows.
Dynamic Box Plotting: Draws liquidity boxes at key highs and lows, updating based on market conditions.
Volume Strength Scaling: Uses a scoring system to rank liquidity zones, helping traders identify the strongest areas.
Color Intensity for Volume Strength: More transperent color indicate less liquidity, while less transperent represent stronger volume concentrations.
Customizable Display: Users can adjust the number of displayed liquidity zones and modify colors to suit their trading style.
Real-Time Liquidity Adaptation: As price interacts with liquidity zones, the indicator updates dynamically to reflect changing market conditions.
Auto-Stopping Liquidity Zones: Liquidity boxes automatically stop extending to the right once price crosses them, preventing outdated zones from interfering with live market action.
Trend Analysis with EMAs: Includes two optional EMAs (fast and slow) to help traders analyze market trends. Users can enable or disable these EMAs in the settings and use crossover signals for trend confirmation.
🔵Usage:
Identify Key Liquidity Areas: Use color intensity and transparency levels to determine high-impact liquidity zones.
Support & Resistance Confirmation: Liquidity zones can act as potential support and resistance levels, enhancing trade decision-making.
Market Structure Analysis: Observe how price interacts with liquidity to anticipate breakout or reversal points.
Scalping & Swing Trading: Works for both short-term and long-term traders looking for liquidity-based trade setups.
Liquidation Map Insight: A liquidity map highlights areas where large amounts of leveraged positions (both long and short) are likely to get liquidated. Since many traders use leverage, sharp price movements can trigger a cascade of liquidations, leading to rapid price surges or drops. Monitoring these liquidity zones and trends helps traders anticipate where price might react strongly.
Liquidity Location Detector is an essential tool for traders seeking to map out potential liquidity zones, providing deeper insights into market structure and trading volume dynamics.

Liquidity Pools [LuxAlgo]The Liquidity Pools indicator identifies and displays estimated liquidity pools on the chart by analyzing high and low wicked price areas, along with the amount, and frequency of visits to each zone.
🔶 USAGE
Liquidity Pools are areas where smaller participants are likely to place stop-limit orders to manage risks at reasonable swing points. These zones attract institutional traders who use the pending orders as liquidity to enter larger positions, aiming to influence price movements. By monitoring these zones, traders can anticipate market movements and potentially benefit from these dynamics.
Beyond general liquidity theory, identifying zones consistently visited by price aids in using them as support and resistance zones. By analyzing these areas, we can assess how effectively participants enter or exit these zones, helping to gauge their importance.
In the screenshots below, we will explore both sides of the same chart in more detail to display how each zone could be viewed from a bullish and bearish perspective.
Bullish Zones Example:
Bearish Zones Example:
🔶 DETAILS
The method behind this indicator focuses on identifying a swing point and tracking future interactions with it. It adaptively identifies high and low "potential zones". These zones are monitored over time; if a zone meets the user-defined criteria, the script marks and displays these zones on the chart.
🔹 Identification
The method to identify Liquidity Pools in this indicator revolves around 3 main parameters. By utilizing these settings, the indicator can be tailored to produce zones that fit the specific strategic needs of each trader.
Zone Identification Parameters
Zone Contact Amount: This setting determines the number of times each zone must be in contact with the price (and bought or sold out of) before being identified by the indicator as a Liquidity Pool.
For example: When a zone is first displayed, it is considered as having been reached 1 time. When the zone is re-tested for the first time, this is considered the 2nd contact, since the price has seen the zone a total of 2 times.
Bars Required Between Each Contact: This is used to rule out (or in) consecutive candles reaching each zone from the calculation, adding a separation length between zone contact points to refine the zones produced.
For example: When set to "2", the first contact point (first re-test) will be ignored by the script if it is not at least 2 bars away from the initial zone proposal point.
Confirmation Bars: After a zone has reached the desired Contact Amount, this setting will cause the script to wait a specified number of bars before identifying a zone. While this might initially seem counterintuitive, by waiting, we are able to watch the market's reaction to the proposed zone and respond accordingly. If the price were to continue through the potential liquidity zone Immediately, it would not be logical to consider this area as a valid Liquidity Pool.
Displayed in this screenshot, you will see the specific points we are looking for in order to identify these zones.
🔹 Display
After a Liquidity Pool is identified, its boundary line is extended to the current price to keep it in view for reference. This extension will continue until the zone is mitigated (price has closed above or below the zone), after which it will stop extending.
Candles can optionally be colored when returning to the most recent Liquidity Pool if it is still unmitigated, and will only color after the zone is displayed on the chart. Because of this, if a candle is colored within a zone, then its color comes from being inside a previously unmitigated zone.
🔹 Volume
Each time a candle overlaps an Unmitigated Zone, a percentage of its volume will be accumulated to the total for each specific zone. The volume total is displayed on the right end of the extended boundary lines.
This volume data could help to determine the importance of specific zones based on the amount of volume traded within.
Note: This volume is fractional to the percentage of candles that are contained within the zone. If a candle is 50% within a zone, The zone will receive 50% of the candle's volume added to its current total.
🔶 SETTINGS
See above for a more detailed explanation of the "Zone Identification" parameters.
Zone Contact Amount: The number of times the price must bounce from this zone before considering it as a liquidity pool.
Bars Required Between Each Contact: The number of bars to wait before checking for another zone contact.
Confirmation Bars: The number of bars to wait before identifying a zone to confirm validity.
Display Volume Labels: Toggles the display for the volume readout for each Liquidity Pool.
Fill Candles Inside Zones: Toggles the display of colored candles within Liquidity Pools.
Liquidity VisualizerThe "Liquidity Visualizer" indicator is designed to help traders visualize potential areas of liquidity on a price chart. In trading, liquidity often accumulates around key levels where market participants have placed their stop orders or pending orders. These levels are commonly found at significant highs and lows, where traders tend to set their stop-losses or take-profit orders. The indicator aims to highlight these areas by drawing unbroken lines that extend indefinitely until breached by the price action.
Specifically, this indicator identifies and marks pivot highs and pivot lows, which are price levels where a trend changes direction. When a pivot high or pivot low is formed, it is represented on the chart with a horizontal line that continues to extend until the price touches or surpasses that level. The line remains in place as long as the level remains unbroken, which means there is potential liquidity still resting at that level.
The concept behind this indicator is that liquidity is likely to be resting at unbroken pivot points. These levels are areas where stop-loss orders or pending buy/sell orders may have accumulated, making them attractive zones for large market participants, such as institutions, to target. By visualizing these unbroken levels, traders can gain insight into where liquidity might be concentrated and where potential price reversals or significant movements could occur as liquidity is taken out.
The indicator helps traders make more informed decisions by showing them key price levels that may attract significant market activity. For instance, if a trader sees multiple unbroken pivot high lines above the current price, they might infer that there is a cluster of liquidity in that area, which could lead to a price spike as those levels are breached. Similarly, unbroken pivot lows may indicate areas where downside liquidity is concentrated.
In summary, this indicator acts as a "liquidity visualizer," providing traders with a clear, visual representation of potential liquidity resting at significant pivot points. This information can be valuable for understanding where price might be drawn to, and where large movements might occur as liquidity is targeted and removed by market participants.

Liquidity Founder The Liquidity Swings indicator aids traders in detecting liquidity swings within the market, providing essential insights for making well-informed trading decisions. Key features include:
How this Indicator work - this indicator search pivot point that is used to determine the levels at which price may face support or resistance. The Pivot Points indicator consists of a pivot point (PP) level and several support (S) and resistance (R) levels. if input number of bar selected 3 than it will look back 3 candle and wait for next 3 candle to make pivot high and low after it identify pivot it draw a line and extend until it no longer intersects with the high or low prices
What is different in my indicator compared to a normal pivot point and what Makes This Indicator Original :
1) Swing High and Low Logic:It avoids marking consecutive pivot highs until a new pivot low is formed, reducing market noise and highlighting significant trend reversals.
2)Volume Integration: By incorporating volume data, the indicator ensures that pivot points are validated with sufficient market activity, enhancing their reliability as support and resistance levels.
3) Multi-Time Frame Analysis:The ability to input and analyze multiple time frames allows the indicator to draw strong support and resistance levels that are relevant across different trading periods, making it versatile for various trading strategies.
🟠 Liquidity Swings indicator
✅Visualization of Liquidity Zones:Accumulation Areas: Identifying regions where liquidity is gathering.liquidity Sweeps: Pinpointing areas where liquidity is being cleared.
✅Pivot and Volume Analysis:Price Pivots: Monitoring significant pivots in price.
Volume Correlation: Linking price pivots with volume to highlight zones of potential support and resistance.
✅Market Dynamics Understanding:Enables traders to visualize and understand market dynamics more effectively.Assists in pinpointing potential support and resistance levels based on liquidity swings.
⭐Example -EurUsd 1 minutes chart developed Potential Support and Resistance Zone
⭐⭐⭐Key Features:
1) Adjustable Time Frame: Allows traders to analyze different periods by modifying the time frame setting.
2) Swing Look back Period: Sets the period for identifying potential price swings, enhancing flexibility in analysis.
🟠 Understanding Strong Support :These are identified by dense clusters of green lines, indicating high concentrations of buy orders that have not yet been executed. These areas suggest strong buying interest which can potentially halt further price declines.
⭐ Example -below chart image BtcUsd 5 minutes 2 line are still not touched by price
⭐⭐⭐Reasons for Strong Support:
✅Untouched Liquidity Lines: These green lines represent pending buy orders, indicating robust buying interest at these levels.
✅Accumulation of Orders: Many buy orders are aggregated in these zones, capable of preventing further price drops when approached.
✅ Historical Performance: These areas have previously prevented price declines, establishing them as reliable support zones.
✅ Market Confidence: Close clustering of green lines signifies widespread trader belief in favorable buying conditions, reinforcing support strength.
🟠 Understanding Strong Resistance :Highlighted by dense clusters of red lines, denoting substantial sell orders that did not executed. These zones signify significant selling interest which can impede further price increases.
⭐ Example -below chart image Btcusd 3 minutes 3 line did touched by price previously .price touched that area and retraced because of unfilled liquidity
⭐⭐⭐ Reasons for Strong Support:
✅ Untouched Liquidity Lines: These green lines represent pending buy orders, indicating robust buying interest at these levels.
✅ Accumulation of Orders: Many buy orders are aggregated in these zones, capable of preventing further price drops when approached.
✅ Historical Performance: These areas have previously prevented price declines, establishing them as reliable support zones.
✅ Market Confidence: Close clustering of green lines signifies widespread trader belief in favorable buying conditions, reinforcing support strength.
⭐⭐⭐ Usage of the Liquidity Founder Indicator ⭐⭐⭐
👍 Identifying Liquidity Zones: Pinpoints areas with dense clusters of pending buy (green) or sell (red) orders, providing initial entry points where significant buying or selling interest is concentrated.
👍 Avoiding Market Traps: Helps traders steer clear of market fluctuations or false breakouts by focusing on stable liquidity zones.
How to Use this indicator for Maximum benefit -
1) When the price approaches a cluster of resistance levels, traders should look for a candle showing rejection (e.g., a bearish reversal candle) to enter a short trade.
2)When the price approaches a cluster of support levels, traders should look for a candle showing rejection (e.g., a bullish reversal candle) to enter a long trade.
3) The identified liquidity levels offer a clear understanding of significant support and resistance areas, helping traders make more informed trading decisions.
4) Fake breakouts above resistance or below support clusters. If the price breaks above resistance and then falls back below, it can be a signal to enter a short trade vice versa if price break support cluster and back again above support cluster it can be a long trade

Liquidity Concepts [BigBeluga]The Liquidity Concepts indicator is designed to represent the liquidity on the chart using pivot points as potential stop-losses / liquidity grabs.
The indicator is facilitated by a market structure detector and pivot points to identify resting liquidity / stop-loss levels.
A liquidity grab or a stop-loss hunt is when retail traders place their stop-loss orders at recent highs / most recent highs or lows. This is a spot where big players attempt to push the market to trigger all the stop-loss orders and gain a better entry in their favor.
🔶 CALCULATION
The indicator uses the Higher Lower script made by @LonesomeTheBlue to determine these pivot points. When a pivot point is formed, it is displayed on the chart with the corresponding symbol (HH - HL - LH - LL). When one of these points is broken, a line is drawn between the pivot point and the candle that broke it.
A liquidity grab is only recognized after it has occurred, and it is represented with a box showing all the candles that were involved in the sweep / stop-loss hunt.
A pivot point is established only after the selected lookback period and cannot be printed beforehand in any manner. This ensures that it captures the highest point within the lookback period following the candle formation.
An HL (Higher Low) point is established when it is lower than an HH (Higher High) point, whereas an LH (Lower High) point is established when it is higher than an LL (Lower Low) point.
Boxes are formed in two different types: Major and Minor.
- Major boxes occur when LH or HL points are breached, with their high or low point crossing above or below in the specific lookback period.
- Minor boxes occur when HH or LL points are breached, with their high or low point crossing above or below in the specific lookback period.
Minor points are less efficient since they represent key highs and lows, and before taking out those liquidity levels, the HL and LH points should be cleared.
Representation of Pivot Point Formation:
Liquidity wicks are a minor representation of a stop-loss hunt during the retracement of a pivot point. This means that a pivot point is broken only by the wick and not by the entire body.
Bigger wick = more liquidity
Lower wick = less liquidity
Liquidity wicks can be used as trade confirmation or targets for your entry to enhance accuracy.
Users have the option to display candle coloring based on the currently detected trend.
🔶 VERIFICATION
Users have the option to specify the verification length for when the liquidity should occur. This means that if the length is set to 7, the indicator will search for the liquidity formation within the last 7 candles; otherwise, it will be considered invalid.
🔶 CONCEPTS
The whole idea is to help find possible zone of stop loss hunting helping having a better entry in our trading, we can utilize a lot more tools, and this shoud be used as confluence only
🔶 OPTIONS
Users have complete control over the settings, allowing them to:
- Disable pivot points.
- Disable the display of boxes.
- Disable liquidity wicks.
- Customize colors to their preferences.
- Adjust lookback settings for historical data analysis.
- Modify candle coloring settings.
- Adjust the text size of labels for better readability and customization.
🔶 RECAP
Box => Represents liquidity formation / stop-loss hunt
- Minor Box HH / LL point
- Major Box LH / HL point
Liquidity Wicks => Formed when a pivot point is broken only by the wick
BOS / CHoCH => Calculated using the pivot points from the @LonesomeTheBlue script
🔶 RELATED SCRIPTS
Price Action Concepts =>
