Donchian Channel - Pivot High-LowCombining Pivot High Low and Donchian Channel - both of which are useful indicators for trend following.
Donchian Channel shows highest and lowest prices for X number of bars.
Pivot High-Low identifies when price made new Highs and Lows
Applying Donchian Channel on Pivot High-Low channel, we are plotting highest and lowest pivots formed in X bars.
In this indicator, we have 3 options for Channel Base :
Price : This is regular Donchian channel based on High-Low Price
Pivots : This is Donchian channel based on pivot points.
Combined : Combines both. Takes highest of Price and Pivots for plotting high, lowest of Price and Pivots for plotting low
חפש סקריפטים עבור "low"

Shapeshifting Moving Average - Switching From Low-Lag To SmoothThe term "shapeshifting" is more appropriate when used with something with a shape that isn't supposed to change, this is not the case of a moving average whose shape can be altered by the length setting or even by an external factor in the case of adaptive moving averages, but i'll stick with it since it describe the purpose of the proposed moving average pretty well.
In the case of moving averages based on convolution, their properties are fully described by the moving average kernel ( set of weights ), smooth moving averages tend to have a symmetrical bell shaped kernel, while low lag moving averages have negative weights. One of the few moving averages that would let the user alter the shape of its kernel is the Arnaud Legoux moving average, which convolve the input signal with a parametric gaussian function in which the center and width can be changed by the user, however this moving average is not a low-lagging one, as the weights don't include negative values.
Other moving averages where the user can change the kernel from user settings where already presented, i posted a lot of them, but they only focused on letting the user decrease or increase the lag of the moving average, and didn't included specific parameters controlling its smoothness. This is why the shapeshifting moving average is proposed, this parametric moving average will let the user switch from a smooth moving average to a low-lagging one while controlling the amount of lag of the moving average.
Settings/Kernel Interaction
Note that it could be possible to design a specific kernel function in order to provide a more efficient approach to today goal, but the original indicator was a simple low-lag moving average based on a modification of the second derivative of the arc tangent function and because i judged the indicator a bit boring i decided to include this parametric particularity.
As said the moving average "kernel", who refer to the set of weights used by the moving average, is based on a modification of the second derivative of the arc tangent function, the arc tangent function has a "S" shaped curve, "S" shaped functions are called sigmoid functions, the first derivative of a sigmoid function is bell shaped, which is extremely nice in order to design smooth moving averages, the second derivative of a sigmoid function produce a "sinusoid" like shape ( i don't have english words to describe such shape, let me know if you have an idea ) and is great to design bandpass filters.
We modify this 2nd derivative in order to have a decreasing function with negative values near the end, and we end up with:
The function is parametric, and the user can change it ( thus changing the properties of the moving average ) by using the settings, for example an higher power value would reduce the lag of the moving average while increasing overshoots. When power < 3 the moving average can act as a slow moving average in a moving average crossover system, as weights would not include negative values.
Here power = 0 and length = 50. The shapeshifting moving average can approximate a simple moving average with very low power values, as this would make the kernel approximate a rectangular function, however this is only a curiosity and not something you should do.
As A Smooth Moving Average
“So smooth, and so tranquil. It doesn't get any quieter than this”
A smooth moving average kernel should be : symmetrical, not to width and not to sharp, bell shaped curve are often appropriates, the proposed moving average kernel can be symmetrical and can return extremely smooth results. I will use the Blackman filter as comparison.
The smooth version of the moving average can be used when the "smooth" setting is selected. Here power can only be an even number, if power is odd, power will be equal to the nearest lowest even number. When power = 0, the kernel is simply a parabola:
More smoothness can be achieved by using power = 2
In red the shapeshifting moving average, in green a Blackman filter of both length = 100. Higher values of power will create lower negative values near the border of the kernel shape, this often allow to retain information about the peaks and valleys in the input signal. Power = 6 approximate the Blackman filter pretty well.
Conclusion
A moving average using a modification of the 2nd derivative of the arc tangent function as kernel has been presented, the kernel is parametric and allow the user to switch from a low-lag moving average where the lag can be increased/decreased to a really smooth moving average.
As you can see once you get familiar with a function shape, you can know what would be the characteristics of a moving average using it as kernel, this is where you start getting intimate with moving averages.
On a side note, have you noticed that the views counter in posted ideas/indicators has been removed ? This is truly a marvelous idea don't you think ?
Thanks for reading !

Ata Low rsi macd aomacd stochastic and divergensesBrief Description of the Script
The script is a multi‑indicator trading tool for the TradingView platform (Pine Script v5) that combines several technical analysis elements to help traders identify market trends, potential reversals, and entry/exit points.
эту версию скрипта не обновляю. для получения обновлений в лс.
Key features:
Multiple Oscillators
The user can select one of four oscillators to display:
RSI (Relative Strength Index) — identifies overbought/oversold conditions;
Stoch (Stochastic Oscillator) — detects potential reversals via %K and %D line interactions;
MACD (Moving Average Convergence/Divergence) — shows trend direction and momentum shifts;
AO+MACD — combines Awesome Oscillator (AO) for momentum with MACD for trend confirmation.
Divergence Detection
Identifies four types of price‑oscillator divergences:
Bullish regular (price lows vs. higher oscillator lows);
Bullish hidden (higher price lows vs. lower oscillator lows);
Bearish regular (price highs vs. lower oscillator highs);
Bearish hidden (lower price highs vs. higher oscillator highs).
Divergences are marked on the chart with labels and lines.
Customizable Parameters
Users can adjust:
Oscillator periods (e.g., RSI length, Stoch K/D smoothing, MACD fast/slow/signal lengths);
Source prices (close, high, low, etc.);
Visual settings (colors, line widths, label styles);
Divergence sensitivity (minimum bars between swing points).
Trend and Volatility Analysis
EMA crossover (fast/slow) to determine trend direction;
ATR‑based volatility score (1–5 scale);
RSI‑derived trend strength (1–50 scale);
ADX filter to confirm trend strength (>20).
Additional Signals
Awesome Oscillator “Tea Saucer” patterns for potential long/short entries;
Fibonacci‑Bollinger bands to spot price deviations and reversal zones;
Volume filter to confirm reversals;
Session timing table (optional) showing active/upcoming market sessions (Asia, London, NYSE, etc.).
Visual Outputs
Plots for selected oscillator (RSI, Stoch, MACD, or AO);
Shaded zones (e.g., RSI overbought/oversold areas);
Divergence lines and labels (color‑coded by type);
Reversal “circles” (blue for bullish, red for bearish);
Summary label with trend direction, volatility, and strength;
Optional session timing table.
Purpose:
To provide a comprehensive view of market momentum, trend, and potential reversal setups by combining oscillator crossovers, divergences, volatility, volume, and session context — helping traders time entries and exits across multiple timeframes.

Swing High/Low Support ResistanceThis indicator detects recent swing highs and swing lows using Pine Script pivots and marks them with visible chart labels. These points highlight potential turning areas in price action and can help identify short-term support or resistance for intraday or swing trading.
How to Apply
Locate the indicator in TradingView’s “Indicators” library; search by its name or author.
Click the star icon to mark it as a favourite for quick future access.
Apply directly to your chosen chart and timeframe with a single click—no need to enter or paste code.
Adjust the input parameters from the settings panel if desired to personalize swing sensitivity.
Choose Your Timeframe:
Apply to any intraday or swing timeframe; shorter lengths show more frequent pivots.
Set Sensitivity:
Use the “Swing Detection Length” input to adjust how many bars define a pivot, making swings more or less sensitive to price action.
How to Analyze
Swing High Labels: Mark recent local peaks, suggesting resistance zones or possible reversal points.
Swing Low Labels: Highlight recent bottoms, indicating support or bounce areas.
Monitor labels for clustering or repeated appearance at similar levels, which may strengthen their importance as price reacts near those points.
Track how price behaves after forming new pivots—multiple tests can affirm the relevance of a level.
What Traders Should Watch
Price reaction at labeled areas: frequent tests may anticipate reversals or breakouts.
Transition between higher highs/higher lows (uptrend) vs. lower highs/lower lows (downtrend).
Combine the swing levels with other analysis methods, such as volume, RSI, or EMA, for better signal quality.
Features Included
Dynamic swing high and low detection via confirmed pivots.
Direct labeling on the chart for market structure clarity.
No repainting—labels show only after complete formation.
Fully automatic updates as price action unfolds.
No promotional, external, or non-compliant elements; open source and safe for public or private use.
Compliance Notes
No signals, buy/sell calls, financial advice, or performance claims.
No hidden code, advertising, or off-platform contacts.
Pure educational and analytical utility; adheres to all TradingView house rules and script publishing policies.
Disclaimer
This indicator is for informational purposes only and does not constitute advice. Always do your own research and use proper risk management.

6am Candle High/Low Indicator with Highlight6am Candle High/Low Indicator with Highlight
6am Candle High/Low Indicator with Highlight
6am Candle High/Low Indicator with Highlight
6am Candle High/Low Indicator with Highlight 6am Candle High/Low Indicator with Highlight

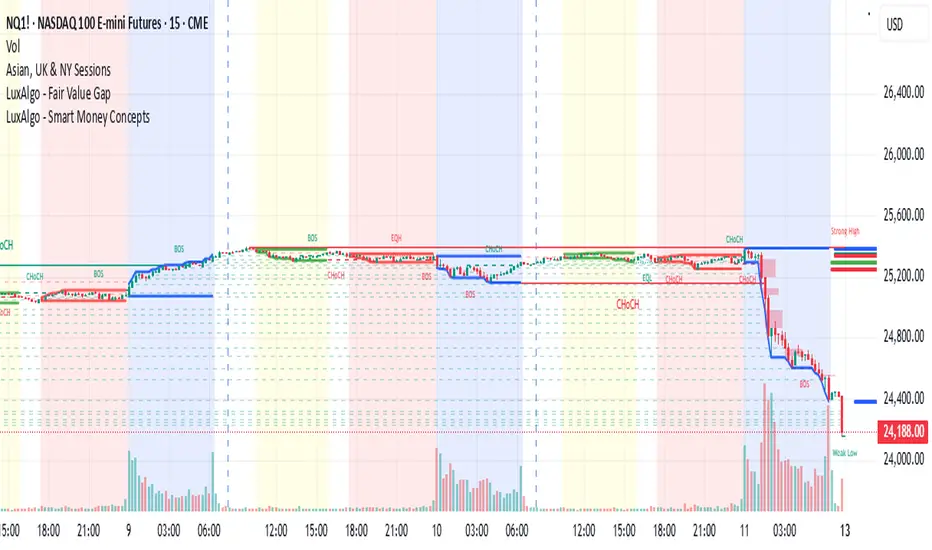
Asian, UK & NY SessionTimes and Day Highs and LowsWhat It Does
The Asian, UK & NY Sessions indicator automatically identifies and highlights the three major global trading sessions on your chart.
For each session, it:
Detects session time in its local timezone.
Tracks the session’s highest and lowest prices.
Plots colored horizontal lines to show those levels throughout the trading day.
Optionally shades each session’s background in its signature color for instant visual context:
🟡 Asian Session: Yellow background
🔴 London Session: Red background
🔵 New York Session: Blue background
This helps traders see how price reacts within and between sessions — spotting overlaps, liquidity zones, and daily ranges.
⚙️ Inputs and Variables
Input Description
Extend lines until next session start (extendLines) Extends each session’s high/low lines forward until the next session begins.
Show prices in scale column (showScaleValues) Controls whether the price labels for session highs/lows appear on the chart’s right-hand price scale.
Show All Session Highs & Lows (showAllHighsLows) Master switch — turn this off to hide all session lines instantly, keeping the chart clean.
Show Session Backgrounds (showBackgrounds) Turns all background shading on or off. When off, all session colors disappear.
Background Opacity (bgOpacityAll) Adjusts the transparency for all session backgrounds (0 = solid, 100 = fully transparent).
🎨 Visual Color Scheme
Session Background High/Low Line
Asian Yellow Green
London Red Red
New York Blue Blue
Each color has a consistent role — making it easy to distinguish sessions even in replay or live view.
Price Tracking:
For each session, the indicator resets High and Low when the new session starts, then updates them as bars print.
Display Control:
If lines or backgrounds are disabled via settings, they’re completely hidden (no clutter, no partial transparency).
💡 How Traders Use It
Identify daily ranges in each global session.
Compare volatility between markets.
Align entries or exits with session transitions.
Observe how price respects previous session highs/lows.
HTF Candle Highs and Lows with Labels + High Probability Signals█ OVERVIEW
This indicator overlays Weekly, Daily, and H4 High/Low levels directly onto your chart, allowing traders to visualize key support and resistance zones from higher timeframes. It also includes high probability breakout signals that appear one candle after a confirmed breakout above or below these levels, filtered by volume and candle strength.
Use this tool to identify breakout opportunities with greater confidence and clarity.
█ FEATURES
• Plots Weekly, Daily, and H4 High and Low levels using request.security. • Customizable line colors, widths, and label sizes. • Toggle visibility for each timeframe independently. • Signals appear one candle after a confirmed breakout: • Bullish: Close above HTF High, strong candle, high volume. • Bearish: Close below HTF Low, strong candle, high volume. • Signal shapes match the color of the broken level for visual clarity.
█ HOW TO USE
1 — Enable the timeframes you want to track using the input toggles. 2 — Watch for triangle-shaped signals: • Upward triangle = Bullish breakout. • Downward triangle = Bearish breakout. 3 — Confirm the breakout: • Candle closes beyond the HTF level by at least 0.1%. • Candle body shows momentum (close > open for bullish, close < open for bearish). • Volume exceeds 20-period average. 4 — Enter trade on the candle after the signal. 5 — Use the HTF level as a reference for stop-loss placement. 6 — Combine with other indicators (e.g., RSI, EMA) for confluence.
█ LIMITATIONS
• Signals may lag by one candle due to confirmation logic. • Not optimized for low-volume assets or illiquid markets. • Best used in trending environments; avoid during consolidation. • Does not include automatic alerts (can be added manually).
█ BEST PRACTICES
• Use on H1 or higher timeframes for cleaner signals. • Avoid trading during news events or low volatility. • Backtest thoroughly before live trading. • Adjust breakout percentage and volume filter based on asset volatility. • Maintain a trading journal to track performance.

Higher High Lower Low Higher High Lower Low 🦉{Phanchai} — TradingView Description
Structure detector with dynamic Support/Resistance, customizable labels, and ready-made alerts (Pine v6).
This script marks market structure turning points — HH (Higher High), HL (Higher Low), LH (Lower High), LL (Lower Low) — and builds segmented Support/Resistance lines from those turns. Labels and colors are fully customizable and the script ships with multiple alert conditions.
What it does
Detects swing pivots using left/right bar windows, then classifies each confirmed swing as HH/HL/LH/LL.
Plots compact labels at the confirmed pivot bars with tooltips (English).
Derives dynamic Support / Resistance : every time structure flips, the previous level is closed and a new segment starts, extending to the right .
Provides alert conditions for any label and for specific first-occurrence shifts (e.g., first HH after a bearish label).
How it works (in short)
A pivot high/low confirms only after Right Bars candles have closed; labels and S/R appear at that confirmation bar.
An internal backbone (zigzag-like) is built from confirmed pivots, with light consistency checks to avoid contradictory sequences.
Structure rules compare the recent five pivots (A…E) to decide HH/HL/LH/LL.
S/R is updated from structure: e.g., in an up leg, new HLs refresh Support; in a down leg, new LHs refresh Resistance.
Alerts included
Any structure label (HH/HL/LH/LL) — Fires on any new label.
First LL after HL/HH — First bearish break after a bullish label.
First HH after LL/LH — First bullish break after a bearish label.
LL or HL formed — Any low-side label.
LH or HH formed — Any high-side label.
HL formed
HH formed
LL formed
LH formed
How to use (quick start)
Add the indicator to your chart.
Choose Left/Right Bars for your timeframe (e.g., 5–10 for intraday; larger for higher timeframes).
Pick your label colors/sizes and S/R style.
Right-click the chart → Add alert… → Condition: this indicator → select the desired alert.
Notes & tips
Because pivots require Right Bars to confirm, labels and S/R appear with a natural delay of that many bars. This avoids repainting.
Raising Left/Right Bars reduces noise and increases the average distance between pivots; lowering them increases sensitivity.
Structure is strict: sometimes you may see two HL (or two LH) in a row if the intermediate opposite swing didn’t qualify as HH/LH (or LL/HL).
S/R segments are drawn with line objects ; they are controlled via Inputs (style/width/color), not the Style tab.
This tool highlights structure; it’s not a standalone entry/exit system. Combine with volume, trend, or risk management rules.
Built with Pine v6. Clean, compact labels; segmented S/R that updates only on confirmed changes; comprehensive alerts ready for automation.

Daily High/Low (15m) + EMA Pre-Market H/L + ORBStraightforward:
I built a swing-trading indicator with ChatGPT that plots 15-minute highs and lows, draws pre-market high/low lines, and adds a 15-minute opening-range breakout feature.
Technical:
Using ChatGPT, I developed a swing-trade indicator that calculates 15-minute highs/lows, overlays pre-market high and low levels, and includes a 15-minute Opening Range Breakout (ORB) module.
Promotional:
I created a ChatGPT-powered swing-trading indicator that maps 15-minute highs/lows, marks pre-market levels, and features a 15-minute Opening Range Breakout for clearer entries.

Essa - Market Structure Crystal Ball SystemEssa - Market Structure Crystal Ball V2.0
Ever wished you had a glimpse into the market's next move? Stop guessing and start anticipating with the Market Structure Crystal Ball!
This isn't just another indicator that tells you what has happened. This is a comprehensive analysis tool that learns from historical price action to forecast the most probable future structure. It combines advanced pattern recognition with essential trading concepts to give you a unique analytical edge.
Key Features
The Predictive Engine (The Crystal Ball)
This is the core of the indicator. It doesn't just identify market structure; it predicts it.
Know the Odds: Get a real-time probability score (%) for the next structural point: Higher High (HH), Higher Low (HL), Lower Low (LL), or Lower High (LH).
Advanced Analysis: The engine considers the pattern sequence, the speed (velocity) of the move, and its size to find the most accurate historical matches.
Dynamic Learning: The indicator constantly updates its analysis as new price data comes in.
The All-in-One Dashboard
Your command center for at-a-glance information. No need to clutter your screen!
Market Phase: Instantly know if the market is in a "🚀 Strong Uptrend," "📉 Steady Downtrend," or "↔️ Consolidation."
Live Probabilities: See the updated forecasts for HH, HL, LL, and LH in a clean, easy-to-read format.
Confidence Level: The dashboard tells you how confident the algorithm is in its current prediction (Low, Medium, or High).
🎯 Dynamic Prediction Zones
Turn probabilities into actionable price areas.
Visual Targets: Based on the highest probability outcome, the indicator draws a target zone on your chart where the next structure point is likely to form.
Context-Aware: These zones are calculated using recent volatility and average swing sizes, making them adaptive to the current market conditions.
🔍 Fair Value Gap (FVG) Detector
Automatically identify and track key price imbalances.
Price Magnets: FVGs are automatically detected and drawn, acting as potential targets for price.
Smart Tracking: The indicator tracks the status of each FVG (Fresh, Partially Filled, or Filled) and uses this data to refine its predictions.
🌍 Trading Session Analysis
Never lose track of key session levels again.
Visualize Sessions: See the Asia, London, and New York sessions highlighted with colored backgrounds.
Key Levels: Automatically plots the high and low of each session, which are often critical support and resistance levels.
Breakout Alerts: Get notified when price breaks a session high or low.
📈 Multi-Timeframe (MTF) Context
Understand the bigger picture by integrating higher timeframe analysis directly onto your chart.
BOS & MSS: Automatically identifies Breaks of Structure (trend continuation) and Market Structure Shifts (potential reversals) from up to two higher timeframes.
Trade with the Trend: Align your intraday trades with the dominant trend for higher probability setups.
⚙️ How It Works in Simple Terms
1️⃣ It Learns: The indicator first identifies all the past swing points (HH, HL, LL, LH) and analyzes their characteristics (speed, size, etc.).
2️⃣ It Finds a Match: It looks at the most recent price action and searches through hundreds of historical bars to find moments that were almost identical.
3️⃣ It Analyzes the Outcome: It checks what happened next in those similar historical scenarios.
4️⃣ It Predicts: Based on that historical data, it calculates the probability of each potential outcome and presents it to you.
🚀 How to Use This Indicator in Your Trading
Confirmation Tool: Use a high probability score (e.g., >60% for a HH) to confirm your own bullish analysis before entering a trade.
Finding High-Probability Zones: Use the Prediction Zones as potential areas to take profit, or as reversal zones to watch for entries in the opposite direction.
Gauging Market Sentiment: Check the "Market Phase" on the dashboard. Avoid forcing trades when the indicator shows "😴 Low Volatility."
Confluence is Key: This indicator is incredibly powerful when combined with your existing strategy. Use it alongside supply/demand zones, moving averages, or RSI for ultimate confirmation.
We hope this tool gives you a powerful new perspective on the market. Dive into the settings to customize it to your liking!
If you find this indicator helpful, please give it a Boost 👍 and leave a comment with your feedback below! Happy trading!
Disclaimer: All predictions are probabilistic and based on historical data. Past performance is not indicative of future results. Always use proper risk management.

Enhanced 4H Candle Countdown & High/Low IndicatorBy profitgang
This Pine Script indicator provides real-time tracking of 4-hour timeframe levels with an integrated countdown timer, designed to help traders monitor key support and resistance zones.
Key Features
📊 Visual Elements
4H High/Low Lines: Clear visualization of previous 4-hour candle high and low levels
Range Fill: Subtle background fill between high and low for better context
Mid-Level Line: Shows the middle point of the 4H range
Position Indicator: Visual cue showing current price position within the range
⏰ Countdown Timer
Real-time countdown to next 4H candle close
Customizable table position (9 different locations)
Adjustable text size (6 size options from Tiny to Huge)
Distance calculations showing percentage distance from key levels
🎯 Signal Generation
Long signals when price crosses above 4H low
Short signals when price crosses below 4H high
RSI confluence filter to reduce false signals
Background highlighting for active signals
TradingView alerts compatible
⚙️ Customization Options
Toggle all features on/off independently
Custom colors for all elements
Table positioning (top/middle/bottom + left/center/right)
Text size selection for optimal readability
Alert notifications for level breaks and updates
How It Works
The indicator fetches the previous 4-hour candle's high and low values and displays them as horizontal lines on your current timeframe chart. It continuously calculates the time remaining until the current 4H candle closes and presents this information in a clean, customizable table.
Use Cases
Swing Trading: Identify key 4H support and resistance levels
Intraday Trading: Monitor when new 4H levels will be established
Risk Management: Calculate distance from key levels for position sizing
Multi-timeframe Analysis: Combine with lower timeframe setups
Educational Purpose
This indicator is designed for educational and analytical purposes to help traders understand price action relative to higher timeframe levels. It provides clear visual feedback about market structure and timing.
Settings Groups
Display Settings: Toggle features, positioning, and sizing
Colors: Customize all visual elements
Signal Settings: Configure alert conditions and confluence filters
Compatibility
Works on all timeframes (recommended for 1m to 1H charts)
Compatible with all instruments
Includes proper alert functionality for automated notifications
Optimized for both light and dark themes
This indicator does not provide financial advice. Always conduct your own research and risk management before making trading decisions.

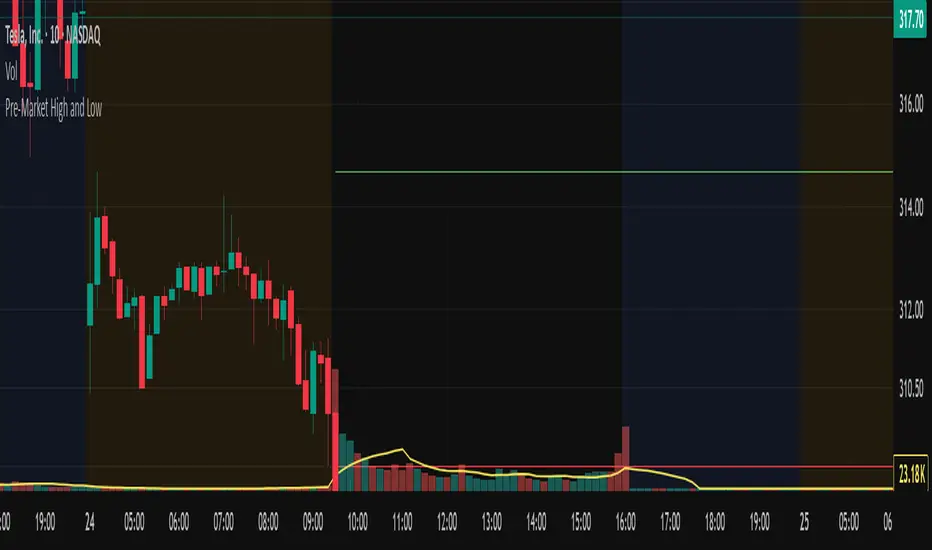
Pre-Market High and LowThis Pine Script indicator automatically plots the pre-market high and low price levels for each trading day, helping traders identify key support and resistance zones based on pre-market activity. Designed for stocks and other assets with pre-market sessions, it draws horizontal lines at the pre-market high and low prices at the regular market open (9:30 AM EST) and resets automatically at the start of each new trading day.
Features:
Automatic Daily Reset: Tracks pre-market highs and lows without requiring manual date changes.
Customizable Timeframe: Set your preferred pre-market session (default: 4:00 AM to 9:30 AM EST).
Flexible Styling: Choose line styles (Solid, Dashed, Dotted) and colors for high/low lines.
Adjustable Panel Size: Control how far the lines extend across the chart (default: 50 bars).
Optional Labels: Toggle labels to display "Pre-Market High" and "Pre-Market Low" at the market open.
Overlay Display: Lines and labels are plotted directly on the price chart for easy reference.
GeeksDoByte 15m & 30m ORB + Prev Day High/LowCME_MINI:NQ1!
How It Works
Opening Ranges
At 9:30 ET, the script begins tracking the high & low.
It uses two fixed sessions:
15 min from 09:30 to 09:45
30 min from 09:30 to 10:00
On the very first bar of each session it initializes the range, then continuously updates the high/low on each new intraday bar.
Dashed lines are drawn when the session opens and extended horizontally across subsequent bars.
Previous Day’s Levels
Independently, it fetches yesterday’s high and low via a daily security call.
These historic levels are plotted as simple horizontal lines for daily context.
How to Use
Breakout Entries
A close above the 15 min ORB high can signal an early breakout; a further push above the 30 min ORB high confirms extended momentum.
Conversely, breaks below the respective lows can indicate short setups.
Support & Resistance
Yesterday’s high/low often act as magnet levels. If price is near the previous high when the opening ranges break, you get a confluence zone worth watching.
Trade Management
Combine the two opening-range levels to tier your stops or scale in.
For example, you might place an initial stop below the 15 min low and a wider stop below the 30 min low.

TBL HTF Highs&LowsThis script plots the previous Daily, Weekly, and Monthly High and Low levels directly on your chart, helping you identify key higher-timeframe support and resistance zones.
Features:
Daily, Weekly, Monthly Lines: Toggle visibility for each timeframe's high/low levels.
Customization Options:
Choose color, style (Solid, Dashed, Dotted), width, and transparency for each line type.
Automatic Updates: Lines update at the start of each new session (day, week, or month).
Summary Table: Displays the latest Pre-Daily High/Low (PDH/PDL), Pre-Weekly High/Low (PWH/PWL), and Pre-Monthly High/Low (PMH/PML) in the top-right corner of the chart.
Configurable Table Font Size: Choose between Tiny, Small, Medium, or Large text.
Use Case:
Ideal for traders who rely on key higher-timeframe levels for confluence, breakout trading, or mean-reversion strategies. The visual lines and summary table provide instant context without cluttering your chart.

Equal High/Low (EQH/EQL) [AlgoAlpha]OVERVIEW
This script detects and visualizes Equal High (EQH) and Equal Low (EQL) zones—key liquidity areas where price has previously stalled or reversed. These levels often attract institutional interest due to the liquidity buildup around them. The indicator is built to highlight such zones using dynamic thresholding, overbought/oversold RSI filtering, and adaptive mitigation logic to manage zone relevance over time.
CONCEPTS
Equal Highs/Lows are price points where the market has repeatedly failed to break past a certain high or low, hinting at areas where stop orders and pending interest may be concentrated. These areas are often prime targets for liquidity grabs or reversals. By combining this with RSI filtering, the script avoids false signals during neutral conditions and instead focuses on zones where market pressure is more directional.
FEATURES
Detection Logic: The script identifies EQH and EQL zones by comparing the similarity between recent highs or lows with a dynamic volatility threshold. The `tolerance` input allows users to control how strict this comparison is.
RSI Filtering: If enabled, it only creates zones when RSI is significantly overbought or oversold (based on the `state_thresh` input). This helps ensure zones form only in meaningful market conditions.
Zone Display: Bullish (EQL) zones are shown in grey, while bearish (EQH) zones are in blue. Two horizontal lines mark the zone using wick and body extremes, and a filled area visualizes the zone between them.
Zone Management: Zones automatically extend with price until they’re invalidated. You can choose whether a zone is removed based on wick or body sweeps and whether it requires one or two candle confirmations. Zones also expire after a customizable number of bars.
Alerts: Four alert conditions are built in—when a new EQH/EQL is formed and when one is mitigated—making it easy to integrate into alert-based workflows.
USAGE
Equal highs/lows can be used as liquidity markers, either as entry points or as take-profit targets.
This tool is ideal for liquidity-based strategies and helps traders map out possible reversal or sweep zones that often precede aggressive moves.

MC High/LowMC High/Low is a minimalist precision tool designed to show traders the most critical price levels — the High and Low of the current Day and Week — in real-time, without any visual clutter or historical trails.
It automatically tracks:
🔼 HOD – High of Day
🔽 LOD – Low of Day
📈 HOW – High of Week
📉 LOW – Low of Week
Each level is plotted using simple black horizontal lines, updated dynamically as the session evolves. Labels are clearly marked and positioned to the right of the screen for easy reference.
There’s no trailing history, no background colors, and no distractions — just pure price structure for clean confluence.
Perfect for:
Intraday scalpers
Swing traders
Liquidity & range traders
This is a tool built for sniper-level execution — straight from the MadCharts mindset.
🛠 Created by:
🔒 Version: Public Release
🎯 Use this with your favorite price action, liquidity, or market structure strategies.

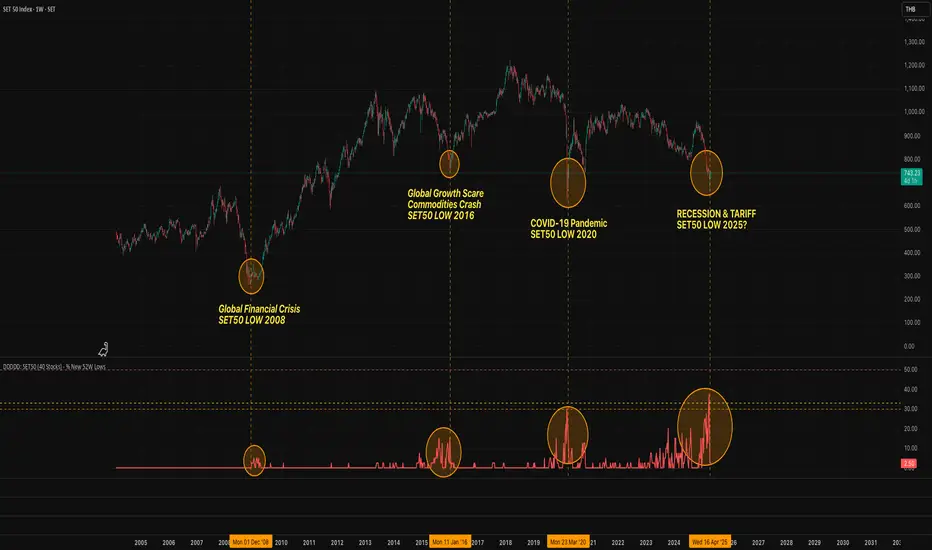
DDDDD: SET50 (40 Stocks) - % New 52W LowsDDDDD: SET50 - % New 52W Lows (40 Stocks)
This indicator measures the percentage of selected SET50 stocks making a new 52-week low, helping identify periods of extreme market fear that often align with long-term buying opportunities.
How It Works:
Tracks the daily closing prices of 40 major SET50 constituents.
A stock is counted when it closes at its lowest price over the past 252 trading days (approximately 1 year).
Calculates the percentage of new 52-week lows relative to 40 stocks.
Displays threshold lines to highlight levels of market panic.
📈 Threshold Levels:
Threshold Line Color Level (%) Interpretation Action
30% Threshold Orange 30% Early signs of stress Start monitoring opportunities
33% Threshold Yellow 33% Confirmed panic Consider gradual accumulation
50% Panic Zone Red 50% Extreme market panic Aggressive accumulation zone
📌 Important Notes:
Why not use the full 50 stocks?
Due to TradingView Pine Script's current technical limits, a script cannot request data for more than 40 symbols efficiently.
Therefore, this indicator uses 40 representative SET50 stocks to ensure optimal performance without exceeding system limits.
The selected stocks are diversified across major sectors to maintain reliability.
🔥 Key Insights:
Historically, spikes above 30%-50% of stocks making new lows have coincided with major market bottoms (e.g., 2011, 2020).
Higher simultaneous new lows = stronger potential for long-term recovery.
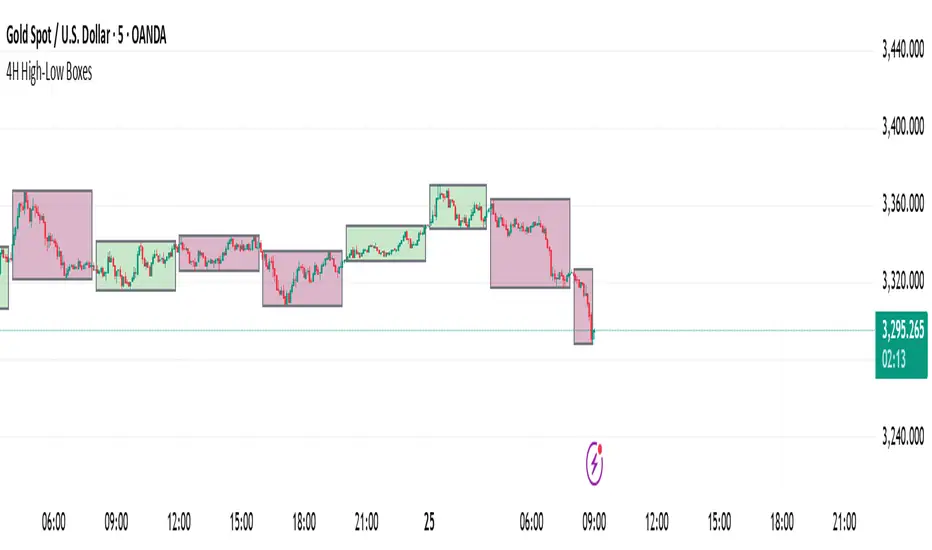
4H High-Low BoxesThis indicator dynamically plots high-low boxes based on the most recent 4-hour candle, providing visual markers for key price levels and trends. The box is updated in real-time to reflect the highest and lowest points of the current 4-hour candle, and its color changes based on the market's direction.
Key Features:
Dynamic Boxes: The indicator automatically adjusts to the 4-hour candle's high, low, and open price, creating a box that updates with price action.
Color-Coding: The box color changes based on the price direction. A green box indicates bullish market sentiment (price is above the 4H open), while a red box indicates bearish sentiment (price is below the 4H open).
Accurate Timeframe Representation: It works across any intraday timeframe (e.g., 5-minute, 15-minute, 1-hour), providing consistent, visually relevant markers for trading decisions.
Real-Time Updates: The box is adjusted dynamically as price evolves, ensuring it accurately represents the 4-hour price range during live trading.
Customizable Settings: Tailor the visual aspects of the box, including border color, background transparency, and other parameters.
Trading Strategy Ideas:
Rejection at High/Low: Look for price rejection at the 4H high/low for potential reversal signals.
Breakout Strategy: Trade breakouts above the 4H high or below the 4H low for momentum trades.
Mean Reversion: Enter when price moves away from the 4H open, expecting it to return to the open price.
This indicator can be used as a standalone tool or combined with other technical indicators to improve entry and exit points. Perfect for swing traders and those using price action to identify key support and resistance levels.
HAPPY TRADING
High and Low DayHigh and Low Day
This indicator automatically tracks and displays the daily high and low of the current trading session directly on your chart.
Each new day, it resets the levels and plots horizontal lines:
Green Line for the daily high
Red Line for the daily low
It also adds labels (“High Day” and “Low Day”) for easy visual reference.
The levels update in real time as new highs or lows are formed throughout the day.
You can toggle the visibility of these lines and labels using the "Mostrar Linhas do Dia Atual" (Show Current Day Lines) setting.
Perfect for intraday traders looking to keep track of key support and resistance levels during the trading day.

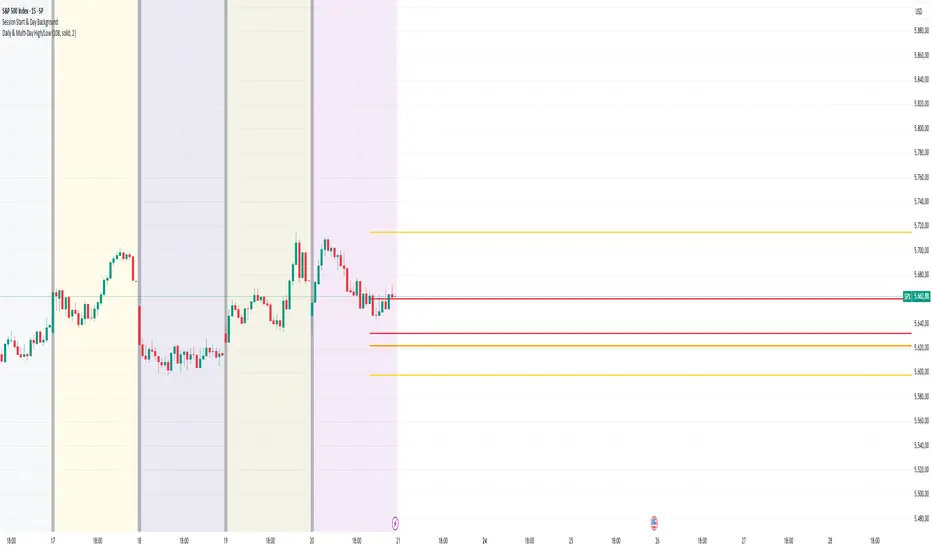
Daily & Multi-Day High/LowDaily & Multi-Candle High/Low Indicator
This indicator clearly highlights essential price levels directly on your chart, significantly improving your trading decisions:
First Candle High/Low (Session Open):
Quickly identify the high and low of the first candle each trading day, ideal for session-open traders.
Previous Day's High/Low:
Automatically plots the highest and lowest prices from the previous trading day, crucial for daily breakout or reversal strategies.
Multi-Candle High/Low (Customizable Period):
Easily track the highest and lowest points of the last X candles (default: 108 candles). Perfect for spotting key support and resistance zones.
Customization Options:
Adjust colors, line styles (solid, dashed, dotted), and line thickness directly from the settings for personalized visibility.
Ideal for day traders, swing traders, and price-action traders looking for clear and actionable daily levels on their charts.
MACD Highs and Lows - Dynamic Support & ResistanceDescription:
Enhance your trading strategy with the MACD Highs and Lows indicator, designed to identify dynamic support and resistance levels based on MACD crossovers. This tool plots key price levels triggered by shifts in MACD momentum, helping traders spot potential reversal zones, breakout points, and trend confirmation signals.
Key Features
Dynamic Levels: Automatically plots recent highs/lows when MACD crosses above/below the zero line.
Customizable MACD Parameters:
Adjustable fast/slow lengths (default: 12/26).
Choose between SMA or EMA for oscillator/signal line.
Flexible signal smoothing (1-50 periods).
Visual Clarity:
Clear green/red lines for highs and lows.
Tracks both price extremes and adjacent candle levels (e.g., high-of-low-bar, low-of-high-bar).
Multi-Timeframe Utility: Works across charts for swing trading, scalping, or trend analysis.
How It Works
Bullish Signal: When MACD crosses above zero, the indicator marks the recent lowest low (support) and its corresponding high.
Bearish Signal: When MACD crosses below zero, it plots the recent highest high (resistance) and its corresponding low.
Levels persist until the next crossover, creating actionable reference zones.
Use Cases
Trend Confirmation: Validate breakouts when price closes above/below plotted levels.
Stop Loss Placement: Set stops beyond recent dynamic highs/lows.
Divergence Detection: Spot discrepancies between MACD momentum and price action.
Settings Tips:
Increase Fast Length for responsiveness or Slow Length for smoother signals.
Use EMA for faster reactions, SMA for reduced noise.

New Daily Low with Offset Alert FeatureThis indicator plots the current day’s low as a horizontal line on your chart and provides an optional offset line above it. It’s designed for traders who want to monitor when price is near or breaking below the daily low. You can set alerts based on the built-in alert conditions to be notified whenever the market approaches or crosses below these key levels.
How to Use With Alerts:
1. Add the indicator to your chart and choose a timeframe (e.g., 15 minutes).
2. In the script inputs, enable or adjust the daily low line and any offset percentage if desired.
3. Open the “Alerts” menu in TradingView and select the corresponding alert condition:
• Cross Below Daily Low to detect when price dips below the day’s low.
• Cross Below Daily Low + Offset if you prefer a small cushion above the actual low.
4. Configure the alert’s frequency and notifications to stay updated on potential breakdowns.
This setup helps you catch new lows or near-breakdowns quickly, making it useful for both intraday traders and swing traders watching key support levels.
Dynamic Customizable 50% Line & Daily High/Low + True Day OpenA Unique Indicator for Precise Market-Level Analysis
This indicator is a fully integrated solution that automates complex market-level calculations and visualizations, offering traders a tool that goes beyond the functionality of existing open-source alternatives. By seamlessly combining several trading concepts into a single script, it delivers efficiency, accuracy, and customization that cater to both novice and professional traders.
Key Features: A Breakdown of What Makes It Unique
1. Adaptive Daily Highs and Lows
Automatically detects and plots daily high and low levels based on the selected time frame, dynamically updating in real time.
Features session-based adjustments, allowing traders to focus on levels that matter for specific trading sessions (e.g., London, New York).
Fully customizable styling, visibility, and alerts tailored to each trader’s preferences.
How It Works:
The indicator calculates daily high and low levels directly from price data, integrating session-specific time offsets to account for global trading hours. These levels provide traders with clear visual markers for key liquidity zones.
2. Automated ICT 50% Range Line
A pioneering implementation of ICT’s mid-range concept, this feature dynamically calculates and displays the midpoint of the daily range.
Offers traders a visual guide to identify premium and discount zones, aiding in determining market bias and potential trade setups.
How It Works:
The script calculates the range between the day’s high and low, dividing it by two to generate the midline. This line updates in real-time, ensuring that traders always see the most current premium and discount levels as price action evolves.
3. Dynamic Market Open Levels
Plots session opens (e.g., Asia, London, New York) and the True Day Open to provide actionable reference points for intra-day trading strategies.
Enhances precision in identifying liquidity shifts and aligning trades with institutional price movements.
How It Works:
The indicator uses predefined session times to calculate and display the opening levels for key trading sessions. It dynamically adjusts for time zones, ensuring accuracy regardless of the trader’s location.
4. Custom Watermark for Enhanced Visualization
Includes an optional watermark feature that allows users to display custom text on their charts.
Ideal for personalization, branding, or highlighting session notes without disrupting the clarity of the chart.
Why This Indicator Stands Out
First-to-Market Automation:
While the ICT 50% range line is a widely recognized concept, this is the first script to automate its calculation, combining it with other pivotal trading levels in a single tool.
All-in-One Functionality:
Unlike open-source alternatives that focus on individual features, this script integrates daily highs/lows, mid-range levels, session opens, and customizable watermarks into one cohesive system. The consolidation reduces the need for multiple indicators and ensures a clean, efficient chart setup.
Dynamic Customization:
Every feature can be adjusted to align with a trader’s strategy, time zone, or aesthetic preferences. This level of adaptability is unmatched in existing tools.
Proprietary Logic:
The indicator’s underlying calculations are built from scratch, leveraging advanced programming techniques to ensure accuracy and reliability. These proprietary methods differentiate it from similar open-source scripts.
How to Use This Indicator
Apply the Indicator:
Add it to your TradingView chart from the library.
Configure Settings:
Use the intuitive settings panel to adjust plotted levels, colors, styles, and visibility. Tailor the indicator to your trading strategy.
Incorporate into Analysis:
Combine the plotted levels with your preferred trading approach to identify liquidity zones, establish market bias, and pinpoint potential reversals or entries.
Stay Focused:
With all key levels automated and updated in real time, traders can focus on execution rather than manual plotting.
Originality and Justification for Closed Source
This script is closed-source due to its unique combination of features and proprietary logic that automates complex trading concepts like the ICT 50% range line and session-specific levels. Open-source alternatives lack this level of integration and customization, making this indicator a valuable and original contribution to the TradingView ecosystem.
What Sets It Apart from Open-Source Scripts?
Unlike open-source tools, this indicator doesn’t just replicate individual features—it enhances and integrates them into a seamless, all-in-one solution that offers traders a more efficient and effective way to analyze the market.
