Low Liquidity Zones [PhenLabs]📊 Low Liquidity Zones
Version: PineScript™ v6
📌 Description
Low Liquidity Zones identifies and highlights periods of unusually low trading volume on your chart, marking areas where price movement occurred with minimal participation. These zones often represent potential support and resistance levels that may be more susceptible to price breakouts or reversals when revisited with higher volume.
Unlike traditional volume analysis tools that focus on high volume spikes, this indicator specializes in detecting low liquidity areas where price moved with minimal resistance. Each zone displays its volume delta, providing insight into buying vs. selling pressure during these thin liquidity periods. This combination of low volume detection and delta analysis helps traders identify potential price inefficiencies and weak structures in the market.
🚀 Points of Innovation
• Identifies low liquidity zones that most volume indicators overlook but which often become significant technical levels
• Displays volume delta within each zone, showing net buying/selling pressure during low liquidity periods
• Dynamically adjusts to different timeframes, allowing analysis across multiple time horizons
• Filters zones by maximum size percentage to focus only on precise price levels
• Maintains historical zones until they expire based on your lookback settings, creating a cumulative map of potential support/resistance areas
🔧 Core Components
• Low Volume Detection: Identifies candles where volume falls below a specified threshold relative to recent average volume, highlighting potential liquidity gaps.
• Volume Delta Analysis: Calculates and displays the net buying/selling pressure within each low liquidity zone, providing insight into the directional bias during low participation periods.
• Dynamic Timeframe Adjustment: Automatically scales analysis periods to match your selected timeframe preference, ensuring consistent identification of low liquidity zones regardless of chart settings.
• Zone Management System: Creates, tracks, and expires low liquidity zones based on your configured settings, maintaining visual clarity on the chart.
🔥 Key Features
• Low Volume Identification: Automatically detects and highlights candles where volume falls below your specified threshold compared to the moving average.
• Volume Delta Visualization: Shows the net volume delta within each zone, providing insight into whether buyers or sellers were dominant despite the low overall volume.
• Flexible Timeframe Analysis: Analyze low liquidity zones across multiple predefined timeframes or use a custom lookback period specific to your trading style.
• Zone Size Filtering: Filters out excessively large zones to focus only on precise price levels, improving signal quality.
• Automatic Zone Expiration: Older zones are automatically removed after your specified lookback period to maintain a clean, relevant chart display.
🎨 Visualization
• Volume Delta Labels: Each zone displays its volume delta with “+” or “-” prefix and K/M suffix for easy interpretation, showing the strength and direction of pressure during the low volume period.
• Persistent Historical Mapping: Zones remain visible for your specified lookback period, creating a cumulative map of potential support and resistance levels forming under low liquidity conditions.
📖 Usage Guidelines
Analysis Timeframe
Default: 1D
Range/Options: 15M, 1HR, 3HR, 4HR, 8HR, 16HR, 1D, 3D, 5D, 1W, Custom
Description: Determines the historical period to analyze for low liquidity zones. Shorter timeframes provide more recent data while longer timeframes offer a more comprehensive view of significant zones. Use Custom option with the setting below for precise control.
Custom Period (Bars)
Default: 1000
Range: 1+
Description: Number of bars to analyze when using Custom timeframe option. Higher values show more historical zones but may impact performance.
Volume Analysis
Volume Threshold Divisor
Default: 0.5
Range: 0.1-1.0
Description: Maximum volume relative to average to identify low volume zones. Example: 0.5 means volume must be below 50% of the average to qualify as low volume. Lower values create more selective zones while higher values identify more zones.
Volume MA Length
Default: 15
Range: 1+
Description: Period length for volume moving average calculation. Shorter periods make the indicator more responsive to recent volume changes, while longer periods provide a more stable baseline.
Zone Settings
Zone Fill Color
Default: #2196F3 (80% transparency)
Description: Color and transparency of the low liquidity zones. Choose colors that stand out against your chart background without obscuring price action.
Maximum Zone Size %
Default: 0.5
Range: 0.1+
Description: Maximum allowed height of a zone as percentage of price. Larger zones are filtered out. Lower values create more precise zones focusing on tight price ranges.
Display Options
Show Volume Delta
Default: true
Description: Toggles the display of volume delta within each zone. Enabling this provides additional insight into buying vs. selling pressure during low volume periods.
Delta Text Position
Default: Right
Options: Left, Center, Right
Description: Controls the horizontal alignment of the delta text within zones. Adjust based on your chart layout for optimal readability.
✅ Best Use Cases
• Identifying potential support and resistance levels that formed during periods of thin liquidity
• Spotting price inefficiencies where larger players may have moved price with minimal volume
• Finding low-volume consolidation areas that may serve as breakout or reversal zones when revisited
• Locating potential stop-hunting zones where price moved on minimal participation
• Complementing traditional support/resistance analysis with volume context
⚠️ Limitations
• Requires volume data to function; will not work on symbols where the data provider doesn’t supply volume information
• Low volume zones don’t guarantee future support/resistance - they simply highlight potential areas of interest
• Works best on liquid instruments where volume data has meaningful fluctuations
• Historical analysis is limited by the maximum allowed box count (500) in TradingView
• Volume delta in some markets may not perfectly reflect buying vs. selling pressure due to data limitations
💡 What Makes This Unique
• Focus on Low Volume: Unlike some indicators that highlight high volume events particularly like our very own TLZ indicator, this tool specifically identifies potentially significant price zones that formed with minimal participation.
• Delta + Low Volume Integration: Combines volume delta analysis with low volume detection to reveal directional bias during thin liquidity periods.
• Flexible Lookback System: The dynamic timeframe system allows analysis across any timeframe while maintaining consistent zone identification criteria.
• Support/Resistance Zone Generation: Automatically builds a visual map of potential technical levels based on volume behavior rather than just price patterns.
🔬 How It Works
1. Volume Baseline Calculation:
The indicator calculates a moving average of volume over your specified period to establish a baseline for normal market participation. This adaptive baseline accounts for natural volume fluctuations across different market conditions.
2. Low Volume Detection:
Each candle’s volume is compared to the moving average and flagged when it falls below your threshold divisor. The indicator also filters zones by maximum size to ensure only precise price levels are highlighted.
3. Volume Delta Integration:
For each identified low volume candle, the indicator retrieves the volume delta from a lower timeframe. This delta value is formatted with appropriate scaling (K/M) and displayed within the zone.
4. Zone Management:
New zones are created and tracked in a dynamic array, with each zone extending rightward until it expires. The system automatically removes expired zones based on your lookback period to maintain a clean chart.
💡 Note:
Low liquidity zones often represent areas where price moved with minimal participation, which can indicate potential market inefficiencies. These zones frequently become important support/resistance levels when revisited, especially if approached with higher volume. Consider using this indicator alongside traditional technical analysis tools for comprehensive market context. For best results, experiment with different volume threshold settings based on the specific instrument’s typical volume patterns.
חפש סקריפטים עבור "low"

Low Volatility Range Breaks [BigBeluga]Low Volatility Range Breaks
The Low Volatility Range Breaks indicator is an advanced technical analysis tool designed to identify periods of low volatility and potential breakout opportunities. By visualizing low volatility ranges as ranges and tracking subsequent price movements, this indicator helps traders spot potential high-probability trade setups.
🔵 KEY FEATURES
● Low Volatility Detection
Identifies periods of low volatility based on highest and lowest periods and user-defined sensitivity
Uses a combination of highest/lowest price calculations and ATR for dynamic adaptation
● Volatility Box Visualization
Creates a box to represent the low volatility range
Box height is adjustable based on ATR multiplier
Includes a mid-line for reference within the box
● Breakout Detection
Identifies when price breaks above or below the volatility box
Labels breakouts as "Break Up" or "Break Dn" on the chart
Changes box appearance to indicate a completed breakout
● Probability Tracking
Counts the number of closes above and below the box's mid-line
Displays probability counters for potential upward and downward moves
Resets counters after a confirmed breakout
🔵 HOW TO USE
● Identifying Low Volatility Periods
Watch for the formation of volatility boxes on the chart
These boxes represent periods where price movement has been confined
● Anticipating Breakouts
Monitor price action as it approaches the edges of the volatility box
Use the probability counters to gauge the likely direction of the breakout
● Trading Breakouts
Consider posible entering trades when price breaks above or below the volatility box
Use the breakout labels ("Break Up" or "Break Dn") as a trading opportunity
● Managing Risk
Use the opposite side of the volatility box as a potential invalidation level
Consider the box height for position sizing and risk management
● Trend Analysis
Multiple upward breakouts may indicate a developing uptrend
Multiple downward breakouts may suggest a forming downtrend
Use in conjunction with other trend indicators for confirmation
🔵 CUSTOMIZATION
The Low Volatility Box Breaks indicator offers several customization options:
Adjust the volatility length to change the period for highest/lowest price calculations
Modify the volatility level to fine-tune the sensitivity of low volatility detection
Adjust the box height multiplier to change the size of volatility boxes
By fine-tuning these settings, traders can adapt the indicator to various market conditions and personal trading strategies.
The Low Volatility Range Breaks indicator provides a unique approach to identifying potential breakout opportunities following periods of consolidation. By visually representing low volatility periods and tracking subsequent price movements, it offers traders a powerful tool for spotting high-probability trade setups.
This indicator can be particularly useful for traders focusing on breakout strategies, mean reversion tactics, or those looking to enter trades at the beginning of new trends. The combination of visual cues (boxes and breakout labels) and quantitative data (probability counters) provides a comprehensive view of market dynamics during and after low volatility periods.
As with all technical indicators, it's recommended to use the Low Volatility Range Breaks indicator in conjunction with other forms of analysis and within the context of a well-defined trading strategy. While this indicator can provide valuable insights into potential breakouts, it should be considered alongside other factors such as overall market trends, volume, and fundamental analysis when making trading decisions.

Low Volatility Profiles [BigBeluga]🔵 OVERVIEW
Low Volatility Profiles is a market compression and breakout-anticipation tool that identifies phases of low volatility using ADX and then builds a real-time volume profile inside the detected range.
This helps traders spot accumulation/distribution zones and prepare for explosive moves when volatility expands.
When volatility is low ➜ price coils ➜ volume organizes ➜ breakouts become highly actionable.
This tool visualizes that process with dynamic range boxes + volume bins + PoC extension.
🔵 CONCEPTS
Low-Volatility Detection — Uses ADX threshold & cross logic to define volatility contraction regimes.
Range Construction — Draws a price box that expands with highs/lows during the compression phase.
Micro Volume Profile — Builds a volume histogram inside the range using bins (micro volume nodes).
Delta Calculation — Tracks positive vs negative volume to gauge buyer/seller pressure within range.
Point of Control (PoC) — Highlights the price level with max traded volume inside the range.
PoC Extension — Optionally extends PoC into future bars to show potential reaction zone after breakout.
Breakout Validation — Ends the profile zone when price breaks above or below the modeled range.
Noise Removal — Automatically removes invalid or small ranges to prevent chart clutter.
This tool turns consolidation into actionable structure by exposing where smart money accumulates before trending moves.
🔵 FEATURES
ADX-Driven Range Detection — Identify when market transitions into low-volatility compression.
Configurable ADX Threshold — Set sensitivity for contraction zones.
Cross-Type Option — Detect low volatility via cross under / crossover logic.
Dynamic Range Box — Expands live with price as contraction unfolds.
Micro Volume Profile (Bins) — Distributes volume across bins inside range for micro POC mapping.
Volume Delta Visualization — Shows imbalance inside consolidation (accumulation vs distribution).
Real-Time PoC Highlight — Instantly shows most traded price inside the compression.
PoC Extension Mode — Extend PoC forward to project reaction levels post-breakout.
Clean Auto-Reset Logic — Removes boxes if range invalid or breakout occurs too fast.
Optional Filled Boxes — Heatmap-style profile visualization inside range body.
ADX Line + Threshold Plot — Visual assistance for volatility state monitoring.
🔵 HOW TO USE
Identify Accumulation Zones — When price enters low-volatility ADX condition and profile builds.
Watch the PoC — PoC acts as battle zone; move above/below can signal initiator strength.
Breakout Strategy — Trade break above/below the range after compression.
Mean Reversion Inside Range — Fade edges while price remains inside compression box.
Combine With Trend Tools — Use trend confirmation (MA/EMA/Flow indicators) after breakout.
Use Delta Clues — Positive delta tilt suggests accumulation; negative suggests distribution.
Monitor Range Size — Longer build + high PoC volume = stronger potential breakout energy.
🔵 CONCLUSION
Low Volatility Profiles isolates accumulation phases and maps volume concentration before volatility expansion.
By combining ADX compression, micro volume distribution, and PoC tracing, traders gain an edge in anticipating powerful breakout cycles and institutional positioning.
Trade the quiet moment before the storm — where smart money prepares the move, and the real opportunity emerges.

Low and Preceding High (Breakout + Bullis fgv + Extending Fib)🚀 Last Low & Preceding High: Bullish Reversal Strategy
This indicator identifies high-probability long setups by confirming a Bullish Market Structure Shift (BMS) coupled with a strong momentum filter.
🧠 Indicator Logic (How It Works)
The core function of this tool is to automatically locate the key structural points that lead to a bullish bias:
Structure Identification: It first defines a Range between the two most recent Pivot Lows. Within this range, it finds the Preceding High (the highest close before the current low) and the true Low Anchor (the lowest low/tail of the pivot low).
Breakout and Momentum Filter: A valid signal requires two conditions to be met on the current bar:
Bullish Breakout: The price must close above the Preceding High.
Marubozu Confirmation: A strong Bullish Marubozu candle (minimal wicks) must be present in the impulse move from the low, filtering for institutional strength.
Fibonacci Discount Zones: Upon confirmation, the indicator calculates and plots the discount zones (0.50, 0.618, 0.786) using the true extremes (tail-to-tail anchors). These zones start extending from the breakout candle and represent high-value areas for potential entries.
🎯 Entry and Risk Management
The strategy provides clear rules for execution once the logic is confirmed:
Entry Execution:
Wait for Retracement: Enter a Long position when the price retraces back into the colored Discount Zones (0.50 to 0.786).
Risk Control:
🛑 Stop Loss (SL): Placed below the Low Line (the swing low that initiated the move).
✅ Take Profit (TP): Placed above the High Line (the high that was broken).
Final note
"Special thanks to Mr. Mazen (@dr0chart) for developing this strategy."

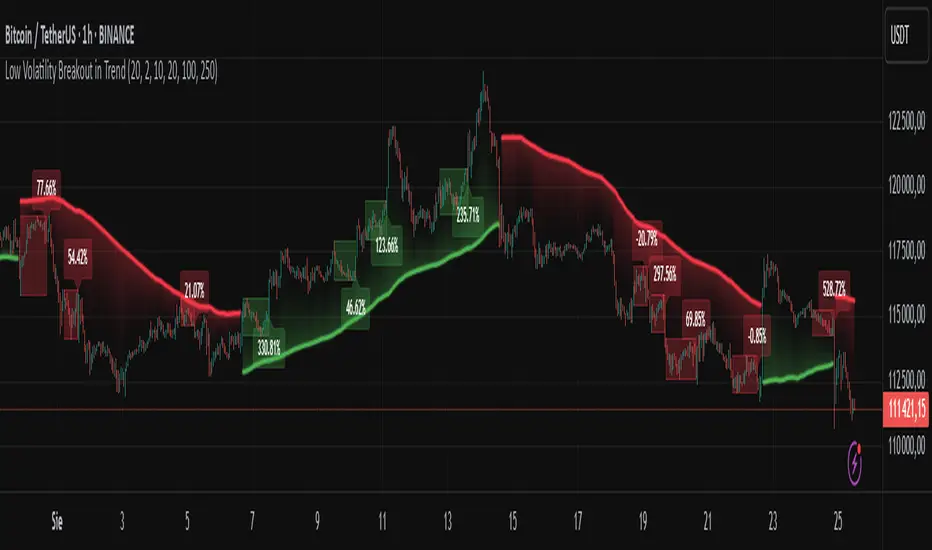
Low Volatility Breakout in Trend
█ OVERVIEW
"Low Volatility Breakout in Trend" is a technical analysis tool that identifies periods of low-volatility consolidation within an ongoing trend and signals potential breakouts aligned with the trend's direction. The indicator detects trends using a simple moving average (SMA) of price, identifies consolidation zones based on the size of candle bodies, and displays the percentage change in volume (volume delta) at the breakout moment.
█ CONCEPTS
The core idea of the indicator is to pinpoint moments where traders can join an ongoing trend by capitalizing on breakouts from consolidation zones, supported by additional information such as volume delta. It provides clear visualizations of trends, consolidation zones, and breakout signals to facilitate trading decisions.
Why Use It?
* Breakout Identification: The indicator locates low-volatility consolidation zones (measured by the size of individual candle bodies, not the price range of the consolidation) and signals breakouts, enabling traders to join the trend at key moments.
* Volume Analysis: Displays the percentage change in volume (delta) relative to its simple moving average, providing insight into market activity rather than acting as a signal filter.
* Visual Clarity: Colored trend lines, consolidation boxes (drawn only after the breakout candle closes, not on subsequent candles), and volume delta labels enable quick chart analysis.
* Flexibility: Adjustable parameters, such as the volatility window length or SMA period, allow customization for various trading strategies and markets.
How It Works
* Trend Detection: The indicator calculates a simple moving average (SMA) of price (default: based on the midpoint of high/low) and creates dynamic trend bands, offset by a percentage of the average candle height (band scaling). A price above the upper band signals an uptrend, while a price below the lower band indicates a downtrend. Trend changes occur not when the price crosses the SMA but when it crosses above the upper band or below the lower band (offset by the average candle height multiplied by the scaling factor).
* Consolidation Identification: Identifies low-volatility zones when the candle body size is smaller than the average body size over a specified period (default: 20 candles) multiplied by a volatility threshold — the maximum allowable body size as a percentage of the average body (e.g., 2 means the candle body must be less than twice the average body to be considered low-volatility).
* Breakout Signals: A breakout occurs when the candle body exceeds the volatility threshold, is larger than the maximum body in the consolidation, and aligns with the trend direction (bullish in an uptrend, bearish in a downtrend).
* Visualization: Draws a trend line with a gradient, consolidation boxes (appearing only after the breakout candle closes, marking the consolidation zone), and volume delta labels. Optionally displays breakout signal arrows.
* Signals and Alerts: The indicator generates signals for bullish and bearish breakouts, including the volume delta percentage. Alerts are an additional feature that can be enabled for notifications.
Settings and Customization
* Volatility Window: Length of the period for calculating the average candle body size (default: 20).
* Volatility Threshold: Maximum candle body size as a percentage of the average body (default: 2).
* Minimum Consolidation Bars: Number of candles required for a consolidation (default: 10).
* SMA Length for Trend: Period of the SMA for trend detection (default: 100).
* Band Scaling: Offset of trend bands as a percentage of the average candle height (default: 250%), determining the distance from the SMA.
* Visualization Options: Enable/disable consolidation boxes (Show Consolidation Boxes, drawn after the breakout candle closes), volume delta labels (Show Volume Delta Labels), and breakout signals (Show Breakout Signals, e.g., triangles).
* Colors: Customize colors for the trend line, consolidation boxes, and volume delta labels.
█ OTHER SECTIONS
Usage Examples
* Joining an Uptrend: When the price breaks out of a consolidation in an uptrend with a volume delta of +50%, open a long position; the signal is stronger if the breakout candle surpasses a local high.
* Avoiding False Breakouts: Ignore breakout signals with low volume delta (e.g., below 0%) and combine the indicator with other tools (e.g., support/resistance levels or oscillators) to confirm moves in low-activity zones.
Notes for Users
* On markets that do not provide volume data, the indicator will not display volume delta — disable volume labels and enable breakout signals (e.g., triangles) instead.
* Adjust parameters to suit the market's characteristics to minimize noise.
* Combine with other tools, such as Fibonacci levels or oscillators, for greater precision.
Low Volatility Breakout + TP/SL Levels█ OVERVIEW
"Low Volatility Breakout + TP/SL Levels" is a breakout indicator designed to detect and trade breakouts from periods of low volatility (consolidation). Unlike classic strategies based on fixed support/resistance levels, this indicator dynamically identifies consolidations characterized by small candle bodies and only generates a signal when the breakout occurs with a large, decisive candle. It also automatically plots 3 Take Profit levels and a Stop Loss (with two calculation modes), making it a complete breakout trading tool.
█ CONCEPTS
The strongest market moves most often start after a prolonged period of very low volatility — when candles become small and the market "falls asleep". The indicator first detects such consolidations (small bodies for at least X bars), draws a box around them, and then waits for a breakout with a candle significantly larger than the average. Additional filters (e.g., the box height cannot exceed the average candle body by too much) eliminate false consolidations and volatility traps. Immediately after the breakout, TP1, TP2, TP3, and SL levels are plotted.
█ FEATURES
Dynamic detection of low-volatility consolidations
- candles with small bodies (< average body × consolidationMultiplier)
- minimum number of bars in consolidation: confirmBars (default 5)
Automatic drawing of consolidation boxes
- green (bullish) or red (bearish) with transparent background (85)
- adjustable border thickness (border_width 1–5)
- box height filter (boxHeightMultiplier, default 6.0 × average body) – removes overly stretched/false consolidations
Breakout conditions
- current candle must be larger than average body × threshold (default 1.5)
- must be the largest candle in the entire consolidation
- must close above the highest high (long) or below the lowest low (short)
Breakout signals
- small green triangles below the bar (long)
- small red triangles above the bar (short)
Automatic Take Profit and Stop Loss levels (drawn 5 bars forward)
- two calculation modes:
• Candle Multiplier – based on average true range (high-low) over tp_sl_length period
• Percentage – fixed percentage from breakout close price (percentages must be manually adjusted to the asset and timeframe)
- 3 TP levels (default 2×, 3×, 4× or 2%, 3%, 4%)
- 1 SL level (default 2× or 1.5%)
Live TP/SL price table (top-right corner)
- displays exact current values of SL, TP1, TP2, TP3 immediately after each new signal
- colors identical to drawn lines (red background for SL, green for TP levels)
- updates automatically with every new breakout
Built-in alerts
- “Bullish Breakout Alert” and “Bearish Breakout Alert”
█ HOW TO USE
Add the indicator to your TradingView chart → Indicators → search “Low Volatility Breakout + TP/SL Levels”.
After each valid breakout you will immediately see:
- the colored box
- signal triangle
- horizontal TP/SL lines
- updated table in the top-right corner showing precise price levels for the current trade
Key settings to adjust:
Consolidation Settings
- Volatility Window (length) – period for average body calculation (default 20)
- Consolidation Multiplier – how small bodies must be to count as consolidation (default 2.0)
- Breakout Multiplier – minimum size of breakout candle (default 1.5)
- Box Height Multiplier – maximum allowed box height (default 6.0)
- Min Consolidation Bars – minimum bars required (default 5)
Risk Management Settings
- Choose TP/SL mode: Candle Multiplier or Percentage
- Adjust TP1–3 and SL multipliers/percentages to match your risk management style
Signal interpretation:
- Green triangle below bar + green box + green TP levels in table = long signal
- Red triangle above bar + red box + red SL level in table = short signal
- Boxes remain on chart until broken — they highlight accumulation/distribution zones
█ APPLICATIONS
- Trading breakouts from consolidation on all markets and timeframes
- Recommended to trade in the direction of the higher-timeframe trend or with additional confirmations (e.g., key level breaks). Aggressive mode (trading both directions) is also possible — provided box and TP/SL settings are properly optimized
- Experiment with different TP/SL ratios — higher reward-to-risk setups (e.g., SL 1×, TP3 6–8×) with lower win rate are often more profitable in the long run
- Strongly encourage testing various box parameters (consolidationMultiplier, boxHeightMultiplier, confirmBars) — small changes can dramatically affect signal frequency and quality
█ NOTES
Always test and optimize parameters for the specific instrument and timeframe.

Low Scanner Forex strategyThis strategy is non repainting as the scanner do not use security for its entry and the Hull MTF is non repainted one.
it design for forex only
why it working as such ?
simple once we have good detection of Low using Low scanner and Low scaner strategy
which is a killer for stoks as I shown in that script
here i show winning non repainting strategy for Forex
why it working perfect?
if the Low entry is good. the market go up or down but eventualy by using step wise profit take out
as shown by adolgov
then you will win most of time .
This is example how I use my script with adolgov script to create this strategy
it not pyramiding as in pyramiding we buy and buy and buy. here the entry is fix but exit is progressive,0.5% -1% 1.5% ,2% at 25% equaty each.
the market go up or down we just take ourt profit out.
so if you use leverage in forex the win % will be crazy. but you must to apply this only to asstes where this strategy is working like EURO/USD
the dat here is from 2017 t0 2018 ,if you want the last data which show the same put in test year 2019 as start
This script is for forex lovers as teaching how to create winning non repainting strategy
if you want to invite to coffe be free to do so
let me know what you think

Low Volatility Breakout Detector)This indicator is designed to visually identify potential breakouts from consolidation during periods of low volatility. It is based on classic Bollinger Bands and relative volume. Its primary purpose is not to generate buy or sell signals but to assist in spotting moments when the market exits a stagnation phase.
Arrows appear only when the price breaks above the upper or below the lower Bollinger Band, the band width is below a specified threshold (expressed in percentage), and volume is above its moving average multiplied by a chosen multiplier (default is 1). This combination may indicate the start of a new impulse following a period of low activity.
The chart background during low volatility is colored based on volume strength—the lower the volume during stagnation, the less transparent the background. This helps quickly spot unusual market behavior under seemingly calm conditions. The background opacity is dynamically scaled relative to the range of volumes over a selected period, which can be set manually (default is 50 bars).
The indicator works best in classic horizontal consolidations, where price moves within a narrow range and volatility and volume clearly decline. It is not intended to detect breakouts from formations such as triangles or wedges, which may not always exhibit low volatility relative to Bollinger Bands.
Settings allow you to adjust:
Bollinger Band length and multiplier,
Volatility threshold (in %),
Background and arrow colors,
Volume moving average length and multiplier,
Bar range used for background opacity scaling.
Note: For reliable results, it’s advisable to tailor the volatility threshold and volume/background ranges to the specific market and timeframe, as different instruments have distinct dynamics. If you want the background color to closely match the color of breakout arrows, you should set the same volume analysis period as the volume moving average length.
Additional note: To achieve a cleaner chart and focus solely on breakout signals, you can disable the background and Bollinger Bands display in the settings. This will leave only the breakout arrows visible on the chart, providing a clearer and more readable market picture.

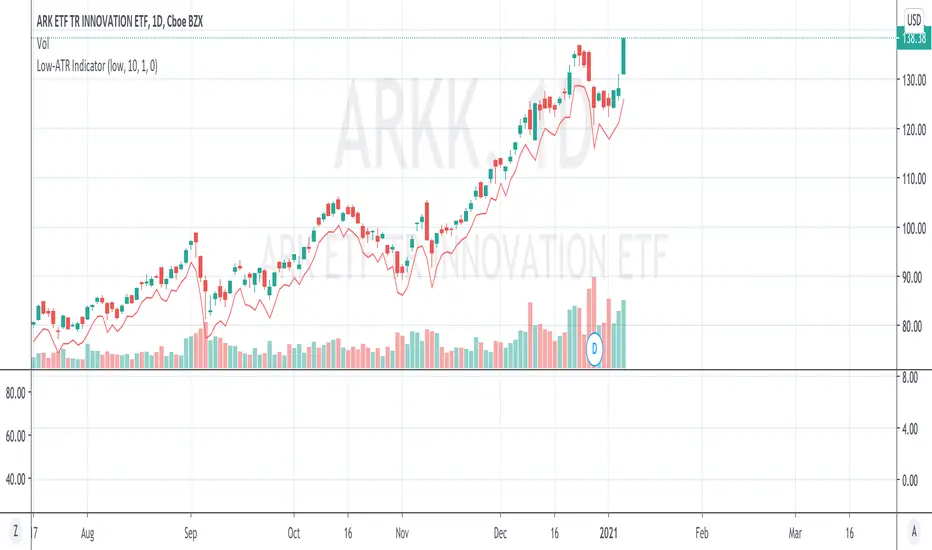
Low-ATR IndicatorWe often want to use a stop loss at a certain low - N*ATR,
But it is too troublesome to manually calculate a certain day low - ATR.
This indicator simply calculates it for you, by marking the value of day low - ATR.
By default the hardcoded ATR value is 0, which means "Uses the ATR at that day with configured look back period".
If you want to use a specific ATR value, e.g.
1) You want to set the stop loss using today's ATR but another day's day low (Very often)
2) You want to set the stop loss in another timeframe - N*ATR
You can type in the value of ATR into the "hardcoded ATR" field.
(Actually this should be the most used way)
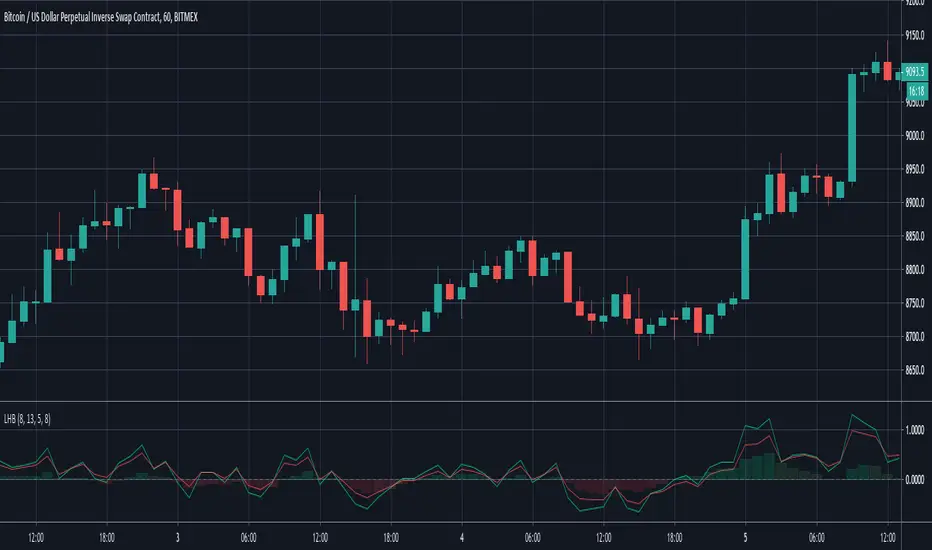
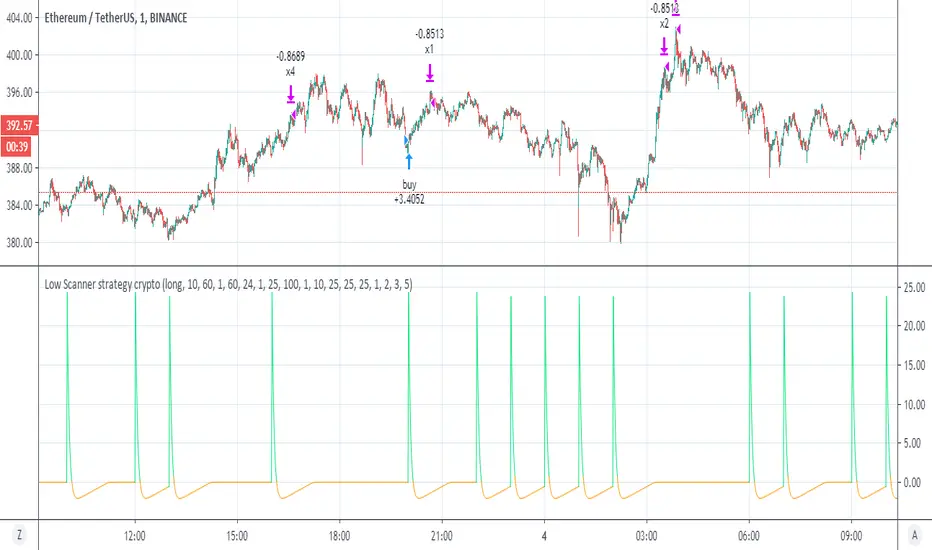
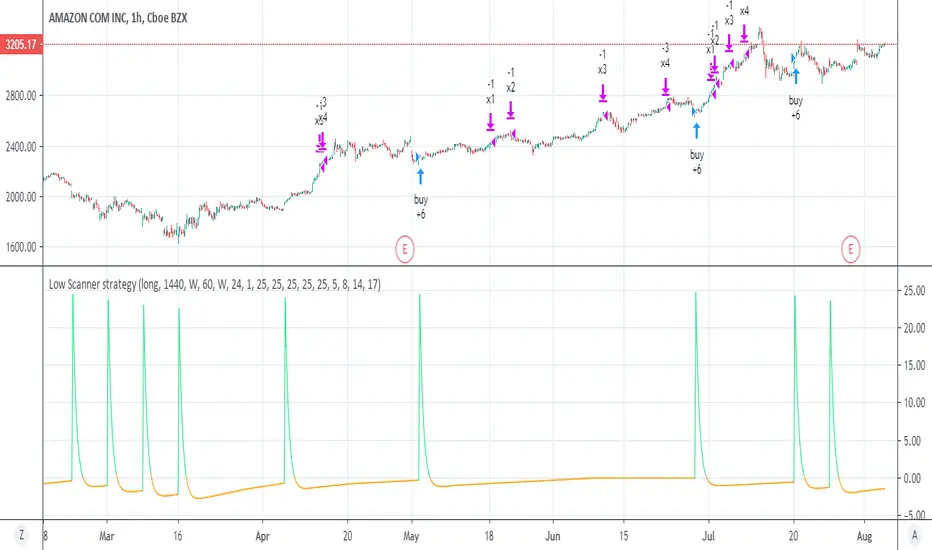
Low Scanner strategy cryptoThis is the last script of the Low scanner series
I have shown in script 1 the best strategy for stocks on 1 hour
script for forex 1 hour (if you look on comments you will find settings which are perfect for low TF (1 min system )
This strategy is the perfect weapen for crypto
no repaint as I shown the scanner do not use security
this system will buy and sell about every 1000 min in the end you will getyour profit which is progressive
set to 1,2,3, and 5 % where each time you take 25% of equaty out
as I shown before the power of the progresive take and my scanner make it best
the scnner serach for low point using my special RSI system with no repaint MTF
every time we get our profit out
the scanner will find us new low to start cycle again
so invite me for coffe if you like this system
thanks to TV that allow donation:)
so this is example of smart strategy that beat the odds
try on major crypto assets (it nice system )
without the script of adolgov
this system was not possible so I would like to thank him very much that he share with us his great script
Low Scanner strategyThis is the strategy I made using low scanner
there is no repaint as there is no security at all
the exit is by using multiple exit point by equity shown in the script of adolgov
so you can set the low low scanner to any position you want by no security MTF (look on the study for detail about it)
the exit you set acording to % and the equity as suggested by adolgov
this scripyt is free you can make the exit diiferent
it just example how to create better non repainting strategies with MTF
look on the same setting on stocks just 1 hour candle look very nice there:)
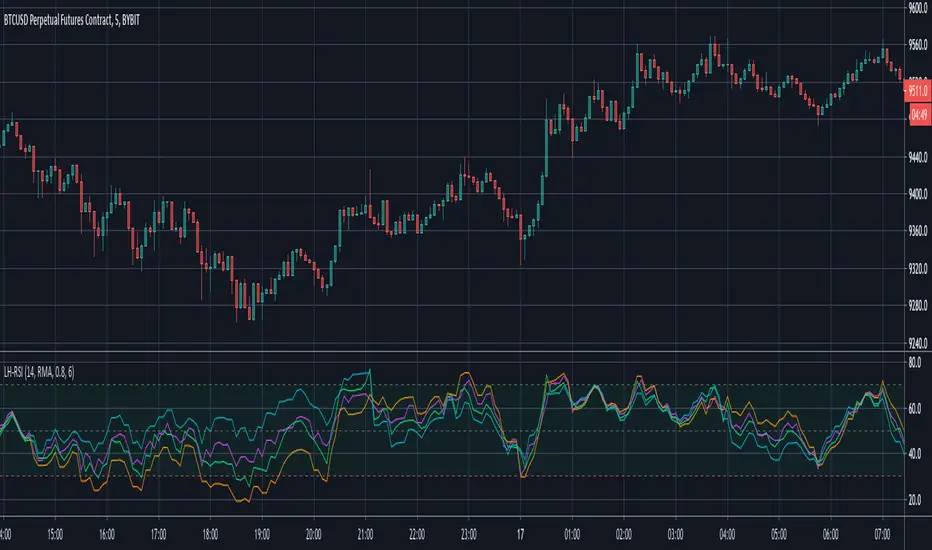
Low-High RSIIt is an RSI indicator with 3 lines (or 4 if you enable the original RSI in settings):
The lime is calculated from high
The fuchsia is calculated from low
The orange one is calcuated form both high and low , by calculating RSI's up from high and down from low
You can also select different moving averages for RSI calculation. (The default is the original RMA)
This indicator is useful for e.g. to filter out original RSI's false signals by waiting both low and high lines to confirm. Or you can use it as an earlier exit indicator.
Please write a comment if you find another usage of it.
Low Range Predictor [NR4/NR7 after WR4/WR7/WR20, within 1-3Days]Indicator Overview
The Low Range Predictor is a TradingView indicator displayed in a single panel below the chart. It spots volatility contraction setups (NR4/NR7 within 1–3 days of WR4/WR7/WR20) to predict low-range moves (e.g., <0.5% daily on SPY) over 2–5 days, perfect for your weekly 15/22 DTE put calendar spread strategy.
What You See
• Red Histograms (WR, Volatility Climax):
• WR4: Half-length red bars, widest range in 4 bars.
• WR7: Three-quarter-length red bars, widest in 7 bars.
• WR20: Full-length red bars, widest in 20 bars.
• Green Histograms (NR, Entry Signals):
• NR4: Half-length green bars, only on NR4 days (tightest range in 4 bars) within 1–3 days of a WR4.
• NR7: Full-length green bars, only on NR7 days within 1–3 days of a WR7.
• Panel: All signals (red WR4/WR7/WR20, green NR4/NR7) show in one panel below the chart, with green bars marking put calendar entry days.
Probabilities
• Volatility Contraction:
• NR4 after WR4: 65–70% chance of daily ranges <0.5% on SPY for 2–5 days (ATR drops 20–30%). Occurs ~2–3 times/month.
• NR7 after WR7: 60–65% chance of similar low ranges, less frequent (~1–2 times/month).
• Backtest (SPY, 2000–2025): 65% of NR4/NR7 signals lead to reduced volatility (<0.7% daily range) vs. 50% for random days.
• Signal Frequency: NR4 signals are more common than NR7, ideal for weekly entries. WR20 provides context but isn’t tied to NR signals.

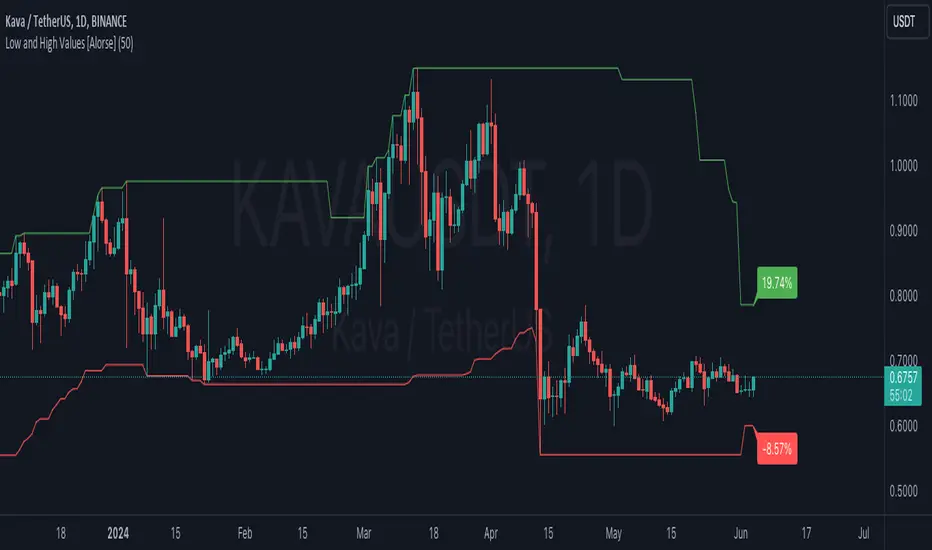
Low and High Values [Alorse]🌟 What does this indicator do?
This magical indicator shows you the lowest (Low) and highest (High) values of the last X candles directly on your chart. Not only that, but it also tells you how much the price has changed from the opening price of the current candle to these key points, all in percentage format. You'll have a clear and precise view of market movement!
🔧 Customize to your liking
Want to adjust the number of candles to consider? No problem! You can easily change this parameter to suit your preference. Whether you like short-term strategies with just a few candles or prefer more extensive analysis with many candles, our indicator adapts to you.
🚀 How can this indicator help you?
Identify Support and Resistance: By showing the lowest and highest points, it helps you identify key support and resistance levels. Perfect for planning your entries and exits!
Trend Analysis: With the percentage labels, you can quickly see how the price has moved relative to recent extremes, helping you confirm trends or anticipate possible reversals.
Trading Strategies: Imagine the price is near a recent low, but the percentage indicates a significant drop from the opening. This could be a buy signal if you expect a rebound. Conversely, if the price is near a recent high with a large percentage increase, you might consider selling.
Calculate Stop Loss: Use this indicator to determine your Stop Loss levels by leaving a bit of margin between the indicator value and your desired SL. This helps protect your positions while allowing for some price fluctuation.
📊 Examples of Use
Intraday Trader: Use the indicator with 10-20 candles to capture quick moves and capitalize on daily fluctuations.
Mid-term Trader: Set the indicator to consider 50 candles for a broader view of trends and reversal points.
Long-term Strategist: Adjust the indicator to 100 candles or more to identify highs and lows over larger time frames.
🛠️ Customizable Parameters
Number of Candles: Define the number of candles the indicator will analyze to calculate the lowest and highest values. It's all up to you!
Low-High-Trend StrategyWhen asked what the key to successful investing was, Warren Buffet famously said “buy low, sell high.” Was he onto something? Today I am sharing with the community a simple “buy low, sell high” strategy with an optional trend filter and take-profit target. I’ve found that this strategy works well in a variety of markets but has a higher tendency to out-perform buy & hold in markets that are ranging sideways.
How it works:
The strategy tracks the highest and lowest price over the last X number of bars (you select the look-back period). The highest price line is plotted in green and the lowest price line is potted in red. If the price crosses over the lowest price in the last X number of bars, then a buy signal is generated. Exit options include a take-profit % or selling when the price crosses over the highest price in the last X amount of bars. I.e. “Buy low, sell high.” An EMA is also plotted as a blue trend line, and there is an option to only trade if the price is above the EMA trend line.
Disclaimer: Open source scripts I publish in the community are largely meant to spark ideas that can be used as building blocks for part of a more robust trade management strategy. Even though this example script beats buy and hold over the back-test time-frame, I wouldn't advise using it as a stand-alone strategy without significant additions/modifications to the strategy and risk management functions. In this example the script is being used as a medium-term strategy with just 10% leverage over account equity, a $25k start balance, and back-testing 10+ years. Modifiable slippage and commissions are included in the model.
Green line = Highest price in the look-back period
Red line = Lowest price in the look-back period
Blue line = EMA Trend

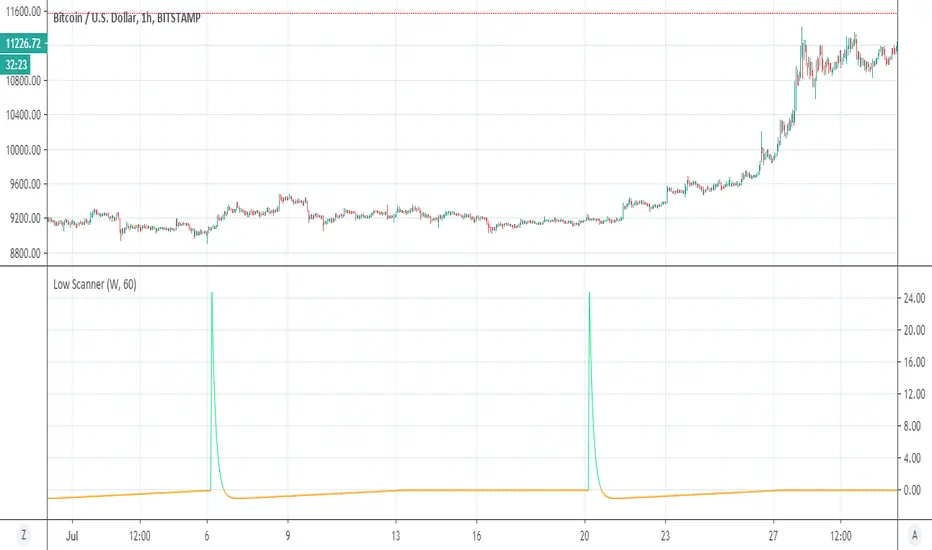
Low ScannerThis is example of how to detect low using special volume rsi
i use the idea invented by Duyck
how to use MTF without using security
when ever it cross zero it a low or buy signal
I think it nice system to detect lows
not always perfect but it accurate most of the times I am still searching system for high:)
so green is act as buy sign as well
the nice thing here is no security:)
forex
Low Pass Channel [DW]This is an experimental study designed to attenuate higher frequency oscillations in price and volatility with minimal lag.
In this study, a single pole low pass filter is used. The low pass filter's cutoff period is determined either by a fixed user input, or by using an Instantaneous Frequency Measurement (IFM) algorithm.
Most radar warning, electronic countermeasures, and electronic intelligence systems employ IFM to identify threats, map the electronic battlefield, and implement deceptive countermeasures.
The IFM technique used for this study was devised by John Ehlers. It calculates In Phase and Quadrature (IQ) components using the Hilbert Transform and uses them to determine the dominant price cycle.
To generate the channel, the same filter approach is applied to true range then added to and subtracted from the price filter.
Custom bar colors are included for simple wave and trend indication.

Low EMA of EMAgain over the chart for ProfitTrailerThis script prints low EMA line over the chart.
Buy value and time frame numbers can be modified in format.
Basically this is same with previous scripts of mine.
Though this does not show the spread between the price and low EMA line (EMAgain) and buy value, you can see the buy trailing signal.
If you set buy value positive for gain starategy, the buy trailing will start from the time point indicated by "▲".
If you set buy value negative for gain starategy, the buy trailing will start from the time point indicated by "▼".
This script is to help myself understand the buy strategies of ProfitTrailer.
Any comments and suggestions are welcome.

Low Price VolatilityI highlighted periods of low price volatility in the Nikkei 225 futures trading.
It is Japan Standard Time (JST)
This script is designed to color-code periods in the Nikkei 225 futures market according to times when prices tend to be more volatile and times when they are less volatile. The testing period is from March 11, 2024, to November 1, 2024. It identifies periods and counts where price movement exceeded half of the ATR, and colors are applied based on this data. There are no calculations involved; it simply uses the results of the analysis to apply color.

Low-lag TrendlineWe apply the LLT trend timing to daily data of market indices such as the Shanghai and Shenzhen 300, Shanghai Composite Index, and Shenzhen Composite Index, and use the tangent method to make direction judgments, obtaining a good risk return situation. Compared to MA trend timing, we found that the LLT model has a shorter timing period and better stability. However, there is a problem with using the tangent method to track trend lines, which is that near the turning point of the trend, the tangent slope is prone to oscillate near zero, resulting in multiple timing judgments and a decrease in accuracy. This is equivalent to embedding a certain stop loss mechanism in the timing model, so we call this type of timing method transactional timing. For the LLT indicator, once the trend is established, holding positions can maintain a relatively long profit period, and although there are many volatile trading times near the inflection point, the holding time is often very short. Therefore, for transactional timing, when the accuracy of judgment is relatively low, the proportion of correct judgment time is often high, and profits mainly come from this part of the contribution.

Low Timeframe POCI have recently made a High Timeframe POC script (HFT POC) which is pretty popular. Thanks for this!
There are many requests to include lower timeframes in this script, that is why I created this script. I could have incorporated all the timeframe POC's into one indicator but I went this route to keep things more organized between all the different timeframes.
Currently included: Daily, 6H, 3H and 1H
/* DEFINITION */
Point Of Control (= POC) is a price level at which the heaviest volumes were traded.
/* HOW TO TRADE WITH THIS INDICATOR */
The basis for POC is determining bias on whichever timeframe you choose.
1. Identify a POC on the timeframe of your choosing.
/* If you choose the lowest timeframe (1H here) then always make sure to look at the higher timeframes to see how it is trading against a HTF POC.
2. When the price is moving away from the POC (either to the upside or downside) this can confirm or invalidate a trade.
3. You can now enter the trade on bias or wait for a retest of the same POC.
/* EXAMPLE TRADES /*
Here is a screenshot of some of the trades that are possible using these Low Timeframe POC's and some common sense.
s3.tradingview.com

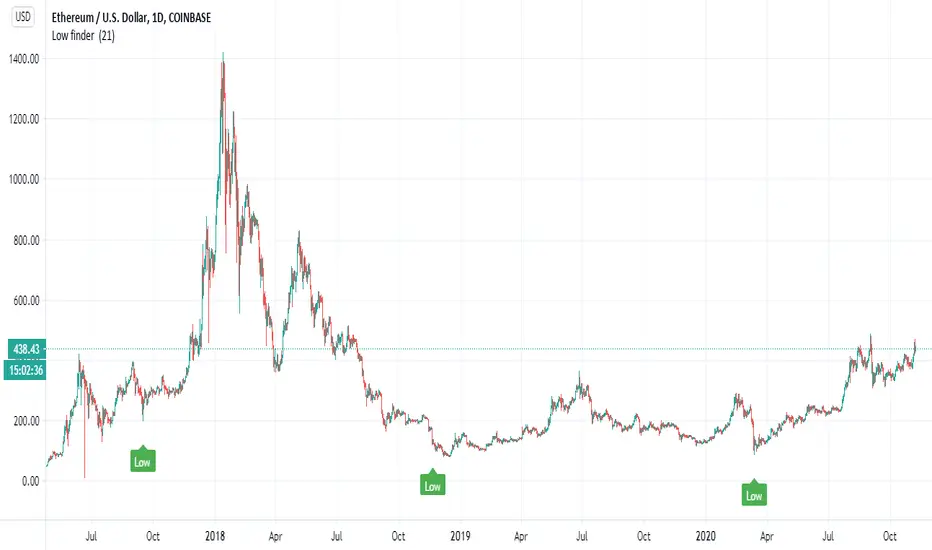
Low finder Very simple script with alerts to detect potential low
based on difference between RSi and ema based rsi
the length control the sensitivity of this indicator (set here to be 21 )
btc
stock
forex
Low-High BalanceIt measures the balance between distance of low and close and distance of high and close.
From this balance a fast and a slow moving average is calculated and like MACD a histogram of their smoothed difference is drawed.