DB Support Resistance Levels + Smart Higher Highs and Lower LowsDB Support Resistance Levels + Smart Higher Highs and Lower Lows
The indicator plots historic lines for high, low and close prices shown in settings as "base levels". Users can control the lookback period that is plotted along with an optional multiplier. Traders will notice that the price bounces off these historic base levels. The base levels are shown as light gray by default (customizable in the settings). Users may choose to display base levels by a combination of historic high, low and close values.
On top of the historic base levels, the indicator display higher high and lower low levels from the current bar high/low. Higher highs are shown by default in pink and lower lows by default in yellow. The user can adjust the lookback period for displaying higher highs and the optional multiplier. Only historic values higher than the current bar high are displayed filtering out (by highlighting) the remaining levels for the current bar. Users may choose to use a combination of historic open, low and close values for displaying higher highs. The user can adjust the lookback period for displaying lower lows and the optional multiplier. Only historic values lower than the current bar low are displayed filtering out (by highlighting) the remaining levels for the current bar. Users may choose to use a combination of historic open, low and close values for displaying lower low.
The indicator includes two optional filters for filtering out higher highs and lower lows to focus (highlight) the most relevant levels. The filters include KC and a simple price multiplier filter. The latter is enabled by default and recommended.
The indicator aims to provide two things; first a simple plot of historic base levels and second as the price moves to highlight the most relevant levels for the current price action. While the indicator works on all timeframes, it was tested with the weekly. Please keep in mind adjusting the timeframe may require the lookback settings to be adjusted to ensure the bars are within range.
How should I use this indicator?
Traders may use this indicator to gain a visual reference of support and resistance levels from higher periods of time with the most likely levels highlighted in pink and yellow. Replaying the indicator gives a visual show of levels in action and just how very often price action bounces from these highlighted levels.
Additional Notes
This indicator does increase the max total lines allowed which may impact performance depending on device specs. No alerts or signals for now. Perhaps coming soon...
חפש סקריפטים עבור "low"

Multi-Timeframe High Low (@JP7FX)Multi-Timeframe High Low Levels (@JP7FX)
This Price Action indicator displays high and low levels from a selected timeframe on your current chart.
These levels COULD represent areas of potential liquidity, providing key price points where traders can target entries, reversals, or continuation trades.
Key Features:
Display high and low levels from a selected timeframe.
Customize line width, colors for high and low levels, and label text color.
Enable or disable the display of high levels, low levels, and labels.
Receive alerts when the price takes out high or low levels.
How to use:
It is important to note that using this indicator on it's own is not advisable. Instead, it should be combined with other tools and analysis for a more comprehensive trading strategy.
Possibly look to use my MTF Supply and Demand Indicator to look for zones to trade from at these levels?
If the price breaks above a high level, you might consider entering a long position, with the expectation that the price will continue to rise. Conversely, if the price breaks below a low level, you may think about entering a short position, anticipating further downward movement.
On the other hand, you can also use high or low levels to look for reversal trades, as these areas can represent attractive liquidity zones.
By identifying these key price points, you could take advantage of potential market reversals and capitalise on new trading opportunities.
Always remember to use this indicator in conjunction with other technical analysis tools for the best results.
Additionally, you can enable alerts to notify you when the price takes out high or low levels, helping you stay informed about significant price movements.
This indicator could be a valuable tool for traders looking to identify key price points for potential trading opportunities.
As always with the markets, Trade Safe :)

TR High-LowDraw a ZigZag line, a trend line , a High-Low line, and two Fibonacci lines.
1. draw ZigZag line
1-1. detect High-Low value
1-2. High-Low value is saved as a provisional value when it is updated
1-3. checks if the provisional value reaches the specified price difference (Difference) when the specified length (High-Low length) is reached
1-4. if the provisional value reaches the specified price difference (Difference), it is officially saved as a High-Low value
1-5. if the provisional value has not reached the specified price difference (Difference), it checks if the price difference (Difference) is reached
for the specified number of extensions (Extension). If it does, the provisional value is officially saved as a High-Low value.
Even if the price difference is not reached and the number of extensions has been reached, the provisional value is officially saved as the High-Low value.
1-6. draw a ZigZag line connecting the detected High-Low values
2. draw a horizontal line
2-1. draw a horizontal line on the High-Low value detected when drawing the ZigZag line
3. Draw a trend line
3-1. Draws a trend line using the High-Low value detected when drawing a ZigZag line
4. Draw a Fibonacci line
4-1. draws a Fibonacci line based on the first and second from the end of the ZigZag line by default
Event High/Mid/LowEvent High/Mid/Low - Data Release Level Tracker
Automatically track and visualize high, low, and mid levels from major data events like FOMC announcements, CPI releases, NFP reports, and other market-moving data releases.
KEY FEATURES:
- Customizable event input - Add unlimited events using a simple text format
- Flexible time periods - Set custom duration for each event (15min, 30min, 60min, etc.)
- Visual clarity - Color-coded lines and optional background cloud between high/low
- Clean labels - Minimalist text labels without background boxes
- Fully customizable - Toggle lines, labels, and clouds on/off independently
HOW TO USE:
1. Add the indicator to your chart
2. Open settings and edit the "Event Dates" text area
3. Enter one event per line in this format: YYYY-MM-DD HH:MM Minutes Label
Example: 2025-01-29 14:00 30 Jan FOMC
Example: 2025-02-12 08:30 30 Feb CPI
4. The indicator will automatically capture and display the high, low, and mid levels
WHAT IT DISPLAYS:
- High line (teal) - Highest price during the event period
- Low line (pink) - Lowest price during the event period
- Mid line (yellow, dotted) - Midpoint between high and low
- Background cloud (optional) - Shaded area between high and low
- Event window highlighting - Orange background during active events
PERFECT FOR:
- Tracking key support/resistance levels from economic releases
- Planning entries/exits around FOMC, CPI, NFP, and other data
- Analyzing how price reacts to major announcements
- Identifying post-event trading ranges
SUPPORTED EVENTS:
Works with any scheduled economic release - FOMC, CPI, PPI, NFP, Retail Sales, GDP, and more. Simply input the date, time, duration, and a custom label.
IMPORTANT LIMITATIONS:
- Chart timeframe must be EQUAL TO OR SMALLER than event duration
- For 30-minute events: Use 30min, 15min, 5min, 1min charts (NOT 1H, 4H, Daily)
- For 60-minute events: Use 60min, 30min, 15min, 5min, 1min charts
- For 15-minute events: Use 15min, 5min, 1min charts
- If your chart timeframe is larger than the event duration, the indicator may not capture accurate high/low values
- Recommended: Use 5-minute or 1-minute charts for maximum accuracy on all event durations
NOTES:
- All times are in EST/EDT (America/New_York timezone)
- Comments starting with # are ignored, making it easy to organize and annotate your event list
- The indicator processes events only after the specified duration has elapsed

ICT Liquidity Sweep Asia/London 1 Trade per High & Low🧠 ICT Liquidity Sweep Asia/London — 1 Trade per High & Low
This strategy is inspired by the ICT (Inner Circle Trader) concepts of liquidity sweeps and market structure, focusing on the Asia and London sessions.
It automatically identifies liquidity grabs (sweeps) above or below key session highs/lows and enters trades with a fixed risk/reward ratio (RR).
----------------------------------------------------------------------------------
----------------------------------------------------------------------------------
⚙️ Core Logic
-Asia Session: 8:00 PM – 11:59 PM (New York time)
-London Session: 2:00 AM – 5:00 AM (New York time)
-The script marks the Asia High/Low and London High/Low ranges for each day.
-When the market sweeps above a session high → potential Short setup
-When the market sweeps below a session low → potential Long setup
-A trade is triggered when the confirmation candle closes in the opposite direction of the sweep (bearish after a high sweep, bullish after a low sweep).
-Only one trade per sweep type (1 per High, 1 per Low) is allowed per session.
----------------------------------------------------------------------------------
----------------------------------------------------------------------------------
📈 Risk Management
-Configurable Risk/Reward Target (default = 2:1)
-Configurable Position Size (number of contracts)
-Each trade uses a fixed Stop Loss (beyond the wick of the sweep) and a Take Profit calculated from the RR setting.
-All trades are automatically logged in the Strategy Tester with performance metrics.
----------------------------------------------------------------------------------
----------------------------------------------------------------------------------
💡 Features
✅ Visual session highlighting (Asia = Aqua, London = Orange)
✅ Automatic liquidity line plotting (session highs/lows)
✅ Entry & exit labels (optional visual display)
✅ Customizable RR and contract size
✅ Works on any instrument (ideal for indices, futures, or forex)
✅ Compatible with all timeframes (optimized for 1M–15M)
----------------------------------------------------------------------------------
----------------------------------------------------------------------------------
⚠️ Notes
-Best used on New York time-based charts.
-Designed for educational and backtesting purposes — not financial advice.
-Use as a foundation for further optimization (e.g., SMT confirmation, FVG filter, or time-based restrictions).
----------------------------------------------------------------------------------
----------------------------------------------------------------------------------
🧩 Recommended Use
Pair this with:
-ICT’s concepts like CISD (Change in State of Delivery) and FVGs (Fair Value Gaps)
-Higher timeframe liquidity maps
-Session bias or daily narrative filters
----------------------------------------------------------------------------------
----------------------------------------------------------------------------------
Author: jygirouard
Strategy Version: 1.3
Type: ICT Liquidity Sweep Automation
Timezone: America/New_York

Interval Highlighter with High/Low AlertsInterval Highlighter with High/Low Alerts
Overview:
This Pine Script indicator enhances chart analysis by highlighting specific time intervals and marking the highest and lowest prices within those periods. It supports three customizable modes:
Date Range: Highlight a user-defined period with background shading and plot the highest and lowest prices.
Days of the Week: Highlight specific weekdays with background colors and plot the highest and lowest prices for each day.
Intraday Interval: Highlight a specific intraday time range (e.g., 12:30 PM to 4:30 PM) with background shading and plot the highest and lowest prices within that interval.
Alerts are triggered when the price touches any of the highlighted high or low levels, providing real-time notifications for potential trading opportunities.
High and low lines extend to the right and remain visible after the interval ends. This ensures they act as actionable reference points for alerts between intervals, allowing users to monitor critical levels until a new interval of the same category forms.
Features:
Customizable Time Intervals: Define specific date ranges, weekdays, or intraday intervals to highlight on the chart.
High/Low Tracking: Automatically plots the highest and lowest prices within the defined intervals.
Real-Time Alerts: Set up alerts to notify when the price touches any of the highlighted high or low levels.
Actionable Lines: High/low lines remain visible after interval completion to serve as reference points for alerts.
Visual Enhancements: Customize background colors and line styles for each interval type.
Usage:
Apply the indicator to your chart.
Configure the desired modes (Date Range, Days of the Week, Intraday Interval) in the settings.
Customize the appearance settings to match your preferences.
Set up alerts based on the highlighted high/low levels.
Disclaimer:
This indicator is designed to assist in identifying potential areas of interest based on historical high and low levels within specified intervals. It is not intended as a standalone trading signal. Users should employ additional technical analysis tools and conduct thorough research before making trading decisions.

Weekly High/Low Weekday Stats by [M1rage]Патч: условная статистика по дню недельного экстремума
Добавлена новая функция, позволяющая строить условное распределение по дням недели.
Что нового.
Два новых параметра в настройках:
Condition: Weekly High on — зафиксировать день недели, в который сформировался недельный High.
Condition: Weekly Low on — зафиксировать день недели, в который сформировался недельный Low.
Таблица автоматически перестраивается:
Левая колонка показывает — вероятности минимума недели при выбранном дне максимума.
Правая колонка показывает — вероятности максимума недели при выбранном дне минимума.
В заголовках колонок появляется подпись формата:
Weekly Low | High=Tue
Weekly High | Low=Thu
---------------------------------------------------------------------------------------------------------------------
Patch: Conditional Statistics by Day of the Weekly Extremum
A new feature has been added that builds a conditional distribution by weekdays.
What’s new
Two new settings:
Condition: Weekly High on — fix the weekday on which the weekly High formed.
Condition: Weekly Low on — fix the weekday on which the weekly Low formed.
The table updates automatically:
Left column — probabilities of the weekly Low given the selected day of the High.
Right column — probabilities of the weekly High given the selected day of the Low.
Column headers now display labels in the format:
Weekly Low | High=Tue
Weekly High | Low=Thu
RTH Session Highs & LowsA Pine Script indicator designed to track and plot the Regular Trading Hours (RTH) session highs and lows on a chart, typically for U.S. equity markets (e.g., S&P 500, Nasdaq, etc.), which operate from 9:30 AM to 4:00 PM Eastern Time.
Session High & Low Lines:
During the RTH session, the indicator draws green and red horizontal lines that represent the highest and lowest price seen so far within that trading session.
These levels help traders identify intraday support (low) and resistance (high) levels.
New High/Low Markers:
Small triangle markers are placed:
Above the bar when a new intraday high is made (green triangle).
Below the bar when a new intraday low is made (red triangle).
This visually flags when momentum may be building or reversing.
Intraday Strategy Support:
Use the session high/low as dynamic support/resistance for scalping or breakout strategies.
For example:
Breakouts above session highs may indicate bullish strength.
Breakdowns below session lows may suggest bearish momentum.
Mean Reversion Tactics:
Prices approaching these lines and then rejecting can be used for mean reversion setups.
Combine with volume or candlestick patterns for confirmation.
Risk Management:
Set stops or targets relative to session highs/lows.
For instance, use session high as a stop-loss level in a short position.
Volatility Gauge:
Tracking how frequently new highs/lows are formed can help assess intraday volatility or range expansion.
Complement with Indicators:
Combine this with our "McGinley Dynamic Channel with Directional Shading" indicator or our "EMA Crossover with Shading" indicator to add context to breakouts or rejections.

Candlestick High/Low Labels📌 Indicator Name:
Candlestick High/Low Labels
🧠 Author:
Precious Life Dynamics (@Precious_Life)
📋 Description:
The Candlestick High/Low Labels indicator highlights recent price extremes by placing labels above highs and below lows of previous candles.
Additionally, it displays a live OHLCV dashboard in the bottom-right corner, offering a quick overview of recent market data.
This tool is especially useful for:
Identifying support/resistance levels
Tracking candle behavior
Visualizing volume trends in context
⚙️ How It Works:
🔸 High/Low Labels:
Each of the most recent candles (based on Candle Lookback) is annotated as follows:
🔹 Red label above each candle’s high
🔹 Green label below each candle’s low
🔹 Price values are rounded (no decimals)
🔹 Labels are dynamically updated; old ones are removed
🔹 Label visibility can be toggled via the Show Labels input
🔸 OHLCV Dashboard:
A real-time data table appears in the bottom-right corner of the chart.
It displays the last N candles (based on Dashboard Lookback) with the following fields:
🔹 Candle Number (1 = most recent)
🔹 Open, High, Low, Close
🔹 Volume
🔹 Values are rounded for readability
🔹 White background with black text ensures high visual clarity
🔧 Customizable Inputs:
✅ Candle Lookback → Number of candles to label (default: 10)
✅ Show Labels → Toggle High/Low label display on/off
✅ Dashboard Lookback → Number of candles shown in the OHLCV table (default: 10)
🎯 Use Cases:
🔹 Identify recent price extremes and reaction zones
🔹 Spot dynamic support and resistance levels
🔹 Observe how candles behave at swing highs/lows
🔹 Monitor volume activity in relation to price
🔹 Use as a clean visual tool for scalping and intraday trading
📝 Notes:
🔹 This indicator is purely visual – it does not generate trade signals
🔹 Best suited for traders who value clear, real-time price structure feedback

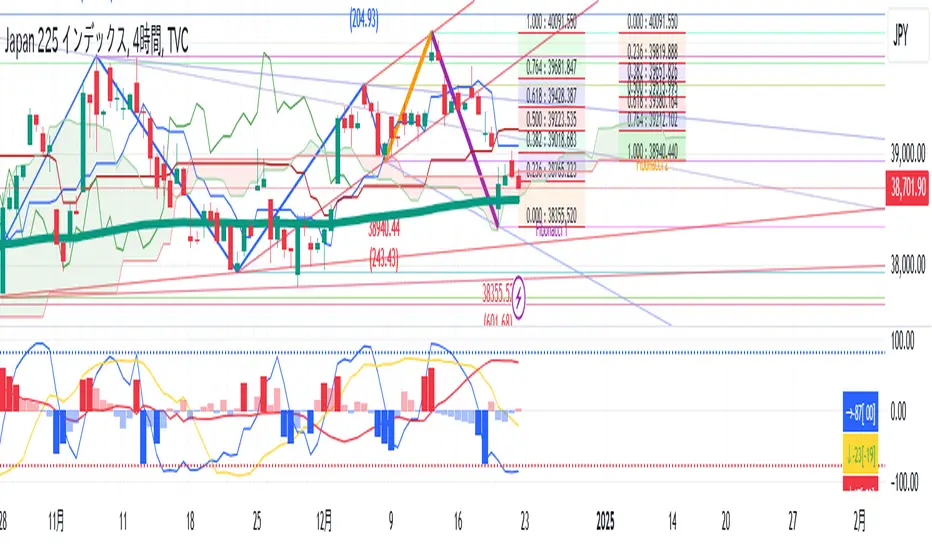
Intraday Pivot Highs & Lows (Asia London NY)Intraday Pivot Highs & Lows (Asia London NY)
Script Description
This TradingView indicator is optimized for Forex, scalping, intraday, and day trading strategies. It accurately plots Pivot Points and levels, high/low, support and resistance levels. These are clearly identified to aid the trader during killzone sessions and session opens. Ideal for scalp trading, intraday sessions, and leveraging SMT (Smart Money Techniques). Utilize these Price Levels effectively during London Open, NY Open, and the Asia Session, utilizing Market Structure to pinpoint key levels and reversal zones for successful trading. Improve your Trade Setups, recognize reliable Chart Patterns, identify critical Price Pivots, and trade confidently off Institutional Levels.
This script marks the intraday pivot highs, lows and midpoints retracement levels for
Asia
London
New York
It also plots the previous day's high, low, midpoint, and 0.618 Fibonacci retracement levels, providing traders with critical price reference points for making intraday trading decisions.
Originality & Usefulness
This indicator uniquely integrates pivot calculations across three major Forex sessions (Asia, London, NY), clearly delineating session boundaries.
It enhances visibility by using distinct styling
solid for New York
dashed for London
dotted lines for Asia
And colour co-ordinated labeling, improving traders' ability to identify important intraday price action zones efficiently. Unlike standard pivot indicators, this script emphasizes session-specific trading dynamics.
### Key Features ###
Session-Based Levels: Automatically plots high, low, midpoint, and Fibonacci (.618) levels for each major session (Asia, London, NY).
Distinct Visual Cues: Lines and labels use session-specific styles and colors to easily differentiate between sessions.
Previous Day Reference: Clearly plots and labels yesterday's high, low, midpoint, and Fibonacci levels.
Flexible Visibility: Traders can set timeframe visibility to maintain clean charts on higher timeframes.
### How It Works
At the start of next day's session, previous session lines are cleared, ensuring the chart remains uncluttered.
High, low, midpoint, and Fibonacci retracement levels (.618) are dynamically calculated and displayed at the close of each session.
All session levels remain visible until the start of the next respective session, providing continuous actionable insights.
Trading Application:
Session highs and lows act as strong intraday support and resistance zones.
Midpoints and Fibonacci levels are effective for identifying potential reversal zones and retracements.
Daily levels provide a broader context, useful for gauging intraday volatility and range.
### Limitations and Considerations ##
Best used on liquid assets with clear session-based price action, such as Forex major pairs, if used on indexes make sure they contain 24 hour price action not just New York session.
This indicator is designed to streamline intraday trading by clearly marking essential pivot points and session-based levels, significantly improving traders' market context and decision-making accuracy. Can be used to enhance SMT decision making when scalping killzones.

All-Time, Yearly & Monthly High/LowThis indicator visually tracks and displays:
• All-Time High (ATH) – The highest price the asset has ever reached
• All-Time Low (ATL) – The lowest price the asset has ever reached
• Yearly High/Low – The highest and lowest prices recorded in the current calendar year
• Monthly High/Low – The highest and lowest prices in the current calendar month
It helps traders quickly identify major support/resistance levels and historical price extremes across different timeframes. Level
Color
Updates When
All-Time High
Red
A new highest price ever is reached
All-Time Low
Green
A new lowest price ever is reached
Yearly High
Orange
New yearly high occurs or changes with new year
Yearly Low
Teal
New yearly low occurs or changes with new year
Monthly High
Fuchsia
New monthly high or at the start of each new month
Monthly Low
Navy Blue
New monthly low or at the start of each new month This indicator is especially useful for:
• Swing traders watching monthly or yearly trend zones
• Breakout traders looking to spot price levels where breakouts might occur
• Reversal traders using all-time levels for high-risk reward zones
• Long-term investors gauging historical extremes for entries/exits

Intraday Low Engulf Line This indicator currently work on Future product as it track the intraday low for the daily session from 6pm to 5pm EST. You may have to manually adjust the code if there is a time difference, or day light saving.
This indicator will track all new intraday low through out the session. Once a new intraday low is made, the indicator will display the high of that candle as an engulf target.
If the next candle making a intraday low, this engulf target will be updated. Until there is no more intraday low is made, we will see a engulf target line which is the high of the candle that make the most recent intraday low.
If there is any candle body is below the intraday low engulf life, you can expect to place a buy stop order to trade the bullish reversal.
You may want to use 5m or 15m, or 30M timeframe to reduce the noise of this indicator.
Your stop loss will be set at the intraday low. Therefore a higher time frame 5m is better for entry, however 1m timeframe will give you the best reward.
The idea is that Indraday low engulf line can be a target for bullish reversal or a bullish retest.
Another way to use this this intraday low engulf line is to treat it as a support. If the support break, the trend can be bearish too.
You have to develop your own price action strategy how to trade this.
I will also add an intraday High engulf indicator later.

NFP High/Low Levels PlusNFP High/Low Levels Plus
Description:
This indicator stores the 12 most recent NFP (Non-Farm-Payroll) days and their values.
Values are captured from 0830 (NFP Release) until close of market
The High and Low values for each NFP month are drawn on the chart with horizontal lines.
- Labels indicating the month's high or low line are placed after the line
- Optionally the high/low price can be displayed additionally
Support and Resistance boxes can be drawn at the closest NFP level above and below the
current price.
- Boxes will automatically update as prices cross the NFP value
Macro Indicator
- This option displays a small table in the top right corner that says "Up" or " Down"
- The Macro Indicator can be used to judge the potential direction for the current month
- Macro direction is calculated by the following:
- UP: If two consecutive days both open and close above the most recent NFP High level
- DOWN: If two consecutive days both open and close below the most recent NFP Low level
Micro Indicator
- This option displays a small table in the top right corner that says "Up" or " Down"
- The Micro Indicator can be used to judge the potential direction for low timeframes 1H or
lower
- Micro direction is calculated by the following:
- UP: If two consecutive 10m candles close above the 20EMA
- DOWN: If two consecutive 10m candles close below the 20EMA
NFP Session Bars
- This feature draws an arrow at the bottom of the chart for each candle that falls within the
NFP session day
- This is useful for identifying NFP Days
Support / Resistance Table
- This displays a table bottom center showing the nearest high and low NFP line level
What is an NFP Day and why is it useful to add to my chart?
- NFP Days are one of the most important data releases monthly
- NFP (Non-Farm-Payroll) is the official release of 80% of the US workforce employed in
manufacturing, construction, and goods
- It does not include those who work on farms, private households, non-profit and
government workers
- Historically these high/low levels for the day create strong support and resistance levels
- Having them displayed on the chart can help identify potential strong levels and pivot points
Full Indicator with all options enabled and identified
Easily update NFP Release Days in the indicator settings
Modify various options: Show/Hide lines, labels, directional indicator tables, values tables
Adjust line width, offsets, colors, font sizes, box widths
Enable individual Directional Indicators and modify colors
Example of full indicator enabled
You can find a list of the NFP Release Schedule on the official US Bureau of Labor Statistics website. This is useful for updating the indicator settings with the correct dates

Killzones & Previous High-Low Liquidity [odnac]This indicator is designed for use in intraday trading to visualize key "Killzones" (specific time windows during different global market sessions) and highlight liquidity levels based on previous highs and lows from the previous day and week.
It helps traders identify potential market entry and exit points based on time-based trading zones and price action levels.
Key Features:
Killzone (Market Session Timeframes):
Asia (2000-0000 UTC): Displays a shaded box over the Asia trading session.
Europe (0200-0500 UTC): Highlights the European trading session.
New York AM (0830-1100 UTC): Represents the morning session of the NY market.
New York PM (1330-1600 UTC): Represents the afternoon session of the NY market.
Each of these timeframes can be customized in terms of session start and end times, and the shaded areas will help identify high liquidity periods when the market tends to be more active.
Previous High-Low Liquidity Zones:
Previous Week's High/Low: Displays lines at the high and low of the previous week.
These are important liquidity levels that can influence price action.
Previous Day's High/Low: Shows the high and low from the previous trading day.
These are also significant levels to watch for potential support and resistance.
Filters and Customization:
Position Filtering: The indicator allows users to filter out previous highs or lows if the current price doesn't align with those levels.
For example, it can filter out previous week highs if the current price is lower than that level.
Vertical Lines: Optional vertical lines to highlight key time points such as the start and end of the previous week and day.
How It Works:
The indicator visually draws "killzones" as shaded regions on the chart, indicating periods of increased market activity.
This can help traders align their strategies with the most liquid periods of the day.
The previous high and low lines (both for the previous week and the previous day) are drawn as solid lines and can be toggled on/off in the settings.
Labels are added to indicate the specific levels and periods.
The indicator provides clear visual cues, helping traders assess if the price is near important liquidity levels and whether the current market conditions align with those levels.
Customizable Settings:
You can control whether each Killzone and liquidity level is shown on the chart.
Color customization for the various zones and lines is also available.
The indicator also lets you decide whether to hide weekend data, set time-frame limits, and choose whether or not to show vertical lines at the beginning and end of each trading session.
This indicator is aimed at traders who want to trade based on high-liquidity periods and understand where key support and resistance levels are likely to emerge based on previous price action.

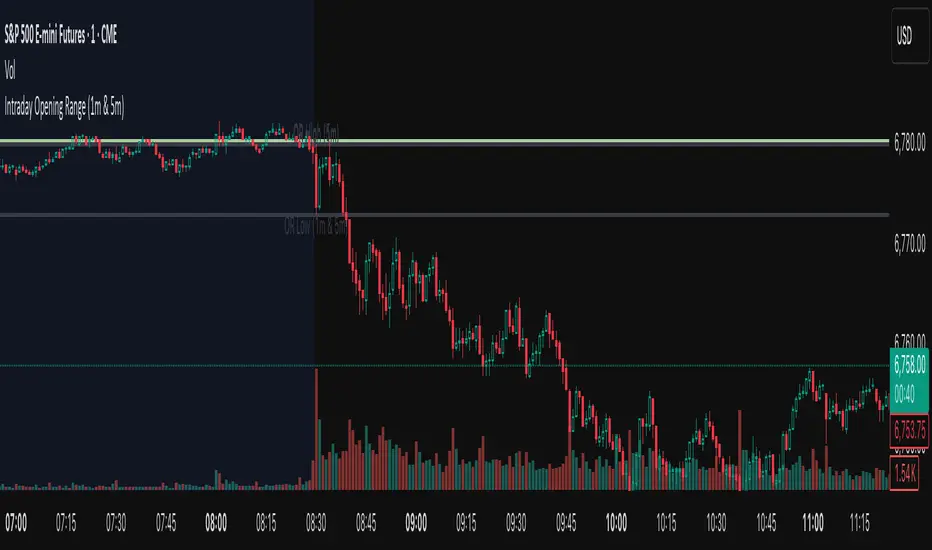
Opening Candle High/Low with Time Zone and Minute Offset
Title: Opening Candle High/Low with Time Zone and Minute Offset
Description:
The Opening Candle High/Low with Time Zone and Minute Offset indicator is a versatile tool that highlights the high and low of the first candle of the trading session, adjusted for your preferred time zone and minute offset. It is particularly useful for traders who focus on opening ranges as key reference points for their trading strategies.
---
Features:
1. Time Zone and Minute Adjustment:
- Allows customization of the start time by applying a time zone offset (in hours) and a minute offset.
- Ideal for traders operating in different time zones or trading sessions that don't align with midnight UTC.
2. Dynamic First Candle Detection:
- Automatically captures the high and low of the first candle after the adjusted time.
- Resets daily, ensuring accurate levels for each new trading session.
3. Visual Representation:
- Plots the high and low levels of the first candle directly on the chart for easy reference.
- Uses distinct colors (green for the high and red for the low) and adjustable line widths for clarity.
4. Simplicity and Versatility:
- Works across all markets and timeframes, providing essential information for opening range breakout strategies, support/resistance analysis, or session-based trading.
---
How It Works:
1. Time Adjustment:
- The indicator adjusts the current chart time by applying the user-defined hour and minute offsets.
- This ensures the "opening candle" aligns with your specific trading session requirements.
2. First Candle Detection:
- When the adjusted time matches the start of a new day (midnight with offsets), the indicator captures the high and low of the first candle.
- These values are stored and remain static throughout the trading day.
3. Plotting:
- The high and low levels of the opening candle are plotted on the chart, providing visual reference points for traders.
---
Use Case:
- This indicator is ideal for traders who rely on the opening range of a session for planning trades, such as breakout or reversal strategies.
- It can also serve as a key tool for identifying significant price levels in session-based trading.
Simplify your trading analysis and align your strategy with this customizable and intuitive indicator.

First 1-Minute Candle High/Low After Specific TimeDescription:
This indicator captures and marks the high and low of the first 1-minute candle after a specified time (default: 9:30 AM) and tracks the highs and lows of the first five candles. The levels marked by these initial candles are often critical in determining early session support and resistance, providing a visual guide for traders monitoring price action in the opening minutes of a trading session.
Key Features and Usage
1-Minute Candle High/Low: The indicator captures the high and low of the first 1-minute candle after the specified session start time. This level is marked with horizontal lines and labels, providing traders with an immediate reference for early-session price extremes.
5-Candle Range High/Low: After the first five candles, the indicator also highlights the highest and lowest levels within this range, offering additional support/resistance lines to aid in understanding early price movements.
Custom Labels and Dynamic Line Extension:
Labels update dynamically and display whether the 1-minute high/low coincides with the 5-minute range high/low, combining these labels if they match.
Horizontal lines extend to the current bar to remain visible throughout the session for consistent reference.
Customization Options
Colors and Label Text: Users can adjust colors for the 1-minute and 5-minute high/low lines and the label text for optimal readability.
Label Position Offset: Labels are placed slightly above or below their respective lines to avoid overlap with price action, maintaining clarity on the chart.
Intended Use
This indicator is especially useful for intraday traders focusing on opening range breakout strategies, scalping, or short-term trend analysis. It is intended for use on intraday charts (such as 1-minute or 5-minute intervals) and provides straightforward levels to assess early market structure.
Technical Details
Customization of Start Time: Users can change the default start time to any desired session opening time, adapting it to various markets or trading sessions.
Dynamic Line and Label Updates: Both lines and labels dynamically extend with the chart, while labels remain easy to read as they shift based on recent price action.
This script is designed to be simple yet powerful, offering key insights into session open levels without relying on predictive or lookahead features. It is useful for real-time analysis and adds value by helping traders identify critical levels in the market's early stages.
Enhanced High-Low Difference IndicatorEnhanced High-Low Difference Indicator
The "Enhanced High-Low Difference Indicator" is a powerful tool that highlights market volatility by tracking the difference between the high and low prices of a bar. Key features include:
Customizable Threshold: Set your own threshold for the high-low difference to filter out minor fluctuations.
Visual Highlights: Bars that exceed the threshold are highlighted with customizable color and opacity settings for easy identification.
Optional Labels: Display the exact high-low difference on the bars when the threshold is exceeded, with fully customizable label color and size.
High-Low Difference Line: Optionally plot a line that tracks the high-low difference of each bar for visual reference.
Alerts: Receive real-time alerts when the high-low difference exceeds your specified threshold.
Threshold Reference Line: Plot the threshold value as a horizontal reference line on the chart.
This indicator is ideal for traders looking to identify volatility spikes and make informed trading decisions based on price action.

Equal Highs and Lows {Reh's and Rel's }# Equal Highs and Lows {Reh's and Rel's} Indicator
## Overview
The "Equal Highs and Lows {Reh's and Rel's}" indicator is designed to identify and mark equal highs and lows on a price chart. It detects both exact and relative equal levels, draws lines connecting these levels, and optionally labels them. This tool can help traders identify potential support and resistance zones based on historical price levels.
## Key Features
1. **Exact and Relative Equality**: Detects both precise price matches and relative equality within a specified threshold.
2. **Customizable Appearance**: Allows users to adjust colors, line styles, and widths.
3. **Dynamic Line Management**: Automatically extends or removes lines based on ongoing price action.
4. **Labeling System**: Optional labels to identify types of equal levels (e.g., "Equal High", "REH/Equal High").
5. **Flexible Settings**: Adjustable parameters for lookback periods, maximum bars apart, and relative equality thresholds.
## User Inputs
### Appearance
- `lineColorHigh`: Color for lines marking equal highs (default: red)
- `lineColorLow`: Color for lines marking equal lows (default: green)
- `lineWidth`: Thickness of the lines (range: 1-5, default: 1)
- `lineStyle`: Style of the lines (options: Solid, Dash, Dotted)
- `showLabels`: Toggle to show or hide labels for equal highs and lows
### Settings
- `lookbackLength`: Number of bars to look back for finding equal highs and lows (default: 200)
- `maxBarsApart`: Maximum number of bars apart for equal highs/lows to be considered (range: 2-10, default: 5)
### Relative Equality
- `considerRelativeEquals`: Enable detection of relative equal highs and lows
- `thresholdIndex`: Maximum tick difference for relative equality in index instruments (range: 1-10, default: 2)
- `thresholdStocks`: Maximum tick difference for relative equality in stock instruments (range: 5-200, step: 5, default: 10)
## How It Works
The indicator scans historical price data to identify equal or relatively equal highs and lows. It draws lines connecting these levels and updates them as new price data comes in. Lines are extended if the level holds and removed if the price breaks through. The tool adapts to different market conditions by allowing adjustments to the equality thresholds for various instrument types.
## Practical Use
Traders can use this indicator to:
- Identify potential support and resistance levels
- Spot areas where price might react based on historical turning points
- Enhance their understanding of price structure and repetitive patterns
## Disclaimer
This indicator is provided as a tool to assist in identifying potential price levels of interest. It is not financial advice. Users should not rely solely on this or any single indicator for trading decisions. Always conduct thorough analysis, consider multiple factors, and be aware that past price behavior does not guarantee future results. All trading involves risk.

Equal Highs and LowsDescription:
The "Equal Highs and Lows" indicator is a technical analysis tool designed to aid traders by identifying and marking equal price levels directly on the trading chart. This indicator helps in spotting potential support and resistance zones by drawing lines between points where the price has formed equal highs or lows over a specified lookback period. It's a versatile tool that can be customized to fit various trading strategies and chart setups.
Features:
Customization Options: Users can adjust the appearance of the lines (color, width, and style) to match their chart setup or preferences.
User-Defined Lookback Length: The number of bars to look back for finding equal highs and lows can be set by the user, allowing for flexibility in different market conditions.
Debug Labels: An optional feature that provides labels at the points of equal highs and lows, useful for analysis and understanding the indicator's workings.
How It Works:
The indicator scans the chart within the user-defined lookback length to find bars where the high or low matches that of the current bar. When such a match is found, a line is drawn connecting these points. This process is repeated for each bar, ensuring that all significant levels of equal highs and lows are marked. The indicator is designed to be intuitive and does not predict future market movements but rather highlights important price levels based on historical data.
Usage:
Identifying Support and Resistance: The lines drawn by the indicator can be used to identify potential support and resistance zones, which are crucial for making informed trading decisions.
Strategy Development: Traders can incorporate the visual cues provided by the indicator into their trading strategies, using them as one of the factors for entry or exit decisions.
Originality:
This indicator offers a unique approach to identifying and visualizing equal highs and lows, providing traders with a clear view of significant price levels. Unlike standard indicators, it allows for extensive customization and applies an innovative method to enhance chart analysis.
Conclusion:
The "Equal Highs and Lows" indicator is a practical tool for traders looking to enhance their chart analysis with visual cues of significant price levels. Its customization options and innovative approach make it a valuable addition to the trading toolkit, suitable for various trading styles and strategies.

Previous Day High Low Strategy only for LongWelcome to the "Previous Day High Low Strategy only for Long"!.
This strategy aims to identify potential long trading opportunities based on the previous day's high and low prices, along with certain market strength conditions.
Key Features:
Entry Conditions: The strategy triggers a long position when the current day's closing price crosses above the previous day's high or low.
Market Strength Filter: The strategy incorporates a market strength filter using the Average Directional Index (ADX). It only takes long positions when the ADX value is above a specific threshold and when there is a predominance of upward movement.
Trade Timing: The strategy operates within a specified trade window, starting at 09:30 and ending at 15:10. Positions are closed at 15:15 if still active.
Risk Management: The strategy employs dynamic stop-loss and profit-taking levels based on a user-defined Max Profit value. It has three profit targets (T1, T2, T3) and a stop-loss level to manage risk effectively.
Rules:
Ensure that the strategy idea is clearly understandable. Provide an easy-to-read title and a thoughtful description explaining the reasoning behind the strategy.
All content should be ad-free. Avoid any form of promotion, advertising, or solicitation.
No fundraising requests or money solicitation is allowed on TradingView.
Publish in the same language as the TradingView subdomain you're on, except for script titles, which must be in English.
Don't plagiarize. Create and share only unique content, and always give credit when using someone else's work.
Be respectful, kind, and constructive when engaging with others.
Zero tolerance for contentious political discourse, defamatory, threatening, or discriminatory remarks.
Avoid sharing harmful, misleading, or inappropriate content.
Respect the moderators' work and address complaints privately.
Use only your original account and avoid creating duplicate or fake accounts.
Do not attempt to manipulate the reputation system or engage in like-for-like schemes.
Explanation of how the strategy works
1. Previous Day's High and Low (HH, LL):
In this strategy, we start by obtaining the high and low prices of the previous day (not the current day) using the request.security function. This function allows us to access historical data for a specific time frame. The high and low prices are stored in the variables HH and LL, respectively.
2. Entry Conditions:
The strategy uses two conditions to trigger a long position:
Condition 1 (Long Condition 1): If the closing price of the current day crosses above the previous day's high (HH), it generates a long signal. This is achieved using the ta.crossover function, which detects when a crossover occurs.
Condition 2 (Long Condition 2): Similarly, if the closing price of the current day crosses above the previous day's low (LL), it also generates a long signal.
Combined Condition: To take long positions, the strategy combines both long conditions using the logical OR operator (or). This means that if either of the two conditions is met, a long position will be initiated.
3. Market Strength Filter:
The strategy also includes a filter based on the Average Directional Index (ADX) to gauge the market's strength before taking long positions. The ADX measures the strength of a trend in the market. The higher the ADX value, the stronger the trend.
Calculation of ADX: The ADX is calculated using the adx function, which takes two parameters: LWdilength (DMI Length) and LWadxlength (ADX period).
Strength Condition (strength_up): The strategy requires that the ADX value should be above a threshold (11 in this case) and that there is a predominance of upward movement (up > down) before initiating a long position. The LWADX value is multiplied by 2.5 and compared to the highest value of LWADX from the last 4 periods using ta.highest(LWADX , 4). If these conditions are met, the variable strength_up is set to true.
Combined Condition: The strength_up condition is then combined with the long conditions using the logical AND operator (and). This means that the strategy will only take a long position if both the long conditions and the market strength condition are met.
4. Trade Timing:
The strategy sets a specific trade window between 09:30 and 15:10. It will only execute trades within this time frame (TradeTime).
5. Risk Management:
The strategy implements dynamic stop-loss (SL) and profit-taking levels (T1, T2, T3) based on a user-defined Max Profit value. The stop-loss is set as a percentage of the Max Profit value. As the position moves in favor of the trader, the profit targets are adjusted accordingly.
6. Position Management:
The strategy uses the strategy.entry function to enter long positions based on the combined entry conditions. Once a position is open, the script uses strategy.exit to define the exit condition when either the profit target or stop-loss level is hit. The strategy.close function is used to close any open position at the end of the trade window (15:15).
7. Plotting:
The strategy uses the plot function to visualize the previous day's high and low prices, as well as the stop-loss (SL) and profit-taking (T1, T2, T3) levels on the chart.
Overall, the "Previous Day High Low Strategy only for Long" aims to identify potential long trading opportunities based on the previous day's price action and market strength conditions. However, as with any trading strategy, it's essential to thoroughly test it and consider risk management before applying it to real-world trading scenarios.
Disclaimer:
The information presented by this strategy is for educational purposes only and should not be considered as investment advice. The strategy is not designed for qualified investors. Always conduct your own research and consult with a financial advisor before making any trading decisions.
Remember, the success of any trading strategy depends on various factors, including market conditions, risk management, and individual trading skills. Past performance is not indicative of future results.

Yearly High & LowThe "Yearly High & Low" indicator shows the yearly high and low prices on the chart, providing you with key price levels for each year. It helps you identify significant price ranges and potential support and resistance areas.
Features:
Start Year and End Year: Define the starting and ending years to display the highs and lows within a specific period.
Show Highs and Lows: Toggle the visibility of the yearly high and low lines to focus on specific price levels.
Show Price: Display the price alongside the yearly high and low labels for precise price level identification.
High Colour and Low Colour: Customise the colour of the yearly high and low lines to match your chart preferences.

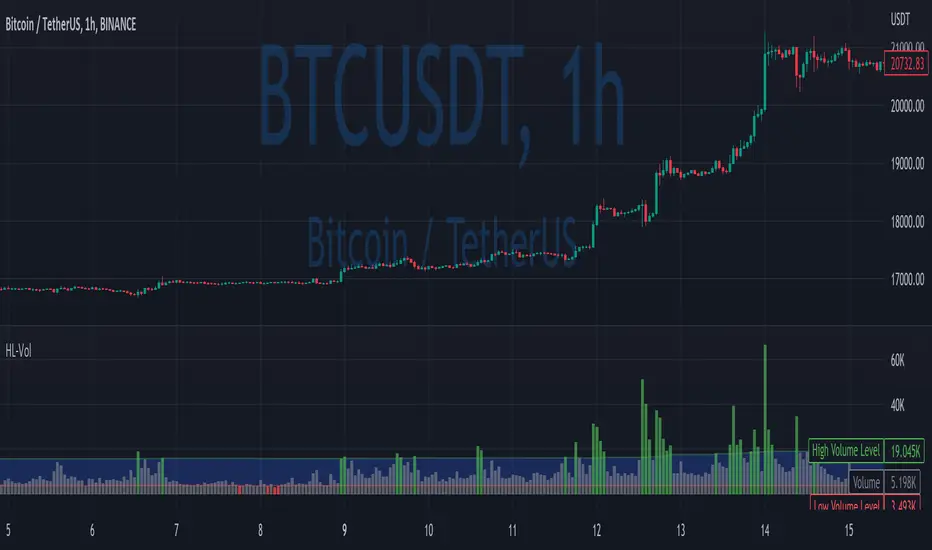
High/Low VolumeIn this indicator, I show you a better way to define high/low values of volume (or any other indicator).
Quite often, I get requests from my clients that an indicator level should be “high” or that it should be above a certain absolute level.
The first request is hard to interpret mathematically, but traders can easily spot it on the chart. The second one is not flexible, and it might not make sense in another market regime.
To solve that, you can compute dynamic high/low levels that represent unexpected extreme values that are adaptable to recent conditions.
There are two pretty simple methods I’m using quite often in my scripts percentiles and sigma (standard deviations).
Percentile looks back at X bars and computes the value under which a certain % of data points are located. So, for example, if we’re computing 90%tile and we’re looking at 100 bars, we’ll get a value under which we have values of precisely 90 bars for this indicator. It’s a good idea to use something like 5%tile for low level and 95%tile for high level.
Sigma(σ) is related to standard deviation. If we assume that our data is normally distributed, then 68% of data points should be in the range of mean +-1σ, 95% → mean +-2σ. So we can assume that something above 2σ is a pretty rare and extreme event.
In this script, I give you an example of how to compute both on volume, but you can easily change this to another indicator.
The issue with volume is that it’s not normally distributed, and your low level will be quite often too low to detect any low levels. Ideally, we have to use a more sophisticated formula that fits volume distribution better.
In this indicator, you can set the following parameters:
Choose type: Percentile or Sigma
Lookback Period
High/Low Percentiles
Sigmas #
You can also receive alerts for high/low volume events.
Disclaimer
Please remember that past performance may not indicate future results.
Due to various factors, including changing market conditions, the strategy may no longer perform as well as in historical backtesting.
This post and the script don’t provide any financial advice.
Scalping The Bull IndicatorName: Scalping The Bull Indicator
Category: Scalping, Trend Following, Mean Reversion.
Timeframe: 1M, 5M, 30M, 1D depending on the specific technique.
Technical Analysis: The indicator supports the operations of the trader named "Scalping The Bull" which uses price action and exponential moving averages.
Suggested usage: Altcoin showing strong trends for scalping and intra-day trades. Trigger points are used as entry and exit points and to be used to understand when a signal has more power.
It is possible to identify the following conformations:
Shimano: look at the price records of a consecutive series of closings between the EMA 60 and the EMA 223 when a certain threshold is reached. Use the trigger points as price structures to identify entry and exit zones (e.g. breakout of the yesterday high as for entry point) .
Bomb: look at the price registers a percentage variation in a single candle, greater than a threshold such as 2%, in particular on shorter timeframes and around the trigger points.
Viagra: look at there is a consecutive series of closes below the EMA 10.
Downward fake: look when, after a cross under (Death Cross), the price returns above the EMA 223 using the yesterday high as a trigger point.
Emergence: look at the EMA 60 is about to cross over the EMA 223.
Anti-crossing: look at, after an important price rise and a subsequent retracement, the EMA 60 is about to cross under the EMA 223 but a bullish impulse brings the price back above the EMAs.
For Sales: look at two types of situations: 1) when the price falls by more than 10% from the opening price and around the yesterday’s low or 2) when the price falls and then reaches, in the last 5 days, a bigger percentage and then breaks a trigger point.
Colour change: look at the opening price of the session - indicated as a trigger point.
Third touch of EMA 60: look for 3 touches below the EMA 60, and enter when there is a close above the EMA 60.
Third touch of EMA 223: look for 3 touches when there are 3 touches below the EMA 223, and enter when there is a close above the EMA 60.
Bud: look at price when it crosses upwards the average 10 and subsequently at least 2 "rest" candles are between the maximum and minimum of the breaking candle.
Fake on EMA 10: look for the open of a candle higher than the EMA 10, the minimum of the candle lower and the closing price returns above the EMA 10..
For Stop Loss and Profit Targets consider a proper R/R depending on Risk Management, using price structures such as the low of the entering candle and a quick Position Management moving quickly the Stop-Loss at Break-Even.
Configuration:
Market
EMA: The indicator automatically configure itself on market it knows (Binance, Piazza Affari and NASDAQ) otherwise it can be configured manually fo Crypto market (5/10/60/223) or Stock Market (5/10/50/200).
Additional Average: You can display an additional average, e.g. 20-period average.
Chart elements:
Session Separators: indicates the beginning of the current session (in blue)
Background: signals with the background in green an uptrend situation ( 60 > 223) and in red background a downtrend situation (60 < 223).
Trigger points:
Today's highs and lows: draw on the chart the opening price of the daily candle and the highs and lows of the day (high in purple, low in red and open in green)
Yesterday's highs and lows: draw on the chart the opening price of the daily candle, the highs and lows of the previous day (high in yellow, low in red).
Credits
Massimo : for refactoring and suggestions.
