G-MACD ColorIt's just MACD and fill the color
How to use
RED : MACD < Signal line and MACD < 0
Blue : MACD > Signal line and MACD < 0
GREEN : MACD > Signal liine and MACD > 0
Yellow : MACD < Signal line and MACD < 0
Goodluck :D
חפש סקריפטים עבור "macd"

SMACD - Standardised MACDStandardised MACD - this uses the MACD indicator, but expressed as a percentage of Close price. This allows for the relative comparison between stocks which have different absolute values. MACD will give a high value to a high priced stock, whereas SMACD will represent stock performance in a standardised format, relative to the closing price of the stock. It effect it represents the MACD as a percentage of share price. An added advantage of SMACD over MACD is that since the indicator is relative to the price, later values are not inflated (assuming rising trend). Thus the scale is not linear, rather it more like a log scale, offering a truer picture of growth over time. It is for this reason the SMACD lines may slightly differ from MACD, but it is a more valid representation in my view. The difference is minor. (Developed by Des Bleakley - Melbourne)

BTC Scalping 3m | Supertrend + MACD Squeeze (NY) [v6 FINAL]BTC 3-Minute Scalping Strategy
Supertrend Bias + MACD Squeeze (New York Session)
This is a fully mechanical BTC scalping strategy designed to capture short momentum bursts that occur when volatility expands in the direction of the higher-timeframe trend.
The strategy combines trend confirmation, volatility compression/expansion, and strict session filtering to reduce noise and improve consistency.
How It Works
Trend Bias
Uses a 15-minute Supertrend to define market direction.
Trades are taken only in the direction of the higher-timeframe trend.
Counter-trend signals are ignored.
Timing & Entry
Executes on the 3-minute chart.
Waits for volatility compression using a LazyBear-style MACD Squeeze.
Enters only when the squeeze releases and momentum turns positive.
Entry occurs on candle close above the execution-timeframe Supertrend.
Session Filter
Trades only during the New York session (13:00–21:00 UTC).
This avoids low-liquidity periods and reduces false breakouts.
Risk & Exits
Dynamic stop-loss placed at the execution-timeframe Supertrend.
Risk is calculated using the actual filled entry price for accurate R-based exits.
Primary profit target is 0.5R, optimized for scalping.
Positions are exited immediately if:
Price closes against Supertrend
Supertrend flips direction
Momentum (MACD histogram) turns negative
Trades are typically short-lived (1–3 candles), keeping exposure minimal.
Key Characteristics
Non-repainting logic
Fully rule-based (no discretion)
High win-rate, low-RR scalping profile
Designed for BTC futures/perpetuals
Optimized for New York session volatility
Usage Notes
Run on BTC 3-minute charts
Best results during active NY hours
Performance will vary by exchange, fees, and slippage
This strategy is intended for education and testing, not financial advice
Summary
This strategy focuses on trading volatility expansion aligned with trend, using Supertrend for structure and MACD Squeeze for timing. By restricting trades to high-liquidity hours and enforcing strict exits, it aims for consistent, repeatable scalps rather than large directional bets.

Waduji MACD with Timeframe This indicator will not change any setting or information for standard MACD but only display selected timeframe on MACD this will be helpful for the traders who trade purely MTF MACD

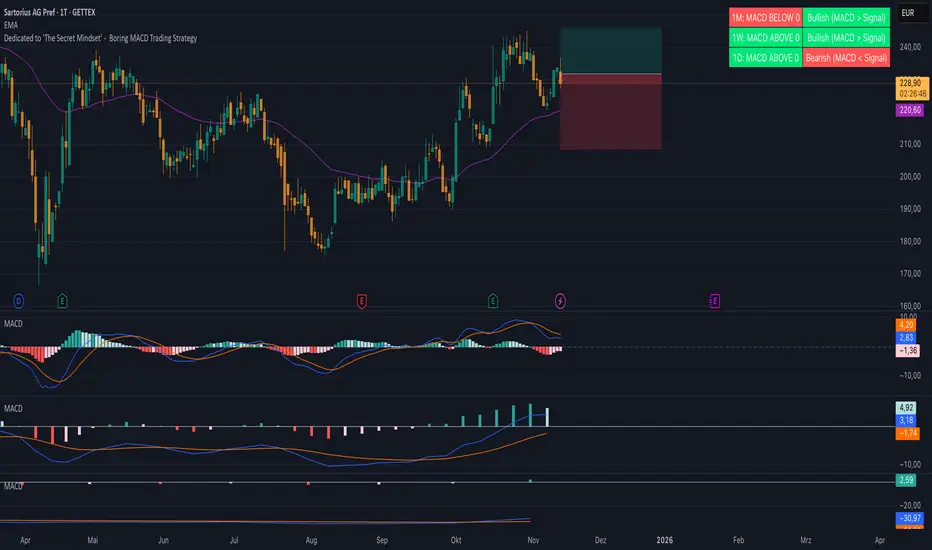
Boring MACD Trading Strategy - Dedicated to 'The Secret Mindset'This indicator displays the MACD status across three selectable timeframes, regardless of the chart timeframe you are currently viewing.
For each timeframe, it shows whether the MACD line is above or below the zero line, indicating bullish or bearish momentum.
It also shows whether the MACD line is above or below the signal line, revealing the current trend condition as bullish, bearish, or neutral.

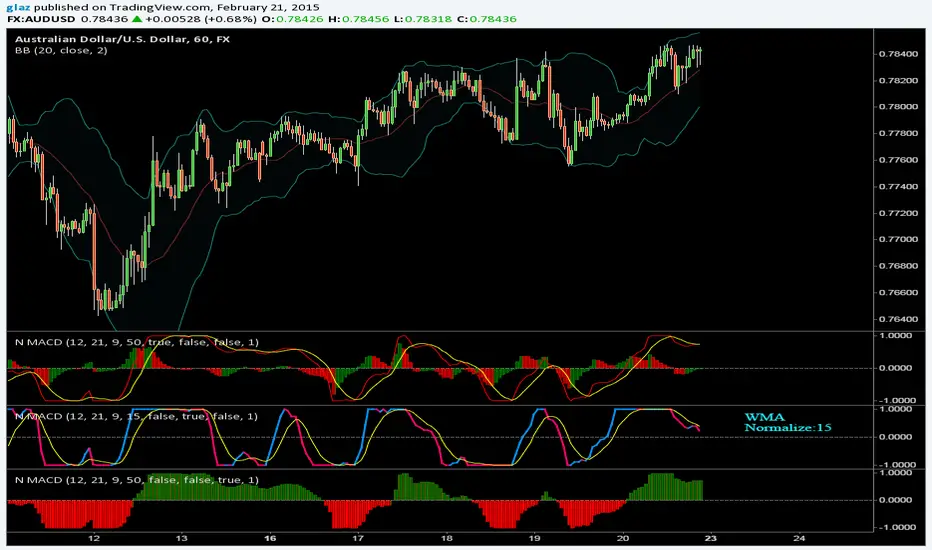
Multi Color Normalized MACD + Candles (NMACD) [cI8DH]One simple indicator for volatility, divergence and relative momentum
Features:
- Normalized MACD (by slow MA)
- Candle MACD (fast MA length is set to 0 in candle mode, i.e. price minus slow MA)
- Multi color histogram
- Background coloring based on MACD direction
- Choice of different MA types (Exponential, Simple, Weighted, Smoothed, Triple EMA)
- Triple EMA smoothing
Benefits of normalization:
- Absolutely better than RSI for comparing across different periods and assets
Applications and benefits of candle visualization:
- Zero cross: most traders use MAs overlaid on the main chart and look for price distance and MA cross visually. In candle mode, this indicator measures the difference between price and the slow moving MA. When this indicator crosses zero, it means price is crossing the slow moving MA.
- Divergence: full candle visualization (OHLC) is not possible for most other indicators. Candle visualization allows measuring divergence between price high, low and close simultaneously. Some trades incorrectly measure divergence between high, low of price against indicator tops and bottoms while having the indicator input set to default (usually close). With this indicator, you don't need to worry about such complexities.
Recommended setting:
- Enjoy candle mode :)
- Source set to hlc3

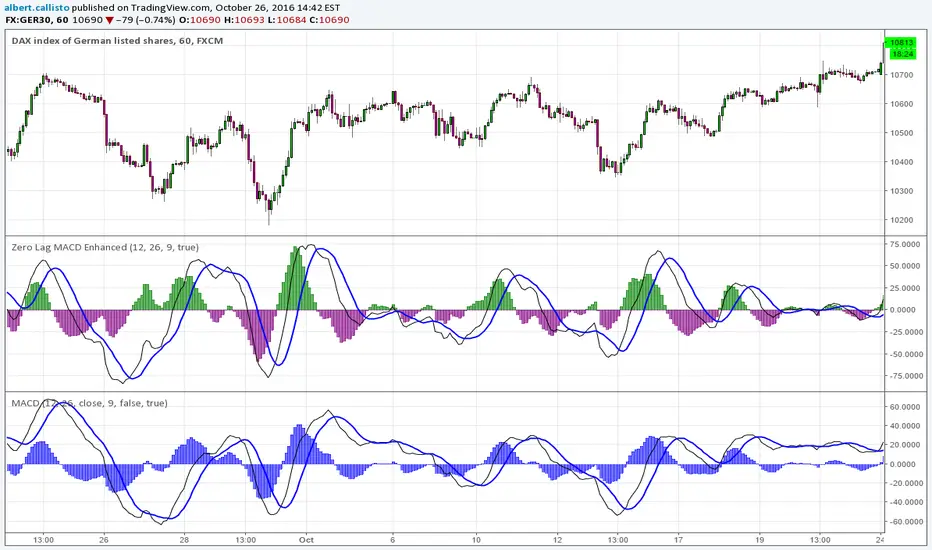
Zero Lag MACD Enhanced - Version 1.0*Zero Lag MACD indicator - Enhanced version 1.0*
Based on ZeroLag EMA - see Technical Analysis of Stocks and Commodities, April 2000
Original version by user Glaz. Thanks ! (see at the end of this description).
Tweaked by Albert Callisto
Displayed components:
Fast and slow "zero lag" moving averages
Histogram showing delta between the two moving averages
You can choose between SMA or EMA for the moving averages. They give slightly different results. Glaz had used SMA instead of EMA. Most "zero MACD" scripts are based upon EMA.
Usage is similar to the classic MACD and it can be integrated in an existing strategy, you will notice the crossing occurs earlier.
This is the original version by Glaz:
Normalized MACDNormalized MACD
There are varius options like choosing the moving average to use, sometimes i prefer the wma it is much smoother
Added also macd line to swap color and Fill that plots columns
BR Cross Swing - MACD HistRawThis strategy looks at the MACD Relationship through the same logic but mainly focuses on breaking things down and the application on raw values.

Sharktank - MACD ExtendedThe MACD, but with added features. Features are:
* Different color schemes.
* Change between different MA types (EMA and SMA) for both the oscillator and the signal MA.
* Show normal bearish and bullish divergence on both the oscillator and the signal MA.
* Show hidden bearish and bullish divergence on both the oscillator MA and the signal MA.
* Change line styles.

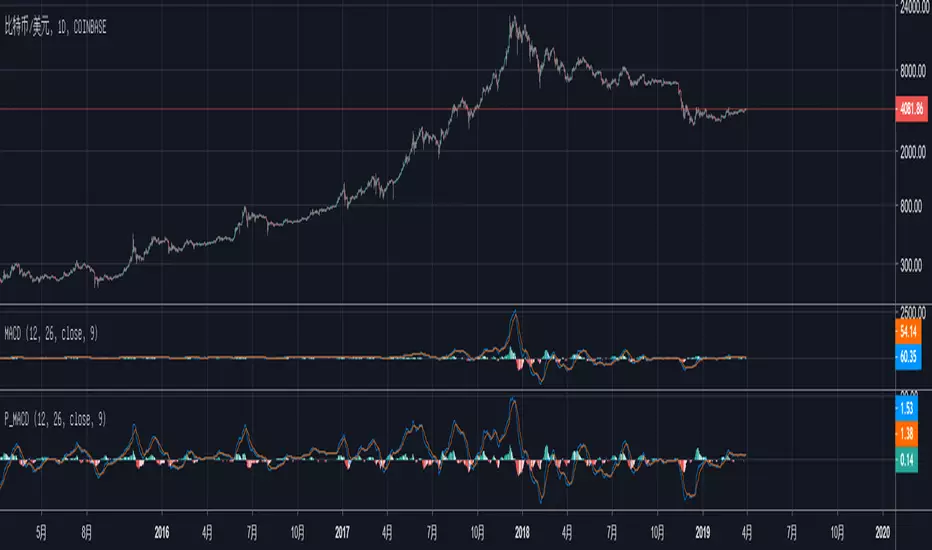
Percentage MACDPercentage MACD number range won't change with the great price change.
Convenient for log scale.
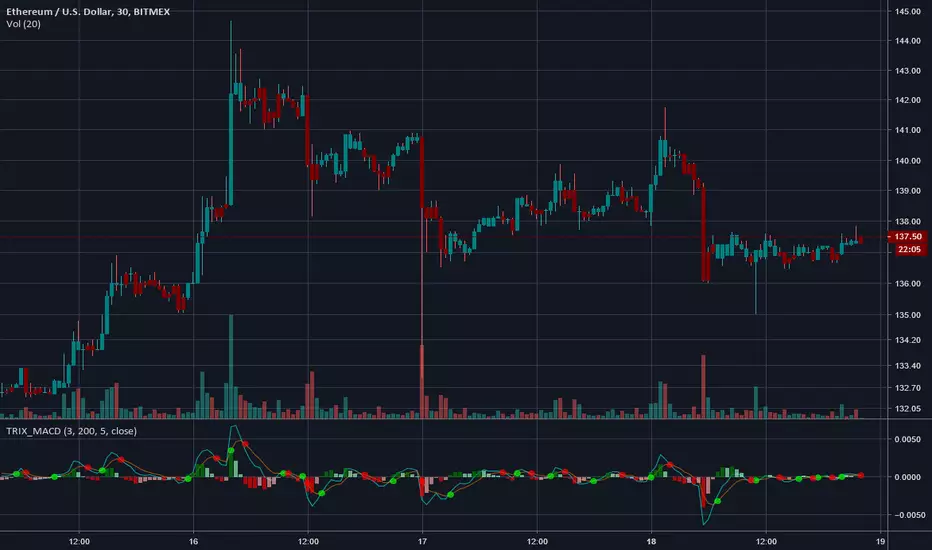
TRIX MACDAn experiment using TRIX to construct a MACD instead of the standard EMAs.
Warning - colors bars (can be disabled in settings)
Optional volume weighting.
-----------------------------------------------------------------------------------
If you find it useful please consider a tip/donation : BTC - 3BMEXEDyWJ58eXUEALYPadbn1wwWKmf6sA
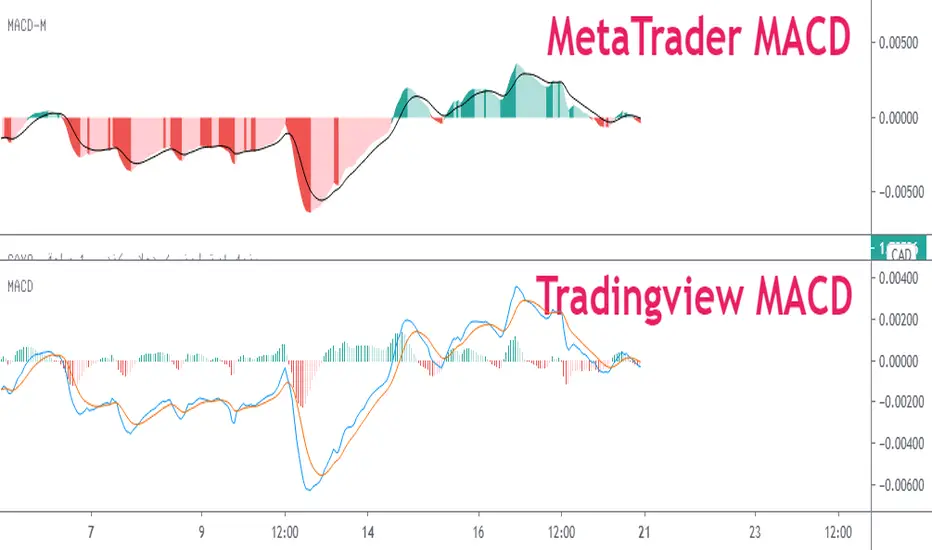
Multicolor MACD 12 & 26 periodIf you're tired of the single colored MACD indicator on TradingView, this is a good alternative. Setup with the same 12 & 26 day periods but has clear green/red histogram.
Riz Coloured MACD - StudyThis is a souped up common or garden MACD . The Histogram is coloured giving a clear visual representation of where we are UpTicking or DownTicking on the Histogram to help support trading decisions.
When colour changes from pink to green market is bullish , and visa versa.
Very useful as a supporting indicator to confirm other strategies, or even as a standalone strategy to some extent.
Backtesting of strategy is enabled by converting script from a Study to a strategy, see comments in code. This version focuses on this indicators use as a day to day study rather than a useful strategy for automated trading.

Riz Coloured MACDThis is a souped up common or garden MACD . The Histogram is coloured giving a clear visual representation of where we are UpTicking or DownTicking on the Histogram to help support trading decisions.
When colour changes from pink to green market is bullish , and visa versa.
Very useful as a supporting indicator to confirm other strategies, or even as a standalone strategy to some extent.
Alerts are enabled by converting script from a Strategy to a Study, see comments in code.

Zero Lag MACD Enhanced - Version 1.2ENHANCED ZERO LAG MACD
Version 1.2
Based on ZeroLag EMA - see Technical Analysis of Stocks and Commodities , April 0.21% 2000
Original version by user Glaz. Thanks !
Ideas and code from @yassotreyo version.
Tweaked by Albert Callisto ( AC )
New features:
On request by a user, added symbols to show the histogram crossing, can be either circles, cross symbols, a vertical bar. Colors can be chosen. You can also set the distance between the main axis and the symbols which are shown along the signal curve path.


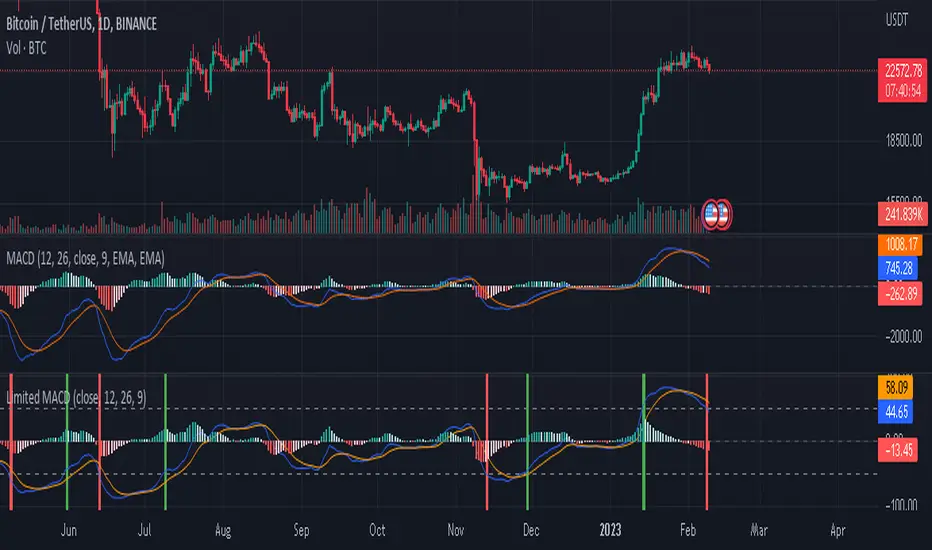
Limited MACDwhat is "Limited MACD"?
it is macd but it has some useful additional features.
what it does?
it takes limited values ??just like rsi. The highest value it can take is 100 and the lowest value is -100. this way it gets the same highs and lows for different symbols and time slots. which means we can set overbought and oversold values ??with it. he also paints candles according to their values. The closer the price is to the oversold values, the more red, and the closer to the overbought values, the greener.
how it does it?
macd values ??are limited by dividing by extreme values. The macd value is used as the variable for the color.rgb function, this is used to get a different color for each macd value.
how to use it?
The variables in the settings section are the same as standard macd.
Use the colors to identify overbought and oversold zones and to predict possible price reversal points. also the indicator will mark possible turning points. other than that, its use is similar to standard macd and its limits are up to your imagination.
four hour:
one hour:
five minute: