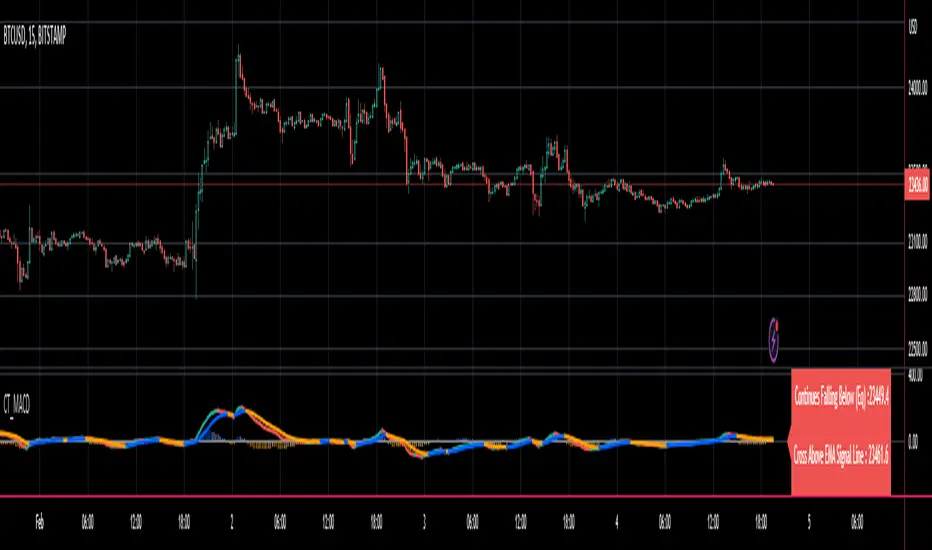
MACD including 6-period Forecast and Divergences█ OVERVIEW
This is my personal interpretation of the classic MACD Indicator. I am using the MACD as part of my analysis, and often I was wondering when I can expect the next signal (e.g. a Histogram cross). As I had come across some EMA forecast logics on tradingview, my goal was to use the EMA forecast calculation as basis to come to a complete MACD forecast. Here is the result.
Starting point is the classic MACD which is then plotted with MACD-Line, Signal Line and Histogram. In addition to the classic MACD, a 6 period Forecast for MACD, Signal and Histogram is available and divergences can be displayed on either the Histogram or the MACD Line.
Important:
As I am considering the closing price of the current candle as the basis for the calculation, the forecast values will REPAINT. But in my opinion this is fine as this indicator will not provide direct trading signals, but more an outlook into a potential future.
█ CALCULATION LOGIC
Below some details regarding the additional functionalities:
MACD Forecast:
The MACD Forecast is mainly based on a combination of EMA Forecasts. The inspiration for this basic forecast calculation is taken from the below tradingview members:
--> EMA Forecast input taken from "Triple MA Forecast" by yatrader2
--> Forecast Bias input taken from "Fancy Bollinger Bands" by BigBitsIO
When showing the forecast, the following options are available:
- Forecast Type: Determines if the Forecast is assuming a Flat price (last values of the MA calculation are replaced by current value) or if a Linear Regression is taken
- Number of candles taken for Linear Regression Calculation
- Bias of Forecast (Based on the recent Average True Range, the forecast values are either more bullish or more bearish calculated. "Neutral" turns off this function)
- Number of ATR Periods used to calculate Bias adjustment value
- Possibility to weight the Bias via a Multiplier - Default value is 1
Based on the above inputs, the forecasted values for MACD, Signal Line and Histogram are calculated and plotted for the next 6 periods.
Divergence Detection:
Based on the default tradingview divergence script with some adjustments:
- User can select to use either Histogram or MACD Line as basis for Divergence detection (Histogram by default)
- User can select if Divergence detection should be based on the candles including Wicks or only the Candle Bodies (Wicks by default)
█ DISCLAIMER
This is an experimental indicator and I do not know if my theory works in real life. So treat this not as financial advise, but purely for entertainment and educational purposes.
I publish this code open so that everyone can re-use it or hopefully even improve it.
Let me know if you have any ideas for improvement and if it is within my coding capabilities (which to be honest are quite limited), I will try to accomodate it.
Have fun.
חפש סקריפטים עבור "macd"

RedK_xMACD: Extending the classic MACD with a simple filterThis is a simple concept that attempts to squeeze more price action insights from the classic MACD
we add a 3rd (longer length, slower) Moving Average line that acts as a trend filter - so whenever we are ("we" = the price and the 2 other MAs) are above that filter line, we consider ourselves to be in the up-trend territory, and vica versa .. so the MACD calculation here - that is represented by the main (reg/green) line in the plot - will represent the distance between the slow MA and the filter MA - when that MACD line crosses the zero axis up or down, that represents the trand reversing from one direction to the other.
A signal line (a smoothed version of that MACD line) is still added for 2 reasons
1 - the signal line makes it easy to see if an eminent trend reversal is to be expected
2 - to stay visually-consistent with the classic MACD :)
the distance (or delta) between the other 2 MAs continues to reflect an indication of the short-term momentum and is what the histogram represents.
we still have the benefit of the convergence/diversion between the price itself and the histogram similar to the classic MACD
this MACD version will also clearly show how price and momentum action will lead the trend -- i know that's a big discussion topic :)
i added a classic MACD at the bottom panel, and used the same length settings (fast / slow) for side-by-side comparison
i coded this when i found that i use 3 moving averages all the time during my chart analysis, and while i'm a big fan of the classic MACD, i wanted to find a simple way to get my MACD to reflect what the 3 MAs on the price chart show. turned out to be insightful - i hope other fellow traders may find this useful
the code is simple and i started it from the built-in MACD in TradingView. Other annotations are added to the chart here as i believe this will better explain how the eXtended MACD works
- there are 4 reversals that occur in that chart, and i chose to show one in step-by-step fashion.
if more explanation is needed to how this can be used, pls let me know in the comments.

Reverse MACD IndicatorIntroducing the reverse MACD Indicator.
This is my Pinescript implementation of the reverse MACD indicator.
Much respect to Mr Johnny Dough the original creator of this idea.
Feel free to reuse this script, drop me a note below if you find this useful.
Investopedia defines the MACD as a trend-following momentum indicator that shows the relationship between two moving averages of a security’s price.
The MACD is calculated by subtracting the 26-period Exponential Moving Average ( EMA ) from the 12-period EMA .
The result of that calculation is the MACD line.
A nine-day EMA of the MACD called the "signal line," is then plotted on top of the MACD line, which can function as a trigger for buy and sell signals.
Traders may buy the security when the MACD crosses above its signal line and sell—or short—the security when the MACD crosses below the signal line.
Moving Average Convergence Divergence ( MACD ) indicators can be interpreted in several ways, but the more common methods are crossovers, divergences, and rapid rises/falls.
MACD triggers technical signals when it crosses above (to buy) or below (to sell) its signal line.
The speed of crossovers is also taken as a signal of a market is overbought or oversold.
MACD helps investors understand whether the bullish or bearish movement in the price is strengthening or weakening.
The MACD has a positive value (shown as the red line on the price chart ) whenever the 12-period EMA ( indicated by the blue line on the price chart) is above the 26-period EMA (the red line in the price chart) and a negative value when the 12-period EMA is below the 26-period EMA .
The more distant the MACD is above or below its baseline indicates that the distance between the two EMAs is growing.
The baseline here is the white line.
The Reverse function of the MACD provides value by letting the user know the specific price needed to expect a MACD cross over in the opposite direction.
This function can be used to designate risk parameters for a potential trade if using the MACD as their source of edge, letting the user know exactly where and how much their risk is for a potential trade which can be used to design an effective trading plan.
P-MACD by DGTPrice and Moving Averages Convergence/Divergence, shortly named as P-MACD
P-MACD is a trend-following momentum indicator that shows the relationship between Price and Long-term Moving Average (PMACD), and the relationship between two Moving Averages (MAMACD). P-MACD is composed of two lines, and an histogram, showing price distance (convergence/divergence) to its Long-term MA (PMACD), showing short-term MA distance (convergence/divergence) to long-term MA (MAMACD), and a histogram showing the difference (momentum) between the PMACD and MAMACD
The PMACD is calculated by dividing the Price to Long-term Moving Average (200-period SMA/EMA) and finally smoothed with 9-period SMA/EMA
- PMACD Line Formula : (Price / SlowMovingAverage -1) * 100 and smoothed with 9-period SMA/EMA
The MAMACD is calculated by dividing the Short-term Moving Average (such as 20 SMA/EMA) to the Long-term Moving Average (such as 200-period SMA/EMA)
- MAMACD Line Formula : (FastMovingAverage / SlowMovingAverage -1) * 100
The Histogram is calculated by subscripting PMACD and MAMACD
- Formula : PMACD - MAMACD
Optional
Trend Cloud calculated based on fast and slow version of MAMACD
What to look for:
- Line Crosses : PMACD Line can function as a trigger(signal) for buy and sell signals. Buy when the PMACD crosses above the MAMACD line and sell - or short - when the PMACD crosses below the MAMACD line
- Base Crosses : PMACD and/or MAMACD crosses above or below Baseline is another way to indicate the trend and momentum. MAMACD crosses of Baseline, MAMACD positive or negative, reflects short-term moving average crosses the long-term moving average and similarly, PMACD crosses of BaseLine, PMACD positive or negative, reflects price crosses a long-term moving average
- Momentum : P-MACD helps investors understand whether the bullish or bearish movement in the price is strengthening or weakening displayed with a histogram which graphs the distance between the PMACD and MAMACD. Additionally, upward momentum is confirmed with a bullish crossover, which occurs when PMACD and/or MAMACD crosses above Baseline. Conversely, downward momentum is confirmed with a bearish crossover, which occurs when PMACD and/or MAMACD crosses below Baseline
- Distance : Prices high above the moving average (MA) or low below it are likely to be remedied in the future by a reverse price movement. The more distant the PMACD is above or below its baseline indicates that the distance between the Price and its SMA is growing (regarding PMACD, You may find a detailed article explained in “Price Distance to its MA” indicator by DGT) . Similarly the more distant the MAMACD is above or below its baseline indicates that the distance between the two SMAs is growing
- Trend : A rising P-MACD indicates an uptrend, while a declining P-MACD indicates a downtrend
MACD vs. P-MACD
MACD measures the relationship between two MAs, while the P-MACD measures both the relationship between price and its MA, and the relationship between two MAs. MAMACD Line of P-MACD If set to same moving average type and same lengths as in MACD will produce the same line as MACD line, only values are represented as percentage with MAMACD. Both measure momentum in a market, but, because they measure different factors, they differentiate from each other even if they have similarities in presentation. P-MACD provides additional insights, not only to MA relation but also to Price and MA relation
Warning : Moving Average are calculated based on past prices, so they are lagging. The longer the time period for the moving average, the greater the lag as well as less sensitive to price changes. This study implements usage of 200-period long-term moving average, which implies that the P-MACD will provide insight especially for long-term trades, more suited for long-term trades, usage of P-MACD for short-term trades is recommend with lower timeframes (1H or lower).
Indicators aim to generate a potential signal/indication of an upcoming opportunity, but, the Indicators themselves do not guarantee the future movement of a given financial instrument, and are most useful when used in combination with other techniques.
Trading success is all about following your trading strategy and the indicators should fit within your trading strategy, and not to be traded upon solely
Disclaimer : The script is for informational and educational purposes only. Use of the script does not constitutes professional and/or financial advice. You alone the sole responsibility of evaluating the script output and risks associated with the use of the script. In exchange for using the script, you agree not to hold dgtrd tradingview user liable for any possible claim for damages arising from any decision you make based on use of the script

MACD-V MomentumThe MACD-V (Moving Average Convergence Divergence – Volatility Normalized) is an award-winning momentum indicator created by Alex Spiroglou, CFTe, DipTA (ATAA). It improves on the traditional MACD by normalizing momentum with volatility, solving several well-known limitations of classic indicators:
✅ Time stability – readings are consistent across history
✅ Cross-market comparability – works equally on stocks, crypto, forex, and commodities
✅ Objective momentum framework – universal thresholds at +150 / -150, +50 / -50
✅ Cleaner signals – reduces false signals in ranges and lag in high momentum
By dividing the MACD spread by ATR, the indicator expresses momentum in volatility units, allowing meaningful comparison across timeframes and markets.
MACD-V defines seven objective momentum states:
Risk (Oversold): below -150
Rebounding: -150 to +50 and above signal
Rallying: +50 to +150 and above signal
Risk (Overbought): above +150
Retracing: above -50 and below signal
Reversing: -150 to -50 and below signal
Ranging: between -50 and +50 for N bars
Optional background tints highlight the active regime (Bull above 200-MA, Bear below 200-MA).
Rare extremes (e.g., MACD-V < -100 in a bull regime) are tagged for additional context.
Use Cases
Identify and track momentum lifecycles across any market
Spot rare extremes for potential reversal opportunities
Filter out low-momentum whipsaws in ranging conditions
Compare momentum strength across multiple symbols
Support systematic and rule-based strategy development

VWMA MACD AmanitaVWMA MACD (Volume-Weighted MACD)
This indicator modifies the standard MACD by replacing EMAs with VWMAs
(Volume-Weighted Moving Averages).
- Fast VWMA (default 12 bars)
- Slow VWMA (default 26 bars)
- MACD Line = Fast VWMA - Slow VWMA
- Signal Line = EMA of MACD (default 9 bars)
- Histogram = MACD - Signal
Compared to the standard MACD, this version emphasizes price moves that
are backed by higher trading volume, helping to filter out weak signals.
The script also lets you choose the price source (Close, HL2, HLC3, OHLC4).

SMA+MACD+RSI+Stoch Entry📌 Tools Used:
• SMA 21, SMA 50, SMA 200
• MACD (12, 26, 9)
• Pivot Point Standard
• RSI (length 75)
• Stochastic (14, 3, 3)
Trading Timeframe:
• Usable on all timeframes
Chart Preparation:
• Analyze the overall market trend and the instrument being traded
• Set an appropriate timeframe according to the market
• Apply SMA 21, SMA 50, SMA 200
• Apply MACD and Pivot Point Standard
• Ensure a proper market trend by checking the position of SMA 21, SMA 50, and SMA 200 relative to each other
If there are too many crossings between SMA 21, SMA 50, and SMA 200, do not enter any trades until the market trend stabilizes
Conditions for Entering a Long Trade (Bullish Trigger):
• Candle closes above the pivot line
• Confirm an uptrend by checking that SMA 21 is above SMA 50, and SMA 50 is above SMA 200
• RSI is above the midpoint
• Presence of a suitable corrective step with normal slope, considering the strength of the previous step
• MACD histogram indicates bullish momentum
• Stochastic shows a bullish crossover from below
Conditions for Entering a Short Trade (Bearish Trigger):
• Candle closes below the pivot line
• Confirm a downtrend by checking that SMA 21 is below SMA 50, and SMA 50 is below SMA 200
• RSI is below the midpoint
• Presence of a suitable corrective step with normal slope, considering the strength of the previous step
• MACD histogram indicates bearish momentum
• Stochastic shows a bearish crossover from above

MACD-RSI Divergence OscillatorMACD-RSI Divergence Oscillator: Dual Confirmation with Momentum + Divergence Signals
This powerful oscillator combines MACD and RSI into a single normalized visual tool, enriched with automatic divergence detection and smart signal alerts. It’s designed to give traders advanced insights into momentum shifts and trend reversals.
Key Features:
• MACD + RSI Combo: Both indicators are scaled and merged into one oscillator for clearer interpretation.
• Automatic Divergence Detection:
• Bullish & Bearish divergences on both MACD and RSI
• Highlights strong divergences when both confirm
• Trading Signals:
• Detects MACD crossovers and RSI reversals
• Smart buy/sell signals based on momentum + divergence
• Custom Oscillator View:
• Plots MACD and RSI on the same scale
• Visual zero-line, overbought/oversold levels, and customizable colors
• Optional Dashboard Table:
• Displays live indicator values, signal states, and divergence status
Ideal For:
• Spotting early trend reversals
• Confirming trade entries/exits
• Avoiding false signals using dual indicator logic
Highly customizable and suitable for all timeframes and asset types.

Heikin Ashi + MACD Momentum FilterThe Heikin Ashi + MACD Momentum Filter is designed for short-term and swing traders, combining the trend-smoothing capabilities of manually calculated Heikin Ashi candles with the momentum confirmation of the MACD histogram to generate reliable buy and sell signals. This indicator aligns trend direction with momentum shifts to minimize false signals, making it ideal for trading trending markets on timeframes like 5-minute to 1-hour charts.
How It Works
The indicator uses two technical components to produce signals:
Heikin Ashi for Trend Detection:
Heikin Ashi candles are manually calculated to smooth price action, with the close as the average of OHLC values and the open as the average of the previous Heikin Ashi open and close. These values are further smoothed over a default 5-period moving average. A bullish trend is confirmed when the smoothed Heikin Ashi close is above its open (plotted in green), and a bearish trend when the close is below the open (plotted in red). This smoothing reduces noise, helping traders stay in the direction of the prevailing trend.
MACD Histogram for Momentum Confirmation:
The MACD, calculated with standard settings (fast=12, slow=26, signal=9), produces a histogram. A buy signal requires the histogram to cross above a threshold (default: 0.0), indicating bullish momentum, while a sell signal requires a cross below, indicating bearish momentum. This ensures trades are taken when momentum supports the trend.
Signal Generation
Signals are generated using the previous bar’s values to prevent repainting:
Buy Signal: The MACD histogram crosses above the threshold, and the Heikin Ashi confirms a bullish trend. Displayed as a green upward triangle below the bar.
Sell Signal: The MACD histogram crosses below the threshold, and the Heikin Ashi confirms a bearish trend. Displayed as a red downward triangle above the bar.

RSI & MACD Exit IndicatorThis indicator is designed to assist traders in identifying potential exit points for long and short trades by combining the Relative Strength Index (RSI) and Moving Average Convergence Divergence (MACD).
Unlike traditional indicators that provide entry signals, this script is specifically optimized for exit strategies, helping traders manage their positions efficiently.
How It Works
The script identifies potential exit points based on the following conditions:
🔴 Exit Long:
- RSI crosses above the user-defined overbought threshold (default: 65).
- MACD crosses below the signal line (bearish crossover).
🟢 Exit Short:
- RSI crosses below the user-defined oversold threshold (default: 35).
- MACD crosses above the signal line (bullish crossover).
When these conditions align, a label appears on the price chart indicating an exit point.
Key Features
- Customizable RSI & MACD Settings – Adjust lengths and thresholds to suit your strategy.
- ATR-Based Adjustments – The script incorporates an ATR multiplier for dynamic signal adjustments based on market volatility.
- Clear Visual Labels – Exit points are clearly marked on price candles.
- Color-Coded Background – Highlights buy/sell zones for quick identification.
- Alerts for Exit Signals – Receive notifications when exit conditions are met.
- Clean Chart Design – The MACD plots are placed below the main chart to avoid clutter.
How to Use
⚠ This indicator is for exits only and does not generate buy/sell entry signals.
For long trades: When an Exit Long signal appears, traders may consider closing or reducing their long positions.
For short trades: When an Exit Short signal appears, traders may consider closing or reducing their short positions.
ATR Settings: Users can adjust the ATR multiplier to fine-tune the signal frequency based on market conditions.
Important Notes
- This indicator does not guarantee future performance—it should be used alongside other analysis methods.
- No financial advice – Always use proper risk management.
- TradingView users who do not read Pine Script can still fully utilize this script thanks to the detailed signal labels and alerts.
💡 Developed with advice from @CoffeeshopCrypto based on user feedback.

MACD+RSI Indicator Moving Average Convergence/Divergence or MACD is a momentum indicator that shows the relationship between two Exponential Moving Averages (EMAs) of a stock price. Convergence happens when two moving averages move toward one another, while divergence occurs when the moving averages move away from each other. This indicator also helps traders to know whether the stock is being extensively bought or sold. Its ability to identify and assess short-term price movements makes this indicator quite useful.
The Moving Average Convergence/Divergence indicator was invented by Gerald Appel in 1979.
Moving Average Convergence/Divergence is calculated using a 12-day EMA and 26-day EMA. It is important to note that both the EMAs are based on closing prices. The convergence and divergence (CD) values have to be calculated first. The CD value is calculated by subtracting the 26-day EMA from the 12-day EMA.
---------------------------------------------------------------------------------------------------------------------
The relative strength index (RSI) is a momentum indicator used in technical analysis. RSI measures the speed and magnitude of a security's recent price changes to detect overbought or oversold conditions in the price of that security.
The RSI is displayed as an oscillator (a line graph) on a scale of zero to 100. The indicator was developed by J. Welles Wilder Jr. and introduced in his seminal 1978 book, New Concepts in Technical Trading Systems.
In addition to identifying overbought and oversold securities, the RSI can also indicate securities that may be primed for a trend reversal or a corrective pullback in price. It can signal when to buy and sell. Traditionally, an RSI reading of 70 or above indicates an overbought condition. A reading of 30 or below indicates an oversold condition.
---------------------------------------------------------------------------------------------------------------------
By combining them, you can create a MACD/RSI strategy. You can go ahead and search for MACD/RSI strategy on any social platform. It is so powerful that it is the most used indicator in TradingView. It is best for trending market. Our indicator literally let you customize MACD/RSI settings. Explore our indicator by applying to your chart and start trading now!

RSI MACD Combined Color StrategyOverview
This indicator combines RSI and MACD signals to create a powerful visual trading system, inspired by TrendSpider's AI Strategy Coder examples. It colors candles based on the alignment of three key technical conditions, providing clear visual signals for potential trend strength and direction.
Technical Components
Core Conditions
RSI (Relative Strength Index) > 50
Indicates bullish momentum when price is trading above the centerline
Traditional indicator of trend strength
MACD Line > Signal Line
Shows positive momentum
Classic signal for potential upward movement
MACD Line > 0
Confirms bullish territory
Indicates overall positive momentum
Color Coding System
🟢 Green Candles: All three conditions are met
Strongest bullish signal
Suggests high probability trading opportunities
⚪ Grey Candles: One or two conditions are met
Neutral or transitioning market
Suggests caution or waiting for stronger confirmation
🔴 Red Candles: No conditions are met
Bearish signal
Suggests potential downward pressure
How to Use This Indicator
For Entry Signals
Look for transitions from red or grey to green candles
Green candles suggest strong bullish alignment
Consider entering long positions when candles turn green
For Exit Signals
Watch for color transitions from green to grey or red
Consider taking profits when candles change from green to grey
Consider stop losses when candles turn red
Risk Management
Use color transitions as part of your broader strategy
Don't rely solely on color changes for trading decisions
Combine with other technical analysis tools and risk management practices
Customizable Parameters
RSI Length (default: 14)
MACD Fast Length (default: 12)
MACD Slow Length (default: 26)
MACD Signal Length (default: 9)
Best Practices
Use multiple timeframes for confirmation
Look for confluences with support/resistance levels
Consider volume and market context
Start with default settings and adjust based on your trading style
Backtest different parameter combinations
Notes
This indicator works best in trending markets
Grey candles can indicate transition periods
Consider market conditions and volatility when interpreting signals
Credits
Inspired by TrendSpider's AI Strategy Coder examples and adapted for TradingView using Pine Script v5.
Disclaimer
This technical indicator is for informational purposes only. Always conduct your own analysis and consider risk management principles before making trading decisions. Past performance does not guarantee future results.

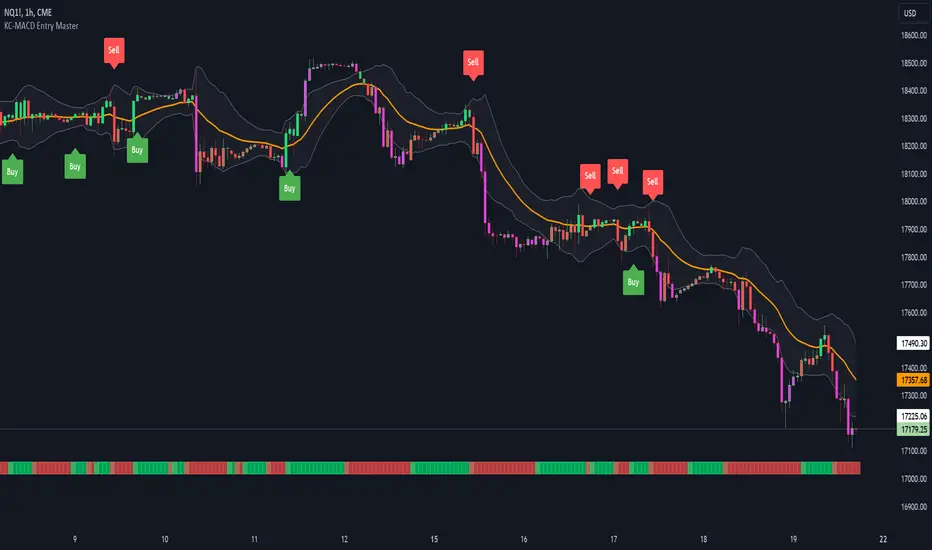
KC-MACD Entry Master @shrilssThe KC-MACD Entry Master is designed to enhance trading strategies by utilizing Keltner Channels and MACD for dynamic market analysis. This indicator excels in visually identifying market conditions with a sophisticated bar coloring system and an informative MACD Traffic Light feature.
Key Features:
- Dynamic Bar Coloring: The core feature of this indicator is its ability to adjust the color of bars based on their positioning relative to the Keltner Channels and the EMA (Exponential Moving Average). It colors bars lime or red when the closing price is within the Keltner Channels but above or below the EMA, respectively. Additionally, it uses a fuchsia color to indicate breakouts when the price extends beyond the Keltner Channels. This visual aid helps traders quickly identify potential buying or selling opportunities based on market volatility and price action.
- MACD Traffic Light: Positioned at the bottom of the chart, this unique feature displays the histogram color of the MACD, set by default to a 3/10/16 configuration—known as the 3-10 Oscillator. This Traffic Light gives traders an at-a-glance view of the underlying momentum and trend shifts, further aiding in decision-making processes.
- MACD-Based Entry Signals: By calculating the fast and slow moving averages specified by the user, the script determines MACD values and their crossover with a smoothed signal line. Entry points are then highlighted with shapes (e.g., "Buy" or "Sell") plotted on the chart when conditions are met, including alignment with the bar colors for enhanced accuracy.
Parabolic SAR + EMA 200 + MACD SignalsParabolic SAR + EMA 200 + MACD Signals Indicator, a powerful tool designed to help traders identify optimal entry points in the market.
This indicator combines three popular technical indicators: Parabolic SAR (Stop and Reverse), EMA200 (Exponential Moving Average 200) and MACD (Moving Average Convergence Divergence) - to provide clear and concise buy and sell signals based on market trends.
The MACD component of this indicator calculates the difference between two exponentially smoothed moving averages, providing insight into the trend strength of the market. The Parabolic SAR component helps identify potential price reversals, while the EMA200 acts as a key level of support and resistance, providing additional confirmation of the overall trend direction.
Whether you're a seasoned trader or just starting out, the MACD-Parabolic SAR-EMA200 Indicator is a must-have tool for anyone looking to improve their trading strategy and maximize profits in today's dynamic markets.
Buy conditions
The price should be above the EMA 200
Parabolic SAR should show an upward trend
MACD Delta should be positive
ُSell conditions
The price should be below the EMA 200
Parabolic SAR should show an downward trend
MACD Delta should be negative

VWAP filtered MACD Bars with positive MACD histogram value and closing above VWAP are colored, long positions should be taken in areas made of those bars.
Similarly, bars with negative MACD histogram value and closing below VWAP are also colored, short positions should be taken there.
This indicator by default should be a part of your trend following trading system.
In the setting you can change colors
Above grow: positive and rising MACD histogram value
Above fall: positive and falling MACD histogram value
Below fall: negative and falling MACD histogram value
Below grow: negative and rising MACD histogram value
Range Strat - MACD/RSIThis strategy uses a trend based indicator (MACD) for entry/exit signals with a momentum oscillator (RSI) to act as confirmation. Although relying on a trend based indicator this has been created for range bound crypto markets, which have been in a period of chop since June 2022.
Long/Short signals are generated from MACD with the RSI oscillator thresholds suppressing entries at price extremes. This is not a mean reversion RSI strategy! As the indicators are contrary to each other you will need to be generous with the RSI settings in order for signals to trigger.
Strategy is designed for use on the 4h timeframe, it may work well on higher timeframes, but lower time frames will lead to false signals. Use fixed percentage of equity for order size to capture the compounding effect. As a reversal strategy bear in mind that should market trend strongly in either direction stops will be required.
The RSI thresholds can be tailored to provide higher frequency or safer signals. Similarly tweaking MACD settings will provide earlier/more frequent or safer signals. As this is intended to enter near range high / low you should check the visual cues to ensure a ping-pong effect is observed, so that peaks and troughs are captured. Once an observable range is established the strategy works well across a range of crypto markets,
The script is open source, so feel free to amend as you wish. Using a different momentum oscillator may provide better results. I have prior coding experience, but first time using PineScript was last night, so it's not very tidy. I will update this with some additional customisation and TP/SL in the near future.
Usage: Range bound markets
Markets: Cryptocurrency Alts/BTC/ETH
Timeframe: 4h

Ichimoku Cloud with MACD (By Coinrule)The Ichimoku Cloud is a collection of technical indicators that show support and resistance levels, as well as momentum and trend direction. It does this by taking multiple averages and plotting them on a chart. It also uses these figures to compute a “cloud” that attempts to forecast where the price may find support or resistance in the future.
The Ichimoku Cloud was developed by Goichi Hosoda, a Japanese journalist, and published in the late 1960s. It provides more data points than the standard candlestick chart. While it seems complicated at first glance, those familiar with how to read the charts often find it easy to understand with well-defined trading signals.
The Ichimoku Cloud is composed of five lines or calculations, two of which comprise a cloud where the difference between the two lines is shaded in.
The lines include a nine-period average, a 26-period average, an average of those two averages, a 52-period average, and a lagging closing price line.
The cloud is a key part of the indicator. When the price is below the cloud, the trend is down. When the price is above the cloud, the trend is up.
The above trend signals are strengthened if the cloud is moving in the same direction as the price. For example, during an uptrend, the top of the cloud is moving up, or during a downtrend, the bottom of the cloud is moving down.
The MACD is a trend following momentum indicator and provides identification of short-term trend direction. In this variation it utilises the 12-period as the fast and 26-period as the slow length EMAs, with signal smoothing set at 9.
This strategy combines the Ichimoku Cloud with the MACD indicator to better enter trades.
Long/Short orders are placed when three basic signals are triggered.
Long Position:
Tenkan-Sen is above the Kijun-Sen
Chikou-Span is above the close of 26 bars ago
Close is above the Kumo Cloud
MACD line crosses over the signal line
Short Position:
Tenkan-Sen is below the Kijun-Sen
Chikou-Span is below the close of 26 bars ago
Close is below the Kumo Cloud
MACD line crosses under the signal line
The script is backtested from 1 June 2022 and provides good returns.
The strategy assumes each order is using 30% of the available coins to make the results more realistic and to simulate you only ran this strategy on 30% of your holdings. A trading fee of 0.1% is also taken into account and is aligned to the base fee applied on Binance.
This script also works well on MATIC (1h timeframe), AVA (45m timeframe), and BTC (30m timeframe).

MTF MACD BarOVERVIEW
This indicator shows MACD(Moving Average Convergence/Divergence) is up or down, represented by a bar. This indicator is compatible with MTF.
CONCEPTS
What do you want to know about market analysis?
Do you want a hard analysis? You can look for it.
All I want to know is whether the commonly known technical analysis is 'UP' or 'DOWN'.
All I want to know is whether the current market price is going up or down. Not only for the current, but also for the monthly, weekly, and daily status.
I want to make a decision in a moment. Without even thinking about it.
That is why I created a color-coded bar indicator to show the status.
No need to frown anymore.
DETAILS
You need more information about MACD, click here.
tradingview.com
MACD histogram Green ⇒ Bar is green.
MACD histogramRed ⇒ Bar is red.

Inverse MACD + DMI Scalping with Volatility Stop (By Coinrule)This script is focused on shorting during downtrends and utilises two strength based indicators to provide confluence that the start of a short-term downtrend has occurred - catching the opportunity as soon as possible.
This script can work well on coins you are planning to hodl for long-term and works especially well whilst using an automated bot that can execute your trades for you. It allows you to hedge your investment by allocating a % of your coins to trade with, whilst not risking your entire holding. This mitigates unrealised losses from hodling as it provides additional cash from the profits made. You can then choose to hodl this cash, or use it to reinvest when the market reaches attractive buying levels.
Alternatively, you can use this when trading contracts on futures markets where there is no need to already own the underlying asset prior to shorting it.
ENTRY
The trading system uses the Momentum Average Convergence Divergence (MACD) indicator and the Directional Movement Index (DMI) indicator to confirm when the best time is for selling. Combining these two indicators prevents trading during uptrends and reduces the likelihood of getting stuck in a market with low volatility.
The MACD is a trend following momentum indicator and provides identification of short-term trend direction. In this variation it utilises the 12-period as the fast and 26-period as the slow length EMAs, with signal smoothing set at 9.
The DMI indicates what way price is trending and compares prior lows and highs with two lines drawn between each - the positive directional movement line (+DI) and the negative directional movement line (-DI). The trend can be interpreted by comparing the two lines and what line is greater. When the negative DMI is greater than the positive DMI, there are more chances that the asset is trading in a sustained downtrend, and vice versa.
The system will enter trades when two conditions are met:
1) The MACD histogram turns bearish.
2) When the negative DMI is greater than the positive DMI.
EXIT
The strategy comes with a fixed take profit combined with a volatility stop, which acts as a trailing stop to adapt to the trend's strength. Depending on your long-term confidence in the asset, you can edit the fixed take profit to be more conservative or aggressive.
The position is closed when:
Take-Profit Exit: +8% price decrease from entry price.
OR
Stop-Loss Exit: Price crosses above the volatility stop.
In general, this approach suits medium to long term strategies. The backtesting for this strategy begins on 1 April 2022 to 18 July 2022 in order to demonstrate its results in a bear market. Back testing it further from the beginning of 2022 onwards further also produces good returns.
Pairs that produce very strong results include SOLUSDT on the 45m timeframe, MATICUSDT on the 2h timeframe, and AVAUSDT on the 1h timeframe. Generally, the back testing suggests that it works best on the 45m/1h timeframe across most pairs.
A trading fee of 0.1% is also taken into account and is aligned to the base fee applied on Binance.

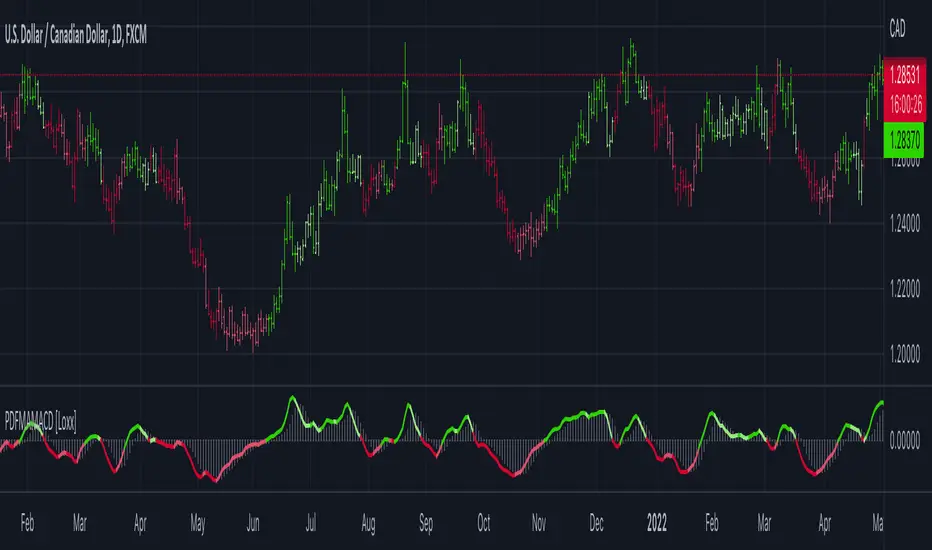
Probability Density Function based MA MACD [Loxx]Probability Density Function based MA MACD is a MACD indicator using a type of weighted moving average.
What is Probability Density Function based MA MACD?
Probability density function based MA is a sort of weighted moving average that uses probability density function to calculate the weights.
Included:
-Toggle on/off bar coloring
Disclosure of 'MACD-Total' indicator (MACD-T)hello?
Traders, welcome.
If you "follow", you can always get new information quickly.
Please also click "Like".
Have a good day.
-------------------------------------
A trend indicator has been added to the previously published MACD-Price indicator.
The added MS-Signal indicator is an indicator for viewing the trend and the strength of the trend.
Trading with a trend line is not easy.
Therefore, various MA lines or slanted lines drawn on the chart are used to see the flow of the chart.
Therefore, it is not recommended to trade with the added MS-Signal indicator as support and resistance points.
A trade requires support and resistance points.
To mark support and resistance points, you need a point or section on the horizontal line.
Therefore, it is necessary to utilize the 'Buy/Sell' indicator corresponding to the previously disclosed MACD-Price indicator.
(1W chart)
The long horizontal point of the 'Buy/Sell' indicator serves as support and resistance.
It is possible to check in which section the trend reversal has changed by displaying the MS-Signal indicator.
(1D chart)
A move has emerged to show a reversal of the trend by breaking above the MS-Signal indicator.
Therefore, the MS-Signal indicator is about to change from a downtrend to an uptrend.
I numbered the horizontal line of the 'Buy/Sell' indicator.
The length is different in the order of No. 2 > No. 1 > No. 3.
Since horizontal line 2 is the longest, it indicates that support and resistance play the greatest role.
If you check the support at the first horizontal point, it can be interpreted that there is a high possibility of receiving resistance at the second horizontal point.
However, if you find support at the 2nd horizontal point, you can see that it will go up significantly with 3rd position.
Trading with indicators allows you to make quick choices and decisions.
However, more important than the use of indicators is your own trading strategy.
in other words,
- How much investment will you proceed with the purchase?
- How to proceed with installment purchases
- At what point will the Stop Loss be done?
- How long will the investment period be?
- Is it a long-term investment or a short-term investment?
As listed above, the most important trading strategy for trading should be established.
When conducting a trade, ignoring the above list and thinking about where to buy and where to sell is like sailing in the dark.
We disclose the indicators in the hope that it will become a faster and more objective indicator for trading with the trading strategy you have established.
thank you
------------------------------------------------------------ -----------------------------------------------------

RSI + MACDRSI and MACD in one simplified indicator. Why? Because :
1. Save chart space, declutter, make decision making better, faster
2. MACD is not scaled to RSI range, now it is so you can have side by side comparison
Example how to use:
Enter on RSI oversold or overbought level, then exit on MACD crossover
See if there is an extra confluence to enter, hold or exit your trades, i.e oversold and falling macd is better than oversold and rising macd for short trades potentially.
Trend Following with Donchian Channels and MACDThis is a trend following system based on the Donchian Channels. Instead of using a simple moving average crossover, this system uses the MACD as the trendfilter:
Long positions:
* Price makes a new 50 day high,
* The MACD-line crosses above or is above the Signal-line.
* Both the MACD and the Signal-lines are above the zero-line.
Short positions:
* Price makes a new 50 day low,
* The MACD-line crosses below or is below the Signal-line.
* Both the MACD and the Signal-lines are below the zero-line.
Stoploss:
The initial and the trailing stoploss are 4 ATRs away from the price.
