MACD 4H Cross Above Zero AlertMACD 4H Cross the signal line to screen for stocks across a wide demo list
חפש סקריפטים עבור "macd"

MACD cu RSI 7 Fibonacci color levelsMACD with RSI info
The RSI is display as value with changing color as Fibonacci levels.
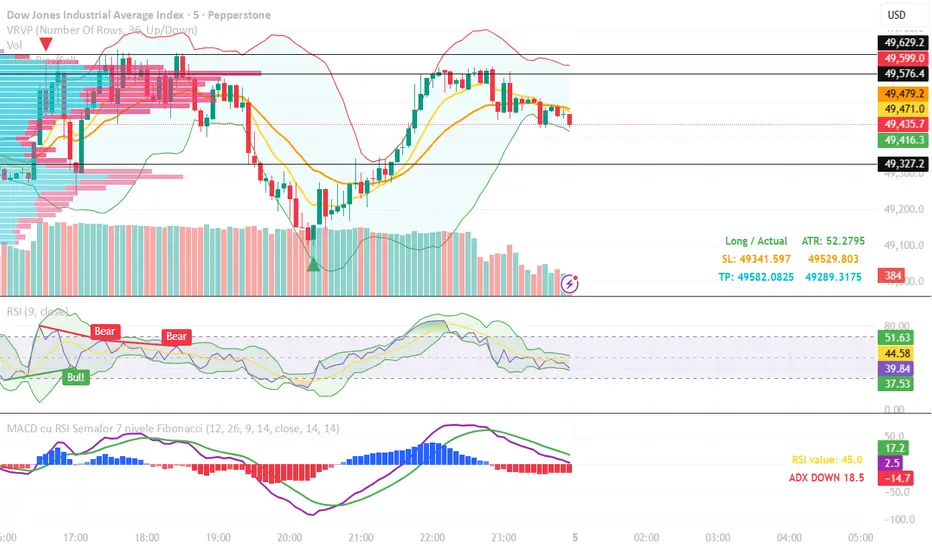
MACD with RSI color 7 Fibonacci levelsMACD that contain RSI info
The color of RSI is change accordingly with Fibonacci levels, from red till green

HULL MACDThis MACD modification uses a fast HULL MA instead of the regular one. Also includes 2 horizontal lines. When using it on a daily timeframe the lower borders should be used for guidance to know when the market has gone too far away from the average price and thus a reversal might happen.
On smaller timeframes the dotted lines can be used for this purpose.

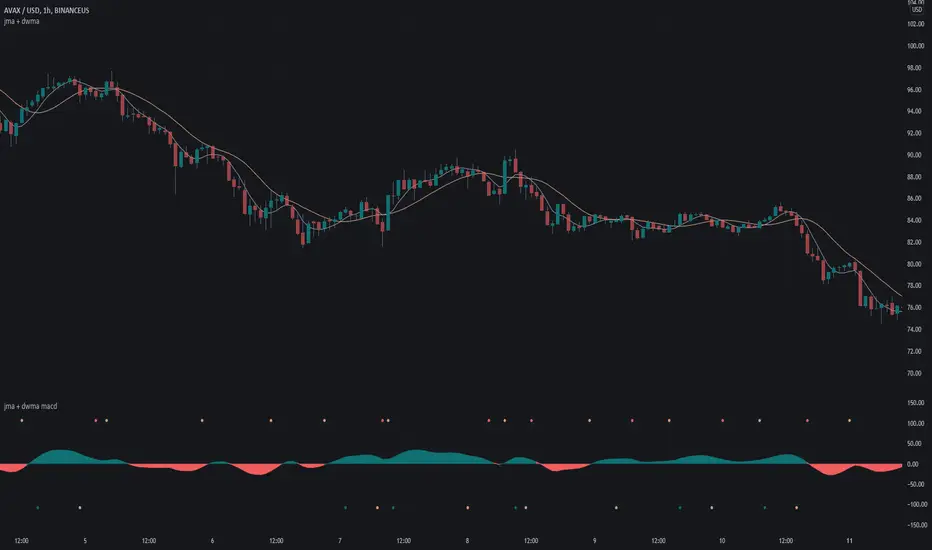
jma + dwma macdThis MACD system was originally conceptualized by Jurik Research and made public to the world on their website .
The indicator consists of the faster Jurik Moving Average ( JMA ) and the slower Double Weighted Moving Average (DWMA). A long signal (green dot at the bottom) is shown when the JMA line crosses above the DWMA line (indicating a possible reversal in trend). A short signal (red dot at the top) is shown when the JMA line crosses below the DWMA line. Take profit signals (tan dot at the top/bottom) are shown when the JMA line reverses directions. Alerts for signals are included in this indicator.
The default settings are not optimized for any timeframe.
For an overlay version of this script, please see the following:
Credit to @everget for the re-creation of the Jurik Moving Average in pinescript.
MACD+RSI by NiksMACD and RSI combined in one indicator. This is to allow you to add more than 3 indicators in free version of Trading view

Full Crypto Swing Strategy ALMA Cross with MACDThis is a full crypto swing strategy designed.
From my testing it looks like it perform the best on timeframes 4h +.
The below example has been adapted to BNB/USDT, using the entire period since 2017 until present day, with a comission of 0.03% ( which is the comission for the futures on binance).
Its components are :
ALMA Fast
ALMA Slow
MACD Histogram
Rules for entry
For long, we have a crossover of the fast alma with the slow one and the histogram is ascending.
For short, we have a crossunder of the fast alma with the slow one and the histogram is descending.
Rules for exit
We exit based on a risk management system for TP and SL, or when we receive an opposite condition than the initial one.
Regarding risk management
0.05 = 5% movement
2 = 200% movement
0.001 = 0.1% movement
If you have any questions, let me know !


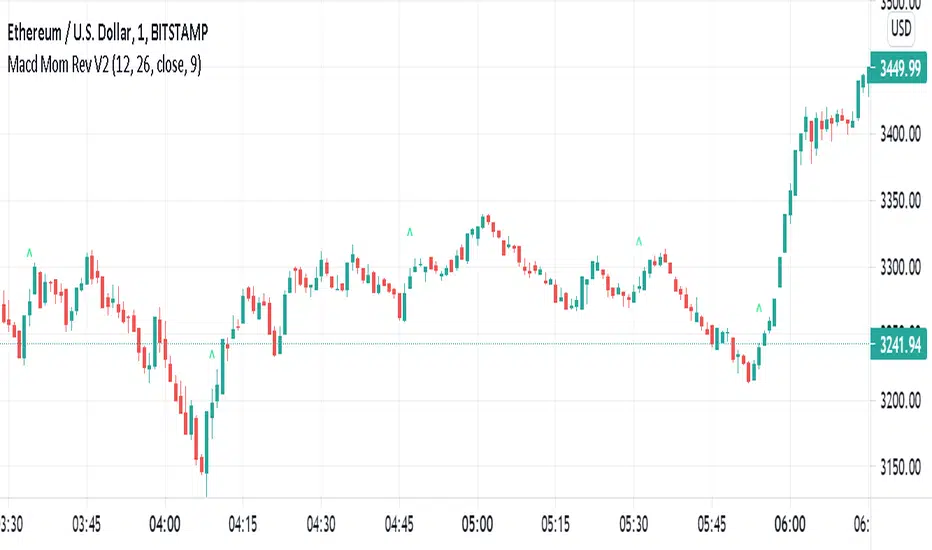
Simple Macd Momentum Reversal IndicatorThis Simple indicator uses the MACD history to check trend reversals. It primarily check if the histogram has moved up from a downtrend above a certain margin. If it has, it places a green B on the chart. If you were to use/improve this indicator, please use it with other indicators to confirm your position. This is NOT an indicator that can be well used alone.
macZLSMAMacd that shows instantaneous trend using ZLSMA. This crossover has the ability to reveal trend directions before it happens.

GSO + RSI + MACD + MFI + Bollinger BandsThis script uses a Gann Swing Oscillator , RSI , MACD , MFI and Bollinger Bands to generate long and short signals for cryptocurrencies on the 5 minute chart.
The Gann Swing Oscillator was inspired by HPotter's GSO.
This script is for educational purposes only. This script is NOT to be used as financial advice. I will not accept liability for any losses which may occur as a result of using this script.

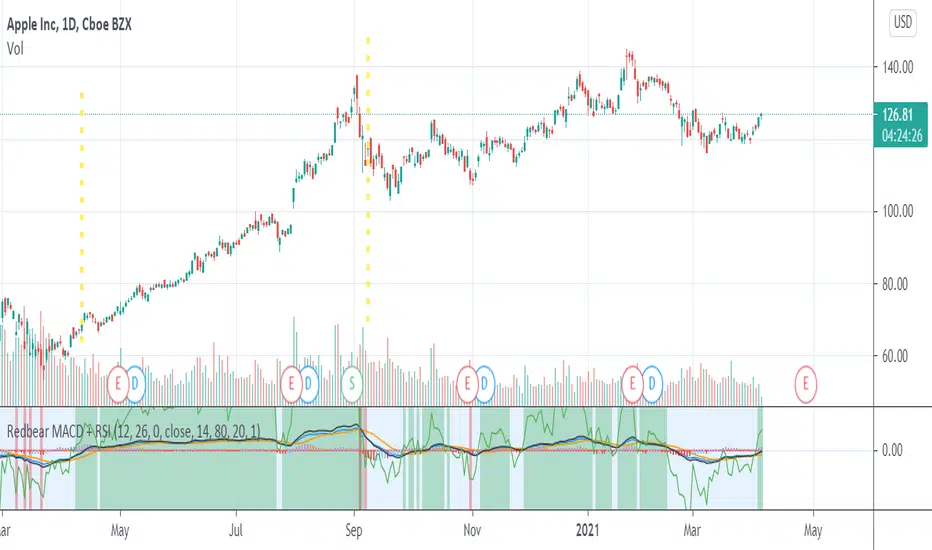
Redbear MACD + RSIHello . I make script that combine MACD and RSI
Green area is BUY SELL signal when rsi >45
you can custom parameter .
Log MACDThis is just a MACD indicator using the log of the closing price rather than the normal closing price. Useful for exponentially growing stocks and cryptocurrency.


RSI of MACD Strategy [Long only]This strategy uses the RSI on MACD indicator.
BUY
====
When RSI indicator crossing over 30 or 35 line and price above slow ema
Note: when the position already taken, you may reenter on the purple candle
Partial Exit
==========
Partial profit taking option is available in settings. If this is selected , 1/3 position exited when RSI indicator crossing down 80 line
Close
=====
When RSI indicator crossing below 15
Stop Loss
=========
I havent used hard stop loss in this strategy. Reason is , when price going down , indicator may go up ... so just wanted to ride along with indicator ...
Stop loss mentioned in the settings is used in calculation of how many units can be be purchased based on risk level
Tested with SPY and QQQ ETFs on hourly chart
Warning
=========
For the eductional purposes only ...
This is not a financial advise. please do your own research before taking any trading decission


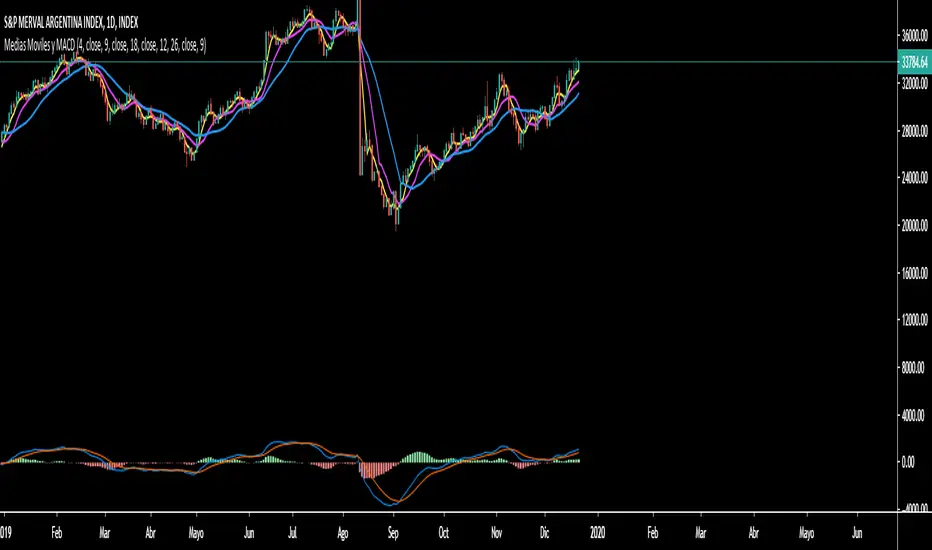
Simple Mobile Averages y MACDScript designed for users who need more than 3 indicators. It has 3 programmable "Simple Mobile Averages". MACD integrated in the main panel, also programmable.
Mirror TSI-MACD by Trader JayI was playing around with the TSI-MACD and surprisingly it works quite well as a mirror.
There are 2 ways this can be used
1. Enter long when Blue line crosses up the Red
2. Exit long when Green line crosses the blue
or
1. Enter long when Blue line crosses up the Red
2. Exit long when Blue line crosses back down below the Red


MACD Strategy by ForbesStrategy นี้เขียนขึ้นมาจากบทความของนิตยสารธุรกิจ ชื่อดัง Forbes
สำหรับผู้ที่อยากอ่านสามารถค้นหาได้โดยใช้คำค้นว่า Bitcoin Trading Strategy For Passive Investors
สำหรับผู้ทีจะทอสอบ backtest ให้ตั้งค่า commission (หรือค่าธรรมเนียมการเทรดด้วย) เพื่อให้ผลลัพท์ใกล้เคียงกับความเป็นจริงมากที่สุด
อย่างไรก็ตามจากการ backtest นั้น พบว่า Strategy นี้เหมาะกับ Timeframe Day มากที่สุด และโดยส่วนตัวคิดว่าเหมาะสำหรับการซื้อขายแบบ Spot เท่านั้น


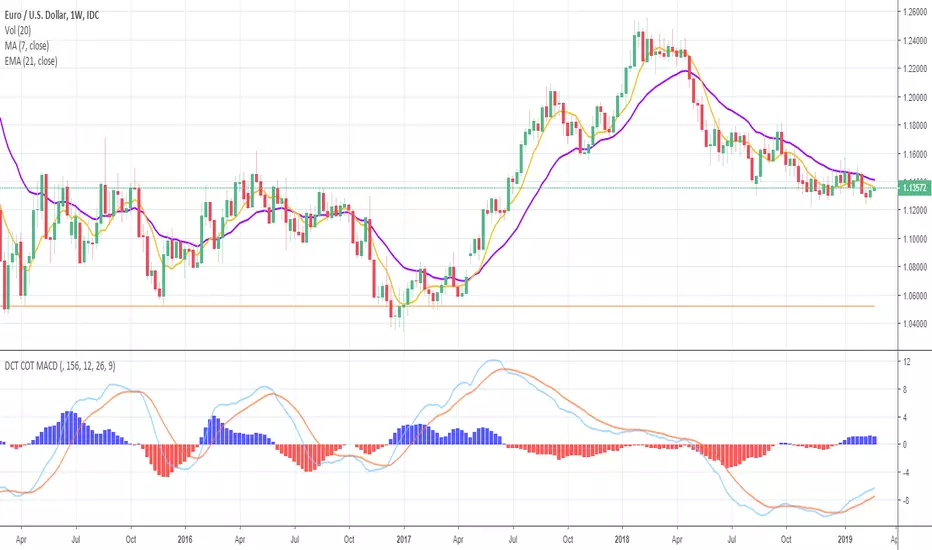
Deckchair Trader COT MACDPlots the COT MACD from the legacy report data from Quandl. Plots the commercial, non commercial and non reportables. Each plot can be hidden as needed.
I've tried to capture the basic dollar based currencies and the futures such as corn , wheat , rice, oil , hogs etc. The symbols required a little translation to match what Quandl is expecting but I think I got most of them. Please let me know of any issues with these.
Part of a suite of COT related indicators based on the excellent book "the commitment of traders bible" by Stephen Briese.
Feb 26, 2018
Release Notes: Quandl have changed their codes :( now they seem to be using the CFTC Id's where are numeric (and can be found in the dump you get from them)
So whereas before for example, GBPUSD was mapped to BP it is now mapped to 096742.
I have gone through the various dumps and tried to map all the symbols I was using, the currency were the easy ones, the wheat, corn etc a little harder to trade down due to variations.
Please let me know if different
Thanks
Tim Titchmarsh
DeckchairTrader
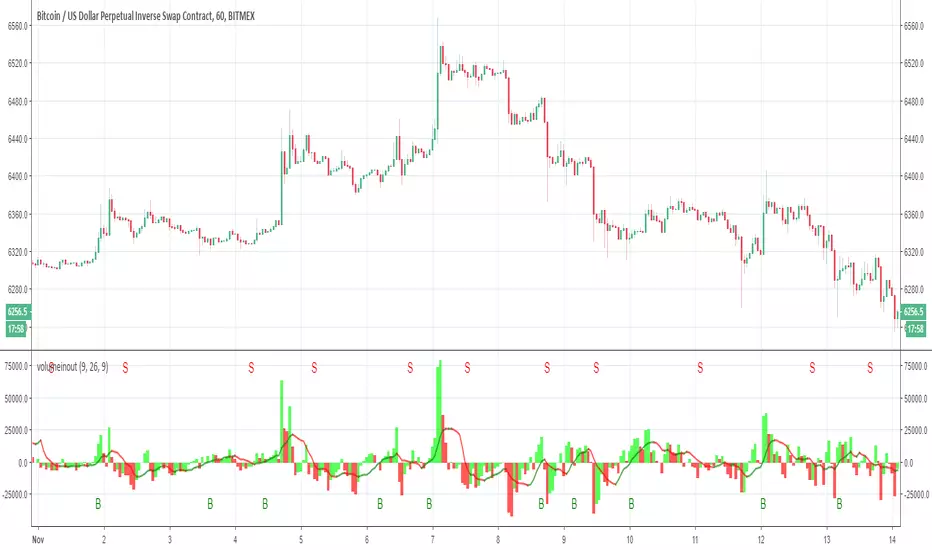
Volume in out as MACD with alerts Lets make the Volume in out as MACD
with alerts (B =buy) S=sell
have fun