MACD MAthis indicator is to be able to predict the movement of the macd, to determine when the macd may overextend and also provides great support and resistance levels, it's made out of 2 exponential moving averages one being 12 and the other 26, just like the moving averages used by the determine the macd a cross of the lines may indicate buy or sell signals
חפש סקריפטים עבור "macd"

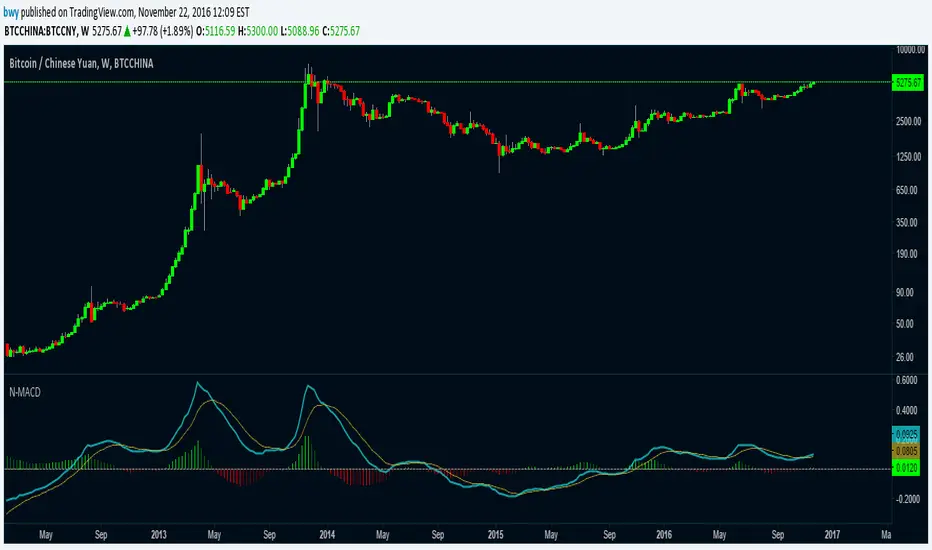
Normalized Moving Average Convergence/DivergenceThis MACD normalizes the price so that it can be compared against moves that took place at prices of significant difference.
There are also options to change if the MACD and the signal line are computed using EMA or SMA.
Heiken Ashi zero lag EMA v1.1 by JustUncleLI originally wrote this script earlier this year for my own use. This released version is an updated version of my original idea based on more recent script ideas. As always with my Alert scripts please do not trade the CALL/PUT indicators blindly, always analyse each position carefully. Always test indicator in DEMO mode first to see if it profitable for your trading style.
DESCRIPTION:
This Alert indicator utilizes the Heiken Ashi with non lag EMA was a scalping and intraday trading system
that has been adapted also for trading with binary options high/low. There is also included
filtering on MACD direction and trend direction as indicated by two MA: smoothed MA(11) and EMA(89).
The the Heiken Ashi candles are great as price action trending indicator, they shows smooth strong
and clear price fluctuations.
Financial Markets: any.
Optimsed settings for 1 min, 5 min and 15 min Time Frame;
Expiry time for Binary options High/Low 3-6 candles.
Indicators used in calculations:
- Exponential moving average, period 89
- Smoothed moving average, period 11
- Non lag EMA, period 20
- MACD 2 colour (13,26,9)
Generate Alerts use the following Trading Rules
Heiken Ashi with non lag dot
Trade only in direction of the trend.
UP trend moving average 11 period is above Exponential moving average 89 period,
Doun trend moving average 11 period is below Exponential moving average 89 period,
CALL Arrow appears when:
Trend UP SMA11>EMA89 (optionally disabled),
Non lag MA blue dot and blue background.
Heike ashi green color.
MACD 2 Colour histogram green bars (optional disabled).
PUT Arrow appears when:
Trend UP SMA11

Oscillator Moving Average (OsMA)This code for Oscillator of Moving Averages (OsMA) is based on MACD 4C indicator code published by vkno422 . Many thanks to vkno422. I have borrowed the concept of 4 colours which I find very useful.
For those who are not familiar with OsMA, it is histogram of difference between MACD (oscillator) and its MA (signal line). The zero line cross over of this indicator is used in many strategies.
This version includes MACD & its signal line together with OsMA histogram. I have programmed flexibility for switching OFF/ON individual indicator components as well as changing the periods for various moving averages.
I am dedicating this indicator to the TV trading community hoping that people will find it useful.

MACD RSI EMA AGGRESSIVE + ATR SLTP (ALL COIN)This indicator is designed for aggressive scalping and intraday trading, especially on crypto futures.
It combines:
- MACD crossover for momentum direction
- RSI filter to avoid weak signals
- EMA trend filter to follow market bias
- Volume confirmation to reduce false signals
- ATR-based SL/TP visualization for risk management
The script provides clear BUY and SELL alerts that can be used across multiple symbols and timeframes.
Best used on lower timeframes (1m–5m) with proper risk management.

MACD RSI EMA AGGRESSIVE + ATR SLTPThis indicator is designed for aggressive scalping and intraday trading, especially on crypto futures.
It combines:
- MACD crossover for momentum direction
- RSI filter to avoid weak signals
- EMA trend filter to follow market bias
- Volume confirmation to reduce false signals
- ATR-based SL/TP visualization for risk management
The script provides clear BUY and SELL alerts that can be used across multiple symbols and timeframes.
Best used on lower timeframes (1m–5m) with proper risk management.


MACD Trend Count ScoreThis indicator is designed to confirm potential future trends in an asset’s price by analyzing the MACD histogram in the past. It works by counting positive and negative MACD bars within the selected chart timeframe to calculate a Strength Index, which reflects the past trend direction and intensity.
Summarizing the predominance of positive or negative bars across higher timeframes in the past such as daily, weekly, bi-weekly, and quarterly, it provides insight to anticipate how the trend may evolve in upcoming periods, according to the predetermined range scales Strong Bullish, Moderate Bullish, Neutral, Moderate Bearish and Strong Bearish.
Additionally, a dedicated module linked to the strength index is optimized for short-term charts (2-minute, 5-minute and 15-minute timeframes), making it a valuable tool for day trading strategies.

MACD-V (ATR Normalized)Per Financial Wisdom (YT):
Adjusted MACD = (EMA 12 - EMA 26 / ATR 26) x 100
Objective:
Mathematical definitions work universally across all markets and all timeframes
Improves readability and usability (values resemble RSI/MACD ranges instead of tiny decimals)
Makes threshold-based rules cleaner (e.g., ±50, ±100).
No change to signal quality — purely a scaling transformation.


MACD Bounce Strategy for CryptohopperSell and Buy alerts based on MACD crossover values for automated triggers in Cryptohopper

MACD Backtesting IndicatorThis Pine Script v5 indicator replicates TradingView's standard MACD with full backtesting capabilities. Traders can adjust all parameters (12,26,9 defaults) through inputs and see real-time performance metrics in the table. Buy/sell signals appear as labeled arrows, matching classic MACD crossover strategy while providing visual backtest results for strategy evaluation.


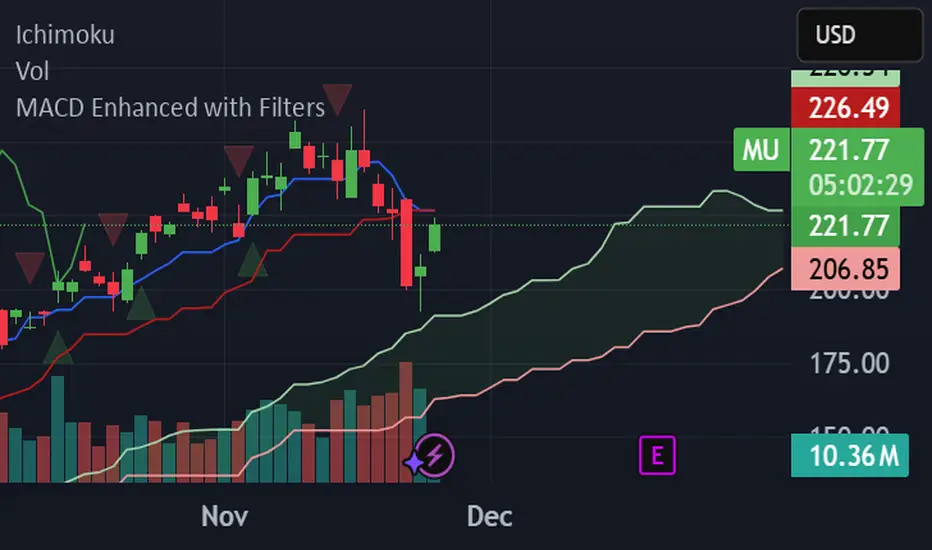
MACD Enhanced with FiltersProfessional MACD indicator with buy/sell signals and real-time alerts. Features:\n\n✅ MACD crossover signals with triangles\n✅ Green buy triangles (below bars)\n✅ Red sell triangles (above bars)\n✅ Real-time browser/email/Slack alerts\n✅ Signal strength analysis\n✅ Customizable parameters\n\nPerfect for active traders managing multiple accounts. Supports Webull, Interactive Brokers, and other platforms.
MACD Cross Above Zero Alert (Any Timeframe)For use on a large list to spot MACD cross overs in a bullish phase or bearish phase

LBR Oscillator with Signals & AlertsLinda Bradford Raschke MacD indicator. Has alerts and can be used in the pine screener on different timeframes.


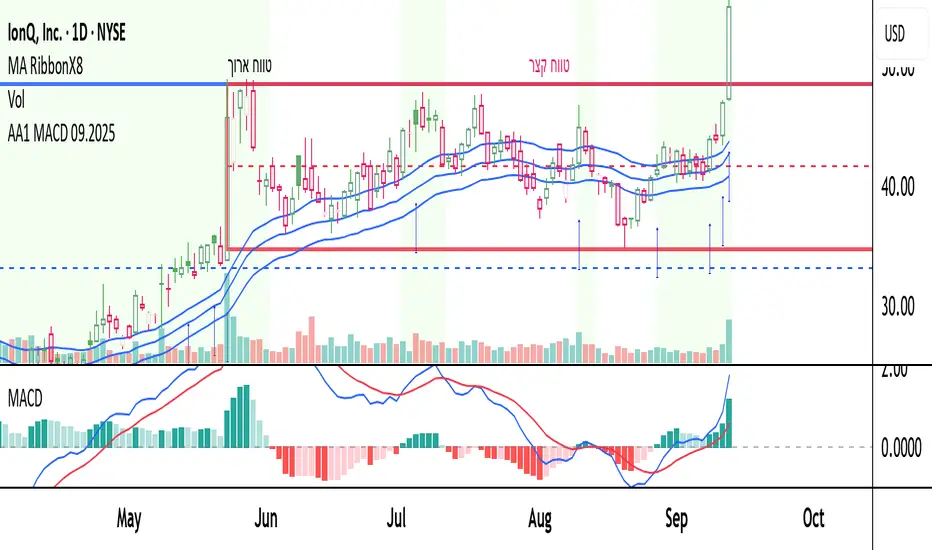
AA1 MACD 09.2025this is a learing project i want to share
the script is open for anyone
I combain some ema's mcad and more indicators to help find stocks in momentum
MACD Momentum Slowdown Alert (Bullish + Bearish)little arrows showing on chart when MACD histogram has a slowdown (change of color) in momentum

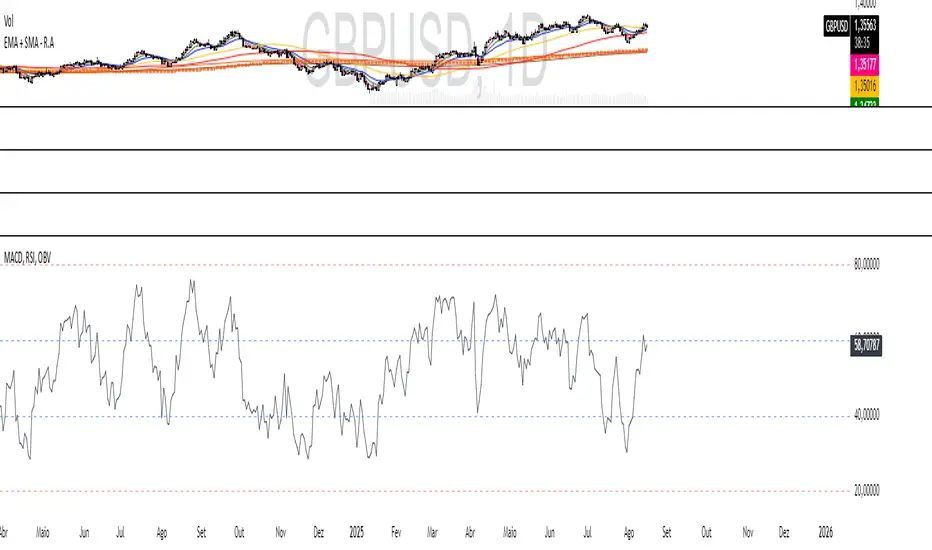
MACD, RSI, OBV - R.A TraderRudá Alves Trader - Custom Indicator
This indicator was developed for the students of Rudá Alves trader. It combines the OBV, RSI, and MACD oscillators into a single tool.