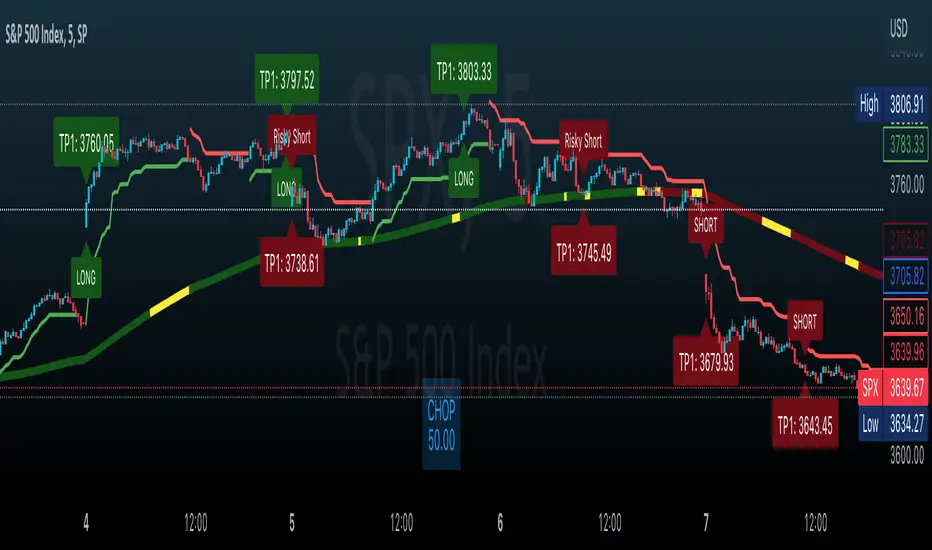
Effortless ScalpingEffortless Scalping is an indicator that primarily is used for stock options trading.
Effortless Scalping is based off of momentum. Our script takes into account the price action, volume, and historical data points of a stock to give potential "buy" and "sell" areas.
Effortless Scalping is a protected script because its Buy and Sell signals are based off of custom coded confirmations. This is what makes our script unique. We also have custom coded CHOP Filters in the indicator.
Effortless Scalping has a custom EMA line that flows with the trend of the market. It also changes colors to indicate a bullish or bearish trend . It also will change into a yellow color if the CHOP of the market exceeds your allowance. This EMA line is the only "classic" element of our custom coded script.
You can easily use Effortless Scalping by applying it straight to your chart. You can customize several visual effects in the settings menu.
Effortless Scalping also has two types of signals--RISKY signals and normal signals. Risky signals have a higher risk, but also a higher reward.
Effortless Scalping also features take profit levels based off of ATR levels.
Effortless Scalping also has custom support and resistance lines to better help you analyze the movement of a stock. These levels are based off of pivot levels.
Effortless Scalping can not predict the future move of a stock. Our script uses historical data points to alert POTENTIAL entries. These historical data points by NO MEANS predict the future movement of the market.
Effortless Scalping was created to help me understand the movement of a stock and why it may be moving in that direction. I personally found success using this script. I am sharing it because I am hoping that others find success in this script as well. I also like to trade quite frequently, and several times a day, so I made an indicator that is both accurate and alerts frequently.
This indicator does NOT provide financial advice. It is intended for general use only.
חפש סקריפטים עבור "momentum"
Change of Moving Averages - TableChange of Moving Averages is a companion table that shows the change of the major moving averages rather than the moving averages themselves in order to more easily interpret momentum.
It can be used for an SMA , EMA , TEMA or VWMA averages with an adjustable source, length and time offset. It uses a daily interval but it can be disabled in settings in order to show the selected interval. The number of days used to calculate the change can be adjusted however this may produce unexpected results if the change is calculated across a peak or trough of the moving average.
More interested in the change of the moving averages over time? Check out "Change in Moving Averages - Chart":
Have modification ideas for this indicator? Just let me know and I will gladly consider them!

Change of Moving Averages - ChartChange of Moving Averages charts the change of the major moving averages rather than the moving averages themselves. This is done in a separate panel, rather than being overlaid in order to more easily interpret momentum.
Change of Moving Averages has dual colored lines, in order to better see when the MA has crossed zero(dotted line). It can be used for an SMA , EMA , TEMA or VWMA averages with an adjustable source, length and time offset. It uses a daily interval but it can be disabled in settings in order to show the selected interval. The number of days used to calculate the change can be adjusted however this may produce unexpected results if the change is calculated across a peak or trough of the moving average.
More interested in just the latest change in the moving averages? Check out the "Change in Moving Averages - Table", which is a simple overlay table:
Have modification ideas for this indicator? Just let me know and I will gladly consider them!

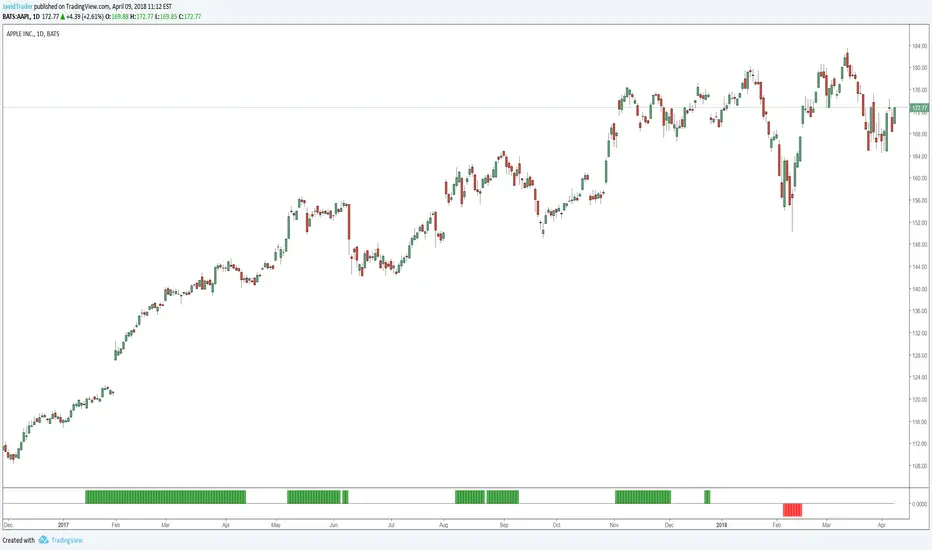
Momentum Sentiment Indicator by mattzabThis indicator uses 3 moving averages and includes volume to display sentiment and momentum.
By default, a 5, 8, and 13 SMA is displayed (black lines).
The colored bands are the corresponding volume weighted moving averages.
When the colored band is above the black line, sentiment is bullish.
Think of the color as being a show of volume, and the black lines as support and resistance.
When the lines are trending up, and colors are above the black lines, an uptrend is in progress.
When the colors are mixed above and below, and the lines are intertwined, it is a ranging market.
The lines operate similar to the Williams Alligator.

Momentum Factor Model [QuantAlgo]🟢 Overview
The Momentum Factor Model is a multi-horizon momentum analysis system that combines weighted return calculations with risk-adjusted price projections to identify and track persistent directional trends. The indicator employs a quantitative approach by measuring momentum across multiple timeframes simultaneously, applying exponential decay weighting to balance recent versus historical price action, and constructing volatility-normalized boundaries for trend validation. This factor-based methodology provides traders and investors with a systematic framework for momentum regime identification, trend persistence evaluation, and dynamic support/resistance determination across diverse market conditions and timeframes.
🟢 How It Works
The indicator constructs a composite momentum factor by calculating percentage returns over three distinct lookback periods (1, 3, and 5 bars) and combining them using exponentially decayed weights. The momentum decay parameter controls the relative importance of each timeframe, with higher decay values creating more balanced weighting between recent and historical momentum, while lower values emphasize immediate price action. This weighted momentum factor captures the multi-dimensional nature of trend strength rather than relying on a single timeframe measurement.
The expected return is derived by smoothing the momentum factor over a user-defined period, establishing a baseline for anticipated price movement based on recent momentum characteristics. This expected return then projects a factor-based price estimate, which undergoes risk adjustment through volatility normalization, creating a price estimate that accounts for both directional bias and market volatility conditions.
🟢 How to Use It
▶ Enter Long positions when the momentum factor dots (⏺) transition from red to green (bullish) , indicating the momentum factor model has confirmed positive directional bias. The color change represents a validated shift where the factor line has broken through the lower boundary and begun tracking the upper bound, signaling momentum reversal to the upside. Conversely, enter Short positions or exit existing Longs when the dots shift from green to red (bearish) , confirming negative momentum establishment and downward trend tracking.
The momentum factor dots function as a dynamic momentum-based reference pathway that can be used for position management and risk control. During bullish phases, the dot formation represents a momentum-weighted support zone where pullbacks may find stability before continuation. During bearish trends, it acts as resistance where rallies may encounter selling pressure. Price action relative to the momentum factor pathway provides context on trend health: sustained price movement in the direction of the trend (above the dots during bullish phases, below during bearish phases) confirms momentum persistence, while repeated violations may suggest weakening directional conviction.
▶ Configure alert notifications to monitor trend changes without continuous chart observation. The indicator provides three alert types: "Bullish Momentum Signal" triggers specifically on upward trend reversals, "Bearish Momentum Signal" captures downward momentum shifts, and "Momentum Trend Change" fires on any directional transition. These alerts activate only when the trend state changes from one regime to another, eliminating false triggers from intrabar noise or temporary boundary touches that don't result in confirmed trend reversals.
▶ The indicator also offers six pre-designed color schemes (Classic, Aqua, Cosmic, Ember, Neon, Custom) optimized for various chart backgrounds and visual preferences, ensuring the momentum trend remains clearly visible under different display conditions. The bar coloring feature overlays trend direction directly onto the price candles, providing immediate visual confirmation of the momentum regime without needing to reference the dot pattern position.
🟢 Pro Tips for Trading and Investing
▶ Align the configuration preset with your trading timeframe and objectives: Fast Response settings excel on 1-15 minute charts for scalping and day trading where capturing quick momentum shifts is paramount, though this comes with increased signal frequency and potential whipsaws in ranging conditions. Default parameters suit hourly to daily charts for swing trading, providing balanced responsiveness without excessive noise. Smooth Trend configuration works best on 4-hour to weekly timeframes for position trading and investment analysis, prioritizing trend stability over timing precision and significantly reducing false reversals during consolidation periods.
▶ Context matters significantly for momentum-based systems. The indicator performs optimally during trending market regimes where directional persistence exists and may struggle during sideways consolidation where momentum lacks consistency. Before taking signals, assess the broader market structure: look for established higher highs/higher lows (uptrend) or lower highs/lower lows (downtrend) on higher timeframes to confirm you're trading with the dominant directional bias. During range-bound periods, reduce position sizing or wait for the momentum factor dots to establish a clear directional slope and consistent movement before committing capital.
▶ Layer the momentum factor model with complementary analysis rather than using it in isolation. Combine trend signals with volume confirmation (increasing volume on trend changes suggests institutional participation), key support/resistance levels (signals near major levels carry higher probability), and volatility context (ATR expansion can precede significant moves). Consider the momentum decay parameter's impact: values near 0.85 make the model highly sensitive to recent price action, ideal for fast-moving markets but prone to false signals; values near 0.95 create smoother momentum estimates that better filter noise but may lag major reversals.
▶ Implement dynamic position management using the momentum factor pathway as a trailing reference framework. Rather than placing fixed stops, observe the dot formation's progression: as long as it maintains its directional slope and price respects it as support (bullish) or resistance (bearish), the momentum regime remains intact. Exit or tighten stops when price closes decisively through the momentum factor dots against your position, or when the dot pathway itself flattens (losing slope) indicating momentum exhaustion. For portfolio allocation, scale position sizes based on momentum factor strength, e.g., steeper dot progression angles and faster advancement suggest stronger momentum worthy of larger allocations within your risk parameters.

Momentum Tide [Alpha Extract]A sophisticated momentum-based trend identification system that measures normalized price deviation from an EMA baseline using ATR scaling and hyperbolic tangent smoothing for precise trend state classification. Utilizing advanced signal processing with configurable neutral bands and slope sensitivity adjustments, this indicator delivers institutional-grade momentum analysis with continuous strength measurement and visual trend confirmation. The system's three-state classification (bullish, bearish, neutral) combined with dynamic color intensity scaling provides comprehensive market momentum assessment across varying volatility conditions.
🔶 Advanced Baseline Deviation Framework
Implements EMA-based baseline calculation with ATR-normalized deviation measurement to create volatility-adjusted momentum signals. The system calculates raw price deviation from the baseline, scales by ATR and slope sensitivity factor, then applies exponential smoothing for stable signal generation with reduced noise and false transitions.
// Core Momentum Calculation
Baseline = ta.ema(close, Baseline_Length)
ATR_Value = ta.atr(ATR_Length)
Raw_Deviation = (close - Baseline) / (ATR_Value * Slope_Scaler)
Signal = ta.ema(Raw_Deviation, Signal_Smoothing)
🔶 Hyperbolic Tangent Normalization Engine
Features sophisticated tanh transformation that clamps raw deviation signals into normalized -1 to +1 range for consistent interpretation across all market conditions. The system applies safe exponential calculations with value capping to prevent overflow while maintaining signal sensitivity, creating bounded momentum readings suitable for systematic threshold analysis.
// Tanh Normalization
Clamped_Signal = tanh(Signal) // Bounded to
Strength = abs(Clamped_Signal) // Momentum intensity
🔶 Three-State Classification System
Implements intelligent trend state determination using configurable neutral band thresholds to reduce whipsaw signals during ranging conditions. The system classifies market as bullish (+1) when momentum exceeds upper neutral band, bearish (-1) below lower neutral band, and neutral (0) within the band, providing clear directional bias with built-in consolidation recognition.
🔶 Dynamic Color Intensity Architecture
Provides advanced visual feedback through momentum strength-based color intensity modulation, where stronger trends display more opaque colors and weaker trends show increased transparency. The system dynamically adjusts color alpha values based on absolute momentum strength, creating intuitive visual representation of trend conviction across baseline, candles, and bars.
🔶 Trend Strength Meter Visualization
Features innovative horizontal gradient meter displaying real-time momentum position across bear-to-bull spectrum with 24-segment resolution. The system creates smooth color transitions from bearish red through neutral gray to bullish green, with arrow indicator showing precise momentum location for instant trend strength assessment without cluttering the price chart.
🔶 Intelligent Flip Detection System
Generates transition markers when trend state changes from neutral/bearish to bullish or neutral/bullish to bearish, with duplicate signal suppression to prevent marker clustering. The system tracks previous signal states and only plots new markers on genuine trend reversals, providing clean entry signal visualization for systematic trading approaches.
snapshot
🔶 Configurable Neutral Band Framework
Implements adjustable neutral zone width using ATR percentage parameters to optimize signal frequency for different trading styles and market conditions. Wider bands reduce flip frequency for position trading while tighter bands increase sensitivity for active trading strategies, enabling customization without code modification.
🔶 Slope Sensitivity Adjustment
Features slope scaler parameter that modulates ATR normalization factor, controlling signal smoothness versus responsiveness trade-off. Higher values create smoother momentum readings with fewer transitions while lower values increase snappiness for faster reaction to price changes, allowing optimization across different volatility regimes and timeframes.
🔶 Comprehensive Visual Integration
Provides multi-dimensional trend visualization through color-coded baseline overlay, momentum-synchronized candle coloring, and bar color modification with configurable display toggles. The system includes optional flip markers and strength meter with position control for complete chart integration without visual overload.
🔶 Performance Optimization Framework
Utilizes efficient calculation methods with optimized table management for strength meter updates and minimal computational overhead for real-time momentum processing. The system includes intelligent state tracking and safe mathematical operations to prevent errors during extreme market conditions while maintaining consistent performance.
🔶 Why Choose Momentum Tide ?
This indicator delivers sophisticated momentum-based trend analysis through normalized deviation measurement and intelligent three-state classification. Unlike traditional momentum oscillators that operate in separate windows, Momentum Tide integrates directly with price action through baseline overlay and candle coloring while providing the analytical depth of bounded momentum measurement. The system's combination of tanh normalization, configurable neutral bands, dynamic color intensity, and innovative strength meter makes it essential for traders seeking adaptive trend-following approaches with clear visual feedback across cryptocurrency, forex, and equity markets. The three-state system naturally filters ranging periods while the momentum strength measurement enables position sizing and confidence assessment for systematic trading strategies.

Momentum Squeeze Candle [Darwinian]# Momentum Squeeze Candle
Professional squeeze detection indicator with Wyckoff accumulation/distribution analysis and multi-method momentum signals.
## Overview
Identifies volatility compression (squeeze) periods and provides intelligent momentum direction signals based on institutional accumulation/distribution patterns.
## Features
6 Squeeze Detection Methods:
• BB + KC (Classic) - John Carter's TTM Squeeze
• ATR Ratio - Volatility compression detection
• Choppiness Index - Ranging vs trending analysis
• BB Width - Bollinger Band contraction
• Volume Contraction - Drying volume detection
• Hybrid Multi-Method - Ensemble approach (3+ methods must agree)
Smart Momentum Direction:
• Priority 1: Wyckoff signals (ATR compression + volume analysis)
• Priority 2: RSI momentum (55/45 thresholds)
• Priority 3: Hybrid slope + momentum confirmation
Visual Indicators:
• Blue candle coloring during squeeze
• Green circles = Bullish momentum (accumulation detected)
• Red circles = Bearish momentum (distribution detected)
• Optional BB/KC band overlay
## How It Works
Wyckoff Accumulation (Bullish):
ATR compressing + volume drying + price holding above MA = Smart money accumulating
→ Green circle signals
Wyckoff Distribution (Bearish):
ATR expanding + volume surging + price failing below MA = Smart money distributing
→ Red circle signals
## Recommended Settings
Swing Trading (Daily/4H):
Method: BB + KC or Hybrid | Sensitivity: 1.2-1.5
Day Trading (15m-1H):
Method: ATR Ratio or BB Width | Sensitivity: 0.8-1.0
Scalping (1m-5m):
Method: Volume Contraction | Sensitivity: 0.7-0.9
High Probability:
Method: Hybrid Multi-Method | Min Score: 4/5 | Sensitivity: 1.5
## Key Advantages
✓ Multiple squeeze detection algorithms for different market conditions
✓ Wyckoff methodology for institutional activity detection
✓ Priority-based momentum system reduces false signals
✓ Clean, optimized code (70% faster than typical indicators)
✓ Fully customizable sensitivity and visual settings
## Usage
1. Choose squeeze detection method based on your trading style
2. Watch for blue candles (squeeze active)
3. Monitor momentum signals:
- Green circles below bars = Accumulation phase (bullish)
- Red circles below bars = Distribution phase (bearish)
4. Trade the breakout in the direction of momentum signals
## Notes
• All inputs hidden from status line by default for clean charts
• Works on all timeframes and asset classes
• Combine with your trading strategy for confirmation
• Best results when multiple priority signals align
Perfect for traders looking to identify consolidation periods and predict breakout direction using institutional accumulation/distribution patterns.

Momentum-Based Fair Value Gaps [BackQuant]Momentum-Based Fair Value Gaps
A precision tool that detects Fair Value Gaps and color-codes each zone by momentum, so you can quickly tell which imbalances matter, which are likely to fill, and which may power continuation.
What is a Fair Value Gap
A Fair Value Gap is a 3-candle price imbalance that forms when the middle candle expands fast enough that it leaves a void between candle 1 and candle 3.
Bullish FVG : low > high . This marks a bullish imbalance left beneath price.
Bearish FVG : high < low . This marks a bearish imbalance left above price.
These zones often act as magnets for mean reversion or as fuel for trend continuation when price respects the gap boundary and runs.
Why add momentum
Not all gaps are equal. This script measures momentum with RSI on your chosen source and paints each FVG with a momentum heatmap. Strong-momentum gaps are more likely to hold or propel continuation. Weak-momentum gaps are more likely to fill.
Core Features
Auto FVG Detection with size filters in percent of price.
Momentum Heatmap per gap using RSI with smoothing. Multiple palettes: Gradient, Discrete, Simple, and scientific schemes like Viridis, Plasma, Inferno, Magma, Cividis, Turbo, Jet, plus Red-Green and Blue-White-Red.
Bull and Bear Modes with independent toggles.
Extend Until Filled : keep drawing live to the right until price fully fills the gap.
Auto Remove Filled for a clean chart.
Optional Labels showing the smoothed RSI value stored at the gap’s birth.
RSI-based Filters : only accept bullish gaps when RSI is oversold and bearish gaps when RSI is overbought.
Performance Controls : cap how many FVGs to keep on chart.
Alerts : new bullish or bearish FVG, filled FVG, and extreme RSI FVGs.
How it works
Source for Momentum : choose Returns, Close, or Volume.
Returns computes percent change over a short lookback to focus on impulse quality.
RSI and Smoothing : RSI length and a small SMA smooth the signal to stabilize the color coding.
Gap Scan : each bar checks for a 3-candle bullish or bearish imbalance that also clears your minimum size filter in percent of price.
Heatmap Color : the gap is painted at creation with a color from your palette based on the smoothed RSI value, preserving the momentum signature that formed it.
Lifecycle : if Extend Unfilled is on, the zone projects forward until price fully trades through the far edge. If Auto Remove is on, a filled gap is deleted immediately.
How to use it
Scan for structure : turn on both bullish and bearish FVGs. Start with a moderate Min FVG Size percent to reduce noise. You will see stacked clusters in trends and scattered singletons in chop.
Read the colors : brighter or stronger palette values imply stronger momentum at gap formation. Weakly colored gaps are lower conviction.
Decide bias : bullish FVGs below price suggest demand footprints. Bearish FVGs above price suggest supply footprints. Use the heatmap and RSI value to rank importance.
Choose your playbook :
Mean reversion : target partial or full fills of opposing FVGs that were created on weak momentum or that sit against higher timeframe context.
Trend continuation : look for price to respect the near edge of a strong-momentum FVG, then break away in the direction of the original impulse.
Manage risk : in continuation ideas, invalidation often sits beyond the opposite edge of the active FVG. In reversion ideas, invalidation sits beyond the gap that should attract price.
Two trade playbooks
Continuation - Buy the hold of a bullish FVG
Context uptrend.
A bullish FVG prints with strong RSI color.
Price revisits the top of the gap, holds, and rotates up. Enter on hold or first higher low inside or just above the gap.
Invalidation: below the gap bottom. Targets: prior swing, measured move, or next LV area.
Reversion - Fade a weak bearish FVG toward fill
Context range or fading trend.
A bearish FVG prints with weak RSI color near a completed move.
Price fails to accelerate lower and rotates back into the gap.
Enter toward mid-gap with confirmation.
Invalidation: above gap top. Target: opposite edge for a full fill, or the gap midline for partials.
Key settings
Max FVG Display : memory cap to keep charts fast. Try 30 to 60 on intraday.
Min FVG Size % : sets a quality floor. Start near 0.20 to 0.50 on liquid markets.
RSI Length and Smooth : 14 and 3 are balanced. Increase length for higher timeframe stability.
RSI Source :
Returns : most sensitive to true momentum bursts
Close : traditional.
Volume : uses raw volume impulses to judge footprint strength.
Filter by RSI Extremes : tighten rules so only the most stretched gaps print as signals.
Heatmap Style and Palette : pick a palette with good contrast for your background. Gradient for continuous feel, Discrete for quick zoning, Simple for binary, Palette for scientific schemes.
Extend Unfilled - Auto Remove : choose live projection and cleanup behavior to match your workflow.
Reading the chart
Bullish zones sit beneath price. Respect and hold of the upper boundary suggests demand. Strong green or warm palette tones indicate impulse quality.
Bearish zones sit above price. Respect and hold of the lower boundary suggests supply. Strong red or cool palette tones indicate impulse quality.
Stacking : multiple same-direction gaps stacked in a trend create ladders. Ladders often act as stepping stones for continuation.
Overlapping : opposing gaps overlapping in a small region usually mark a battle zone. Expect chop until one side is absorbed.
Workflow tips
Map higher timeframe trend first. Use lower timeframe FVGs for entries aligned with the higher timeframe bias.
Increase Min FVG Size percent and RSI length for noisy symbols.
Use labels when learning to correlate the RSI numbers with your palette colors.
Combine with VWAP or moving averages for confluence at FVG edges.
If you see repeated fills and refills of the same zone, treat that area as fair value and avoid chasing.
Alerts included
New Bullish FVG
New Bearish FVG
Bullish FVG Filled
Bearish FVG Filled
Extreme Oversold FVG - bullish
Extreme Overbought FVG - bearish
Practical defaults
RSI Length 14, Smooth 3, Source Returns.
Min FVG Size 0.25 percent on liquid majors.
Heatmap Style Gradient, Palette Viridis or Turbo for contrast.
Extend Unfilled on, Auto Remove on for a clean live map.
Notes
This tool does not predict the future. It maps imbalances and momentum so you can frame trades with clearer context, cleaner invalidation, and better ranking of which gaps matter. Use it with risk control and in combination with your broader process.

LBR 3/10 'Sardine' Oscillator (ATR-Normalized)LBR 3/10 Oscillator - Short-Term Momentum Indicator
The LBR 3/10 "Sardine" Oscillator is a short-term momentum indicator developed by Linda Bradford Raschke. This ATR-normalized version provides cross-market comparability and consistent extreme levels across all timeframes and asset classes.
What is the LBR 3/10 Oscillator?
The LBR 3/10 is designed to capture very short-term momentum shifts by measuring the difference between a 3-period and 10-period moving average. Named after Linda Bradford Raschke's "Trading Sardines" book, this oscillator excels at identifying rapid momentum changes and potential reversal points.
Formula: / ATR(10) × 100
Where MA can be either Simple Moving Average (SMA) or Exponential Moving Average (EMA).
Why ATR Normalization?
Problem with Traditional Oscillators:
Traditional momentum oscillators produce values that vary dramatically across different markets and time periods. A reading of 5 might be extreme for one asset but insignificant for another.
Solution:
ATR normalization divides the raw momentum value by the Average True Range, creating standardized readings that are:
Comparable Across Markets: Same interpretation whether analyzing stocks, forex, commodities, or crypto
Comparable Across Time: Readings maintain consistent meaning regardless of price levels
Universal Extreme Levels: The ±125 levels work consistently across all assets and timeframes
Statistical Research
Extensive statistical analysis across multiple markets identified the ±125 extreme levels:
+125 Level: Reached approximately 4% of the time (extreme bullish momentum)
-125 Level: Reached approximately 2% of the time (extreme bearish momentum)
These statistically-validated levels provide objective definitions for overbought and oversold conditions, eliminating subjective interpretation.
Key Features
Core Components
LBR 3/10 Line: Main oscillator showing normalized short-term momentum
Signal Line: Smoothed moving average of the oscillator (default: 9-period)
Extreme Levels: Horizontal lines at ±125 marking statistical extremes
Zero Line: Separates bullish and bearish momentum regimes
Visual Elements
Blue Line: LBR 3/10 oscillator (main momentum line)
Red Line: Signal line (smoothed moving average of oscillator)
Fill Area: Light blue shaded region between oscillator and signal line
Background Zones: Light red (overbought above +125) or light green (oversold below -125)
Horizontal Lines: Gray dashed lines at +125, -125, and 0 (zero line solid)
Divergence Markers: Green/red circles marking price/oscillator divergences
Signal Crosses: Small green/red triangles marking oscillator/signal line crossovers
Pullback Markers: Yellow diamond shapes with white "↑PB" or "↓PB" text for first pullback signals
Std Dev Bands: Orange circles marking statistical extreme levels (optional, disabled by default)
Advanced Features
MA Type Selection: Choose between SMA or EMA for both oscillator and signal line
Standard Deviation Bands: Optional adaptive extreme levels based on statistical volatility
Pullback Detection: Identifies high-probability counter-trend entries during established trends
First Pullback Filter: Noise reduction system that highlights initial pullback after trend change
Trading Applications
1. Extreme Level Reversals
When the oscillator reaches ±125, it indicates stretched momentum conditions:
Above +125: Overbought - watch for bearish reversal signals
Below -125: Oversold - watch for bullish reversal signals
2. Signal Line Crossovers
Bullish Cross: Oscillator crosses above signal line (momentum shift up)
Bearish Cross: Oscillator crosses below signal line (momentum shift down)
3. Zero Line Crosses
Signal line crossing zero indicates trend regime changes:
Cross Above 0: Transition to bullish trend
Cross Below 0: Transition to bearish trend
4. Divergence Trading
Bullish Divergence: Price makes lower low, oscillator makes higher low
Bearish Divergence: Price makes higher high, oscillator makes lower high
Best used in combination with other momentum indicators for confirmation
5. Pullback Strategy (High-Probability Setup)
Uptrend Pullback: Signal line positive + oscillator crosses below (buy opportunity)
Downtrend Pullback: Signal line negative + oscillator crosses above (sell opportunity)
First Pullback: Initial counter-trend signal after trend change (highest probability)
6. "Anti" Setup
Linda Bradford Raschke's classic setup:
Wait for extreme reading (±125)
Enter on first pullback signal in opposite direction
Captures momentum exhaustion reversals
Comprehensive Alert System
Extreme Level Alerts
Crossed above +125 (overbought)
Crossed below -125 (oversold)
Divergence Alerts
Bullish divergence detected
Bearish divergence detected
Signal Cross Alerts
Bullish cross (oscillator above signal)
Bearish cross (oscillator below signal)
Trend Change Alerts
Signal line crossed above zero (trend change to bullish)
Signal line crossed below zero (trend change to bearish)
Pullback Alerts
Pullback in uptrend (potential buy)
Pullback in downtrend (potential sell)
FIRST pullback in uptrend (high-probability buy)
FIRST pullback in downtrend (high-probability sell)
Settings & Parameters
LBR 3/10 Settings
Fast MA Length: Short-term period (default: 3)
Slow MA Length: Baseline period (default: 10)
ATR Length: Volatility normalization period (default: 10)
MA Type: SMA or EMA selection
Extreme High Level: Overbought threshold (default: 125)
Extreme Low Level: Oversold threshold (default: -125)
Signal Line
Show Signal Line: Enable/disable display (default: true)
Signal Line Length: Smoothing period (default: 9)
Divergence Detection
Show Divergences: Enable/disable detection (default: true)
Divergence Lookback: Pivot detection period (default: 5)
Standard Deviation Bands
Show Std Dev Bands: Enable/disable adaptive levels (default: false)
Std Dev Multiplier: Band width adjustment (default: 1.5)
Std Dev Length: Calculation period (default: 100)
Best Practices
Trending Markets
Focus on pullback signals in direction of trend
Use first pullback filter for highest-probability entries
Watch for extreme levels as profit-taking zones
Ranging Markets
Trade reversals at extreme levels (±125)
Use divergences with additional momentum indicator confirmation
Avoid signal line crosses near zero (low-quality signals)
Multi-Timeframe Analysis
Higher timeframe: Identify trend direction (signal line above/below zero)
Lower timeframe: Time precise entries using pullback signals
Confirmation: Use additional momentum indicators for signal validation
Risk Management
Reduce position size at extreme levels (increased reversal risk)
Use ATR-based stops (e.g., 2× ATR from entry)
Exit on opposite extreme level or signal line zero cross
Chart Legend - Visual Signal Guide
Lines and Fills
🔵 Blue Line: LBR 3/10 oscillator value
🔴 Red Line: Signal line (9-period MA of oscillator)
💠 Light Blue Fill: Area between oscillator and signal line (visual momentum gauge)
Background Colors
🟥 Light Red Background: Extreme overbought zone (LBR > +125)
🟩 Light Green Background: Extreme oversold zone (LBR < -125)
Horizontal Reference Lines
➖ +125 (Gray Dashed): Overbought extreme level
➖ 0 (Gray Solid): Zero line - trend separator
➖ -125 (Gray Dashed): Oversold extreme level
Signal Markers
🟢 Green Circle: Bullish divergence detected (price lower low, oscillator higher low)
🔴 Red Circle: Bearish divergence detected (price higher high, oscillator lower high)
▲ Green Triangle Up: Bullish signal cross (oscillator crosses above signal line)
▼ Red Triangle Down: Bearish signal cross (oscillator crosses below signal line)
Yellow Diamond "↑PB": First pullback in uptrend (high-probability buy setup)
Yellow Diamond "↓PB": First pullback in downtrend (high-probability sell setup)
Combining with MACD-V+ Indicator
LBR 3/10 and MACD-V+ work together as a powerful two-timeframe momentum system:
Indicator Roles
MACD-V+: Strategic direction (12-26 period) - identifies market regime and lifecycle state
LBR 3/10: Tactical timing (3-10 period) - pinpoints precise entry and exit moments
Key Principles
Strategic Filter: MACD-V+ determines IF you should trade (market regime)
Tactical Timing: LBR 3/10 determines WHEN to enter (precise timing)
Confirmation Reduces Risk: Trade only when both indicators agree
Respect Lifecycle Changes: Exit when MACD-V+ state changes against your position
Methodology
The LBR 3/10 indicator implements statistical analysis and volatility normalization techniques to create a universal short-term momentum tool. This approach enables consistent interpretation across all markets and timeframes.
The indicator implements:
ATR-based normalization for cross-market comparability
Statistical extreme level validation (±125 levels)
Noise reduction through first pullback filtering
Dual MA type support (SMA/EMA) for flexibility
Standard deviation bands for adaptive threshold levels
LBR 3/10 provides traders with a precise tool for short-term momentum analysis and tactical entry timing. Combined with proper risk management and multi-timeframe analysis, it offers objective signals for both trend-following and reversal trading strategies.
This indicator is designed for educational and analytical purposes. Past performance does not guarantee future results. Always conduct thorough research and consider consulting with financial professionals before making investment decisions.

MACD-V+MACD-V+ Indicator - Advanced Momentum Analysis
The MACD-V+ indicator is an enhanced version of the volatility-normalized MACD methodology developed by Alex Spiroglou. This approach addresses critical limitations of traditional MACD through ATR-based volatility normalization, providing comparable values across time and markets.
What is MACD-V?
MACD-V applies Average True Range (ATR) normalization to traditional MACD, creating a universal momentum indicator that works consistently across all markets and timeframes. The methodology was developed through extensive statistical research analyzing multiple markets and timeframes.
Formula: × 100
This normalization transforms MACD from price-dependent values into standardized momentum readings.
Traditional MACD Limitations
Limitation 1: Non-Comparable Values Across Time
Traditional MACD values cannot be compared across different time periods due to varying price levels. S&P 500 maximum MACD was 1.56 in 1957-1971, but reached 86.31 in 2019-2021 - not indicating 55x stronger momentum, but simply different price scales.
Solution: MACD-V provides comparable historical values where a reading of 100 today has the same mathematical meaning as 100 in any previous period.
Limitation 2: Non-Comparable Across Markets
Traditional MACD cannot compare momentum between different assets. S&P 500 MACD of 65 versus EUR/USD MACD of -0.5 reflects price differences, not relative strength.
Solution: MACD-V creates universal levels that work across all markets. The ±150 extreme levels apply consistently whether analyzing stocks, bonds, commodities, or currencies.
Limitation 3: No Objective Momentum System
Traditional MACD lacks universal overbought or oversold level definitions, making systematic analysis difficult.
Solution: MACD-V provides an objective 7-stage momentum lifecycle system with clearly defined zones and state transitions.
Limitation 4: Signal Line False Signals
In low momentum environments, traditional MACD generates multiple false signals as the line oscillates near zero.
Solution: MACD-V filters signal quality by identifying neutral zones (-50 to +50) where signal reliability is lower.
Limitation 5: Signal Line Timing Lag
During extreme momentum, traditional MACD signal line lags significantly due to large separation from the MACD line.
Solution: MACD-V anticipates timing issues in extreme momentum environments (±150) through zone-based analysis and lifecycle states.
Universal Application
MACD-V+ works across:
Individual Stocks
Forex Pairs
Commodity Futures
Cryptocurrencies
All Timeframes
Key Features
Zone System
Overbought Zone: Above +150 (extreme bullish momentum)
Rally Zone: +50 to +150 (strong bullish momentum)
Ranging Zone: -50 to +50 (neutral/low momentum)
Rebound Zone: -50 to -150 (strong bearish momentum)
Oversold Zone: Below -150 (extreme bearish momentum)
7-Stage Lifecycle States
Ranging: Neutral momentum in -50 to +50 zone
Rallying: Rally zone + MACD above Signal + rising momentum
Overbought: Extreme zone above +150
Retracing: Rally zone + MACD below Signal (pullback from overbought)
Reversing: Rebound zone + MACD below Signal + falling momentum
Oversold: Extreme zone below -150
Rebounding: Rebound zone + MACD above Signal (recovery from oversold)
Visual Status Display
Real-Time State Table: Shows current lifecycle state name
Color-Coded States: Blue (Rallying/Rebounding), Red (Overbought/Oversold), Orange (Retracing/Reversing), Gray (Ranging)
Strength Multiplier: Live histogram strength indicator (e.g., "x 1.45")
Enhanced Features (Plus)
Absolute Histogram MA: ATR-length moving average of absolute histogram values for strength measurement
Direction-Aware Display: MA line follows histogram sign (positive above 0, negative below 0)
Strength Multiplier: Current momentum vs. average strength ratio (always positive value)
Histogram Extreme Levels: Short-term overbought/oversold (±40) for pullback detection
Chart Legend - Visual Signal Guide
Lines and Histogram
🔵 Blue Line: MACD-V value (ATR-normalized momentum)
🟠 Orange Line: Signal line (9-period EMA of MACD-V)
📊 Histogram Bars: MACD-V minus Signal line (momentum differential)
Histogram Colors: Green shades (positive momentum), Red shades (negative momentum)
🟡 Yellow Line: Dynamic MA of absolute histogram values (follows histogram sign)
Background Colors
🟥 Light Red Background: Extreme overbought zone (MACD-V > +150)
🟩 Light Green Background: Extreme oversold zone (MACD-V < -150)
Horizontal Reference Lines
➖ +150 (Gray Dashed): Overbought extreme level
➖ +50 (Gray Dashed): Rally zone entry level
➖ 0 (Gray Solid): Zero line - trend separator
➖ -50 (Gray Dashed): Rebound zone entry level
➖ -150 (Gray Dashed): Oversold extreme level
Optional Histogram Levels
➖ +40 (Yellow Dashed): Histogram short-term overbought
➖ -40 (Yellow Dashed): Histogram short-term oversold
Status Table
📋 Top-Center Table: Current lifecycle state display
State Name: RANGING / RALLYING / OVERBOUGHT / RETRACING / REVERSING / OVERSOLD / REBOUNDING
Histogram Warning: Short-term overbought/oversold alerts (±40 levels)
State Label
📊 Label at MACD/Signal Midpoint: Current lifecycle state with strength analysis
State Name: RANGING / RALLYING / OVERBOUGHT / RETRACING / REVERSING / OVERSOLD / REBOUNDING
Strength Multiplier Interpretation:
- Strong acceleration (>1.75): Powerful momentum, trend continuation likely
- Moderate progression (1.25-1.75): Normal trend strength
- Trend continuation (0.75-1.25): Stable momentum near average
- Watch for reversal (0.25-0.75): Weakening momentum
- Trend exhaustion (<0.25): Very weak momentum, reversal possible
Trading Applications
1. Lifecycle State Trading
Enter Long: When state changes to "RALLYING" (strong bullish momentum established)
Enter Short: When state changes to "REVERSING" (strong bearish momentum established)
Exit/Reduce: When state reaches "OVERBOUGHT" or "OVERSOLD" (extreme levels)
Avoid Trading: When state is "RANGING" (low momentum, unreliable signals)
2. Zone-Based Trading
Rally Zone (+50 to +150): Look for pullback entries (histogram dips)
Rebound Zone (-50 to -150): Look for bounce entries (histogram rises)
Extreme Zones (±150+): Prepare for reversal or take profits
Ranging Zone (-50 to +50): Wait for breakout confirmation
3. Signal Line Crossovers
Bullish Cross: MACD-V crosses above Signal line (momentum shift up)
Bearish Cross: MACD-V crosses below Signal line (momentum shift down)
Quality Filter: Trust crossovers in Rally/Rebound zones, ignore in Ranging zone
4. Zero Line Crosses
Cross Above 0: Transition to bullish regime
Cross Below 0: Transition to bearish regime
Trend Confirmation: Strong trends keep MACD-V on same side of zero
5. Histogram Extreme Strategy
Above +40: Short-term overbought - potential pullback
Below -40: Short-term oversold - potential bounce
Use with Trend: Buy dips to -40 in uptrend, sell rallies to +40 in downtrend
6. Strength Multiplier Analysis
> 1.75: Strong acceleration - powerful momentum, trend continuation highly likely
1.25 to 1.75: Moderate progression - normal healthy trend strength
0.75 to 1.25: Trend continuation - stable momentum near average strength
0.25 to 0.75: Watch for reversal - momentum weakening significantly
< 0.25: Trend exhaustion - very weak momentum, reversal possible
Comprehensive Alert System
Lifecycle State Change Alerts
Range Entered (low momentum warning)
Rally Started (bullish momentum established)
Overbought Reached (extreme bullish level)
Overbought Exit (leaving extreme zone)
Retracing Started (pullback from overbought)
Reversal Started (bearish momentum established)
Oversold Reached (extreme bearish level)
Oversold Exit (leaving extreme zone)
Rebounding Started (recovery from oversold)
Alert Builder Integration
Binary outputs (1/0) for external alert systems:
Individual state flags for each of 7 lifecycle states
Strength multiplier value for programmatic trend assessment
Settings & Parameters
MACD Configuration
MACD Fast: Fast EMA period (default: 12)
MACD Slow: Slow EMA period (default: 26)
Signal Line: Signal smoothing period (default: 9)
Source: Price source (default: Close)
Zone Boundaries
Overbought: Extreme bullish level (default: 150)
Oversold: Extreme bearish level (default: -150)
Rally: Strong bullish zone entry (default: 50)
Rebound: Strong bearish zone entry (default: -50)
Histogram Bounds
Histogram OB: Short-term overbought (default: 40)
Histogram OS: Short-term oversold (default: -40)
Trend Filters
MA Type: Histogram strength MA calculation method (None / SMA / EMA)
Show Elder Impulse Plus: Bar color system based on EMA(13) + histogram direction
200 EMA trend: Trend Filter v1 - Bull/Bear classification (adaptive MACD-V levels)
50/200 EMA 6-stage: Trend Filter v2 - Chuck Dukas Diamond 6-stage market classification
Best Practices
Trending Markets
Focus on "RALLYING" or "REVERSING" states for entries
Use histogram pullbacks (±40) for position additions
Monitor strength multiplier - exit if drops below 0.25
Take profits in extreme zones (±150+)
Yellow MA crossing histogram warns of momentum shift
Ranging Markets
Avoid trading when state is "RANGING"
Wait for clear zone entry (Rally/Rebound zone)
Use shorter timeframes for precision
Reduce position sizes due to lower reliability
Multi-Timeframe Analysis
Higher timeframe: Identify market regime (lifecycle state)
Lower timeframe: Time precise entries (histogram pullbacks)
Alignment: Trade only when both timeframes agree on direction
Risk Management
Reduce position size in extreme zones (±150+)
Use lifecycle state changes for stop-loss placement
Scale out of positions when strength multiplier < 0.25
Avoid counter-trend trades in strong states (RALLYING/REVERSING)
Watch yellow MA - when it crosses below histogram absolute value, momentum weakening
Combining with LBR 3/10-V Indicator
MACD-V+ and LBR 3/10-V create a powerful two-timeframe momentum system for strategic direction and tactical timing.
Strategic Filter: MACD-V+ determines WHETHER to trade (market regime)
Tactical Precision: LBR 3/10-V determines WHEN to enter (timing)
Double Confirmation: Both indicators must agree on direction
Lifecycle Management: Exit when MACD-V+ state changes
Strength Validation: Use MACD-V+ multiplier for position sizing
Extreme Respect: Both hitting extremes = high reversal probability
Methodology
MACD-V methodology is based on volatility normalization using Average True Range (ATR). This approach transforms traditional MACD into a universal momentum indicator with statistically-validated zones and objectively-defined states.
The indicator implements:
ATR-based normalization for cross-market comparability
Statistical analysis for universal zone definitions (±150, ±50)
Lifecycle state system for objective trend identification
Absolute histogram MA with direction-aware visualization (ATR-length period)
Strength multiplier: ratio of current to average absolute momentum (always positive)
Dynamic status table adapting to active trend filters
MACD-V+ transforms momentum analysis from subjective interpretation into objective, quantifiable measurements. Combined with LBR 3/10-V for tactical timing, it provides a complete framework for systematic trading across all financial markets and timeframes.
This indicator is designed for educational and analytical purposes. Past performance does not guarantee future results. Always conduct thorough research and consider consulting with financial professionals before making investment decisions.

Momentum RS | QuantumResearch🚀 Momentum RS | QuantumResearch
Momentum RS is a relative strength-based momentum rotation system developed by QuantumResearch. Unlike traditional relative strength tools that rely on static ratio comparisons (e.g., ETH/BTC), this script focuses on trend confirmation and momentum acceleration to dynamically rotate into the strongest trending asset across a customizable basket.
🔍 Key Highlights
✅ Trend-Validated Momentum Scoring:
Each asset is scored using trend following indicator. Only assets in a confirmed uptrend are eligible for rotation. No blind allocation into a pumping asset without trend validation.
🔄 Dynamic Asset Rotation:
The system selects the asset with the highest momentum among those currently in a bullish TPI state, switching only when a new asset becomes dominant.
💹 Backtestable Strategy:
Includes full equity curve tracking, swap count, and customizable fees. Automatically calculates:
Sharpe Ratio
Sortino Ratio
Omega Ratio
Max Drawdown
Net Profit vs HODL
📈 Momentum Visualization:
Each selected asset’s momentum score is displayed in a custom performance table, along with current trend signal (LONG or CASH) and overall strategy metrics.
⚙️ How It Works
Select up to 4 assets (e.g., BTC, ETH, SOL, SUI).
For each, the script computes:
Trend State via trend following indicator (1 = Bullish, -1 = Bearish)
Momentum Score to asses the winner
The strategy allocates 100% exposure to the asset with the highest momentum among those in an uptrend.
If no asset is trending, the strategy holds CASH.
📊 What Makes This Unique?
Most “relative strength” indicators compare the price ratio between two assets over time. This often leads to late rotations.
This tool is different:
It uses momentum and trend detection, not simple ratio analysis.
It’s designed to avoid false breakouts by requiring trend confirmation before rotating.
Ideal for rotational trading, momentum investing, and trend-following systems.
🧠 Best Use Cases
Rotational Crypto Strategies (BTC vs ETH vs SOL vs SUI)
Smart Trend Allocation with drawdown awareness
Backtest-ready edge validation vs HODL strategies
Low-frequency rebalancing with high signal quality
🛑 Disclaimer
This indicator is for educational purposes only. It does not constitute financial advice. Past performance does not guarantee future returns. Always use proper risk management.

Momentum, Trend and Volatility indicator by [Th16rry]Momentum, Trend and Volatility indicator by
Description:
Momentum, Trend and Volatility indicator by is an advanced TradingView indicator designed to clearly identify market bias, volatility, and momentum directly on your charts. It integrates multiple analytical techniques, combining adaptive moving averages, volatility bands, and momentum signals into a unified visual framework.
Key Components:
Adaptive Moving Average (Nadaraya–Watson): A sophisticated, non-repainting adaptive moving average colored dynamically to instantly show bullish or bearish trends. This component highlights the prevailing market bias.
Trend Channel: Built around a central Keltner Channel with a customizable multiplier, this channel captures immediate price trends. When price remains within this channel, it indicates sustained market direction.
Volatility Channel: Represented by broader bands using a higher ATR multiplier. Price movements crossing outside these channels suggest significant volatility spikes, often signaling potential market reversals or strong breakout moves.
Range Channel: A medium ATR multiplier channel designed to pinpoint potential consolidation or ranging conditions. Useful for identifying short-term trading ranges or preparation phases before major moves.
CCI Momentum Signals: Includes optional Commodity Channel Index (CCI) signals to identify momentum shifts. Arrows appear when CCI crosses predefined thresholds, signaling potential overbought or oversold conditions.
How to Use:
Trend Following: Enter trades aligned with the adaptive moving average color. A teal line indicates bullish conditions, while a red line suggests bearish sentiment. Use Trend Channel
to spot Breakouts and pull-backs.
Volatility Breakouts: Pay attention to arrows marking price breaches beyond the Volatility Channel. Upward (red) and downward (green) arrows highlight significant breakout or reversal opportunities.
Range Trading: Utilize the Range Channel to trade sideways markets. Price reactions near these boundaries can offer quick reversal trade setups or scalping opportunities. Or simply avoid any trading during these low volatility phases.
Momentum Entries: Enable CCI signals to catch momentum-based trades. Green circles indicate bullish momentum turning points; red circles indicate bearish momentum shifts.
Customization:
Momentum, Trend and Volatility indicator by provides full customization to fit individual trading styles:
Adjust ATR multipliers to control channel widths.
Configure Nadaraya–Watson parameters for sensitivity.
Enable or disable visual elements such as channel backgrounds or CCI signals to maintain chart clarity.
This indicator serves as a comprehensive trading tool for traders looking to enhance their strategy through a clear understanding of market dynamics, including trend strength, volatility bursts, and momentum shifts.
Disclaimer:
Trading involves significant risk of loss and is not suitable for every investor. Always use proper risk management strategies. This Indicator is provided for educational purposes only and does not constitute financial advice or recommendations to trade specific assets. Users should conduct their own research and consult a licensed financial advisor before making trading decisions.
Momentum, Trend and Volatility indicator by [Th16rry]Momentum, Trend and Volatility indicator by
Description:
Momentum, Trend and Volatility indicator by is an advanced TradingView indicator designed to clearly identify market bias, volatility, and momentum directly on your charts. It integrates multiple analytical techniques, combining adaptive moving averages, volatility bands, and momentum signals into a unified visual framework.
www.tradingview.com [/url
Key Components:
Adaptive Moving Average (Nadaraya–Watson):
A sophisticated, non-repainting adaptive moving average colored dynamically to instantly show bullish or bearish trends. This component highlights the prevailing market bias.
Trend Channel:
Built around a central Keltner Channel with a customizable multiplier, this channel captures immediate price trends. When price remains within this channel, it indicates sustained market direction.
Volatility Channel:
Represented by broader bands using a higher ATR multiplier. Price movements crossing outside these channels suggest significant volatility spikes, often signaling potential market reversals or strong breakout moves.
Range Channel:
A medium ATR multiplier channel designed to pinpoint potential consolidation or ranging conditions. Useful for identifying short-term trading ranges or preparation phases before major moves.
Momentum Signals:
Includes optional Commodity Channel Index (CCI) signals to identify momentum shifts. Arrows appear when CCI crosses predefined thresholds, signaling potential overbought or oversold conditions.
How to Use:
Trend Following:
Enter trades aligned with the adaptive moving average color. A teal channel indicates bullish conditions, while a red channel suggests bearish sentiment. Channel helping to spot break outs and pullbacks.
Volatility Breakouts:
Pay attention to arrows marking price breaches beyond the Volatility Channel. Upward (red) and downward (green) arrows highlight significant breakout or reversal opportunities.
Range Trading:
Utilize the Range Channel to trade sideways markets. Price reactions near these boundaries can offer quick reversal trade setups or scalping opportunities, or simply avoid trading during these low volatility phases.
Momentum Entries:
Enable CCI signals to catch momentum-based trades. Green circles indicate bullish momentum turning points; red circles indicate bearish momentum shifts.
Customization:
Momentum, Trend and Volatility indicator by provides full customization to fit individual trading styles:
* Adjust ATR multipliers to control channel widths.
* Configure Nadaraya–Watson parameters for sensitivity.
* Enable or disable visual elements such as channel backgrounds or CCI signals to maintain chart clarity.
This indicator serves as a comprehensive trading tool for traders looking to enhance their strategy through a clear understanding of market dynamics, including trend strength, volatility bursts, and momentum shifts.
**Disclaimer:**
Trading involves significant risk of loss and is not suitable for every investor. Always use proper risk management strategies. Indicator is provided for educational purposes only and does not constitute financial advice or recommendations to trade specific assets. Users should conduct their own research and consult a licensed financial advisor before making trading decisions.
Uptrick: Z-Trend BandsOverview
Uptrick: Z-Trend Bands is a Pine Script overlay crafted to capture high-probability mean-reversion opportunities. It dynamically plots upper and lower statistical bands around an EMA baseline by converting price deviations into z-scores. Once price moves outside these bands and then reenters, the indicator verifies that momentum is genuinely reversing via an EMA-smoothed RSI slope. Signal memory ensures only one entry per momentum swing, and traders receive clear, real-time feedback through customizable bar-coloring modes, a semi-transparent fill highlighting the statistical zone, concise “Up”/“Down” labels, and a live five-metric scoring table.
Introduction
Markets often oscillate between trending and reverting, and simple thresholds or static envelopes frequently misfire when volatility shifts. Standard deviation quantifies how “wide” recent price moves have been, and a z-score transforms each deviation into a measure of how rare it is relative to its own history. By anchoring these bands to an exponential moving average, the script maintains a fluid statistical envelope that adapts instantly to both calm and turbulent regimes. Meanwhile, the Relative Strength Index (RSI) tracks momentum; smoothing RSI with an EMA and observing its slope filters out erratic spikes, ensuring that only genuine momentum flips—upward for longs and downward for shorts—qualify.
Purpose
This indicator is purpose-built for short-term mean-reversion traders operating on lower–timeframe charts. It reveals when price has strayed into the outer 5 percent of its recent range, signaling an increased likelihood of a bounce back toward fair value. Rather than firing on price alone, it demands that momentum follow suit: the smoothed RSI slope must flip in the opposite direction before any trade marker appears. This dual-filter approach dramatically reduces noise-driven, false setups. Traders then see immediate visual confirmation—bar colors that reflect the latest signal and age over time, clear entry labels, and an always-visible table of metric scores—so they can gauge both the validity and freshness of each signal at a glance.
Originality and Uniqueness
Uptrick: Z-Trend Bands stands apart from typical envelope or oscillator tools in four key ways. First, it employs fully normalized z-score bands, meaning ±2 always captures roughly the top and bottom 5 percent of moves, regardless of volatility regime. Second, it insists on two simultaneous conditions—price reentry into the bands and a confirming RSI slope flip—dramatically reducing whipsaw signals. Third, it uses slope-phase memory to lock out duplicate signals until momentum truly reverses again, enforcing disciplined entries. Finally, it offers four distinct bar-coloring schemes (solid reversal, fading reversal, exceeding bands, and classic heatmap) plus a dynamic scoring table, rather than a single, opaque alert, giving traders deep insight into every layer of analysis.
Why Each Component Was Picked
The EMA baseline was chosen for its blend of responsiveness—weighting recent price heavily—and smoothness, which filters market noise. Z-score deviation bands standardize price extremes relative to their own history, adapting automatically to shifting volatility so that “extreme” always means statistically rare. The RSI, smoothed with an EMA before slope calculation, captures true momentum shifts without the false spikes that raw RSI often produces. Slope-phase memory flags prevent repeated alerts within a single swing, curbing over-trading in choppy conditions. Bar-coloring modes provide flexible visual contexts—whether you prefer to track the latest reversal, see signal age, highlight every breakout, or view a continuous gradient—and the scoring table breaks down all five core checks for complete transparency.
Features
This indicator offers a suite of configurable visual and logical tools designed to make reversal signals both robust and transparent:
Dynamic z-score bands that expand or contract in real time to reflect current volatility regimes, ensuring the outer ±zThreshold levels always represent statistically rare extremes.
A smooth EMA baseline that weights recent price more heavily, serving as a fair-value anchor around which deviations are measured.
EMA-smoothed RSI slope confirmation, which filters out erratic momentum spikes by first smoothing raw RSI and then requiring its bar-to-bar slope to flip before any signal is allowed.
Slope-phase memory logic that locks out duplicate buy or sell markers until the RSI slope crosses back through zero, preventing over-trading during choppy swings.
Four distinct bar-coloring modes—Reversal Solid, Reversal Fade, Exceeding Bands, Classic Heat—plus a “None” option, so traders can choose whether to highlight the latest signal, show signal age, emphasize breakout bars, or view a continuous heat gradient within the bands.
A semi-transparent fill between the EMA and the upper/lower bands that visually frames the statistical zone and makes extremes immediately obvious.
Concise “Up” and “Down” labels that plot exactly when price re-enters a band with confirming momentum, keeping chart clutter to a minimum.
A real-time, five-metric scoring table (z-score, RSI slope, price vs. EMA, trend state, re-entry) that updates every two bars, displaying individual +1/–1/0 scores and an averaged Buy/Sell/Neutral verdict for complete transparency.
Calculations
Compute the fair-value EMA over fairLen bars.
Subtract that EMA from current price each bar to derive the raw deviation.
Over zLen bars, calculate the rolling mean and standard deviation of those deviations.
Convert each deviation into a z-score by subtracting the mean and dividing by the standard deviation.
Plot the upper and lower bands at ±zThreshold × standard deviation around the EMA.
Calculate raw RSI over rsiLen bars, then smooth it with an EMA of length rsiEmaLen.
Derive the RSI slope by taking the difference between the current and previous smoothed RSI.
Detect a potential reentry when price exits one of the bands on the prior bar and re-enters on the current bar.
Require that reentry coincide with an RSI slope flip (positive for a lower-band reentry, negative for an upper-band reentry).
On first valid reentry per momentum swing, fire a buy or sell signal and set a memory flag; reset that flag only when the RSI slope crosses back through zero.
For each bar, assign scores of +1, –1, or 0 for the z-score direction, RSI slope, price vs. EMA, trend-state, and reentry status.
Average those five scores; if the result exceeds +0.1, label “Buy,” if below –0.1, label “Sell,” otherwise “Neutral.”
Update bar colors, the semi-transparent fill, reversal labels, and the scoring table every two bars to reflect the latest calculations.
How It Actually Works
On each new candle, the EMA baseline and band widths update to reflect current volatility. The RSI is smoothed and its slope recalculated. The script then looks back one bar to see if price exited either band and forward to see if it reentered. If that reentry coincides with an appropriate RSI slope flip—and no signal has yet been generated in that swing—a concise label appears. Bar colors refresh according to your selected mode, and the scoring table updates to show which of the five conditions passed or failed, along with the overall verdict. This process repeats seamlessly at each bar, giving traders a continuous feed of disciplined, statistically filtered reversal cues.
Inputs
All parameters are fully user-configurable, allowing you to tailor sensitivity, lookbacks, and visuals to your trading style:
EMA length (fairLen): number of bars for the fair-value EMA; higher values smooth more but lag further behind price.
Z-Score lookback (zLen): window for calculating the mean and standard deviation of price deviations; longer lookbacks reduce noise but respond more slowly to new volatility.
Z-Score threshold (zThreshold): number of standard deviations defining the upper and lower bands; common default is 2.0 for roughly the outer 5 percent of moves.
Source (src): choice of price series (close, hl2, etc.) used for EMA, deviation, and RSI calculations.
RSI length (rsiLen): period for raw RSI calculation; shorter values react faster to momentum changes but can be choppier.
RSI EMA length (rsiEmaLen): period for smoothing raw RSI before taking its slope; higher values filter more noise.
Bar coloring mode (colorMode): select from None, Reversal Solid, Reversal Fade, Exceeding Bands, or Classic Heat to control how bars are shaded in relation to signals and band positions.
Show signals (showSignals): toggle on-chart “Up” and “Down” labels for reversal entries.
Show scoring table (enableTable): toggle the display of the five-metric breakdown table.
Table position (tablePos): choose which corner (Top Left, Top Right, Bottom Left, Bottom Right) hosts the scoring table.
Conclusion
By merging a normalized z-score framework, momentum slope confirmation, disciplined signal memory, flexible visuals, and transparent scoring into one Pine Script overlay, Uptrick: Z-Trend Bands offers a powerful yet intuitive tool for intraday mean-reversion trading. Its adaptability to real-time volatility and multi-layered filter logic deliver clear, high-confidence reversal cues without the clutter or confusion of simpler indicators.
Disclaimer
This indicator is provided solely for educational and informational purposes. It does not constitute financial advice. Trading involves substantial risk and may not be suitable for all investors. Past performance is not indicative of future results. Always conduct your own testing and apply careful risk management before trading live.

Correlation Drift📈 Correlation Drift
The Correlation Drift indicator is designed to detect shifts in market momentum by analyzing the relationship between correlation and price lag. It combines the principles of correlation analysis and lag factor measurement to provide a unique perspective on trend alignment and momentum shifts.
🔍 Core Concept:
The indicator calculates the Correlation vs PLF Ratio, which measures the alignment between an asset’s price movement and a chosen benchmark (e.g., BTCUSD). This ratio reflects how well the asset’s momentum matches the market trend while accounting for price lag.
📊 How It Works:
Correlation Calculation:
The script calculates the correlation between the asset and the selected benchmark over a specified period.
A higher correlation indicates that the asset’s price movements are in sync with the benchmark.
Price Lag Factor (PLF) Calculation:
The PLF measures the difference between long-term and short-term price momentum, dynamically scaled by recent volatility.
It highlights potential overextensions or lags in the asset’s price movements.
Combining Correlation and PLF:
The Correlation vs PLF Ratio combines these metrics to detect momentum shifts relative to the trend.
The result is a dynamic, smoothed histogram that visualizes whether the asset is leading or lagging behind the trend.
💡 How to Interpret:
Positive Values (Green/Aqua Bars):
Indicates bullish alignment with the trend.
Aqua: Rising bullish momentum, suggesting continuation.
Teal: Decreasing bullish momentum, signaling caution.
Negative Values (Purple/Fuchsia Bars):
Indicates bearish divergence from the trend.
Fuchsia: Falling bearish momentum, indicating increasing pressure.
Purple: Rising bearish momentum, suggesting potential reversal.
Clipping for Readability:
Values are clipped between -3 and +3 to prevent outliers from compressing the histogram.
This ensures clear visualization of typical momentum shifts while still marking extreme cases.
🚀 Best Practices:
Use Correlation Drift as a confirmation tool in conjunction with trend indicators (e.g., moving averages) to identify momentum alignment or divergence.
Look for transitions from positive to negative (or vice versa) as signals of potential trend shifts.
Combine with volume analysis to strengthen confidence in breakout or breakdown signals.
⚠️ Key Features:
Customizable Settings: Adjust the correlation length, PLF length, and smoothing factor to fine-tune the indicator for different market conditions.
Visual Gradient: The histogram changes color based on the strength and direction of the ratio, making it easy to identify shifts at a glance.
Zero Line Reference: Clearly distinguishes between bullish and bearish momentum zones.
🔧 Recommended Settings:
Correlation Length: 14 (for short to medium-term analysis)
PLF Length: 50 (to smooth out noise while capturing trend shifts)
Smoothing Factor: 3 (for enhanced clarity without excessive lag)
Benchmark Symbol: BTCUSD (or another relevant market indicator)
By providing a quantitative measure of trend alignment while accounting for price lag, the Correlation Drift indicator helps traders make more informed decisions during periods of momentum change. Whether you are trading crypto, forex, or equities, this tool can be a powerful addition to your momentum-based trading strategies.
⚠️ Disclaimer:
The Correlation Drift indicator is a technical analysis tool designed to aid in identifying potential shifts in market momentum and trend alignment. It is intended for informational and educational purposes only and should not be considered as financial advice or a recommendation to buy, sell, or hold any financial instrument.
Trading financial instruments, including cryptocurrencies, involves significant risk and may result in the loss of your capital. Past performance is not indicative of future results. Always conduct thorough research and seek advice from a certified financial professional before making any trading decisions.
The developer (RWCS_LTD) is not responsible for any trading losses or adverse outcomes resulting from the use of this indicator. Users are encouraged to test and validate the indicator in a simulated environment before applying it to live trading. Use at your own risk.

3CRGANG - Histogram (Basic)This indicator provides traders with a unified view of momentum by combining multiple classic oscillators into a single histogram. By aggregating momentum signals into one visual output, it simplifies trend analysis, helping traders identify momentum shifts without managing multiple indicators separately.
What It Does
The 3CRGANG - Histogram (Basic) calculates a momentum-based histogram using a user-selected oscillator (e.g., RSI, MACD, MFI, RVI, Stochastic, Stochastic RSI, or TMASlope). The histogram is plotted with color-coded bars to indicate bullish, bearish, or neutral momentum, alongside predefined alert levels and a trend status table for quick reference.
Why It’s Useful
This script addresses the challenge of monitoring multiple momentum indicators by consolidating them into a single histogram. Each oscillator measures momentum differently (e.g., RSI tracks price strength, MACD focuses on moving average convergence, MFI incorporates volume), but the script normalizes these signals into a unified output. This reduces chart clutter and provides a clear, actionable signal for identifying trend direction, making it easier for traders to focus on key momentum shifts across various market conditions.
How It Works
The script follows these steps to generate the histogram:
Oscillator Selection: Traders choose one oscillator to base the histogram on. For example: RSI measures the speed and change of price movements, MACD tracks the relationship between two exponential moving averages, and MFI combines price and volume to measure buying/selling pressure. The choice of oscillator affects the histogram’s sensitivity to price movements.
Fast Oscillator Calculation: A fast-moving oscillator is computed using the selected method over a user-defined period (default: 8 bars). For instance, RSI calculates the relative strength of price gains versus losses, while MACD computes the difference between short and long EMAs. The result is normalized to a range centered around zero.
Histogram Plotting: The oscillator’s output is adjusted by a modification factor (default: 1) for sensitivity tuning and plotted as a histogram. Positive values indicate bullish momentum, negative values indicate bearish momentum, and values near zero suggest a lack of clear trend.
Color Coding: Bars are colored based on momentum and price direction: green for bullish momentum (price moving upward, histogram value typically positive), red for bearish momentum (price moving downward, histogram value typically negative), and grey for neutral momentum (ranging conditions or unclear trend).
Alert Levels: Predefined buy and sell levels are plotted as dotted lines to mark significant momentum thresholds. For most oscillators, levels are set at 20 (buy) and -20 (sell), representing overbought/oversold conditions based on historical performance. For TMASlope, levels are adjusted to 0.04 and -0.04, as it measures the slope of a triangular moving average relative to the average true range (ATR).
Trend Table: A table in the top-right corner displays the current timeframe’s trend status ("Buy Only," "Sell Only," or "Ranging") based on the histogram value, price direction, and alert levels, along with the histogram’s numerical value.
Underlying Concepts
The script is built on the concept of momentum aggregation, aiming to capture short-term price dynamics while filtering noise. By using a fast-moving oscillator, it emphasizes recent price action, and the histogram format provides a visual summary of momentum strength. The alert levels are derived from typical overbought/oversold thresholds for each oscillator, adjusted to ensure consistency across different methods. The trend table adds a layer of interpretation, helping traders quickly assess whether the momentum aligns with the broader trend.
Use Case
Trending Markets: In a bullish trend, green bars above the buy alert level (e.g., 20) indicate strong upward momentum, suggesting potential long entries. In a bearish trend, red bars below the sell alert level (e.g., -20) suggest short opportunities.
Ranging Markets: Grey bars or values between alert levels indicate a lack of clear momentum, prompting caution or scalping strategies.
Confirmation Tool: Use the histogram to confirm price action signals, such as breakouts or reversals, by ensuring momentum aligns with the direction of the move. For example, a breakout with green bars above the buy level may signal a stronger trend.
Settings
Choose Type: Select the oscillator to use (default: RSI - CLASSIC).
Source: Choose between Close or HL2 price data (default: Close).
Histogram Length: Set the period for oscillator calculation (options: 5, 8, 13; default: 8).
Modification Factor: Adjust the sensitivity of the histogram (default: 1).
Notes
The script supports classic oscillators only and operates on the current timeframe.
If volume data is unavailable for your ticker, MFI calculations may not work; select another oscillator to continue plotting.
Disclaimer
This indicator is a tool for analyzing market trends and does not guarantee trading success. Trading involves risk, and past performance is not indicative of future results. Always use proper risk management.

Momentum Volatility Ratio | AlphaNattMomentum Volatility Ratio | AlphaNatt
The Momentum Volatility Ratio (MVR) is a sophisticated indicator that measures price impulses relative to an asset's inherent volatility. Unlike standard momentum indicators, MVR adapts to changing market conditions by normalizing momentum against historical volatility patterns, helping traders identify truly significant price movements.
Key Features:
• Adapts automatically to each asset's volatility profile
• Distinguishes between normal market noise and significant impulses
• Beautiful gradient visualization with modern Quantra-inspired aesthetics
• Responsive and clear signals with minimal lag
• Customizable sensitivity and appearance settings
How It Works:
The MVR calculates normalized price momentum and adjusts it by recent volatility metrics. This volatility-adjustment ensures the indicator remains consistent across different market environments and timeframes. When price momentum exceeds what would be expected given the asset's normal volatility, the indicator shows a significant impulse that traders can act upon.
Indicator Components:
• Cyan Histogram/Background - Represents positive momentum impulses
• Magenta Histogram/Background - Represents negative momentum impulses
• Neutral Bands - Define the transition between normal and significant impulses
• Gradient Background - Provides visual context for impulse strength
• Smooth Histogram - Shows the main impulse signal with a beautiful glow effect
Trading Signals:
1. Strong Positive Impulse - When cyan histogram bars grow significantly above the zero line
2. Strong Negative Impulse - When magenta histogram bars extend significantly below the zero line
3. Impulse Weakening - When histogram bars begin to shrink toward the zero line
4. Momentum Shift - When the histogram changes color, indicating a potential trend change
Customizable Parameters:
• Length - Base calculation period for momentum (default: 6)
• Volatility Lookback - Historical period for volatility calculation (default: 100)
• Neutral Bands Length - Smoothing period for neutral bands (default: 15)
• Neutral Bands Multiplier - Controls width of neutral bands (default: 0.5)
• Standard Deviation Lookback - Period for standard deviation calculation (default: 150)
• Standard Deviation Multiplier - Controls sensitivity of extreme bands (default: 2.5)
• Style - Choose between Classic, Modern, and Signal visualization modes
Best Practices:
• Use MVR alongside price action for confirmation
• Watch for extreme readings followed by momentum shifts
• Pay attention to divergences between price and MVR
• Consider longer-term trends when interpreting signals
• Use shorter settings for more frequent signals, longer settings for less noise
About the Opus Series:
The MVR indicator is part of the Opus series of premium-quality technical indicators designed with both functional excellence and aesthetic beauty. Opus indicators feature smooth gradients, crisp visualization, and powerful analytical capabilities to enhance your trading experience.
For questions, feedback, or custom indicator requests, please feel free to leave a comment or contact me directly.
Happy Trading!
Not financial Advice

Uptrick: FRAMA Matrix RSIUptrick: FRAMA Matrix RSI
Introduction
The Uptrick: FRAMA Matrix RSI is a momentum-based indicator that integrates the Relative Strength Index (RSI) with the Fractal Adaptive Moving Average (FRAMA). By applying FRAMA's adaptive smoothing to RSI—and further refining it with a Zero-Lag Moving Average (ZLMA)—this script creates a refined and reliable momentum oscillator. The indicator now includes enhanced divergence detection, potential reversal signals, customizable buy/sell signal options, an internal stats table, and a fully customizable bar coloring system for an enhanced visual trading experience.
Why Combine RSI with FRAMA
Traditional RSI is a well-known momentum indicator but has several limitations. It is highly sensitive to price fluctuations, often generating false signals in choppy or volatile markets. FRAMA, in contrast, adapts dynamically to price changes by adjusting its smoothing factor based on market conditions.
By integrating FRAMA into RSI calculations, this indicator reduces noise while preserving RSI's ability to track momentum, adapts to volatility by reducing lag in trending markets and smoothing out choppiness in ranging conditions, enhances trend-following capability for more reliable momentum shifts, and refines overbought and oversold signals by adjusting to the current market structure.
With the new enhancements, such as a manual alpha input, noise filtering, divergence detection, and multiple buy/sell signal options, the indicator offers even greater flexibility and precision for traders. This combination improves the standard RSI by making it more adaptive and responsive to market changes.
Originality
This indicator is unique because it applies FRAMA's adaptive smoothing technique to RSI, creating a dynamic momentum oscillator that adjusts to different market conditions. Many traditional RSI-based indicators either use fixed smoothing methods like exponential moving averages or employ basic RSI calculations without adjusting for volatility.
This script stands out by integrating several elements, including the fractal dimension-based smoothing of FRAMA to reduce noise while retaining responsiveness, the use of Zero-Lag Moving Average smoothing to enhance trend sensitivity and reduce lag, divergence detection to highlight mismatches between price action and RSI momentum, a noise filter and manual alpha option to prevent minor fluctuations from generating false signals, customizable buy/sell signal options that let traders choose between ZLMA-based or FRAMA RSI-based signals, an internal stats table displaying real-time FRAMA calculations such as fractal dimension and the adaptive alpha factor, and a fully customizable bar coloring system to visually distinguish bullish, bearish, and neutral conditions.
Features
Adaptive FRAMA RSI
The indicator applies FRAMA to RSI values, making the momentum oscillator adaptive to volatility while filtering out noise. Unlike a traditional RSI that reacts equally to all price movements, FRAMA RSI adjusts its smoothing factor based on market structure, making it more effective for identifying true momentum shifts.
Zero-Lag Moving Average (ZLMA)
A smoothing technique that minimizes lag while preserving the responsiveness of price movements. It is applied to the FRAMA RSI to further refine signals and ensure smoother trend detection.
Bullish and Bearish Threshold Crossovers
This system compares FRAMA RSI to a user-defined threshold (default is 50). When FRAMA RSI moves above the threshold, it indicates bullish momentum, while movement below signals bearish conditions. The enhanced noise filter ensures that only significant moves trigger signals.
Noise Filter and Manual Alpha
A new noise filter input prevents tiny fluctuations from triggering false signals. In addition, a manual alpha option allows traders to override the automatically computed smoothing factor with a custom value, providing extra control over the indicator’s sensitivity.
Divergence Detection
The indicator identifies divergence patterns by comparing FRAMA RSI pivots to price action. Bullish divergence occurs when price makes a lower low while FRAMA RSI makes a higher low, and bearish divergence occurs when price makes a higher high while FRAMA RSI makes a lower high. These signals can help traders anticipate potential reversals.
Reversal Signals
Labels appear on the chart when FRAMA RSI confirms classic RSI overbought (70) or oversold (30) conditions, providing visual cues for potential trend reversals.
Buy and Sell Signal Options
Traders can now choose between two signal-generation methods. ZLMA-based signals trigger when the ZLMA of FRAMA RSI crosses key overbought (70) or oversold (30) levels, while FRAMA RSI-based signals trigger when FRAMA RSI itself crosses these levels. This added flexibility allows users to tailor the indicator to their preferred trading style.
ZLMA:
FRAMA:
Customizable Alerts
Alerts notify traders when FRAMA RSI crosses key levels, divergence signals occur, reversal conditions are met, or buy/sell signals trigger. This ensures that important trading events are not missed.
Fully Customizable Bar Coloring System
Users can color bars based on different conditions, enhancing visual clarity. Bar coloring modes include: FRAMA RSI threshold (bars change color based on whether FRAMA RSI is above or below the threshold), ZLMA crossover (bars change when ZLMA crosses overbought or oversold levels), buy/sell signals (bars change when official signals trigger), divergence (bars highlight when bullish or bearish divergence is detected), and reversals (bars indicate when RSI reaches overbought or oversold conditions confirmed by FRAMA RSI). The system also remembers the last applied bar color, ensuring a smooth visual transition.
Input Parameters and Features
Core Inputs
RSI Length (default: 14) defines the period for RSI calculations.
FRAMA Lookback (default: 16) determines the length for the FRAMA smoothing function.
RSI Bull Threshold (default: 50) sets the level above which the market is considered bullish and below which it is bearish.
Noise Filter (default: 1.0) ensures that small fluctuations do not trigger false bullish or bearish signals.
Additional Features
Show Bull and Bear Alerts (default: true) enables notifications when FRAMA RSI crosses the threshold.
Enable Divergence Detection (default: false) highlights bullish and bearish divergences based on price and FRAMA RSI pivots.
Show Potential Reversal Signals (default: false) identifies overbought (70) and oversold (30) levels as possible trend reversal points.
Buy and Sell Signal Option (default: ZLMA) allows traders to choose between ZLMA-based signals or FRAMA RSI-based signals for trade entry.
ZLMA Enhancements
ZLMA Length (default: 14) determines the period for the Zero-Lag Moving Average applied to FRAMA RSI.
Visualization Options
Show Internal Stats Table (default: false) displays real-time FRAMA calculations, including fractal dimension and the adaptive alpha smoothing factor.
Show Threshold FRAMA Signals (default: false) plots buy and sell labels when FRAMA RSI crosses the threshold level.
How It Works
FRAMA Calculation
FRAMA dynamically adjusts smoothing based on the price fractal dimension. The alpha smoothing factor is derived from the fractal dimension or can be set manually to maintain responsiveness.
RSI with FRAMA Smoothing
RSI is calculated using the user-defined lookback period. FRAMA is then applied to the RSI to make it more adaptive to volatility. Optionally, ZLMA is applied to further refine the signals and reduce lag.
Bullish and Bearish Threshold Crosses
A bullish condition occurs when FRAMA RSI crosses above the threshold, while a bearish condition occurs when it falls below. The noise filter ensures that only significant trend shifts generate signals.
Buy and Sell Signal Options
Traders can choose between ZLMA crossovers or FRAMA RSI crossovers as the basis for buy and sell signals, offering flexibility in trade entry timing.
Divergence Detection
The indicator identifies divergences where price action and FRAMA RSI momentum do not align, potentially signaling upcoming reversals.
Reversal Signal Labels
When classic RSI overbought or oversold levels are confirmed by FRAMA RSI conditions, reversal labels are added on the chart to highlight potential exhaustion points.
Bar Coloring System
Bars are dynamically colored based on various conditions such as RSI thresholds, ZLMA crossovers, buy/sell signals, divergence, and reversals, allowing traders to quickly interpret market sentiment.
Alerts and Internal Stats
Customizable alerts notify traders of key events, and an optional internal stats table displays real-time calculations (fractal dimension, alpha value, and RSI values) to help users understand the underlying dynamics of the indicator.
Summary
The Uptrick: FRAMA Matrix RSI offers an enhanced approach to momentum analysis by combining RSI with adaptive FRAMA smoothing and additional layers of signal refinement. The indicator now includes adaptive RSI smoothing to reduce noise and improve responsiveness, Zero-Lag Moving Average filtering to minimize lag, divergence and reversal detection to identify potential turning points, customizable buy/sell signal options that let traders choose between different signal methodologies, a fully customizable bar coloring system to visually distinguish market conditions, and an internal stats table for real-time insight into FRAMA calculation parameters.
Whether used for trend confirmation, divergence detection, or momentum-based strategies, this indicator provides a powerful and adaptive approach to trading.
Disclaimer
This script is for informational and educational purposes only. Trading involves risk, and past performance does not guarantee future results. Always conduct proper research and consult with a financial advisor before making trading decisions.

Prime OscilatorPrime Oscilator is a powerful tool designed to help traders track momentum shifts and confirm trends in volatile markets. This oscillator-based tool integrates advanced market analysis techniques to provide a clear picture of momentum and trend direction, helping traders stay in sync with the prevailing market conditions.
Core Features of Prime Oscilator
Oscillator-Based Momentum Tracking: Prime Oscilator operates as a dynamic oscillator that tracks shifts in market momentum by analyzing the relationship between the A/D line and its signal line. This allows traders to identify potential changes in market direction and confirm trend strength.
Trend Confirmation Filter: Prime Oscilator incorporates a long-term trend filter, using a 50-period Simple Moving Average (SMA) to confirm whether the market is trending upward or downward. This helps traders focus on trades that align with the broader market direction.
Adaptive Signal Line: The oscillator’s signal line adjusts dynamically to reflect short-term momentum changes, allowing traders to react quickly to evolving market conditions. This makes the Prime Oscilator highly responsive to both fast-moving and stable markets.
Color-Coded Oscillator Line: The oscillator line changes color based on the current market conditions, providing a visual cue of momentum shifts. The line remains green during upward momentum and red during downward momentum, giving traders an easy way to gauge the market direction.
How Prime Oscilator Works
Prime Oscilator blends the power of trend analysis with momentum tracking to provide a comprehensive view of market conditions. By analyzing the Accumulation/Distribution (A/D) line and comparing it to a dynamic signal line, traders can monitor momentum shifts and confirm trends.
A/D Line Crossover: The indicator uses the relationship between the A/D line and the signal line to detect potential momentum changes. When the A/D line moves relative to the signal line, it reflects shifts in market momentum, allowing traders to follow the direction of the trend.
Trend Filtering: To ensure that momentum is aligned with the broader market direction, Prime Oscilator uses a 50-period SMA as a trend filter. This confirms whether the market is in an uptrend or downtrend and helps traders avoid focusing on short-term fluctuations that go against the prevailing trend.
Why It's Useful for Traders
Prime Oscilator is especially valuable for traders looking for a reliable way to track momentum shifts while aligning their trades with the overall market trend. This reduces noise and ensures that traders focus on opportunities that are in line with broader market movements.
Momentum-Based Trend Analysis: By tracking momentum changes, Prime Oscilator helps traders stay on top of potential market shifts without the noise that comes from traditional indicators.
Clear Visual Feedback: The color-coded oscillator line provides instant feedback on market conditions, allowing traders to focus on decision-making rather than analyzing multiple indicators.
Flexible Across Markets and Timeframes: Whether you are trading in volatile markets or more stable environments, Prime Oscilator adapts to different market conditions, ensuring you always have a clear picture of momentum and trend.
Prime Oscilator is ideal for traders who:
Scalp or trade intraday: Quickly captures momentum shifts in short timeframes.
Swing traders: Identifies potential trend reversals in higher timeframes while confirming momentum strength.
Trend followers: Ensures your trades are aligned with the prevailing market trend by confirming momentum shifts.
By combining momentum analysis with trend direction, Prime Oscilator offers a dynamic view of the market, helping traders navigate changing conditions with ease.
Why It's Worth Paying For
Prime Oscilator provides several unique advantages that make it a valuable tool for traders:
Clear and Actionable Insights: The oscillator-based momentum tracking gives traders a clear understanding of when the market's momentum is shifting, allowing for more informed trading decisions.
No Lagging: Unlike some trend-following indicators, Prime Oscilator reacts dynamically to market changes, helping traders stay aligned with the current market direction.
Adaptable and Flexible: Whether you trade on shorter timeframes or hold longer positions, Prime Oscilator adapts seamlessly to various market conditions. The trend filter ensures that traders remain aligned with broader market trends.
Visual Simplicity: The color-coded oscillator line and background shading provide an easy-to-read way of monitoring market conditions, enabling faster decision-making.
How to Get Access
To gain access to Prime Oscilator , please send me a direct message on TradingView or follow the provided link to request access. Ensure that access requests are made privately so the comments section remains focused on discussions related to the script’s performance and use.
Risk Disclaimer
While Prime Oscilator offers valuable insights into market momentum and trends, it’s important to note the following:
Past performance is not indicative of future results: Prime Oscilator ’s trend and momentum analysis are based on historical data, and no indicator can predict future price movements with certainty.
Market Conditions: The effectiveness of the Prime Oscilator may vary across different market conditions, and traders should always use proper risk management when trading.
Trading Risks: Like any trading tool, Prime Oscilator should be used as part of a comprehensive trading strategy that includes risk management techniques such as stop-loss orders and position sizing.

Momentum Ghost Machine [ChartPrime]Momentum Ghost Machine (ChartPrime) is designed to be the next generation in momentum/rate of change analysis. This indicator utilizes the properties of one of our favorite filters to create a more accurate and stable momentum oscillator by using a high quality filtered delayed signal to do the momentum comparison.
Traditional momentum/roc uses the raw price data to compare current price to previous price to generate a directional oscillator. This leaves the oscillator prone to false readings and noisy outputs that leave traders unsure of the real likelihood of a future movement. One way to mitigate this issue would be to use some sort of moving average. Unfortunately, this can only go so far because simple moving average algorithms result in a poor reconstruction of the actual shape of the underlying signal.
The windowed sinc low pass filter is a linear phase filter, meaning that it doesn't change the shape or size of the original signal when applied. This results in a faithful reconstruction of the original signal, but without the "high frequency noise". Just like any filter, the process of applying it requires that we have "future" samples resulting in a time delay for real time applications. Fortunately this is a great thing in the context of a momentum oscillator because we need some representation of past price data to compare the current price data to. By using an ideal low pass filter to generate this delayed signal we can super charge the momentum oscillator and fix the majority of issues its predecessors had.
This indicator has a few extra features that other momentum/roc indicators dont have. One major yet simple improvement is the inclusion of a moving average to help gauge the rate of change of this indicator. Since we included a moving average, we thought it would only be appropriate to add a histogram to help visualize the relationship between the signal and its average. To go further with this we have also included linear extrapolation to further help you predict the momentum and direction of this oscillator. Included with this extrapolation we have also added the histogram in the extrapolation to further enhance its visual interpretation. Finally, the inclusion of a candle coloring feature really drives how the utility of the Momentum Machine .
There are three distinct options when using the candle coloring feature: Direct, MA, and Both. With direct the candles will be colored based on the indicators direction and polarity. When it is above zero and moving up, it displays a green color. When it is above zero and moving down it will display a light green color. Conversely, when the indicator is below zero and moving down it displays a red color, and when it it moving up and below zero it will display a light red color. MA coloring will color the candles just like a MACD. If the signal is above its MA and moving up it will display a green color, and when it is above its MA and moving down it will display a light green color.
When the signal is below its MA and moving down it will display a red color, and when its below its ma and moving up it will display a light red color. Both combines the two into a single color scheme providing you with the best of both worlds. If the indicator is above zero it will display the MA colors with a slight twist. When the indicator is moving down and is below its MA it will display a lighter color than before, and when it is below zero and is above its MA it will display a darker color color.
Length of 50 with a smoothing of 100
Length of 50 with a smoothing of 25
By default, the indicator is set to a momentum length of 50, with a post smoothing of 2. We have chosen the longer period for the momentum length to highlight the performance of this indicator compared to its ancestors. A major point to consider with this indicator is that you can only achieve so much smoothing for a chosen delay. This is because more data is required to produce a smoother signal at a specified length. Once you have selected your desired momentum length you can then select your desired momentum smoothing . This is made possible by the use of the windowed sinc low pass algorithm because it includes a frequency cutoff argument. This means that you can have as little or as much smoothing as you please without impacting the period of the indicator. In the provided examples above this paragraph is a visual representation of what is going on under the hood of this indicator. The blue line is the filtered signal being compared to the current closing price. As you can see, the filtered signal is very smooth and accurately represents the underlying price action without noise.
We hope that users can find the same utility as we did in this indicator and that it levels up your analysis utilizing the momentum oscillator or rate of change.
Enjoy
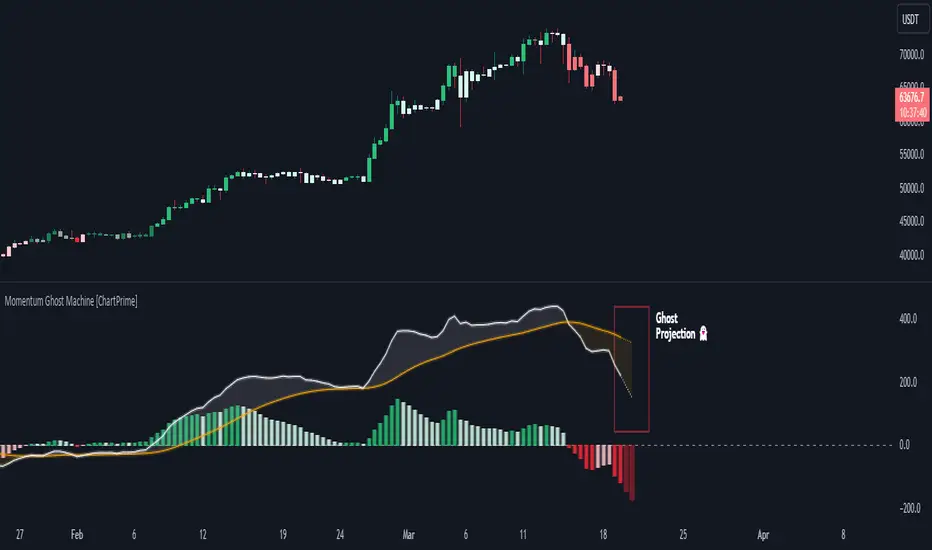
Momentum Marks - Buy and Sell IndicatorsIndicator Overview
This tool is a multi‑factor entry signal system designed to highlight potential BUY and SHORT opportunities directly on the chart with hard‑anchored labels. It combines trend, momentum, volatility, and volume conditions to reduce noise and provide more reliable trade signals.
Core Components
- EMA Trend Filter
- Uses a fast EMA (9) and a slow EMA (21) to determine short‑term vs. medium‑term trend direction.
- Signals only trigger when price aligns with the EMA relationship (e.g., fast above slow for shorts, fast below slow for buys).
- RSI Extremes
- RSI thresholds (default 65/35) ensure signals occur only when momentum is stretched into overbought or oversold zones.
- Helps avoid false triggers during neutral conditions.
- Linear Regression Channel
- A regression line with ±2 standard deviation bands defines dynamic support and resistance.
- Signals require price to be near the top (for shorts) or bottom (for buys) of the channel, adding a structural filter.
- TTM Squeeze Histogram
- Measures momentum shifts by comparing price to its EMA.
- Signals require histogram confirmation: weakening momentum for shorts, strengthening momentum for buys.
- Volume Confirmation
- Volume must fade for shorts or surge for buys relative to a 20‑period average.
- Ensures signals align with participation strength.
Visual Output
- Red “SHORT” label above bars when all short conditions align.
- Green “BUY” label below bars when all buy conditions align.
- Optional plotshape arrows (triangles) as backup markers.
- Linear regression channel shaded between upper and lower bands.
- EMA lines plotted for trend context.
Key Features
- Hard‑anchored labels: Signals are locked to confirmed bars, preventing repainting or shifting.
- Multi‑layer confirmation: Requires trend, momentum, volume, and structure to align before firing.
- Customizable inputs: Users can adjust EMA lengths, RSI thresholds, regression length, and squeeze parameters.

Momentum Permission + Pivot Entry + Exit (v1.4 FULL)//@version=5
indicator("Momentum Permission + Pivot Entry + Exit (v1.4 FULL)", overlay=true)
// ──────────────────────────────────────────────
// Inputs
// ──────────────────────────────────────────────
smaLength = input.int(50, "SMA Length")
relVolThresh = input.float(1.3, "Relative Volume Threshold")
pivotLookback = input.int(3, "Pivot Lookback Bars")
// ──────────────────────────────────────────────
// Core Calculations
// ──────────────────────────────────────────────
sma50 = ta.sma(close, smaLength)
vwap = ta.vwap(close)
relVol = volume / ta.sma(volume, 10)
aboveSMA = close > sma50
aboveVWAP = close > vwap
relStrong = relVol > relVolThresh
greenCandle = close > open
crossUp = ta.crossover(close, sma50)
// ──────────────────────────────────────────────
// One-Time Daily Permission
// ──────────────────────────────────────────────
var bool permission = false
if ta.change(time("D"))
permission := false
permitSignal = crossUp and aboveVWAP and relStrong and not permission
if permitSignal
permission := true
// ──────────────────────────────────────────────
// Entry: Pivot Break Continuation
// ──────────────────────────────────────────────
pivotHighBreak = close > ta.highest(high , pivotLookback)
entrySignal = (
permission and
aboveSMA and
aboveVWAP and
relStrong and
greenCandle and
pivotHighBreak
)
// ──────────────────────────────────────────────
// Exit: Trend Exhaustion / VWAP Breakdown
// ──────────────────────────────────────────────
smaChange = sma50 - sma50
exitSignal = (
permission and
close < vwap and
close < open and
relStrong and
smaChange < 0
)
// ──────────────────────────────────────────────
// VISUAL PLOTS (same as before)
// ──────────────────────────────────────────────
plot(sma50, title="SMA50", color=color.orange, linewidth=2)
plot(vwap, title="VWAP", color=color.new(color.blue, 0), linewidth=2)
plotshape(
permitSignal,
title="Trend Permission",
style=shape.triangleup,
location=location.belowbar,
color=color.new(color.green, 0),
size=size.large,
text="PERMIT"
)
plotshape(
entrySignal,
title="Entry Trigger",
style=shape.triangleup,
location=location.abovebar,
color=color.new(color.aqua, 0),
size=size.normal,
text="ENTRY"
)
plotshape(
exitSignal,
title="Exit Signal",
style=shape.triangledown,
location=location.abovebar,
color=color.new(color.red, 0),
size=size.large,
text="EXIT"
)
// ──────────────────────────────────────────────
// SCREENER OUTPUT (persistent 0/1 for the day)
// ──────────────────────────────────────────────
var bool permitToday = false
var bool entryToday = false
var bool exitToday = false
if ta.change(time("D"))
permitToday := false
entryToday := false
exitToday := false
if permitSignal
permitToday := true
if entrySignal
entryToday := true
if exitSignal
exitToday := true
// Hidden plots for screener columns
plot(permitToday ? 1 : 0, title="PERMIT", display=display.none)
plot(entryToday ? 1 : 0, title="ENTRY", display=display.none)
plot(exitToday ? 1 : 0, title="EXIT", display=display.none)
// Alerts
alertcondition(permitSignal, title="PERMIT", message="Momentum PERMISSION fired")
alertcondition(entrySignal, title="ENTRY", message="Momentum ENTRY fired")
alertcondition(exitSignal, title="EXIT", message="Momentum EXIT fired")
