[CT] ATR Ratio MTFThis indicator is an enhanced, multi-timeframe version of the original “ATR ratio” by RafaelZioni. Huge thanks to RafaelZioni for the core concept and base logic. The script still combines an ATR-based ratio (Z-score style reading of where price sits within its recent ATR envelope) with an ATR Supertrend, but expands it into a more flexible trade-decision and visual context tool.
The ATR ratio is normalized so you can quickly see when price is pressing into extended bullish or bearish territory, while the Supertrend defines directional bias and a dynamic support-resistance trail. You can choose any higher timeframe in the settings, allowing you to run the ATR ratio and Supertrend from a larger anchor timeframe while trading on a lower chart.
Upgrades include a full Pine Script v6 rewrite, multi-timeframe support for both the ATR ratio and Supertrend, user-controlled colors for the Supertrend in bull and bear modes, and optional bar coloring so price bars automatically reflect Supertrend direction. Entry, pyramiding and take-profit logic from the original script are preserved, giving you a familiar framework with more control over timeframe, visuals and trend bias.
This indicator is designed to give you a clean directional framework that blends volatility, trend, and timing into one view. The ATR ratio side of the script shows you where price sits inside a recent ATR-based envelope. When the ATR ratio pushes up and sustains above the bullish threshold, it signals that price is trading in an extended, momentum-driven zone relative to recent volatility. When it drops and holds below the bearish threshold, it shows the opposite: sellers have pushed price down into an extended bearish zone. The optional background coloring simply makes these bullish and bearish environments easier to see at a glance.
On top of that, the Supertrend and bar colors tell you what side of the market to favor. The Supertrend is calculated from ATR on whatever timeframe you choose in the settings. If you set the MTF input to a higher timeframe, the Supertrend and ATR ratio become your higher time frame bias while you trade on a lower chart. When price is above the MTF Supertrend, the line uses your bullish color and, if bar coloring is enabled, candles adopt your bullish bar color. That is your “long only” environment: you generally look for buys when price is above the Supertrend and the ATR ratio is either turning up from neutral or already in a bullish zone. When price is below the MTF Supertrend, the line uses your bearish color and candles can shift to your bearish bar color; that is where you focus on shorts, especially when the ATR ratio is rolling over or holding in the bearish zone.
The built-in long and short conditions are meant as signal prompts, not rigid rules. Long signals fire when the ATR ratio crosses up through a positive level while the Supertrend is bullish. Short signals fire when the ATR ratio crosses down through a negative level while the Supertrend is bearish. The script tracks how many longs or shorts have been taken in sequence (pyramiding) and will only allow a new signal up to the limit you set, so you can control how aggressively you stack positions in a trend. The take-profit logic then watches the percentage move from your last entry and flags “TP” when that move has reached your take-profit percent, helping you standardize exits instead of eyeballing them bar by bar.
In practice you typically start by choosing your anchor timeframe for the MTF setting, for example a 1-hour or 4-hour Supertrend and ATR ratio while watching a 5-minute or 15-minute chart. You then use the Supertrend direction and bar colors as your bias filter, only taking signals in the direction of the trend, and you use the ATR ratio behavior to judge whether you are entering into strength, fading an extreme, or trading inside a neutral consolidation. Over time this gives you a consistent way to answer three questions on every chart: which side am I allowed to trade, how extended is price within its recent volatility, and where are my structured entries and exits based on that framework.
חפש סקריפטים עבור "mtf"

Adaptive ATR% Grid + SuperTrend + OrderFlipDescription:
This indicator combines multiple technical analysis tools to identify key price levels and trading signals:
ATR% Grid – automatic plotting of support and resistance levels based on current price and volatility (ATR). Useful for identifying potential targets and entry/exit zones.
SuperTrend – a classic trend indicator with an adaptive ATR multiplier that adjusts based on average volatility.
OrderFlip – identifies price reversal points relative to a moving average with ATR-based sensitivity, optionally filtered by OBV and DMI.
MTF Confirmation – multi-timeframe trend verification using EMA to reduce false signals.
Signal Labels – "LONG" and "SHORT" labels appear on the chart with an offset from the price for better visibility.
JSON Alerts – ready-to-use format for automated alerts, including price, SuperTrend direction, Fair Zone, and ATR%.
Features:
Fully compatible with Pine Script v6
Lines and signals are fixed on the chart, do not shift with new bars
Configurable grid, ATR, SuperTrend, and filter parameters
Works with MTF analysis and classic indicators (OBV/DMI)
Usage:
Best used with additional indicators and risk management strategies. ATR% Grid is ideal for both positional trading and intraday setups.
перевод на русский
Описание:
Этот индикатор объединяет несколько методов технического анализа для выявления ключевых уровней цены и сигналов на покупку/продажу:
Сетка ATR% (ATR% Grid) – автоматическое построение уровней поддержки и сопротивления на основе текущей цены и волатильности (ATR). Позволяет видеть потенциальные цели и зоны входа/выхода.
SuperTrend – классический трендовый индикатор с адаптивным множителем ATR, который корректируется на основе средней волатильности.
OrderFlip – определение моментов разворота цены относительно скользящей средней с учетом ATR, с возможностью фильтрации по OBV и DMI.
MTF-подтверждение – проверка направления тренда на нескольких таймфреймах с помощью EMA, чтобы снизить ложные сигналы.
Сигнальные метки – на графике появляются "LONG" и "SHORT" с отступом от цены для наглядности.
JSON Alerts – готовый формат для автоматических уведомлений, включающий цену, направление SuperTrend, Fair Zone и ATR%.
Особенности:
Поддержка Pine Script v6
Линии и сигналы закреплены на графике, не двигаются при обновлении свечей
Настраиваемые параметры сетки, ATR, SuperTrend и фильтров
Совместимость с MTF-анализом и классическими индикаторами OBV/DMI
Рекомендации:
Используйте в сочетании с другими индикаторами и стратегиями управления риском. Сетка ATR% отлично подходит для позиционной торговли и интрадей.
ATR% Grid – automatic plotting of support and resistance levels based on current price and volatility (ATR). Useful for identifying potential targets and entry/exit zones.
SuperTrend – a classic trend indicator with an adaptive ATR multiplier that adjusts based on average volatility.

Smart RSI MTF Matrix [DotGain]Summary
Are you tired of trading trend signals, only to miss the bigger picture because you are focused on a single timeframe?
The Smart RSI MTF Matrix is the ultimate "Cockpit View" for momentum traders. Unlike chart overlays that can sometimes clutter your price action, this indicator organizes RSI conditions across 10 different timeframes simultaneously into a clean, separate Heatmap pane.
It monitors everything from the 5-minute chart all the way up to the 12-Month view , giving you a complete X-ray vision of the market's momentum structure instantly.
⚙️ Core Components and Logic
The Smart RSI MTF Matrix relies on a sophisticated hierarchy to deliver clear, actionable context:
Multi-Timeframe Engine: The script runs 10 independent RSI calculations in the background, organized in rows from bottom (Short Term) to top (Long Term).
Classic RSI Thresholds:
Overbought (> 70): Indicates price may be extended to the upside.
Oversold (< 30): Indicates price may be extended to the downside.
Smart Visibility System (The "Secret Sauce"): Not all signals are equal. A 5-minute signal is "noise" compared to a Yearly signal. This indicator automatically applies Transparency to differentiate importance. The visibility increases by 10% for each higher timeframe slot (Row).
🚦 How to Read the Matrix
The indicator plots dots in 10 stacked rows. The position and opacity tell you the direction and significance:
🟥 RED DOTS (Overbought Condition)
Trigger: RSI is above 70 on that specific timeframe.
Meaning: Potential bearish reversal or pullback.
🟩 GREEN DOTS (Oversold Condition)
Trigger: RSI is below 30 on that specific timeframe.
Meaning: Potential bullish reversal or bounce.
⚪ GRAY DOTS (Neutral)
Trigger: RSI is between 30 and 70.
Meaning: No extreme momentum present.
👻 TRANSPARENCY (Signal Strength)
The visibility of the dot tells you exactly which Timeframe (Row) is triggered. The higher the row, the more solid the color:
Faint (10-30% Visibility): Rows 1-3 (5m, 15m, 1h). Used for scalping entries.
Medium (40-60% Visibility): Rows 4-6 (4h, 1D, 1W). Used for swing trading context.
Solid (70-100% Visibility): Rows 7-10 (1M, 3M, 6M, 12M). Used for identifying major macro cycles.
Visual Elements
Structure: Row 1 (Bottom) represents the 5-minute timeframe. Row 10 (Top) represents the 12-Month timeframe.
Vertical Alignment: If you see a vertical column of Red or Green dots, it indicates Multi-Timeframe Confluence —a highly probable reversal point.
Key Benefit
The goal of the Smart RSI MTF Matrix is to keep your main chart clean while providing maximum information. You can instantly see if a short-term pullback (Faint Green Dot) is happening within a long-term uptrend (Solid Gray/Red Dot), allowing for precision entries.
Have fun :)
Disclaimer
This "Smart RSI MTF Matrix" indicator is provided for informational and educational purposes only. It does not, and should not be construed as, financial, investment, or trading advice.
The signals generated by this tool (both "Buy" and "Sell" indications) are the result of a specific set of algorithmic conditions. They are not a direct recommendation to buy or sell any asset. All trading and investing in financial markets involves substantial risk of loss. You can lose all of your invested capital.
Past performance is not indicative of future results. The signals generated may produce false or losing trades. The creator (© DotGain) assumes no liability for any financial losses or damages you may incur as a result of using this indicator.
You are solely responsible for your own trading and investment decisions. Always conduct your own research (DYOR) and consider your personal risk tolerance before making any trades.

Smart RSI MTF [DotGain]Summary
Are you tired of constantly switching between timeframes to check the RSI, only to miss the bigger picture?
The Smart RSI MTF (Multi-Timeframe) is designed to solve this exact problem. It is a streamlined chart overlay that monitors RSI conditions across up to 10 different timeframes simultaneously —from the 1-minute chart all the way up to the Monthly view.
This indicator removes the need for multiple open tabs and declutters your analysis by plotting signals directly on your main chart using a smart "visual hierarchy" system based on transparency.
⚙️ Core Components and Logic
The Smart RSI MTF relies on a sophisticated 3-layer logic to deliver clear, actionable context:
Multi-Timeframe Engine: The script runs 10 independent RSI calculations in the background. It checks standard intervals (5m, 15m, 1h, 4h, Daily, Weekly, Monthly) to ensure you never miss a momentum extreme on any scale.
Classic RSI Thresholds:
Overbought (> 70): Indicates price may be extended to the upside.
Oversold (< 30): Indicates price may be extended to the downside.
Smart Visibility System (The "Secret Sauce"): Not all signals are equal. A 5-minute Overbought signal is "noise" compared to a Weekly Overbought signal. This indicator automatically applies Transparency to differentiate importance:
Minutes = High Transparency (Faint).
Hours = Medium Transparency.
Days/Weeks/Months = No Transparency (Solid/Bold).
🚦 How to Read the Indicator
The indicator plots shapes (Labels by default) directly above or below the candles. The appearance tells you the direction and the timeframe significance:
🟥 RED SIGNALS (Overbought Condition)
Trigger: RSI is above 70 on a specific timeframe.
Location: Placed above the candle bar.
Meaning: Potential bearish reversal or pullback.
🟩 GREEN SIGNALS (Oversold Condition)
Trigger: RSI is below 30 on a specific timeframe.
Location: Placed below the candle bar.
Meaning: Potential bullish reversal or bounce.
👻 TRANSPARENCY (Signal Strength)
Faint/Ghostly: The signal comes from a lower timeframe (e.g., 5m, 15m). Use for scalping or entry timing.
Solid/Bright: The signal comes from a major timeframe (e.g., Daily, Weekly). Use for swing trading and identifying major market turns.
Visual Elements
Symbol Shapes: Fully customizable (Label, Diamond, Circle, Triangle, etc.) via settings.
Stacking: If multiple timeframes trigger at once, symbols will overlay, creating a visually denser and darker color, indicating Confluence .
Key Benefit
The goal of the Smart RSI MTF is to help traders instantly spot Confluence . When you see a faint short-term signal align with a solid long-term signal, you have identified a high-probability reversal zone without leaving your chart.
Have fun :)
Disclaimer
This "Smart RSI MTF" indicator is provided for informational and educational purposes only. It does not, and should not be construed as, financial, investment, or trading advice.
The signals generated by this tool (both "Buy" and "Sell" indications) are the result of a specific set of algorithmic conditions. They are not a direct recommendation to buy or sell any asset. All trading and investing in financial markets involves substantial risk of loss. You can lose all of your invested capital.
Past performance is not indicative of future results. The signals generated may produce false or losing trades. The creator (© DotGain) assumes no liability for any financial losses or damages you may incur as a result of using this indicator.
You are solely responsible for your own trading and investment decisions. Always conduct your own research (DYOR) and consider your personal risk tolerance before making any trades.

VMMA Wave Edges [MTF]The VMMA Wave Edges is a multi-timeframe (MTF) overlay indicator that plots dynamic upper and lower edges formed by a band of Volume-Weighted Moving Averages (VWMAs) of varying lengths. It computes N VWMAs with lengths increasing arithmetically from start_len by incr, then plots:The maximum of all VWMAs → Upper Edge
The minimum of all VWMAs → Lower Edge
These edges are calculated on a higher timeframe (mtf_tf) and projected onto the current chart, creating a smooth, volume-sensitive envelope that adapts to volatility and trend strength.Use & InterpretationFeature
Purpose
Upper Edge
Dynamic resistance zone; price often reacts when approaching or breaking above.
Lower Edge
Dynamic support zone; price tends to bounce or consolidate near it.
Edge Contraction
Low volatility → potential breakout setup.
Edge Expansion
High volatility → trend continuation or exhaustion.
MTF Projection
Avoids repainting & noise by using cleaner higher-timeframe data.
Trading ApplicationsMean ReversionBuy near Lower Edge, sell near Upper Edge (especially in ranging markets).
Breakout ConfirmationPrice closing above Upper Edge on MTF → bullish breakout.
Below Lower Edge → bearish.
Trend FilterIn uptrend: price above Upper Edge → strong momentum.
In downtrend: price below Lower Edge → strong bearish control.
Support/Resistance FlipBroken Upper Edge → becomes future support (and vice versa).

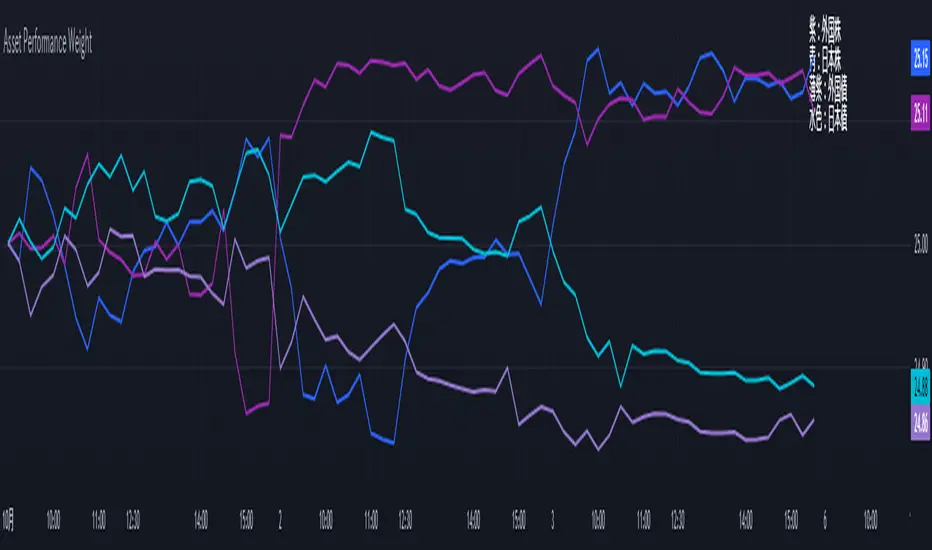
Performance-based Asset Weighting(MTF)**Performance-Based Asset Weighting (MTF/Symbol Free Setting)**
#### Overview
This indicator is a tool that visualizes the relative strength of performance (price change rate) as “weight (allocation ratio)” for **four user-defined stocks**.
By setting any specified past point in time as the baseline (where all symbols are equally weighted at 25%), it aims to provide an intuitive understanding of which symbols outperformed others and attracted capital, or underperformed and saw capital outflows.
**【Default Settings and Application Scenario: Pension Fund Rebalancing Analysis】**
The default settings reference the basic portfolio of Japan's Government Pension Investment Fund (GPIF), configuring four major asset classes: domestic equities, foreign equities, domestic bonds, and foreign bonds. It is known that when market fluctuations cause deviations from this equal-weighted ratio, rebalancing occurs to restore the original ratio (selling assets whose weight has increased and buying assets whose weight has decreased).
Analyzing using this default setting can serve as a reference point for considering **“whether rebalancing sales (or purchases) by pension funds and similar entities are likely to occur in the future.”**
**【Important: Usage Notes】**
The weights shown by this indicator are **theoretical reference values** calculated solely based on performance from the specified start date. Even if large investors conduct significant rebalancing (asset buying/selling) during the period, those transactions themselves are not reflected in this chart's calculations.
Therefore, please understand that the actual portfolio ratios may differ. **Use this solely as a rough guideline. **
#### Key Features
* **Freely configure the 4 assets for analysis:** You can freely set any 4 assets (stocks, indices, currencies, cryptocurrencies, etc.) you wish to compare via the settings screen.
* **Performance-based weight calculation:** Rather than simple price composition ratios, it calculates each asset's price change since the specified start date as a “performance index” and displays each asset's proportion of the total sum.
* **Freely set analysis start date:** You can set any desired starting point for analysis, such as “after the XX shock” or “after earnings announcements,” using the calendar.
* **Multi-Timeframe (MTF) Support:** Independently of the timeframe displayed on the chart, you can freely select the timeframe (e.g., 1-hour, 4-hour, daily) used by the indicator for calculations.
#### Calculation Principle
This indicator calculates weights in the following three steps:
1. **Obtaining the Base Price**
Obtain the closing price for each of the four stocks on the user-set “Start Date for Weight Calculation.” This becomes the **base price** for analysis.
2. **Calculating the Performance Index**
Divide the current price of each stock by the **base price** obtained in Step 1 to calculate the “Performance Index”.
`Performance Index = Current Price ÷ Base Date Price`
This quantifies how many times the current performance has increased compared to the base date performance, which is set to “1”.
3. **Calculating Weights**
Sum the “Performance Indexes” of the four stocks. Then, calculate the percentage contribution of each stock's Performance Index to this total sum and plot it on the chart.
`Weight (%) = (Individual Performance Index ÷ Total Performance Index of 4 Stocks) × 100`
Using this logic, on the analysis start date, all stocks' performance indices are set to “1”, so the weights start equally at 25%.
#### Usage
* **Application Example 1: Market Sentiment Analysis (Using Default Settings)**
Analyze using the default asset classes. By observing the relative strength between “Equities” and “Bonds”, you can assess whether the market is risk-on or risk-off.
* **Application Example 2: Sector/Theme Strength Analysis**
Configure settings for groups like “Top 4 semiconductor stocks” or “4 GAFAM stocks.” Setting the start date to the beginning of the year or earnings season allows you to instantly compare which stocks within the same sector are performing best.
* **Application Example 3: Cryptocurrency Power Map Analysis**
By setting major cryptocurrencies like “BTC, ETH, SOL, ADA,” you can analyze which currencies are attracting market capital.
**【About Legend Display】**
Due to Pine Script specification constraints, the legend on the chart will display fixed names: **“Stock 1” to “Stock 4”. **
Please note that the symbol you entered for “Symbol 1” in the settings corresponds to the “Symbol 1” line on the chart.
#### Settings
* **Symbol 1 to Symbol 4:** Set the four symbols you wish to analyze.
* **Timeframe for Calculation:** Select the timeframe the indicator references when calculating weights.
* **Start Date for Weight Calculation:** This serves as the base date for comparing performance.
#### Disclaimer
This script is solely a tool to assist with market analysis and does not recommend buying or selling any specific financial instruments. Please make all final investment decisions at your own discretion.
-------------------------------------------------------------------------------------------------------------------
**Performance-based Asset Weighting(MTF・シンボル自由設定)**
#### 概要
このインジケーターは、**ユーザーが自由に設定した4つの銘柄**について、パフォーマンス(騰落率)の相対的な強さを「ウェイト(構成比率)」として可視化するツールです。
指定した過去の任意の時点を基準(全銘柄が均等な25%)として、そこからどの銘柄のパフォーマンスが他の銘柄を上回り、資金が向かっているのか、あるいは下回っているのかを直感的に把握することを目的としています。
**【デフォルト設定と活用シナリオ:年金基金のリバランス考察】**
デフォルト設定では、日本の年金積立金管理運用独立行政法人(GPIF)の基本ポートフォリオを参考に、主要4資産クラス(国内株式, 外国株式, 国内債券, 外国債券)が設定されています。市場の変動によってこの均等な比率に乖離が生じると、元の比率に戻すためのリバランス(比率が増えた資産を売り、減った資産を買う)が行われることが知られています。
このデフォルト設定で分析することで、**「今後、年金基金などによるリバランスの売り(買い)が発生する可能性があるか」を考察するための、一つの目安として利用できます。**
**【重要:利用上の注意点】**
このインジケーターが示すウェイトは、あくまで指定した開始日からのパフォーマンスのみを基に算出した**理論上の参考値**です。実際に大口投資家などが途中で大規模なリバランス(資産の売買)を行ったとしても、その取引自体はこのチャートの計算には反映されません。
そのため、実際のポートフォリオ比率とは異なる可能性があることをご理解の上、**あくまで大まかな目安としてご活用ください。**
#### 主な特徴
* **分析対象の4銘柄を自由に設定可能:** 設定画面から、比較したい4つの銘柄(株式、指数、為替、仮想通貨など)を自由に設定できます。
* **パフォーマンス基準のウェイト計算:** 単純な価格の構成比ではなく、指定した開始日からの各銘柄の騰落を「パフォーマンス指数」として算出し、その合計に占める各銘柄の割合を表示します。
* **分析開始日の自由な設定:** 「〇〇ショック後」「決算発表後」など、分析したい任意の時点をカレンダーから設定できます。
* **マルチタイムフレーム(MTF)対応:** チャートに表示している時間足とは別に、インジケーターが計算に使う時間足(1時間足、4時間足、日足など)を自由に選択できます。
#### 計算の原理
このインジケーターは、以下の3ステップでウェイトを算出しています。
1. **基準価格の取得**
ユーザーが設定した「ウェイト計算の開始日」における、4つの各銘柄の終値を取得し、これを分析の**基準価格**とします。
2. **パフォーマンス指数の算出**
現在の各銘柄の価格を、ステップ1で取得した**基準価格**で割ることで、「パフォーマンス指数」を算出します。
`パフォーマンス指数 = 現在の価格 ÷ 基準日の価格`
これにより、基準日のパフォーマンスを「1」とした場合、現在のパフォーマンスが何倍になっているかが数値化されます。
3. **ウェイトの算出**
4つの銘柄の「パフォーマンス指数」の合計値を算出します。そして、合計値に占める各銘柄のパフォーマンス指数の割合(%)を計算し、チャートに描画します。
`ウェイト (%) = (個別のパフォーマンス指数 ÷ 4銘柄のパフォーマンス指数の合計) × 100`
このロジックにより、分析開始日には全銘柄のパフォーマンス指数が「1」となるため、ウェイトは均等に25%からスタートします。
#### 使用方法
* **応用例1:市場のセンチメント分析(デフォルト設定利用)**
デフォルト設定の資産クラスで分析し、「株式」と「債券」の力関係を見ることで、市場がリスクオンなのかリスクオフなのかを判断する材料になります。
* **応用例2:セクター・テーマ別の強弱分析**
設定画面で、例えば「半導体関連の主要4銘柄」や「GAFAMの4銘柄」などを設定します。開始日を年初や決算時期に設定することで、同セクター内でどの銘柄が最もパフォーマンスが良いかを一目で比較できます。
* **応用例3:仮想通貨の勢力図分析**
「BTC, ETH, SOL, ADA」など、主要な仮想通貨を設定することで、市場の資金がどの通貨に向かっているのかを分析できます。
**【凡例の表示について】**
Pine Scriptの仕様上の制約により、チャート上の凡例は**「銘柄1」〜「銘柄4」という固定名で表示されます。**
お手数ですが、設定画面でご自身が「銘柄1」に入力したシンボルが、チャート上の「銘柄1」のラインに対応する、という形でご覧ください。
#### 設定項目
* **銘柄1〜銘柄4:** 分析したい4つのシンボルをそれぞれ設定します。
* **計算に使う時間足:** インジケーターがウェイトを計算する際に参照する時間足を選択します。
* **ウェイト計算の開始日:** パフォーマンスを比較する上での基準日となります。
#### 免責事項
このスクリプトはあくまで市場分析を補助するためのツールであり、特定の金融商品の売買を推奨するものではありません。投資の最終的な判断は、ご自身の責任において行ってください。
Combo RSI + MACD + ADX MTF (Avec Alertes)✅ Recommended Title:
Multi-Signal Oscillator: ADX Trend + DI + RSI + MACD (MTF, Cross Alerts)
✅ Detailed Description
📝 Overview
This indicator combines advanced technical analysis tools to identify trend direction, capture reversals, and filter false signals.
It includes:
ADX (Multi-TimeFrame) for trend and trend strength detection.
DI+ / DI- for directional bias.
RSI + ZLSMA for oscillation analysis and divergence detection.
Zero-Lag Normalized MACD for momentum and entry timing.
⚙️ Visual Components
✅ Green/Red Background: Displays overall trend based on Multi-TimeFrame ADX.
✅ DI+ / DI- Lines: Green and red curves showing directional bias.
✅ Normalized RSI: Blue oscillator with orange ZLSMA smoothing.
✅ Zero-Lag MACD: Violet or fuchsia/orange oscillator depending on the version.
✅ Crossover Points: Colored circles marking buy and sell signals.
✅ ADX Strength Dots: Small black dots when ADX exceeds the strength threshold.
🚨 Included Alert System
✅ RSI / ZLSMA Crossovers (Buy / Sell).
✅ MACD / Signal Line Crossovers (Buy / Sell).
✅ DI+ / DI- Crossovers (Buy / Sell).
✅ Double Confirmation DI+ / RSI or DI+ / MACD.
✅ Double Confirmation DI- / RSI or DI- / MACD.
✅ Trend Change Alerts via Background Color.
✅ ADX Strength Alerts (Above Threshold).
🛠️ Suggested Configuration Examples
1. Short-Term Reversal Detection:
RSI Length: 7 to 14
ZLSMA Length: 7 to 14
MACD Fast/Slow: 5 / 13
ADX MTF Period: 5 to 15
ADX Threshold: 15 to 20
2. Long-Term Trend Following:
RSI Length: 21 to 30
ZLSMA Length: 21 to 30
MACD Fast/Slow: 12 / 26
ADX MTF Period: 30 to 50
ADX Threshold: 20 to 25
3. Scalping / Day Trading:
RSI Length: 5 to 9
ZLSMA Length: 5 to 9
MACD Fast/Slow: 3 / 7
ADX MTF Period: 5 to 10
ADX Threshold: 10 to 15
🎯 Why Use This Tool?
Filters false signals using ADX-based background coloring.
Provides multi-source alerting (RSI, MACD, ADX).
Helps identify true market strength zones.
Works on all markets: Forex, Crypto, Stocks, Indices.

Context MTF [Th16rry]Context MTF
A multi-timeframe trend context indicator that overlays an Exponential Moving Average (EMA) and a Weighted Moving Average (WMA) whose look-back periods adapt automatically to your chart’s timeframe. Inspired by Mike Bellafore and Brian Shannon (Multi timeframe analysis)
🔍 Overview
Context MTF helps you quickly gauge the prevailing trend and its strength by plotting two complementary moving averages in a single view:
* EMA (solid line) for smooth, responsive trend direction
* WMA (dotted line) for emphasis on recent price action
By automatically selecting period lengths that reflect meaningful market cycles, Context MTF provides intuitive context at a glance:
| Timeframe | Period | Market Cycle Represented |
| :--------: | :----: | :----------------------: |
| Daily (D) | 63 | Quarterly trend |
| Weekly (W) | 52 | Yearly trend |
| 1H (60) | 126 | Monthly trend |
| 15m (15) | 130 | Weekly trend |
| 5m (5) | 78 | Last 24 hours |
⚙️ How It Works
1. Automatic Period Selection
The script detects your chart’s timeframe and applies the appropriate look-back for both EMA and WMA.
2. Solid vs. Dotted
* EMA is drawn as a continuous solid line.
* WMA is rendered as a dotted line of the same color, highlighting short-term momentum within the broader trend.
3. Visual Trend Context
* Widening Gap : Indicates strengthening trend momentum.
* Convergence/Overlap : Suggests a market in consolidation or range.
🎯 Benefits
* Multi-Timeframe Context in a single pane—no need to switch charts.
* Instant trend strength assessment by comparing EMA vs. WMA divergence.
* Clear identification of range conditions when averages align.
* Fully automated period adjustment —set and forget.
⚙️ Settings
* Color : Shared color for both lines (default blue).
* Line Width : Adjustable via script inputs (default 2).
* Dotted WMA : Simulated using built-in dotted line styling for precise rendering.
Use Context MTF to enhance trend-based strategies, confirm breakout momentum, or filter ranging markets. Ideal for swing traders, day traders, and anyone who values clear, time-aligned trend information on every timeframe.
SMC Entry Signals MTF v2📘 User Guide for the SMC Entry Signals MTF v2 Indicator
🎯 Purpose of the Indicator
This indicator is designed to identify reversal entry points based on Smart Money Concepts (SMC) and candlestick confirmation. It’s especially useful for traders who use:
Imbalance zones, order blocks, breaker blocks
Liquidity grabs
Multi-timeframe confirmation (MTF)
📈 How to Use the Signals on the Chart
✅ LONG Signal (green triangle below the candle):
Conditions:
Price is in a discount zone (below the FIB 50% level)
A bullish engulfing candle appears
A bullish Order Block (OB) or Breaker Block is detected
There’s an upward imbalance
A bullish OB is confirmed on the higher timeframe
➡️ How to act:
Consider entering long on the current or next candle.
Place your stop-loss below the OB or the nearest swing low.
Take profit at the nearest liquidity zone or premium area (above FIB 50%).
🔻 SHORT Signal (red triangle above the candle):
Conditions:
Price is in a premium zone (above FIB 50%)
A bearish engulfing candle appears
A bearish OB or Breaker Block is detected
There’s a downward imbalance
A bearish OB is confirmed on the higher timeframe
➡️ How to act:
Consider short entry after the signal.
Place your stop-loss above the OB or swing high.
Target the discount zone or the next liquidity pocket.
⚙️ Recommended Settings by Trading Style
Trading Style Suggested Settings Notes
Intraday (1–15m) fibLookback = 20–50, obLookback = 5–10, htf_tf = 1H/4H Fast signals. Use Discount/Premium + Engulfing.
Swing/Position (1H–1D) fibLookback = 50–100, obLookback = 10–20, htf_tf = 1D/1W Higher trust in MTF confirmation. Ideal with fundamentals.
Scalping (1m) fibLookback = 10–20, obLookback = 3–5, htf_tf = 15m/1H Remove Breaker and MTF for quick reaction trades.
🧠 Best Practices for Traders
Trend Filtering:
Use EMAs or volume to confirm the current trend.
Take longs only in uptrends, shorts in downtrends.
Liquidity Zones:
Use this indicator after liquidity grabs.
OBs and Breakers often appear right after stop hunts.
Combine with Manual Zones:
This works best when paired with manually drawn OBs and key levels.
Backtest the Signals:
Use Bar Replay mode on TradingView to test past signals.
🧪 Example Trade Setup
Example on BTCUSDT 15m:
Price drops into the discount zone.
A green triangle appears (bullish engulfing + OB + imbalance + HTF OB).
You enter long, stop below the OB, target the premium zone.
🎯 This type of setup often gives a risk/reward ratio of 1:2 or better — profitable even with a 40% win rate.
⏰ Alerts & Automation
Enable alerts:
"SMC Long Entry" — fires when a long signal appears.
"SMC Short Entry" — fires when a short signal appears.
You can integrate this with bots via webhook, like:
TradingConnector, 3Commas, Alertatron, etc.
✅ What This Indicator Gives You
High-probability entries using SMC logic
Customizable filters for entry logic
Multi-timeframe confirmation for stronger setups
Suitable for both intraday and swing trading

Austin MTF EMA Entry PointsAustin MTF EMA Entry Points
Overview
The Austin MTF EMA Entry Points is a custom TradingView indicator designed to assist traders in identifying high-probability entry points by combining multiple time frame (MTF) analysis. It leverages exponential moving averages (EMAs) from the daily, 1-hour, and 15-minute charts to generate buy and sell signals that align with the overall trend.
This indicator is ideal for traders who:
Want to trade in the direction of the broader daily trend.
Seek precise entry points on lower time frames (1H and 15M).
Prefer using EMAs as their main trend-following tool.
How It Works
Daily Trend Filter:
The indicator calculates the 50 EMA on the daily chart.
The daily EMA acts as the primary trend filter:
If the current price is above the daily 50 EMA, the trend is bullish.
If the current price is below the daily 50 EMA, the trend is bearish.
Lower Time Frame Entry Points:
The indicator calculates the 20 EMA on both the 1-hour (1H) and 15-minute (15M) time frames.
Buy and sell signals are generated when the price aligns with the trend on all three time frames:
Buy Signal: Price is above the daily 50 EMA and also above the 20 EMA on both the 1H and 15M charts.
Sell Signal: Price is below the daily 50 EMA and also below the 20 EMA on both the 1H and 15M charts.
Visual and Alert Features:
Plot Lines:
The daily 50 EMA is plotted in yellow for easy identification of the main trend.
The 20 EMA from the 1H chart is plotted in blue, and the 15M chart's EMA is in purple for comparison.
Buy/Sell Markers:
Green "Up" arrows appear for buy signals.
Red "Down" arrows appear for sell signals.
Alerts:
Alerts notify users when a buy or sell signal is triggered, making it easier to act on trading opportunities in real-time.
How to Use the Indicator
Identify the Main Trend:
Check the relationship between the price and the daily 50 EMA (yellow line):
Only look for buy signals if the price is above the daily 50 EMA.
Only look for sell signals if the price is below the daily 50 EMA.
Wait for Lower Time Frame Alignment:
For a valid signal, ensure that the price is also above or below the 20 EMA (blue and purple lines) on both the 1H and 15M time frames:
This alignment confirms short-term momentum in the same direction as the daily trend.
Act on Signals:
Use the arrows as visual cues for entry points:
Enter long trades on green "Up" arrows.
Enter short trades on red "Down" arrows.
The alerts will notify you of these signals, so you don’t have to monitor the chart constantly.
Exit Strategy:
Use your preferred stop-loss, take-profit, or trailing stop strategy.
You can also exit trades if the price crosses back below/above the daily 50 EMA, signaling a potential reversal.
Use Cases
Swing Traders: Use the daily trend filter to trade in the direction of the dominant trend, while using 1H and 15M signals to fine-tune entries.
Day Traders: Leverage the 1H and 15M time frames to capitalize on short-term momentum while respecting the broader daily trend.
Position Traders: Monitor the indicator to determine potential reversals or significant alignment across time frames.
Customizable Inputs
The indicator includes the following inputs:
Daily EMA Length: Default is 50. Adjust this to change the length of the trend filter EMA.
Lower Time Frame EMA Length: Default is 20. Adjust this to change the short-term EMA for the 1H and 15M charts.
Time Frames: Hardcoded to "D", "60", and "15", but you can modify the script for different time frames if needed.
Example Scenarios
Buy Signal:
Price is above the daily 50 EMA.
Price crosses above the 20 EMA on both the 1H and 15M time frames.
A green "Up" arrow is displayed, and an alert is triggered.
Sell Signal:
Price is below the daily 50 EMA.
Price crosses below the 20 EMA on both the 1H and 15M time frames.
A red "Down" arrow is displayed, and an alert is triggered.
Strengths and Limitations
Strengths:
Aligns trades with the higher time frame trend for increased probability.
Uses multiple time frame analysis to identify precise entry points.
Visual signals and alerts make it easy to use in real-time.
Limitations:
May produce fewer signals in choppy or ranging markets.
Requires discipline to avoid overtrading when conditions are unclear.
Lag in EMAs could result in late entries in fast-moving markets.
Final Notes
The Austin MTF EMA Entry Points indicator is a powerful tool for traders who value multiple time frame alignment and trend-following strategies. While it simplifies decision-making, it is always recommended to backtest and practice proper risk management before using it in live markets.
Try it out and make smarter, trend-aligned trades today! 🚀

Momentum Trend Fusion (MTF)The Momentum Trend Fusion (MTF) is a composite indicator that combines the Awesome Oscillator and the Relative Strength Index to provide a unique perspective on market momentum and trend strength. The MTF is calculated by first running the Relative Strength Index (RSI) on the Awesome Oscillator (AO) and then applying an Exponential Moving Average (EMA) on the RSI value. The MTF is designed to help traders detect market phases and confirm trend direction by analyzing the cross of the EMA and RSI, as well as divergences between the AO and price. The MTF can be customized by the user by providing the lengths of the RSI and EMA calculations, making it an ideal tool for traders with different time frames and risk tolerances.

Parabolic SAR Heikin Ashi MTF Candle ScalperThis is scalper strategy designed around parabolic sar indicator, where as an input candle value it uses the heikinashi from a higher timeframe.
This example has been adapted to SPY/SPX chart
In this case ,we are using a 5 min chart, but the calculations are made on a 15 min heikin ashi chart for the PSAR and then on 5 min chart we plot the results.
At the same time we are conditioning the entry to be base on a time/session for daytrading/scalper mentality
In this case we only enter within the first 30 min of SPY opening session , and then we exit after 3-4 hours of staying in the position ( unless we hit a reverse condition).
For long condition we enter when the mtf ha candle close is above the mtf psar and for short condition we enter when the mtf ha candle close is below the mtf psar
This script is made with an educational purpose to show the power of multiple time frame approach compared to a single chart.
If you have any questions, let me know !

WaveTrend mtfThis is based on Lazy Bear famous script of Wave trend
So in basic we do MTF on it
One can choose to use the signal of the MTF (circles red or green for buy and sell)
or the regular buy and sell by cross green /red
to the script one can add if it cross the 0 above or bellow (not done here)
the MTF is taken from pinescripter example how to avoid repainting , so it good also for using your indicator to make MTF scripts
alerts included

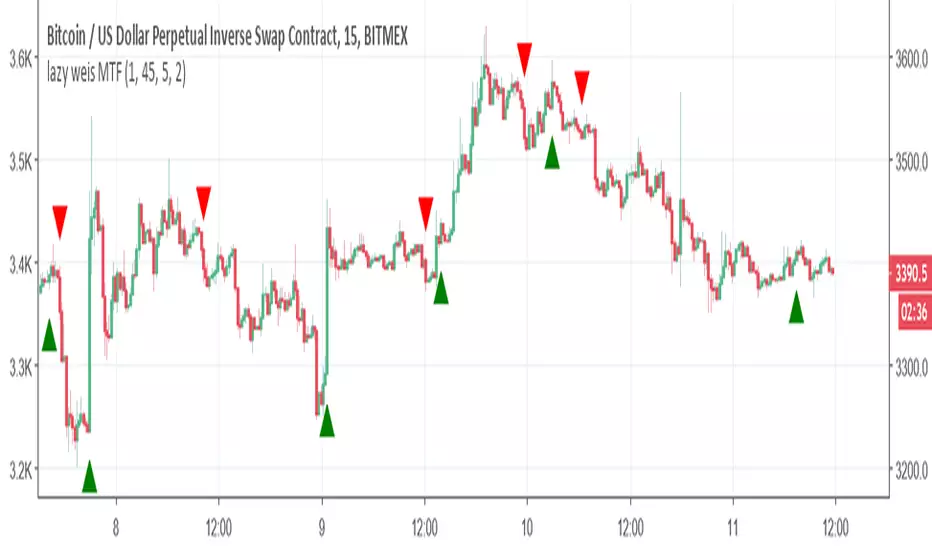
lazy weis MTFSo here was my problem and the way we fix it . We all know lazy bear weis model of volume . if we make it to MTF then we use security and it will repaint all over . since its hard to convert it to version 3 in order to fix the problem ,then it was impossible so far to make it a good MTF model.
By changing the length to time function we do not need to use the security and by this we can create an MTF model with no repaint ( i hope).
Now in setting you see int2 (now its on 60 min) , this you can change to any min value that you want. TV will consider it as length and not as time and by this way you can manipulate it to be an MTF model of your choosing . The int1 is minimum min always need to be smaller then int2
lets say you want 5 min chart and on 10 min time frame. so set it as int1=1 and int=15. if you want 45 min frame on the 5 min so set int 2 to 45
if you want it to be daily just set it to 1440 ,
I hope you like this solution
Session Range Boxes(MTF)📦 Indicator Name
Session Range Boxes (MTF)
Multi-Timeframe Directional Session Range Visualization
📘 Description
Session Range Boxes (MTF) is a multi-timeframe market structure tool that visually highlights price range behavior across different time sessions using clean, directional range boxes.
Each box represents the High–Low range of a completed or live session, automatically colored based on directional bias:
🟢 Bullish → Session Close > Session Open
🔴 Bearish → Session Close < Session Open
⚪ Neutral → Session Close = Session Open
This allows traders to instantly identify trend strength, balance zones, volatility expansion, and key support/resistance areas across multiple timeframes — all on a single chart.
🔍 What This Indicator Shows
For every enabled timeframe, the indicator:
Draws a range box from session open to session close
Continuously updates live session High & Low
Locks the final color once the session completes
Keeps historical boxes for structure and context
Supported timeframes:
Quarterly
Half-Yearly
Yearly
Monthly
Weekly
Daily
Hourly
30-Minute
15-Minute
5-Minute
⚙️ Default Behavior
By default, the indicator enables:
Weekly
Daily
Hourly
This default setup is intentionally chosen to suit most traders and provides:
Higher-timeframe structure (Weekly)
Swing context (Daily)
Intraday execution levels (Hourly)
🧠 How to Use It Effectively
📈 Higher-Timeframe Analysis (Swing / Positional Trading)
Recommended combinations:
Weekly + Daily
Monthly + Weekly
Use cases:
Identify dominant market bias
Spot compression vs expansion
Define higher-timeframe support & resistance zones
⚡ Intraday Trading (Day Trading)
Recommended combinations:
Daily + Hourly
Hourly + 30-Minute
Use cases:
Track intraday range development
Identify directional day types
Trade breakouts, rejections, or mean-reversion within session ranges
🚀 Scalping & Precision Entries
Recommended combinations:
Hourly + 15-Minute
30-Minute + 5-Minute
Use cases:
Fine-tune entries within larger session ranges
Align lower-timeframe trades with higher-timeframe bias
Spot micro range expansion and contraction
🎨 Customization Options
Bullish / Bearish / Neutral colors
Box fill transparency
Border transparency & color
Maximum historical boxes per timeframe
This allows you to keep charts clean, lightweight, and performance-friendly.
💡 Best Practices
Avoid enabling too many timeframes at once — clarity beats clutter
Use higher-timeframe boxes for bias, lower-timeframe boxes for entries
Combine with:
Market structure
Volume
VWAP
Liquidity concepts
Price action confirmation
Session Range Boxes (MTF) is a clean, powerful visual tool designed to help traders:
Understand session-based price behavior
Align trades across timeframes
Improve structure awareness without clutter
Whether you are a scalper, day trader, or swing trader, this indicator adapts seamlessly to your workflow.

ApEn Zones with Delta Confirmation MTF [PhenLabs]📊 ApEn Zones with Delta Confirmation MTF
Version: PineScript™ v6
📌 Description
The ApEn Zones with Delta Confirmation MTF indicator combines Approximate Entropy analysis with cumulative volume delta to identify high-probability support and resistance zones. Approximate Entropy (ApEn) measures the complexity and unpredictability in price data—when ApEn drops significantly, it signals a transition from chaotic to ordered market behavior, often preceding reversals or continuations.
This indicator goes beyond simple ApEn detection by integrating Delta confirmation, which validates zones using volume-based order flow analysis. When a zone forms with Delta confirmation, it indicates institutional participation aligning with the price structure. The multi-timeframe capability allows traders to detect zones forming on higher timeframes while executing on their preferred chart.
🚀 Points of Innovation
First indicator to combine ApEn complexity analysis with cumulative Delta confirmation for zone validation
Pre-built calculation presets eliminate guesswork—optimized parameters for scalping, day trading, and swing trading
Smart zone management automatically removes invalidated zones after two price rejections
Multi-timeframe architecture detects zones on configurable timeframes independent of chart timeframe
Visual style presets provide instant customization from high contrast to subtle overlays
Delta threshold system distinguishes between regular zones and institutionally-confirmed zones
🔧 Core Components
ApEn Calculator: Measures pattern regularity using embedding dimension (m=2) and tolerance factor (r) against price standard deviation to quantify market complexity
Delta Engine: Computes cumulative delta from volume and price movement, comparing against statistical thresholds to identify significant order flow divergence
Zone Generator: Creates visual box zones at signal points with dynamic sizing based on bar range and confirmation status
MTF Request Handler: Fetches ApEn calculations from user-specified timeframe using security() calls for higher timeframe alignment
Zone Manager: Tracks zone interactions, counts rejections, and automatically purges zones that have been tested twice
🔥 Key Features
Calculation Presets: Choose from Aggressive, Conservative, Scalping 1m, Strong Scalping, Swing Trading, or Default—each preset optimizes all parameters for specific trading styles
Visual Style Presets: Select Default, High Contrast, Subtle, Classic, Neutral, or Neutral Reverse to match your chart theme and preference
Delta Confirmation: Zones display with enhanced opacity when cumulative delta confirms institutional participation in the direction of the zone
Automatic Zone Cleanup: Zones self-destruct after two rejections, keeping your chart clean and focused on active levels
Alert System: Four alert conditions for buy zones, sell zones, strong buy signals, and strong sell signals
Maximum Zone Control: Limits display to 5 zones per direction to prevent chart clutter
🎨 Visualization
Buy Zones: Displayed as horizontal boxes at low points when ApEn crosses under threshold—lighter transparency indicates regular zone, darker indicates Delta confirmation
Sell Zones: Displayed as horizontal boxes at high points when ApEn crosses over threshold—visual confirmation follows same transparency logic
Zone Boundaries: Each zone extends 10% of bar range above and below the signal level, providing clear entry and stop areas
Dynamic Extension: All zones automatically extend rightward with each new bar until invalidated
📖 Usage Guidelines
Calculation Preset Selection
Scalping 1m / Strong Scalping: Use for 1-5 minute charts with faster signal generation and tighter thresholds (Length: 15, Zone Length: 5)
Aggressive: Shorter lookback (Length: 10) generates more zones with lower confirmation requirements—higher frequency, more noise
Default: Balanced parameters suitable for 5-15 minute charts (Length: 15, Zone Threshold: 0.5, Delta Length: 4)
Conservative: Extended lookback (Length: 30) with stricter thresholds—fewer but higher probability zones
Swing Trading: Longest parameters (Length: 40, Zone Length: 20) for 1H-4H charts capturing major structural zones
Visual Style Selection
High Contrast: Bright green/red for maximum visibility on any background
Subtle: Muted green/red with transparency for minimal chart distraction
Classic: Traditional lime green and crimson color scheme
Neutral / Neutral Reverse: Grayscale tones for non-directional bias visualization
Timeframe Configuration
Default timeframe is set to 1 minute—adjust based on your execution timeframe
For scalping: Set zone timeframe 1-3x your chart timeframe
For swing trading: Set zone timeframe to 4H or Daily while viewing 1H charts
✅ Best Use Cases
Identifying reversal zones during high-volatility market conditions
Confirming support/resistance levels with volume-based order flow validation
Scalping entries on lower timeframes with higher timeframe zone confluence
Filtering trade setups by requiring Delta confirmation before entry
Setting stop losses beyond zone boundaries after rejection tests
Swing trade positioning at zones detected on 4H/Daily timeframes
⚠️ Limitations
ApEn calculations are computationally intensive—may experience slower loading on very long chart histories
Delta estimation uses (close - open) * volume approximation, not actual order flow data
Zones require sufficient price history—indicator needs max_bars_back of 2000 bars for proper calculation
Low volume instruments may produce unreliable Delta confirmation signals
Zone rejections are counted based on price interaction, not candle close confirmation
Maximum of 5 zones per direction limits visibility during highly active markets
💡 What Makes This Unique
Entropy-Based Detection: Uses mathematical complexity analysis rather than simple price patterns to identify zones
Dual Confirmation System: Combines ApEn signals with Delta divergence for higher probability setups
Adaptive Presets: Six calculation presets and six visual styles create 36 possible configurations without manual parameter adjustment
Self-Managing Zones: Automatic invalidation after two rejections mimics how professional traders track level degradation
🔬 How It Works
Step 1 - ApEn Calculation: The indicator computes Approximate Entropy by measuring how often similar patterns of length m repeat within tolerance r multiplied by standard deviation—lower values indicate more predictable (ordered) price behavior
Step 2 - Signal Generation: Buy signals trigger when higher timeframe ApEn crosses under the average ApEn divided by threshold; sell signals trigger when ApEn crosses over average multiplied by threshold
Step 3 - Delta Confirmation: Cumulative delta is compared against its moving average plus/minus standard deviation times threshold—extreme readings confirm institutional order flow alignment
Step 4 - Zone Creation: Visual boxes are drawn at signal bars with dimensions based on bar range; confirmed zones receive enhanced opacity while unconfirmed zones appear more transparent
Step 5 - Zone Lifecycle: Active zones extend with each bar and track price interactions; after two rejections (price touches zone but reverses), the zone is automatically deleted
💡 Note:
This indicator works best when combined with trend analysis and market structure. Use calculation presets as starting points and adjust the Zone Timeframe setting to align with your trading methodology. Delta confirmation significantly improves zone reliability but requires volume data—instruments with low or unreported volume should rely primarily on ApEn signals alone. Always validate signals with price action context before executing trades.

Enhanced MTF Bias Table by Odegos# Enhanced MTF Bias Table - Publication Description
## Short Description (for TradingView listing)
Multi-timeframe bias indicator combining Market Structure Shifts (MSS) with EMA analysis. Displays real-time bias across 7 timeframes (5m-Weekly) with distance metrics and volatility measurements. Perfect for identifying trend alignment and potential reversal points.
---
## Full Description
### Overview
The **Enhanced MTF Bias Table** is a comprehensive multi-timeframe analysis tool designed to help traders quickly identify market bias across different time horizons. By combining Market Structure Shift (MSS) detection with Exponential Moving Average (EMA) analysis, this indicator provides a clear, color-coded view of market sentiment from short-term (5-minute) to long-term (weekly) timeframes.
### What This Indicator Does
**Core Functionality:**
- **Multi-Timeframe Analysis**: Simultaneously monitors 7 different timeframes (5m, 15m, 30m, 1h, 4h, Daily, Weekly)
- **Market Structure Detection**: Identifies when price breaks previous swing highs/lows, indicating potential trend changes
- **EMA-Based Bias**: Combines market structure with price distance from a customizable EMA to determine bias strength
- **Visual Market Structure Shifts**: Draws horizontal lines on the chart when significant market structure shifts occur
- **Real-Time Metrics**: Displays distance from EMA and ATR (volatility) for each timeframe
### How It Works
**Bias Calculation Logic:**
The indicator uses a sophisticated two-factor approach to determine market bias:
1. **Market Structure Analysis**:
- Tracks swing highs and lows using pivot points
- Identifies when price breaks above previous highs (bullish structure) or below previous lows (bearish structure)
- Uses a customizable lookback period to filter noise
2. **EMA Distance Analysis**:
- Measures how far price is from the selected EMA
- Strong bias requires BOTH structure break AND significant distance from EMA
- Neutral zone prevents false signals when price consolidates near the EMA
**Bias Categories:**
- **Strong ↑** (Dark Green): Bullish market structure + price above EMA threshold
- **Weak ↑** (Light Green): Bullish structure OR price moderately above EMA
- **Neutral** (Orange): Price within neutral zone around EMA
- **Weak ↓** (Light Red): Bearish structure OR price moderately below EMA
- **Strong ↓** (Dark Red): Bearish market structure + price below EMA threshold
### Key Features
**📊 Customizable Table Display:**
- Two table styles: Compact (minimal) or Full (detailed with labels)
- 9 position options to fit any chart layout
- Toggle distance from EMA and ATR displays
- Shows current symbol, timeframe, and date
**📈 Flexible Indicator Settings:**
- Adjustable EMA length (default: 50)
- Customizable MSS lookback period (5-50 bars)
- Breakout threshold adjustment for different instruments
- Neutral zone configuration to reduce noise
**📍 Visual Market Structure Shifts:**
- Draws horizontal lines at significant structure breaks
- Customizable colors for bullish/bearish MSS
- Optional text labels ("MSS") for easy identification
- Adjustable line width and style (solid, dashed, dotted)
**📉 EMA Overlay:**
- Optional EMA display on chart
- Full customization: color, width, line style
- Helps visualize the reference point for bias calculations
**🎨 Full Color Customization:**
- Independent color controls for all bias levels
- Customize header and table appearance
- Matches any chart theme or preference
### Best Use Cases
**1. Trend Alignment:**
Use the MTF table to identify when multiple timeframes align in the same direction. When 5-6 or more timeframes show the same bias, it indicates strong directional momentum.
**2. Divergence Detection:**
Look for disagreements between timeframes. For example, if higher timeframes (Daily/Weekly) show bearish bias while lower timeframes (5m/15m) show bullish bias, it may indicate a counter-trend bounce or potential reversal setup.
**3. Entry Timing:**
Use higher timeframe bias for direction and lower timeframe bias for entry timing. Enter trades when your trading timeframe aligns with higher timeframe bias.
**4. Risk Management:**
When lower timeframes show opposite bias to higher timeframes, it suggests trading against the major trend—requiring tighter stops and smaller positions.
**5. Market Structure Confirmation:**
The MSS lines help identify key levels where market structure changed, useful for:
- Stop loss placement (below/above MSS levels)
- Target setting (previous structure points)
- Breakout confirmation
### Recommended Settings by Instrument
**Index Futures:**
- **ES (S&P 500)**: Breakout Threshold: 0.15%, Neutral Zone: 0.15%
- **NQ (Nasdaq)**: Breakout Threshold: 0.25%, Neutral Zone: 0.20%
- **YM (Dow Jones)**: Breakout Threshold: 0.20%, Neutral Zone: 0.20%
**Forex Pairs:**
- **Major Pairs**: Breakout Threshold: 0.10%, Neutral Zone: 0.10%
- **Volatile Pairs**: Breakout Threshold: 0.20%, Neutral Zone: 0.15%
**Cryptocurrencies:**
- Breakout Threshold: 0.30-0.50%, Neutral Zone: 0.25-0.40%
- Higher volatility requires larger thresholds
### Understanding the Metrics
**Distance from EMA (%):**
- Positive values = Price above EMA (bullish territory)
- Negative values = Price below EMA (bearish territory)
- Larger absolute values = Stronger deviation from mean
- Useful for identifying overextended moves
**ATR (%):**
- Measures current volatility as percentage of price
- Higher values = More volatile conditions
- Helps adjust position sizing and stop distances
- Compare across timeframes to see where volatility concentrates
### Tips for Optimal Use
1. **Start with higher timeframes**: Check Daily and Weekly bias first to understand the bigger picture
2. **Use the 50 EMA default**: It's widely used and provides reliable support/resistance
3. **Adjust MSS lookback for your style**: Lower values (5-7) for day trading, higher values (15-25) for swing trading
4. **Watch for neutral zones**: Orange/neutral readings often precede significant moves
5. **Combine with price action**: Use MSS lines as reference points for entries and exits
6. **Don't ignore weak signals**: "Weak" bias often precedes strong moves as structure builds
### What Makes This Different
Unlike simple moving average indicators, this script:
- Combines TWO confirmation factors (structure + distance) for more reliable signals
- Provides context across multiple timeframes simultaneously
- Visually marks important market structure changes on your chart
- Offers both compact and detailed display modes
- Includes volatility measurement to gauge market conditions
### Technical Notes
- Uses `request.security()` to fetch data from multiple timeframes
- Implements `pivothigh()` and `pivotlow()` for swing detection
- All calculations use `lookahead=barmerge.lookahead_off` to prevent repainting
- MSS lines drawn in real-time as structure breaks occur
- Optimized for performance with minimal script resources
### Disclaimer
This indicator is a tool for analysis and does not provide trading signals or financial advice. Always:
- Use proper risk management
- Combine with other forms of analysis
- Test thoroughly in a demo environment
- Understand that past performance doesn't guarantee future results
- Consider market conditions and fundamental factors
---
## Tags (for TradingView)
multi-timeframe, market-structure, bias, trend, EMA, momentum, support-resistance, price-action, volatility, ATR, swing-trading, day-trading
## Category
Trend Analysis / Multi-Timeframe Analysis
---
## Quick Start Guide
**For Day Traders:**
1. Add indicator to your chart
2. Focus on 5m, 15m, 30m, and 1h timeframes
3. Look for alignment across these timeframes
4. Use MSS lines as entry/exit reference points
**For Swing Traders:**
1. Add indicator to your chart
2. Focus on 4h, Daily, and Weekly timeframes
3. Wait for 2-3 timeframe alignment
4. Use lower timeframes only for entry timing
**For Position Traders:**
1. Add indicator to your chart
2. Focus on Daily and Weekly timeframes
3. Ignore short-term noise
4. Enter when both show same strong bias

Adaptive Quant RSI [ML + MTF]This is an advanced momentum indicator that integrates Machine Learning (K-Means Clustering) with Multi-Timeframe (MTF) analysis. Unlike traditional RSI which uses fixed 70/30 levels, this script dynamically calculates support and resistance zones based on real-time historical data distribution.
Key Features:
🤖 ML Dynamic Thresholds: Uses K-Means clustering to segment RSI data into clusters, automatically plotting dynamic long/short thresholds that adapt to market volatility.
⏳ MTF Trend Background: The background color changes based on a Higher Timeframe (e.g., 5-min) RSI trend, helping you align with the broader market direction.
📊 Extreme Statistics: Incorporates percentile analysis (95th/5th) and historical pivots to identify extreme overbought/oversold conditions with high reversal probability.
📈 Probability Analysis: Displays the statistical probability of the current RSI value being at the top or bottom of its historical range.
Usage: Look for confluence between the dynamic ML thresholds and the MTF background color to identify high-probability reversal setups.

CAP - cRSI cyclic smoothed [MTF]Introduction This indicator is a Multi-Timeframe (MTF) adaptation of the Cyclic Smoothed RSI (cRSI), based on the foundational work of Lars von Thienen and his book "Decoding The Hidden Market Rhythm". It allows traders to visualize cyclic momentum and identify potential turning points by adapting standard RSI calculations to a dominant market cycle.
How It Works Unlike a standard RSI which uses fixed periods, the cRSI uses "cyclic memory" to adjust its sensitivity:
Cyclic Smoothing: It smooths the RSI based on a user-defined Dominant Cycle Length (default: 20 bars).
Dynamic Bands: Instead of static overbought/oversold levels (like 70/30), this script calculates dynamic upper and lower bands that adapt to recent volatility and cyclic distribution.
MTF Capability: You can view the cRSI of a higher timeframe (e.g., Daily) while looking at a lower timeframe chart (e.g., H1) to align your entries with the broader trend.
My Trading Strategy & Context I am sharing this to start a conversation on how to optimize cyclic tools for Equity markets. My current workflow is:
- Timeframe: I analyze Daily candles for the main trend but look for entries on Intraday (H1).
- Confluence: I combine this cRSI with the CSP - CSI (Cyclic Swing Indicator).
- Momentum & Trend: I use Williams %R to read immediate momentum, and check trend direction using EMA9 and SMA30.
- Entries: On the H1 chart, I look for VWAP interactions to trigger the entry once the Daily cRSI confirms the cycle low/high.
Let's Collaborate I am looking for constructive feedback to refine this strategy. Please leave a comment below regarding:
- Settings: Have you found a Dominant Cycle Length other than 20 that works better for Crypto or FX volatility?
- Filtering: What filters do you use to avoid "catching a falling knife" when the bands widen significantly?
- Backtesting: If you have visual backtest results using this with VWAP, please share your findings.
Note: This script is for educational purposes and collaborative research. Please backtest all strategies before live trading.
#Cycles, #RSI, #Momentum, #Lars von Thienen, #MTF

Unmitigated High Low (Day/MTF)
# Unmitigated High Low (Day/MTF)
## Overview
The **Unmitigated High Low (Day/MTF)** indicator tracks previous timeframe highs and lows that remain "unmitigated" (untouched by price) and displays them as dynamic support and resistance levels. By default, the indicator monitors daily highs and lows, making it ideal for intraday traders seeking key institutional levels, though it supports any multi-timeframe (MTF) interval. The indicator extends horizontal lines from each level until price touches them, creating visual "zones of interest" where price action may react.
## What It Does
This indicator identifies and plots two types of levels on your chart:
- **High Levels** (yellow lines) - Previous timeframe highs that price has not yet reached or exceeded
- **Low Levels** (cyan lines) - Previous timeframe lows that price has not yet broken below
Each time a new timeframe period completes (e.g., daily candle closes), the indicator captures that period's high and low and extends them forward as horizontal reference lines. When price finally touches or crosses these levels, they become "mitigated" - the line stops extending, becomes transparent (60% opacity), and is marked as historical.
## Key Features
**Multi-Timeframe Capability**: While defaulting to daily ("D") timeframe, you can switch to any interval (15-minute, 4-hour, weekly, etc.) to match your trading style.
**Band Visualization**: The indicator creates colored bands between the two most recent active levels in each direction - an upper band (purple fill) between the 1st and 2nd unmitigated highs, and a lower band (cyan fill) between the 1st and 2nd unmitigated lows.
**Visual Clarity**: Active unmitigated levels display in full color with customizable line width (default: 2), while mitigated levels fade to 60% transparency, helping you distinguish between current zones and historical references.
## How to Use It
Add the indicator to your chart and observe where unmitigated levels cluster - these zones often act as magnets for institutional order flow. The most recent unmitigated high represents overhead supply/resistance, while the most recent unmitigated low represents underlying demand/support. Traders commonly use these levels for:
- Entry zones when price approaches unmitigated levels with confluent signals
- Stop-loss placement beyond unmitigated levels to avoid institutional sweeps
- Profit targets at the next unmitigated level in the direction of your trade
- Breakout confirmation when price finally mitigates a long-standing level
The colored bands between the 1st and 2nd levels highlight "zones of friction" where price may consolidate or reverse before continuing its trend.
## Settings
**HL interval**: Select your desired timeframe (default: "D" for daily)
**High Line Color**: Color for unmitigated high levels (default: yellow #fff176)
**Low Line Color**: Color for unmitigated low levels (default: cyan #00bcd4)
**Upper Band Fill**: Fill color between 1st and 2nd highs (default: purple #880e4f at 85% transparency)
**Lower Band Fill**: Fill color between 1st and 2nd lows (default: cyan #00bcd4 at 85% transparency)
**Line Width**: Thickness of level lines (default: 2, range: 1-5)

QFT MTF Range DetectorQFT MTF Range Detector — QuantumFlowTrader
Description:
The QFT MTF Range Detector is a multi-timeframe (MTF) tool designed to identify consolidation zones or ranging conditions across multiple intraday timeframes — from 1 minute up to 4 hours. This indicator is optimized for high-frequency trading environments such as scalping and day trading.
How it works:
For each selected timeframe, the indicator evaluates five key technical conditions:
- Low ADX (less than 17) – suggesting weak trend strength.
- Range width within a specific normalized threshold.
- Normalized ATR (volatility filter) in a defined range.
- RSI near the neutral zone (40–60) with low volatility.
- Price proximity to the mid-range (consolidation center).
Each condition contributes a score. If at least 3 out of 5 conditions are met, that timeframe is considered to be in a range (consolidation).
Visual output:
A compact table is displayed on the chart showing all selected timeframes:
Black box = Timeframe is in a range (consolidation).
Purple box = Not in a range (likely trending or volatile).
Timeframes are labeled (e.g., "4H", "15M") for clarity.
Customization:
Choose display corner (top/bottom, left/right).
Enable or disable table borders.
Set custom colors for range and non-range signals.
Use case:
Traders can quickly assess which timeframes are in a range, helping them:
Avoid choppy markets,
Time entries and exits better,
Confirm multi-timeframe alignment.
Note: This is not a buy/sell signal indicator. It is a market condition filter to enhance decision-making.

[CT] Kurutoga MTF HistogramWhat is Kurutoga MTF Histogram?
The Kurutoga MTF Histogram is a multi-time-frame momentum and mean-deviation tool.
It measures how far the current close is trading away from a rolling midpoint of price and then displays that deviation as a color-coded histogram.
Instead of looking only at one lookback, this version plots three Kurutoga “leads” at the same time:
Kurutoga Lead (x1) – base length
Kurutoga Lead 2x – slower, 2 × base length
Kurutoga Lead 4x – slowest, 4 × base length
Each lead is calculated both on the chart’s timeframe (LTF) and on a Higher Time Frame (HTF) of your choice, so you can see short-term deviation inside a higher-time-frame structure.
4-color Kurutoga scheme
Each Kurutoga lead uses a 4-color MACD-style scheme:
For a given lead:
Up Light – divergence ≥ 0 and rising compared to the previous bar
Up Dark – divergence ≥ 0 and falling (positive but losing momentum)
Down Light – divergence < 0 and falling (bearish momentum increasing)
Down Dark – divergence < 0 and rising (negative but contracting)
By default the same four teal / red hues are shared across x1, x2, and x4. The only difference between the leads is transparency:
x1 = strongest (least transparent)
x2 = medium opacity
x4 = faintest
This lets you see all three layers at once without the chart becoming a solid block of color.
The HTF areas use the same palette but with an extra transparency offset applied, so they appear as soft background bands rather than competing with the histograms.
Inputs and how to use them
1. Base Length
Defines the lookback for the main Kurutoga Lead.
The script automatically creates:
len1 = baseLength
len2 = baseLength × 2
len3 = baseLength × 4
Smaller base lengths → faster, more reactive histograms.
Larger base lengths → smoother, trend-focused behavior.
2. Higher Time Frame
This is the HTF used for the area plots and HTF midpoints.
Examples:
5-minute chart with HTF = 30 or 60 minutes
15-minute chart with HTF = 4H or 1D
The idea is to trade on the lower timeframe while seeing how far price is stretched relative to a higher-time-frame range midpoint.
3. Show / Hide toggles
Under “Show / Hide” you can independently turn on/off:
Kurutoga Lead (x1)
Kurutoga Lead 2x
Kurutoga Lead 4x
HTF Lead, HTF Lead 2x, HTF Lead 4x
This lets you:
Run only a single Kurutoga if you want a clean panel, or
Stack multiple leads for a “multi-speed” view of extension and mean reversion.
4. Color Scheme (4-color Kurutoga)
Up Light / Up Dark / Down Light / Down Dark – base hues used for every lead.
Lead opacity (x1, 2x, 4x) – sets how strong or faint each lead appears.
x1 is usually your primary “trading speed.”
x2 and x4 can be faded so they act as context.
Extra transparency for HTF areas – additional opacity applied on top of each lead’s opacity when drawing HTF areas. This keeps the HTF layer subtle.
You can fine-tune the exact teal/red values here to match your personal palette.
Practical reading & trade ideas
Trend alignment
When all three Kurutoga leads (x1, 2x, 4x) are above zero, price is trading above its rolling mid-range on multiple speeds → bullish environment.
When all three are below zero, you have a multi-speed bearish environment.
Mixed readings (e.g., x1 above zero, x4 below zero) can signal transition or mean-reversion areas.
Momentum vs exhaustion
Up Light / Down Light (light colors) show momentum expanding in that direction.
Up Dark / Down Dark (dark colors) show momentum contracting – price still on that side of zero, but the push is weakening.
After a run of Up Light bars, a shift to Up Dark may hint at a stall or pullback.
After a run of Down Light bars, a shift to Down Dark may hint at short covering / bounce potential.
Multi-time-frame confluence
Use the HTF areas as a backdrop:
If LTF Kurutoga leads are above zero while the HTF area is also positive (and ideally expanding), that’s strong bullish alignment.
If LTF leads are trying to flip up while HTF divergence is still deeply negative, you may be looking at a counter-trend bounce rather than a true trend change.
Example setups
Trend-following entries:
Look for x2 & x4 leads on the same side of zero as the HTF area, then use x1 color shifts (from Down Dark → Up Light or vice versa) to fine-tune entries in the direction of that higher-time-frame bias.
Mean-reversion fades:
Watch for extreme Kurutoga values where x1/x2 are strongly extended beyond zero while color flips from Light to Dark (momentum stalling) against an opposing HTF backdrop .
Notes
The indicator is non-directional by itself – it measures distance from a rolling midpoint rather than trend structure or order flow. It works best when combined with your existing price action/trend tools (moving averages, HLBO, structure zones, etc.).
Because HTF values are brought down via request.security, choose HTF settings that make sense for your product and session (for example, don’t use very high HTFs on thin intraday markets).
Use the Kurutoga MTF Histogram as a visual scanner for extension, momentum regime, and multi-speed alignment, then layer your own entry/exit rules on top.

Turtle System 1 (20/10) + N-Stop + MTF Table V7.2🐢 Description: Turtle System 1 (20/10) IndicatorThis indicator implements the original trading signals of the Turtle Trading System 1 based on the classic Donchian Channels. It incorporates a historically correct, volatility-based Trailing Stop (N-Stop) and a Multi-Timeframe (MTF) status dashboard. The script is written in Pine Script v6, optimized for performance and reliability.📊 Core Logic and ParametersThe system is a pure trend-following model, utilizing the more widely known, conservative parameters of the Turtle System 1:FunctionParameterValueDescriptionEntry$\text{Donchian Breakout}$$\mathbf{20}$Buy/Sell upon breaking the 20-day High/Low.Exit (Turtle)$\text{Donchian Breakout}$$\mathbf{10}$Close the position upon breaking the 10-day Low/High.Volatility$\mathbf{N}$ (ATR Period)$\mathbf{20}$Calculation of market volatility using the Average True Range (ATR).Stop-LossMultiplier$\mathbf{2.0} BER:SETS the initial and Trailing Stop at $\mathbf{2N}$.🛠️ Key Technical Features1. Original Turtle Trailing Stop (Section 4)The stop-loss mechanism is implemented with the historically accurate Turtle Trailing Logic. The stop is not aggressively tied to the current candle's low/high, which often causes premature exits. Instead, the stop only trails in the direction of the trend, maximizing the previous stop price against the new calculated $\text{Close} \pm 2N$:$$\text{New Trailing Stop} = \text{max}(\text{Previous Stop}, \text{Close} \pm (2 \times N))$$2. Reliable Multi-Timeframe (MTF) Status (Section 6)The indicator features a robust MTF status table.Purpose: It calculates and persistently stores the Turtle System 1 status (LONG=1, SHORT=-1, FLAT=0) for various timeframes (1H, 4H, 8H, 1D, and 1W).Method: It uses global var int variables combined with request.security(), ensuring the status is accurately maintained and updated across different bars and timeframes, providing a reliable higher-timeframe context.3. VisualizationsChannels: The 20-period (Entry) and 10-period (Exit) Donchian Channels are plotted.Stop Line: The dynamic $\mathbf{2N}$ Trailing Stop is visible as a distinct line.Signals: plotshape markers indicate Entry and Exit.MTF Table: A clean, color-coded status summary is displayed in the upper right corner.
