ATA v4 StrategyAta strategy is include 3 different time frame = MTF
2 different moving average =MA
Oversold/overbought for relative strength index =RSI
Strategy exit for trailing stop loss %2 =TSL
MTF like 1 day, 4h and 5 min, between 2 moving averages like fibo numbers 21 and 34. Also strategy test for oversold up to 60 and overbought under the 25 with RSI. Stratefy exit include trailing stop loss %2 persantage for max. gain. It was created by XMAXPRO. This system is open to development.
חפש סקריפטים עבור "mtf"

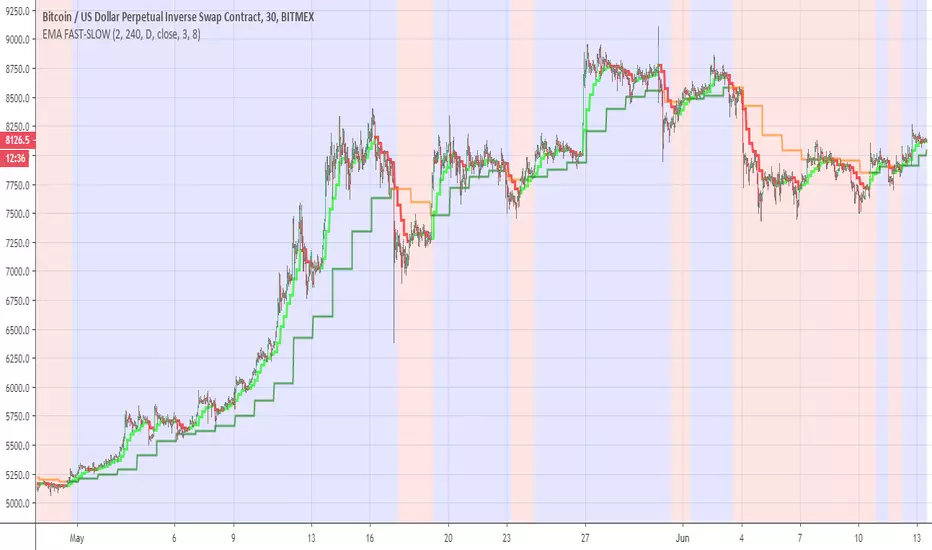
EMA FAST-SLOWThis indicator has the following
ema fast (length 3 and 8 ) based on 240 min
ema slow (length 3 and 8 ) based on daily MTF
The reason for the two length in each EMA is to give us the the insight of shorter trend in larger trend
so the large trend is when ema fast 240 min is above the daily ema slow this is shown in the bullish or bearish zones
the smaler trend for each MTF is shown in different color (lime:red) for ema fast 240 min , and (green:orange) for the slow daily EMA
when we this setting on smaller time frame so it more easy to see where the asset is going this the basic idea
you can change the setting as you wish in oreder to find the best one for your time frame
Crypto Indicators #u9tusA set of low timeframe (LTF), medium timeframe (MTF), and high timeframe (HTF) indicators for use in crypto currencies / bitcoin.
Traditionally the 10, 20, 50, 100, and 200 SMAs are used in TA. With cryptos, I've found that the 8 EMA, 21, 55, and 128 SMAs backtest better, while no change in length was necessary for the 200. I wanted to combine all these into one indicator to easily add them to a chart layout, hence this script.
You can customize the length of each MA to your liking in the settings, or accept the defaults.
LTF Indicators:
8 EMA in blue hues, medium line stroke.
MTF Indicators:
21, 55 SMA in purple hues, medium line stroke.
HTF Indicators:
128, 200 SMA in yellow hues, thick line stroke.
Defaults are for daily timeframes and lower; suggest changing up the intervals for weekly and monthly to:
21 -> 30
55 -> 50
128 -> 100
$BTC, $ETH, #ALTS
twitter.com
(c) @jhaurawachsman 20190515

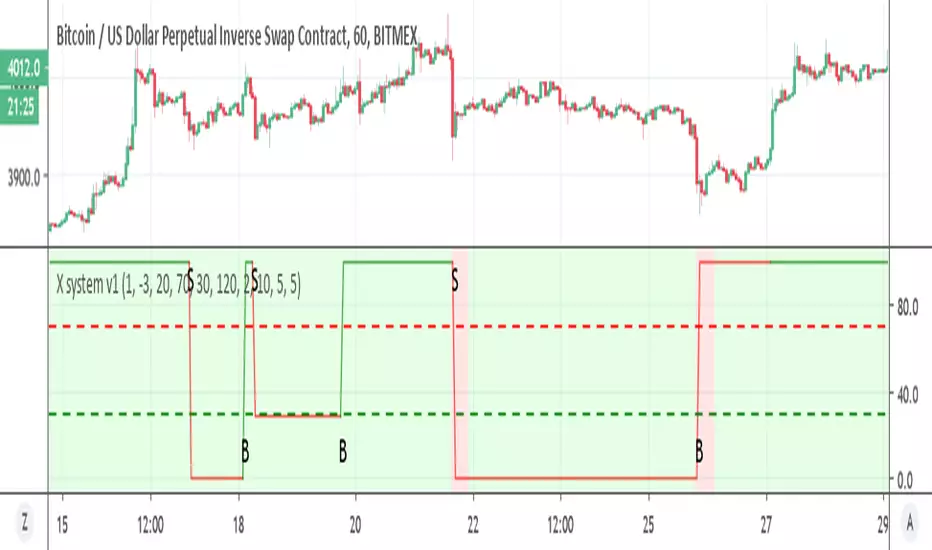
X system v1Similar to X system but here I use the super trend with MTF function
the sell option depend on the % channel sell seen in red as bearish rule (so both need to agree)
the buy option depend only on the MTF which is set on 2 hour on 1 hour candles. you can try to modify if you want shorter times to see if it better
if you want it sell more just remove the and bearish rule from t green for buy in the code
try to make it better and I hope it can help you :)
Donochian CCISo this indicator have the following:
1. MTF CCI
2. donochian channel MTF both non repaint mode
buliish and bearish zone determine by ratio of the the donochian cahnnel
enter or exit can be either the bullish or bearish change of color or by cross over or under of the CCI
or combination of both
The high max and low max of the donochian channel show in hilated bar

Donochian zonesThis indicator give the ratio between the high and low of donochian channel and if we take ratio and add it to each other then we can calculate if it + meaning bullish trend or negative meaning bearish trend
using non repainting MTF we can see the zone of the channel at different time set
we can use this indicator to filter bad signal or make it stand alone
here example of amazon stock with 360 min mtf over one hour graph
here facebook 240min over 15 min graph

linreg-areas (like fib system just more accurate) So this system is a different approach to form a daily fib like system.
Its based on linear regression and its slope , we calculate the slope of the line and we put it in MTF format that is without security and non repainting (int2=1440 min)
As you in graph the coin in this case BTC has cycle from low to high similar to the fibs system.
the lowest level is bellow -0.2 , next level is -0.1 ,0,0.1 and above 0.2 is consider the highest
with this system its easy to find the highs and the lows as the coin go between the levels either up or down like the fibs system.
one can use this together with fibs system in order to make analysis more accurate.
also it easy to set signals once the slope go between levels either up or down . another advantage for this system compare to fibs system is the ability to reduce the MTF to lower frame let say 4 hour or even less and then by the same logic to create system of high and lows to the most smaller frames (but if you do that you need in code to change the levels setting numbers so it fit the best )
follow the direction of the slope and you will find the road that you wish:))

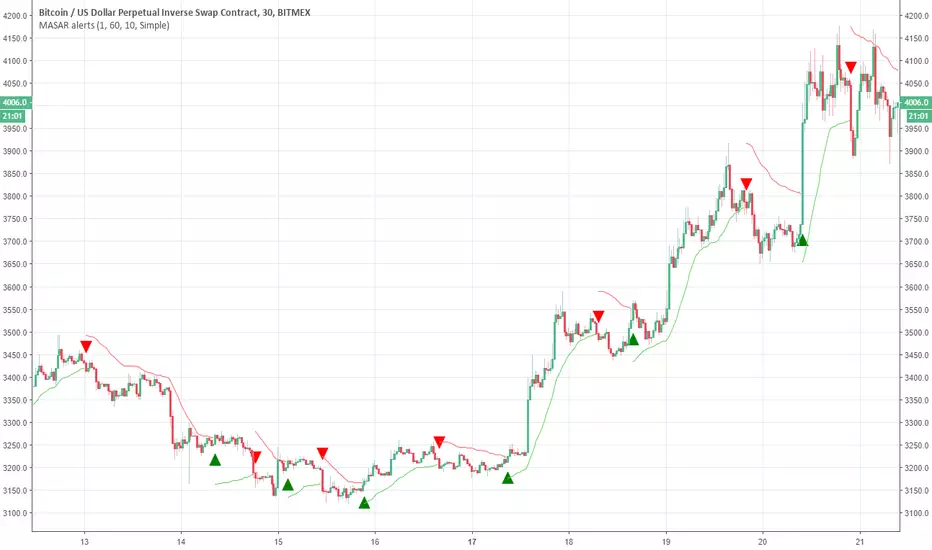
Moving Average Stop and Reverse alertsNothing fancy here , the main study is this one
so all credit to him. I change the MTF settings (int2 is contol of that ) and adds alerts
So in basic its a better SAR with MTF function
DEMARSIV1 alerts and take profitThis version is the same as DEMARSI with following differences
I add take profit to short and long when DEMA MTF 1 is crossing DEMA MTF 2 (they are calculated different that why when you increase int2 in min to longer time the difference between them increse)
if you want the TP to be on signal of fast and slow DEMA RSI 2 (just change the code inside) by putting the long cond to be as the buy cond
for any questions please ask

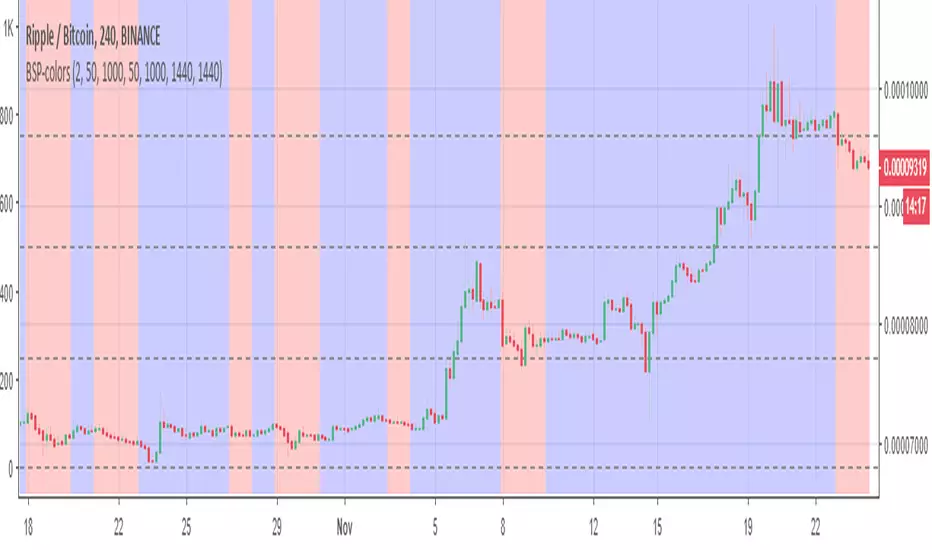
BSP-colorsIts MTF of the BSP model. here i need to warn you that this model can repaint. so I did not create any signals to it. On the other hand since its design for this mistake. you can use it to see the bullish or bearish zones in easy way.
So the basic idea here is to see the zones of buy and sell of weis model in mTF format.
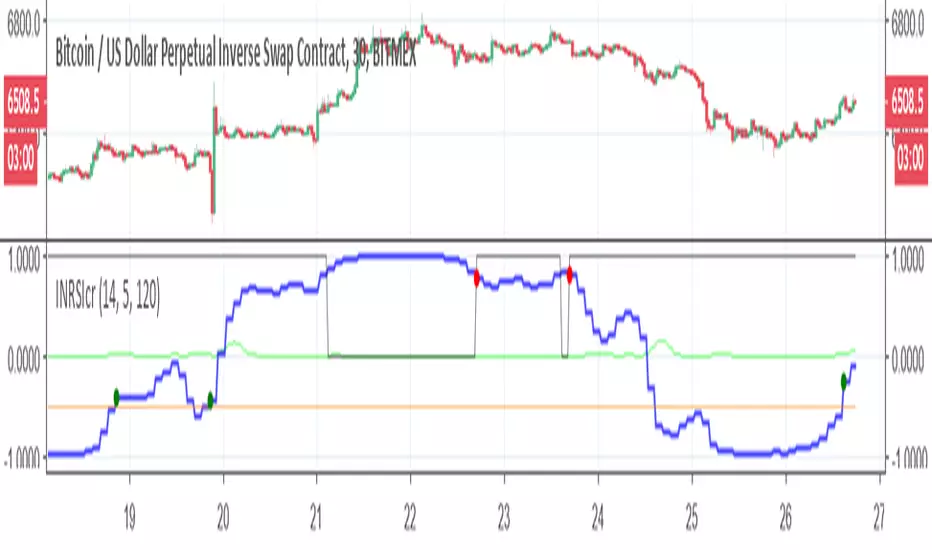
Inverse Fisher-rsi-crudeSo this is a crude version just to show the idea. I use the code of capissoimo, www.tradingview.com
together with my older code and I just change few things. in next version I will try make it more correct, but this is just to show the idea of the MTF reverse fisher RSI
this is setting for 30 min graph with MTF of 120 min
so have fun
Gomoku_V2I tried to improve the one - step equilibrium table.
Since the original glance consisted of the middle line of the Hiroo band, something is calculated from the upper and lower lines.
Leading span A = Double the width of the HiLo band (Green 2) * (1-75 (≒ 76.4% return)), the central complex clouds only changed the expression at a glance.
It is unified to shift all lines at first glance by 25. The old lagging span was renamed to the preceding price span.
You can use the first line of conversion line and reference line with the combination of the preceding conversion line, the preceding reference line and the preceding price span.
The part surrounded by the preceding conversion line and the preceding reference line is defined as rain cloud.
The leading span B is the interpretation of the rain cloud and the effective value of the cloud.
(the width of the reference line and the leading span A) ÷ The width of the rain cloud is like the intensity of the cloud.
Rain clouds have the same properties as clouds, and the twisted parts are weak.
When the type of cloud and rain cloud are different, it is countervailing and resistance seems to be weak.
Even when the width of the leading span A and the leading reference line is narrow, the resistance seems to be weak.
It seems there are clouds above and below as well because it was the motivation for development so there are two clouds each above and below. The clouds are five (although it is actually six) so it is the fifth grade.
It should normally be bounced back in the green zone.
There is a red zone for abnormal price fluctuations.
It seems that the upper and lower clouds only bounce back toward the center.
If you are not satisfied with price movements overall it seems that you are in the range market, often breaking through for the passage of time.
Update Ver 2.0
integrate MTF amagumo
Devices of color arrangement
The resistance is strong where the cloud color is thin.
It should be weak as the force is canceled as much as it is black.
Batch display option for each part
Specealthanks
Ichimoku kinkou hyou
KazmaxFAN Club # Place for technical discussion
一目均衡表を改良してみました。
元の一目はハイローバンドの中線から構成されていたので、上下の線から何かを算出しています。
先行スパンA=ハイローバンドの幅の2倍(Green2)*(1-75(≒76.4%戻し)) という発見により、中央の複雑な雲は一目の表現を変えるだけにしました。
一目の線は全て25前にずらすのに統一です。旧遅行スパンは先行価格スパンに改名しました。
先行転換線と先行基準線と先行価格スパンの組み合わせで一目の転換線と基準線の使い方が出来ます。
先行転換線と先行基準線で囲まれた部分は雨雲と定義。
先行スパンBは雨雲と雲の実効値という解釈です。
(基準線と先行スパンAの幅)÷雨雲の幅が雲の強度という感じです。
雨雲も雲と同じ性質を持っていて、ねじれた部分は弱いぽいです。
雲と雨雲の種類が異なる時は打ち消しあって抵抗が弱いようです。
先行スパンAと先行基準線の幅が狭い時も抵抗が弱いようです。
上下にも雲があるように思えたのが開発の動機だったので上下に各2本雲があります。雲が5本(本当は6本ですが)だから五目です。
通常はグリーンゾーンで跳ね返されるはずです。
異常な価格変動用にレッドゾーンがあります。
上下の雲は中央に向けて跳ね返すくらいしかしないようです。
全体的に価格移動に困ればレンジ相場になって、時間の経過で強行突破することが多いように見えます。
Update Ver2.0
MTF amagumoを統合
配色を工夫
雲の色が薄い所は抵抗が強いです。
黒い所ほど力が打ち消しあって弱いはずです。
各パーツごとに一括表示オプション
Specealthanks
一目均衡表
KazmaxFAN倶楽部 #テクニカル議論の場

Timeframe Continuity BarsTimeframe Continuity Bars is a script that is extremely simple for good reason
So please, do not remove this post because it seems 'simple'
Now that's over with. Lets dive in to understand what timeframe continuity IS and what this indicator does.
Timeframe continuity is defined by 4 or more timeframes and it is the relationship of the last price traded to those 4 opening prices. Standard timeframe continuity would be using the M,W,D,60min timeframes.
The reason we use MTF analysis is because of the truth of what price is and how it works.
Price movement is SOLELY caused due to aggressive buying / selling. Some may attempt to refute this however at the end of the day. If the price is at 100.00 it is because a buyer is willing to buy there and a seller is willing to sell there. If those market participants did not want to buy or sell at 100.00 price would go up or down to meet the more aggressive participant.
So what does this look like you may ask...
If an aggressive buyer takes the offer we will see prices go up if they were willing to pay more than the last guy who took the offer.
So price may go from 100.00 to 100.01 because you decided to invest in that stock that day at that time with a market order
This same thing occurs when every other institution creates, adds, reduces, or exits a position. They have to buy or sell and they have to either do it aggressively or do it passively by sitting on the bid / ask and waiting.
So since this is true, we know that the relationship to the opening price is extremely important. This is because if price is above it's open that means buyers were willing to take the offer and buy at higher prices. If price is below it's open it means that sellers were willing to sell at the bid and they sold at lower prices.
So any candlestick chart is simply an aggregation of this aggressive buying/selling that is taking place at all times.
By using the timeframe continuity bars indicator we can measure the distance from the current open across 4 or more timeframes.
By doing this we can identify monthly participation groups, weekly participation groups, daily participation groups, and 60min participation groups.
When all those groups align green or red this is considered full timeframe continuity. Where the monthly weekly daily 60min groups are all taking the offer and buying, or all selling at the bid!
When this aligns this is when price is for CERTAIN going in one direction.
However, It is subject to change every 60 minutes as the 60min determines if those monthly weekly daily buyers are present RIGHT NOW.
So if the 60min changes we go into direct conflict against the month/week/day groups.
If we see the 60min and day align we go into direct conflict against the month/week
if the 60min day and week are red we over-take the monthly group for control. At the time of the week day and 60 being red we have ZERO evidence of the previous monthly buyer/seller that was present.
Now that you understand a little bit about continuity.. Check it out on the chart!
P.S Here is some tips
1) it is not about just all timeframes aligning, we want to see long green / red bars!
2) The opens reset on a cyclical basis. Each day, each week, each month... When the new timeframes open we will see timeframes have the SAME open. When the opens are the same price we have LESS evidence versus having all opens seperate.
3) Investors can use the Y Q M W as their 4 timeframes to see when institutional buying is occurring [go do a case study on AMEX:GLD and AMEX:SLV weekly timeframe with these settings]
4) You need to add 4 separate indicators and change the timeframes. It is ideal to then save this layout!
5) The best way to do price analysis is using #TheStrat across all 4 timeframes instead of one timeframe with this indicator. This is soley a tool we use to show changing of control between participation groups!

TimeframeAlignTHE PROBLEM THIS LIBRARY SOLVES
When you use `request.security()` to get data from a Higher Timeframe (HTF) and try to draw objects like boxes, lines, or labels, they appear at the wrong horizontal position . This is the "floating in space" problem.
Why does this happen?
The `bar_index` in Pine Script refers to where data was RECEIVED , not where the event OCCURRED .
Consider this scenario:
• You're on a 5-minute chart
• You request 1-hour data for drawing an FVG (Fair Value Gap)
• A 1H candle spans 12 chart bars (60min / 5min = 12)
• But your code draws at `bar_index - 1` or `bar_index - 3`
• The result: your FVG box is only 2-3 bars wide instead of spanning the correct 12-36 bars
This library solves that by tracking where HTF bars actually start and end on your chart timeframe.
━━━━━━━━━━━━━━━━━━━━━━━━━━━━━━━━━━━━━━━━━━━━━━━
HOW TO USE THIS LIBRARY
Step 1: Import the Library
```
import ArunaReborn/TimeframeAlign/1 as tfa
```
Step 2: Create a Tracker for Each HTF
```
var tfa.HTFTracker tracker1H = tfa.createTracker("60")
```
Step 3: Update the Tracker Every Bar
```
tfa.updateTracker(tracker1H, "60")
```
Step 4: Use Synced Drawing Functions
```
if tfa.htfBarChanged(tracker1H)
tfa.syncedBox(tracker1H, 3, 1, topPrice, bottomPrice, color.new(color.green, 80))
```
━━━━━━━━━━━━━━━━━━━━━━━━━━━━━━━━━━━━━━━━━━━━━━━
EXPORTED TYPES
TimeframePair
Stores metadata about the relationship between source and chart timeframes.
• sourceTimeframe - The HTF/LTF being compared
• chartTimeframe - Current chart timeframe
• isHTF - True if source is higher than chart
• isLTF - True if source is lower than chart
• barRatio - Chart bars per source bar
• secondsRatio - Time ratio between timeframes
MTFEventData
Stores synchronized event data with correct bar positions.
• price - Price level of the event
• eventTime - Unix timestamp of the event
• chartBarStart - Chart bar_index where event's TF bar started
• chartBarEnd - Chart bar_index where event's TF bar ended
• htfOffset - The HTF offset used
• isValid - True if synchronization succeeded
HTFTracker
Tracks HTF bar boundaries. Create one per timeframe you need to track.
• htfTimeframe - The timeframe being tracked
• currentStartBar - Where current HTF bar started
• currentEndBar - Where current HTF bar ends (provisional)
• startHistory - Array of historical start positions
• endHistory - Array of historical end positions
• lastUpdateBar - Last bar_index when updated
• barJustChanged - True if HTF bar changed on this chart bar (set by updateTracker)
SyncedBox
Managed box with synchronization metadata.
• bx - The Pine Script box object
• htfTimeframe - Source timeframe
• leftHtfOffset / rightHtfOffset - HTF offsets for edges
• topPrice / bottomPrice - Price boundaries
• extendRight - Auto-extend flag
SyncedLine
Managed line with synchronization metadata.
• ln - The Pine Script line object
• htfTimeframe - Source timeframe
• htfOffset - Anchor offset
• price - Price level (horizontal lines)
• isHorizontal - Line orientation
• extendRight - Auto-extend flag
SyncedLabel
Managed label with synchronization metadata.
• lbl - The Pine Script label object
• htfTimeframe - Source timeframe
• htfOffset - Anchor offset
• price - Price level
• anchorPoint - "start", "end", or "middle"
━━━━━━━━━━━━━━━━━━━━━━━━━━━━━━━━━━━━━━━━━━━━━━━
EXPORTED FUNCTIONS
━━ CORE FUNCTIONS ━━
getTimeframeInfo(sourceTimeframe)
Analyzes relationship between a source TF and chart TF.
Returns: TimeframePair with comparison metadata
createTracker(htfTimeframe)
Creates a new HTF tracker. Call once per timeframe, store with `var`.
Returns: HTFTracker instance
updateTracker(tracker, htfTimeframe, historyDepth)
Updates tracker with current bar data. Call on every bar.
• htfTimeframe: The timeframe string (must match createTracker)
• historyDepth: Max HTF bars to track (default 500)
Returns: Updated tracker
getStartBar(tracker, htfOffset)
Gets chart bar_index where a specific HTF bar started.
• htfOffset: 0=current, 1=previous, 2=two bars ago, etc.
Returns: bar_index or na
getEndBar(tracker, htfOffset)
Gets chart bar_index where a specific HTF bar ended.
Returns: bar_index or na
htfBarChanged(tracker)
Detects when HTF bar just changed.
Returns: True on first chart bar of new HTF bar
findBarAtTime(timestamp, maxLookback)
Searches backward to find chart bar containing a timestamp.
• maxLookback: How far back to search (default 500)
Returns: bar_index or na
syncEventToChart(tracker, eventPrice, eventTime, anchorPoint)
Generic sync function mapping any event to correct chart position.
• anchorPoint: "start", "end", or "middle"
Returns: MTFEventData
━━ DRAWING CREATION FUNCTIONS ━━
syncedBox(tracker, leftHtfOffset, rightHtfOffset, topPrice, bottomPrice, bgcolor, ...)
Creates a box at correct HTF-aligned position.
• leftHtfOffset: HTF bars back for left edge
• rightHtfOffset: HTF bars back for right edge
• extendRight: Auto-extend to current bar
Returns: SyncedBox or na
syncedHLine(tracker, htfOffset, price, lineColor, lineStyle, lineWidth, extendRight)
Creates horizontal line anchored to HTF bar start.
• extendRight: If true, extends to current bar (default true)
Returns: SyncedLine or na
syncedVLine(tracker, htfOffset, atStart, lineColor, lineStyle, lineWidth)
Creates vertical line at HTF bar boundary.
• atStart: True=start of HTF bar, False=end
Returns: SyncedLine or na
syncedLabel(tracker, htfOffset, price, labelText, anchorPoint, ...)
Creates label at correct HTF-aligned position.
• anchorPoint: "start", "end", or "middle"
Returns: SyncedLabel or na
syncedPlotValue(tracker, value, htfOffset)
Returns value for plotting only at synced positions.
Returns: value if current bar is within HTF range, otherwise na
━━ UPDATE FUNCTIONS ━━
updateSyncedBox(syncedBox, extendToCurrentBar)
Extends existing box's right edge to current bar.
Returns: Updated SyncedBox
updateSyncedLine(syncedLine, extendToCurrentBar)
Extends existing horizontal line to current bar.
Returns: Updated SyncedLine
updateSyncedLabel(syncedLabel, tracker, newText, newPrice)
Updates label text/price while maintaining sync.
Returns: Updated SyncedLabel
━━ CONVENIENCE FUNCTIONS ━━
htfBarStartIndex(htfTimeframe, htfOffset, historyDepth)
Simple function to get HTF bar start without explicit tracker.
⚠️ Only tracks ONE timeframe. For multiple TFs, use createTracker pattern.
Returns: bar_index or na
htfBarEndIndex(htfTimeframe, htfOffset, historyDepth)
Simple function to get HTF bar end without explicit tracker.
⚠️ Only tracks ONE timeframe. For multiple TFs, use createTracker pattern.
Returns: bar_index or na
━━━━━━━━━━━━━━━━━━━━━━━━━━━━━━━━━━━━━━━━━━━━━━━
COMPLETE USAGE EXAMPLES
Example 1: FVG Box with Auto-Extend
```
//@version=6
indicator("FVG with Synced Drawing", overlay=true)
import ArunaReborn/TimeframeAlign/1 as tfa
htfInput = input.timeframe("60", "HTF for FVG")
// Create tracker for chosen timeframe
var tfa.HTFTracker fvgTracker = tfa.createTracker(htfInput)
tfa.updateTracker(fvgTracker, htfInput)
// Get FVG data from HTF (confirmed bars with offset)
= request.security(syminfo.tickerid, htfInput,
[low , high , low > high ],
lookahead=barmerge.lookahead_off)
// Store managed box
var tfa.SyncedBox fvgBox = na
// Create synced box when FVG detected
if fvgDetected and tfa.htfBarChanged(fvgTracker)
fvgBox := tfa.syncedBox(fvgTracker, 3, 1, fvgTop, fvgBot,
color.new(color.green, 85), color.green, 1, "FVG", color.white, true)
// Extend box to current bar each tick
if not na(fvgBox)
tfa.updateSyncedBox(fvgBox, true)
```
Example 2: HTF Support/Resistance Lines
```
//@version=6
indicator("HTF S/R Lines", overlay=true)
import ArunaReborn/TimeframeAlign/1 as tfa
htfInput = input.timeframe("240", "HTF for S/R")
// Create and update tracker
var tfa.HTFTracker srTracker = tfa.createTracker(htfInput)
tfa.updateTracker(srTracker, htfInput)
// Get HTF high/low (confirmed with offset)
= request.security(syminfo.tickerid, htfInput,
[high , low ], lookahead=barmerge.lookahead_off)
// Track lines
var tfa.SyncedLine resistanceLine = na
var tfa.SyncedLine supportLine = na
// Create new lines when HTF bar changes
if tfa.htfBarChanged(srTracker)
resistanceLine := tfa.syncedHLine(srTracker, 1, htfHigh, color.red, line.style_solid, 2, true)
supportLine := tfa.syncedHLine(srTracker, 1, htfLow, color.green, line.style_solid, 2, true)
// Auto-extend lines each bar
if not na(resistanceLine)
tfa.updateSyncedLine(resistanceLine, true)
if not na(supportLine)
tfa.updateSyncedLine(supportLine, true)
```
Example 3: Multiple Timeframes
```
//@version=6
indicator("Multi-TF Boxes", overlay=true)
import ArunaReborn/TimeframeAlign/1 as tfa
// Create separate tracker for each timeframe
var tfa.HTFTracker tracker1H = tfa.createTracker("60")
var tfa.HTFTracker tracker4H = tfa.createTracker("240")
var tfa.HTFTracker trackerD = tfa.createTracker("1D")
// Update ALL trackers every bar (pass the same TF string)
tfa.updateTracker(tracker1H, "60")
tfa.updateTracker(tracker4H, "240")
tfa.updateTracker(trackerD, "1D")
// Now use each tracker independently for drawing
// Each tracker maintains its own separate boundary history
```
━━━━━━━━━━━━━━━━━━━━━━━━━━━━━━━━━━━━━━━━━━━━━━━
NON-REPAINTING COMPLIANCE
To ensure non-repainting behavior, always use this pattern with request.security:
```
= request.security(syminfo.tickerid, htfTimeframe,
[value1 , value2 ], // Use offset for confirmed data
lookahead=barmerge.lookahead_off) // Never use lookahead_on
```
The ` ` offset ensures you're using the previous completed HTF bar, not the current forming bar.
━━━━━━━━━━━━━━━━━━━━━━━━━━━━━━━━━━━━━━━━━━━━━━━
HISTORY DEPTH PARAMETER
The `historyDepth` parameter controls how many HTF bars are tracked:
• Default: 500 HTF bars
• Maximum: Limited by Pine Script's array constraints
• Higher values = more historical accuracy but more memory usage
• Lower values = less memory but may return `na` for older offsets
Adjust based on your needs:
```
tfa.updateTracker(tracker, 100) // Track 100 HTF bars (light)
tfa.updateTracker(tracker, 1000) // Track 1000 HTF bars (heavier)
```
━━━━━━━━━━━━━━━━━━━━━━━━━━━━━━━━━━━━━━━━━━━━━━━
IMPORTANT NOTES
1. One Tracker Per Timeframe : If you need multiple HTFs, create separate trackers for each. The convenience functions (htfBarStartIndex, htfBarEndIndex) only track one TF.
2. Update Every Bar : Always call updateTracker() unconditionally on every bar, not inside conditionals.
3. HTF Only : This library is designed for Higher Timeframe data. For LTF aggregation, use findBarAtTime() for time-based lookups.
4. Drawing Limits : Pine Script has limits on drawing objects. Use box.delete(), line.delete(), label.delete() to clean up old objects.
━━━━━━━━━━━━━━━━━━━━━━━━━━━━━━━━━━━━━━━━━━━━━━━
TROUBLESHOOTING
Q: My boxes/lines still appear at wrong positions
A: Make sure you're calling updateTracker() on every bar (not inside an if statement) and using the correct htfOffset values.
Q: Functions return na
A: The htfOffset might be larger than available history. Increase historyDepth or use a smaller offset.
Q: Multiple timeframes don't work correctly
A: Don't use the convenience functions for multiple TFs. Create separate HTFTracker instances with createTracker() for each timeframe.
━━━━━━━━━━━━━━━━━━━━━━━━━━━━━━━━━━━━━━━━━━━━━━━
CHANGELOG
v1 - Initial release
• HTFTracker pattern for reliable multi-TF tracking
• Synced drawing functions for boxes, lines, labels
• Update functions for extending drawings
• Convenience functions for simple single-TF use cases

200W SMA Dynamic Extension Bands (MTF, Auto Asset)Summary
200W SMA Dynamic Extension Bands is a multi-timeframe TradingView indicator that plots extension bands (multiples) around the 200-week simple moving average. It’s designed to work on any chart timeframe (1m → 1D → 1W) while anchoring the bands to the latest confirmed weekly data, so the long-term reference is consistent and non-repainting across timeframes.
This is a macro “valuation/temperature gauge” style tool: it helps you quickly see when the price is cheap vs. the 200W mean and when it is extended/expensive.
What it plots
The indicator always computes:
200-week SMA (weekly)
Band m2
Band m3
Band m4
Bands are defined as:
Bandk(t)=SMA200W(t)⋅mk
Where the multipliers mk are chosen automatically depending on the asset type (or manually via input).
Key features
Works on any timeframe: weekly SMA is fetched via request.security(..., "W", ...).
Non-repainting weekly anchor: uses barmerge.lookahead_off to avoid peeking into future weekly bars.
Auto asset presets:
Crypto: wider extensions (bigger cycles)
Gold: moderate extensions
Equities: tighter than crypto
FX: very tight extensions
Futures: moderate fallback
Zone coloring (optional):
Cheap zone (below 1×)
Fair zone (1× → m2)
Hot zone (m2 → m3)
Expensive zone (m3 → m4)
Info table (optional): shows selected preset, current multiple, and % extension vs 200W SMA.
Alerts (optional): “entered cheap” and “entered expensive” style triggers.
Presets (default multipliers)
These are intentionally conservative templates (tune to your market):
Crypto: 1.0,1.5,2.0,3.0
Gold: 1.0,1.2,1.5,2.0
Equities: 1.0,1.15,1.30,1.60
FX: 1.0,1.05,1.10,1.20
Futures: 1.0,1.25,1.50,2.00
Auto mode uses syminfo.type plus a simple heuristic for Gold tickers containing XAU / GOLD (because some platforms classify XAUUSD as forex).
How to use (practical)
Macro context / cycle temperature
Price below 1× (200W SMA): historically “cheap zone” for highly cyclical assets (especially BTC).
Price above m3: often “expensive/extended” and higher risk of mean reversion.
Not a standalone trading system
Use with trend confirmation (market structure), volume, and risk management.
Extensions can persist in strong trends—treat bands as regime context, not precise reversal points.
Settings you can change
SMA Length (Weeks): default 200
Band preset: Auto / Crypto / Gold / Equities / FX / Futures
Toggle:
Zone fills
Info table
Alerts
Included alertconditions:
Cross below 1× (entered cheap zone)
Cross above m3 (entered expensive zone)
High level guideline:
Green Zone: BUY (Below 1.0× - Undervalued)
Yellow Zone: HOLD (1.0× - 1.5× - Fair Value)
Orange Zone: CAUTION (1.5× - 2.0× - Getting Hot)
Red Zone: SELL (2.0× - 3.0× - Overvalued)
Notes / limitations
The “cheap/expensive” zones are heuristics. They do not guarantee future returns.
Auto classification is best-effort; if your symbol is unusual, set the preset manually.
For newly listed assets with limited weekly history, the 200W SMA may be na until enough data exists.

Trinity 4 EMA MTF IndicatorThis is a 5mins scalping indicator based on the daily, 1hr, 15mins and 5 mins TF. Go long or short when all EMA are aligned.
EMA values and timeframe can be customized
EMA colors can also be customized

Evidenzia Data Specifica DinamicaSpecific Date Highlighter
Descrizione (Italiano)
Questo indicatore semplice ma estremamente efficace permette di evidenziare graficamente un'intera giornata specifica selezionata dall'utente. È lo strumento ideale per chi ha bisogno di analizzare il comportamento del prezzo durante eventi macroeconomici passati, date di earnings, o particolari sessioni storiche.
Caratteristiche principali:
Selettore Calendario Intuitivo: Grazie all'input di tipo time, puoi selezionare la data esatta tramite un calendario pop-up senza dover inserire manualmente numeri per giorno, mese e anno.
Compatibilità Multi-Timeframe: L'indicatore funziona su qualsiasi timeframe. Se sei su grafici intraday (1m, 5m, 1h), colorerà lo sfondo di tutte le candele appartenenti a quel giorno. Su grafici Daily, evidenzierà la singola candela selezionata.
Colore Personalizzabile: Puoi scegliere il colore dello sfondo e la sua opacità direttamente dalle impostazioni per adattarlo al tuo tema (Light o Dark).
Data Dinamica: Lo script è progettato per riconoscere automaticamente la data odierna come punto di partenza, facilitando l'analisi rapida dell'ultima sessione.
Casi d'uso:
Backtesting visivo: Evidenzia i giorni di rilascio dei dati CPI o decisioni FOMC per studiare la volatilità.
Journaling: Segna i giorni in cui hai effettuato trade importanti per ritrovarli facilmente nello storico.
Analisi Ciclica: Identifica rapidamente date specifiche in cui si sono verificati minimi o massimi storici.
Description (English)
This lightweight and effective tool allows you to highlight a specific full day on your chart. It is perfect for traders who need to visually isolate price action during macroeconomic events, earnings dates, or key historical sessions.
Key Features:
Calendar Picker: Easily select your target date using a built-in calendar input.
MTF Ready: Works seamlessly across all timeframes. On intraday charts, it highlights every bar within the 24-hour period. On daily charts, it highlights the specific daily candle.
Fully Customizable: Change the background color and transparency to match your chart layout.
Smart Default: The script is optimized to handle time logic correctly, ensuring the highlight starts exactly at 00:00 and ends at 23:59.
How to use: Go to settings, click on "Select Date", pick your day from the calendar, and the chart will instantly move the focus to that specific session.

Ale tonkis Swing failure + 5MIndicator Description: Ale Tonkis Swing Failure (SFP)
This script is an advanced Swing Failure Pattern (SFP) and Change in State of Delivery (CISD) indicator. It is designed to identify liquidity sweeps and market structure shifts across multiple timeframes simultaneously.
Key Features
Pivot Detection: Automatically identifies high and low pivot points based on a user-defined lookback period.
Liquidity Sweep Analysis: Detects when the price "sweeps" (goes beyond) a previous pivot high or low without closing significantly past it, signaling a potential reversal.
CISD (Change in State of Delivery): Tracks internal market structure shifts to confirm the SFP signal.
Multi-Timeframe (MTF) Dashboard: A real-time table in the top-right corner monitors the trend state across four different timeframes: M1, M3, M5, and M15.
Visual Alerts: The script uses dynamic bar coloring and labels (▲/▼) to signal entry points directly on the chart.
Technical Updates (M5 Integration)
The code has been specifically modified to include the 5-minute (M5) timeframe within the Multi-Timeframe logic:
Data Fetching: A new request.security call was added to retrieve the sfp_trend_state from the 5-minute interval.
Table Expansion: The display table was resized from 4 rows to 5 rows to accommodate the new data without overlapping.
UI Alignment: The M5 state is now positioned between M3 and M15, providing a smoother transition for traders analyzing mid-range scalping opportunities.
How to Read the Dashboard
LONG (Green): Indicates a bullish SFP has occurred and the trend remains positive on that timeframe.
SHORT (Red): Indicates a bearish SFP has occurred and the trend remains negative.
Empty/Black: No active SFP trend is currently detected on that specific timeframe.

CURRY HEDGEFUND PRO (MTF/VWAP/ADX + Tight Trail) [no ta.adx]Improved HedgeFund Pro Script by Tony Curry for momentum and reversal trading. Primarily focused on ADX and directional movement.

Structure + MTF + Failed 2U/2D + PDH/PDL Sweeps (Toolkit)How this behaves (so you are not guessing)
1) Liquidity sweeps (PDH/PDL)
PDH Sweep: price trades above yesterday’s high, then (by default) closes back below PDH
PDL Sweep: price trades below yesterday’s low, then closes back above PDL
You can allow wick-only sweeps via the input if you want more signals (and more noise, because humans love noise).
2) Failed 2U / Failed 2D
Failed 2U: candle takes prior high but closes back below it (failure)
Failed 2D: candle takes prior low but closes back above it
If you enable confirmation, the script triggers the “confirmed” entry only when the next candle breaks the fail candle in the intended direction.
3) FTFC strength meter (0–3)
Uses 3 higher timeframes you pick (defaults 15, 60, 240).
Strength = how many of those TF candles are bullish or bearish.
“Aligned” means 2 or 3 agree.
4) Consolidation filter
Flags consolidation when:
You have an inside-bar streak (default 2+) and/or
ATR is compressed vs its own SMA (default threshold 0.80)
Then it can block entries if you enable “Avoid entries during consolidation”.
5) “Setup Ready” alert
Triggers before entries when:
Sweep/rejection context exists (PDH/PDL)
Structure signal is forming (failed or reversal pattern)
Consolidation filter allows it
That’s your “stop chasing every candle” mechanism.

BB Scoreboard MTF1. The Concept: Harmony Across TimeframesThe Musical Score Visual: This indicator transforms absolute price into a relative "score" based on standard deviations ($\sigma$). It displays the positions of Short-Term (15m), Mid-Term (1H), and Long-Term (4H) prices on a single grid, similar to a musical staff.Syncing the "Breath" of the Market: By aligning three different timeframes, you can instantly see if the entire market is "breathing" in the same direction.
2. Trading Logic: The Power of ConvergencePerfect Order (Bullish): When the Short, Mid, and Long-term lines are all above the Middle (0) line, it indicates a strong, synchronized uptrend. This is the highest probability zone for "Buy on Dip" strategies.Perfect Order (Bearish): Conversely, when all lines are below the Middle line, the market is in a synchronized downtrend, making "Sell on Rally" the dominant strategy.Overextension (The Limits): When all three lines hit the $+3\sigma$ or $-3\sigma$ levels simultaneously, the market is extremely overextended, signaling an imminent correction or exhaustion.
3. Synergizing with "Volume-Wall" (FVG)To achieve the Ultimate Scalping Setup:Alignment: Wait for all three lines on the "Scoreboard" to point in the same direction (e.g., all above 0).The Anchor: Price returns to a Strong FVG (Volume-Wall).The Trigger: Enter the trade when the Short-term line bounces off a lower $\sigma$ level and heads back toward the $+1\sigma$ or $+2\sigma$ area.

Money Flow Index (MFI) w/ Multi Time Frame DivergencesBack color MTF
Money Flow Index (MFI) w/ Multi Time Frame Divergences

ATR + STRAT Dashboard (LAST + DIR + REV) + Est MovesATR + STRAT Dashboard is a multi-timeframe market structure indicator built around The Strat and ATR context. It summarizes higher-timeframe control (buyers vs sellers), highlights key Strat conditions (inside/outside/2-1-2 style transitions), and flags common reversal candles (hammer / shooting star style signals) to help spot potential turns. It also includes ATR-based context and estimated move guidance so you can quickly gauge whether price has “room” to run or is extended.
What it shows
MTF Dashboard: quick read of trend/control across multiple timeframes
Direction/Control: color-based bias (buyers vs sellers in charge)
Reversal Flags: highlights reversal-style candles for awareness (not guaranteed)
ATR Context + Estimated Moves: volatility-based framework for targets/expectations
Non-repainting HTF behavior: designed to use closed higher-timeframe bars to reduce repaint surprises
Note: This tool is for structure + context, not trade signals by itself. Always confirm with your plan/risk management.
