Exponential Moving Average + ATR MTF [YSFX]Description:
This indicator is a reupload of a previously published EMA + ATR tool, updated and enhanced after a house rule violation to provide additional features and a cleaner, more versatile experience for traders.
It combines trend analysis and volatility measurement into one intuitive tool, allowing traders to visualize market direction, dynamic support and resistance, and adaptive risk levels—all in a clean, minimal interface.
The indicator calculates a customizable moving average (MA) type—EMA, SMA, WMA, HMA, RMA, DEMA, TEMA, VWMA, LSMA, or KAMA—and surrounds it with ATR-based bands that expand and contract with market volatility. This creates a dynamic envelope around price, helping traders identify potential breakouts, pullbacks, or high-probability entry/exit zones.
Advanced Features:
Multiple MA types: Supports all major moving averages, including advanced options like KAMA, DEMA, and TEMA.
KAMA customization: Adjustable fast and slow lengths for precise tuning.
Dual timeframe support: Optionally use separate timeframes for the MA and ATR, or a global timeframe for both.
Dynamic ATR bands: Automatically adjust to market volatility, useful for setting adaptive stop-loss levels.
Optional fill: Shade the area between upper and lower ATR bands for a clear visual representation of volatility.
Flexible for all markets: Works across any timeframe or asset class.
Who It’s For:
This indicator is ideal for trend-following traders, swing traders, and volatility-focused analysts who want to:
Confirm trend direction while accounting for volatility
Identify high-probability trade entries and exits
Implement dynamic, ATR-based stop-loss strategies
Keep charts clean and uncluttered while still capturing key market information
This reuploaded version ensures compliance with platform rules while offering enhanced flexibility and clarity for modern trading workflows.
חפש סקריפטים עבור "mtf"

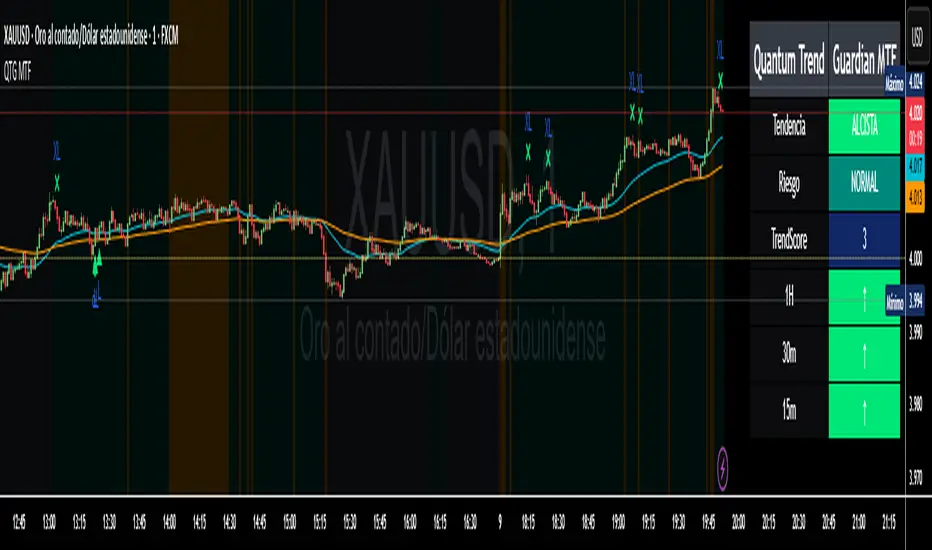
Quantum Trend Guardian MTF📊 Descripción de Indicador: “Momentum Clarity”
Resumen:
Momentum Clarity es un indicador diseñado para identificar zonas de alta probabilidad de reversión o continuación de tendencia, combinando análisis de volumen, volatilidad y fuerza relativa. Ideal para traders que buscan claridad en momentos de indecisión del mercado.
Características principales:
• 🔍 Detecta divergencias entre precio y momentum.
• 📈 Señala zonas de sobrecompra y sobreventa con mayor precisión que el RSI tradicional.
• 🟢 Incluye alertas visuales para entradas y salidas potenciales.
• 🧠 Compatible con estrategias de scalping, swing y position trading.
Cómo usarlo:
• Utiliza las señales verdes para considerar entradas en largo y las rojas para cortos.
• Confirma con acción del precio y volumen antes de ejecutar.
• Ajusta la sensibilidad según el marco temporal y tu estilo de trading.
Ventajas:
• Reduce el ruido en mercados laterales.
• Mejora la toma de decisiones en zonas de congestión.
• Aumenta la confianza en escenarios de alta volatilidad
Absolutely! Here's the English version of the indicator description:
📊 Indicator Description: “Momentum Clarity”
Overview:
Momentum Clarity is a custom indicator designed to highlight high-probability zones for trend reversals or continuations by combining volume, volatility, and relative strength analysis. It’s ideal for traders seeking clarity during market indecision.
Key Features:
• 🔍 Detects divergences between price and momentum.
• 📈 Identifies overbought and oversold zones with greater precision than traditional RSI.
• 🟢 Includes visual alerts for potential entry and exit points.
• 🧠 Compatible with scalping, swing trading, and long-term strategies.
How to Use:
• Use green signals to consider long entries and red signals for short positions.
• Confirm with price action and volume before executing trades.
• Adjust sensitivity based on your timeframe and trading style.
Benefits:
• Reduces noise in sideways markets.
• Enhances decision-making in consolidation zones.
• Builds confidence in volatile environments.
If you’d like, I can tailor this description to match your specific indicator’s logic, name, and purpose. Just share a few details and I’ll refine it for publication.
RSI MTF Table - 12 Pairs (1,5,15)
The relative strength index measures the speed and magnitude of an asset's recent price changes. Therefore, it is considered a momentum indicator in technical analysis. Essentially, the RSI is the ratio of the days an asset's value increases to decreases over a given period.
Generally speaking, if the RSI is around 50, we do not expect strong movements. RSI above 65 or below 35 are areas we expect. In this context, this chart and the general momentum in 1-5-15 minutes allow us to quickly determine the parity we will trade. It is useful for intraday trading and scalping.

Final Scalping Strategy - RELAXED ENTRY, jangan gopoh braderEMA Scalping System (MTF) Guide (1HR direction, 15 min entry)
Objective
To capture small, consistent profits by entering trades when 15-minute momentum aligns with the 1-hour trend.
Trades are executed only during high-liquidity London and New York sessions to increase the probability of execution and success.
Strategy Setup
Chart Timeframe (Execution): 15-Minute (M15).
Trend Filter (HTF): 1-Hour (H1) chart data is used for the long-term EMA.
Long-Term Trend Filter: 50-Period EMA (based on H1 data).
Short-Term Momentum Signal: 20-Period EMA (based on M15 data).
Risk
Metric: 14-period ATR for dynamic Stop Loss calculation.
✅ Trading Rules🟢
Long (Buy) Entry Conditions
Session: Must be within the London (0800-1700 GMT) or New York (1300-2200 GMT) sessions.
HTF Trend: Current price must be above the 1-Hour EMA 50.
Momentum Signal: Price crosses above the 15-Minute EMA 20.
Confirmation: The bar immediately following the crossover must close above the 15-Minute EMA 20.
Ent
ry: A market order is executed on the close of the confirmation candle.
🔴 Short (Sell) Entry Conditions
Session: Must be within the London (0800-1700 GMT) or New York (1300-2200 GMT) sessions.
HTF Trend: Current price must be below the 1-Hour EMA 50.
Momentum Signal: Price crosses below the 15-Minute EMA 20.
Confirmation: The bar immediately following the crossover must close below the 15-Minute EMA 20.
Entry: A market order is executed on the close of the confirmation candle.
🛑 Trade Management & Exits
Stop Loss (SL): Placed dynamically at 2.0 times the 14-period ATR distance from the entry candle's low (for Buys) or high (for Sells).
Take Profit (TP): Placed dynamically to achieve a 1.5 Risk-Reward Ratio (RR) (TP distance = 1.5 x SL d
istance).
📊 On-Chart Visuals
Detailed Labels: A box appears on the entry bar showing the action, SL/TP prices, Risk/Reward in Pips, and the exact R:R ratio.
Horizontal Lines: Dashed lines display the calculated SL (Red) and TP (Green) levels while the trade is active.
Background: The chart background is shaded to highlight the active London and New York tradi
ng sessions.

RSI + MACD Multi-Timeframe StrategyThis strategy combines the Relative Strength Index (RSI) from the daily timeframe with the Moving Average Convergence Divergence (MACD) from the 4-hour timeframe to generate precise long entry and exit signals.
The system uses a multi-timeframe approach to align longer-term trend conditions with shorter-term momentum shifts — allowing traders to catch dips with confirmation and exit before reversals.
🧠 Strategy Logic
✅ Long Entry Condition:
- RSI on the daily (1D) timeframe is oversold (below your defined threshold)
- MACD on the 4H timeframe crosses above the signal line
→ A long trade is opened when these two align
✅ Long Exit Condition:
- RSI on the daily timeframe is overbought
- MACD on the 4H timeframe crosses below the signal line
→ The long trade is closed when these two conditions are met
💡 This strategy currently supports long entries only. Short logic can be added if needed.
📊 Indicator Components
🔹 RSI (Relative Strength Index):
- A momentum oscillator that measures the speed and magnitude of price changes.
- Helps identify overbought (potential sell) and oversold (potential buy) conditions.
- Applied on the 1D timeframe (by default) to reflect broader market trend or exhaustion levels.
🔹 MACD (Moving Average Convergence Divergence):
- A trend-following momentum indicator based on moving averages.
- The MACD Line (fast EMA - slow EMA) crossing above the Signal Line indicates bullish momentum.
- Used here on the 4-hour timeframe (by default) for shorter-term momentum confirmation.
🔹 Multi-Timeframe (MTF) Logic:
- Uses request.security() to pull higher timeframe data (1D for RSI, 4H for MACD).
- Ensures no repainting, as it only uses closed candles from the higher timeframe.
- Aligns longer-term signals with shorter-term entries, reducing false signals.
📈 Plotting Options
The script includes a plot selector input allowing you to toggle between:
- RSI Plot (with overbought/oversold lines)
- MACD Plot (MACD line and signal line)
- This helps visualize signal conditions clearly on your chart.
🛠 Customization
- RSI & MACD settings are fully configurable
- RSI and MACD timeframes can be adjusted independently
⚠️ Disclaimer
This strategy is provided for educational and informational purposes only.
It is not financial advice or a recommendation to buy or sell any asset.
Past performance does not guarantee future results. Always test strategies in a simulated environment before live use, and consult with a licensed financial advisor for investment decisions.

Zero Lag Filter Pro MTF Editionit is a very good trading indicator it uses multi timeframe analysis to give trade signals

Dynamic S/R Levels - MTF (1-Week, Strong/Spaced)dynamic support and resistance levels based on timeframe

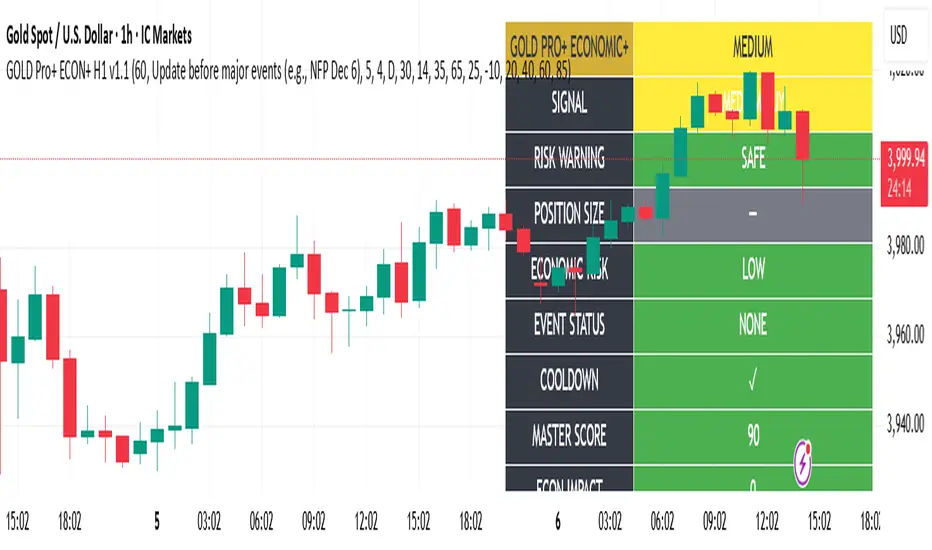
Gold Master Pro Plus ECONOMIC ENHANCED (H1 London v1.1)Overview
This indicator provides gold trading signals with integrated economic calendar awareness, specifically optimized for H1 timeframe and London session trading.
Methodology
The script analyzes multiple technical factors while monitoring economic event risks:
Technical Analysis Components:
RSI for momentum detection with configurable overbought/oversold levels
EMA crossovers (9, 21, 50 periods) for trend direction
MACD for momentum confirmation
ADX for trend strength measurement
Volume analysis for confirmation of price movements
Support/resistance detection using pivot points
Economic Calendar Integration:
Time-based detection of major economic releases (NFP, CPI, FOMC meetings)
Volatility assessment during event periods
USD stability monitoring through currency pair correlations
Automatic cooldown periods after high-impact events
Risk Management Features:
Multi-timeframe confirmation using daily trends
Session-aware scoring (London/NY overlap focus)
Quality-tiered signal classification
Position size recommendations based on signal strength and risk conditions
How to Use
Initial Setup:
Apply to XAUUSD on H1 timeframe
Configure economic settings in the inputs:
Enable economic event filter
Set ET offset (typically 5 hours for winter, 4 for summer)
Select relevant economic events to monitor
Signal Interpretation:
PLATINUM: All conditions aligned (active session, strong volume, low economic risk, trend confirmation)
HIGH: Most factors aligned with moderate risk
MEDIUM: Some factors aligned with acceptable risk
BLOCKED: High economic risk, cooldown period, or manual block active
Dashboard Metrics:
Economic risk level indicates current market safety
Event status shows timing of economic releases
Position size recommends appropriate trade sizing
Master score combines all technical and economic factors
Configuration Options
Economic Settings:
Economic impact threshold (30-80)
ET offset adjustment for timezone accuracy
Cooldown period configuration (2-24 bars)
Technical Settings:
RSI parameters (length, overbought/oversold levels)
Signal thresholds for different quality tiers
Session timing bonuses/penalties
Risk Management:
Multi-timeframe confirmation enable/disable
Higher timeframe selection (D, W, 4H, 12H)
MTF weight percentage (10-50%)
Important Notes
Economic event timing is approximate and should be verified with official economic calendars
Past performance does not guarantee future results
Trading involves substantial risk of loss
This tool is for educational purposes and should not be considered financial advice
The indicator is designed to assist in identifying potential trading opportunities while managing economic event risks through automated protection mechanisms.
Higher Timeframe Box & Divider - All Candles [GoldnHunt]The Higher Timeframe Box & Divider – All Candles indicator visually maps higher timeframe candles onto lower timeframe charts.
It highlights the open and close range of each higher timeframe candle as a box, along with a vertical divider marking the start of each new period.
This helps traders clearly see higher timeframe structure and momentum flow without switching charts.
Features:
Draws a box showing only the body (open to close) of each higher timeframe candle.
Uses candle color to represent bullish and bearish momentum.
Adds a divider line for each new higher timeframe candle.
Works across all symbols and timeframes.
Lightweight and optimized for performance.
Use case:
Perfect for traders using multi-timeframe (MTF) analysis who want to visualize higher timeframe candle progression while observing lower timeframe price action.

Short-Timeframe Volume Spike DetectorShort-Timeframe Volume Spike Detector
Description:
The Short-Timeframe Volume Spike Detector is an advanced multi-timeframe (MTF) indicator that automatically detects sudden volume surges and price expansion events on a lower timeframe and displays them on a higher (base) timeframe chart — helping traders identify hidden intraday accumulation or breakout pressure within broader candles.
⚙️ How It Works
Select a Base Timeframe (e.g., Daily, 4H, 1H).
The script automatically fetches data from a Lower Timeframe (e.g., Daily → 1H, 1H → 15m).
Within each base bar, it scans all the lower timeframe candles to find:
Volume Spikes: Volume exceeds average × multiplier or a custom threshold.
Price Strength: Candle shows upward movement beyond a minimum % change.
When both conditions are met, a spike signal is plotted on the higher timeframe chart.
🔍 Features
✅ Automatic Lower Timeframe Mapping — Dynamically selects the most relevant lower timeframe.
✅ Two Detection Modes:
Multiplier Mode: Volume spikes defined as multiple of average lower timeframe volume.
Manual Mode: Custom absolute volume threshold.
✅ Trend Filter Option: Show only signals during uptrends (configurable).
✅ Visual Markers:
Purple “X” = Volume Spike Detected
Dotted red & green lines = Candle range extension
✅ Custom Label Placement: Above High / Below Low / At Spike Price
✅ Debug Mode: Displays full diagnostic info including detected volume, threshold, and % change.
📊 Use Cases
Detect early accumulation in daily candles using hourly or 15-min data.
Identify institutional buying interest before visible breakouts.
Confirm strong continuation patterns after price compression.
Spot hidden intraday activity on swing or positional charts.
🧩 Inputs Overview
Input Description
Base Timeframe Main chart timeframe for analysis
Lookback Bars Number of recent candles to scan
Volume Mode “Multiplier” or “Manual Benchmark”
Volume Multiplier Multiplier applied to average lower timeframe volume
Manual Volume Threshold Fixed volume benchmark
Min Price Change % Minimum lower timeframe candle % move to qualify
Use Trend Filter Only show in uptrend (close > close )
Extend Bars Number of bars to extend dotted lines
Label Position Choose Above High / Below Low / At Spike Price
Debug Mode Show live internal values for calibration
🧠 Tips
Ideal for swing traders and multi-timeframe analysts.
Works best when base = Daily and lower = Hourly or 15m.
Combine with Volume Profile, VWAP, or RRG-style analysis for stronger confluence.
Use Multiplier 1.5–2.5 to fine-tune for your asset’s volatility.
⚠️ Notes
Works only when applied to the base timeframe selected in inputs.
May not display signals on non-standard intraday timeframes (like 3H).
Labels limited to max_labels_count for performance stability.

Volume Weighted Volatility RegimeThe Volume-Weighted Volatility Regime (VWVR) is a market analysis tool that dissects total volatility to classify the current market 'character' or 'regime'. Using a Linear Regression model, it decomposes volatility into Trend, Residual (mean-reversion), and Within-Bar (noise) components.
Key Features:
Seven-Stage Regime Classification: The indicator's primary output is a regime value from -3 to +3, identifying the market state:
+3 (Strong Bull Trend): High directional, upward volatility.
+2 (Choppy Bull): Moderate upward trend with noise.
+1 (Quiet Bull): Low volatility, slight upward drift.
0 (Neutral): No clear directional bias.
-1 (Quiet Bear): Low volatility, slight downward drift.
-2 (Choppy Bear): Moderate downward trend with noise.
-3 (Strong Bear Trend): High directional, downward volatility.
Advanced Volatility Decomposition: The regime is derived from a three-component volatility model that separates price action into Trend (momentum), Residual (mean-reversion), and Within-Bar (noise) variance. The classification is determined by comparing the 'Trend' ratio against the user-defined 'Trend Threshold' and 'Quiet Threshold'.
Dual-Level Analysis: The indicator analyzes market character on two levels simultaneously:
Inter-Bar Regime (Background Color): Based on the main StdDev Length, showing the overall market character.
Intra-Bar Regime (Column Color): Based on a high-resolution analysis within each single bar ('Intra-Bar Timeframe'), showing the micro-structural character.
Calculation Options:
Statistical Model: The 'Estimate Bar Statistics' option (enabled by default) uses a statistical model ('Estimator') to perform the decomposition. (Assumption: In this mode, the Source input is ignored, and an estimated mean for each bar is used instead).
Normalization: An optional 'Normalize Volatility' setting calculates an Exponential Regression Curve (log-space).
Volume Weighting: An option (Volume weighted) applies volume weighting to all volatility calculations.
Multi-Timeframe (MTF) Capability: The entire dual-level analysis can be run on a higher timeframe (using the Timeframe input), with standard options to handle gaps (Fill Gaps) and prevent repainting (Wait for...).
Integrated Alerts: Includes 22 comprehensive alerts that trigger whenever the 'Inter-Bar Regime' or the 'Intra-Bar Regime' crosses one of the key thresholds (e.g., 'Regime crosses above Neutral Line'), or when the 'Intra-Bar Dominance' crosses the 50% mark.
Caution: Real-Time Data Behavior (Intra-Bar Repainting) This indicator uses high-resolution intra-bar data. As a result, the values on the current, unclosed bar (the real-time bar) will update dynamically as new intra-bar data arrives. This behavior is normal and necessary for this type of analysis. Signals should only be considered final after the main chart bar has closed.
DISCLAIMER
For Informational/Educational Use Only: This indicator is provided for informational and educational purposes only. It does not constitute financial, investment, or trading advice, nor is it a recommendation to buy or sell any asset.
Use at Your Own Risk: All trading decisions you make based on the information or signals generated by this indicator are made solely at your own risk.
No Guarantee of Performance: Past performance is not an indicator of future results. The author makes no guarantee regarding the accuracy of the signals or future profitability.
No Liability: The author shall not be held liable for any financial losses or damages incurred directly or indirectly from the use of this indicator.
Signals Are Not Recommendations: The alerts and visual signals (e.g., crossovers) generated by this tool are not direct recommendations to buy or sell. They are technical observations for your own analysis and consideration.

Fixed High Timeframe Moving AveragesFixed High Timeframe Moving Averages (W/D/4H)
Summary
This indicator plots essential, high-timeframe (HTF) Moving Averages onto your chart, **no matter which timeframe you are currently viewing**.
It is designed for traders who need multi-timeframe context at a glance. Stop switching charts to see where the 200-Week or 50-Day MA is—now you can see all critical HTF levels directly on your 5-minute (or any other) chart.
---
Who it’s for
Traders who rely on moving averages but like to work on lower chart timeframes while keeping higher timeframe context in sight. If you scalp on 1–15m yet want Weekly/Daily/4H MAs always visible, this is for you.
---
What it shows
Pinned (“fixed”) moving averages from higher timeframes—Weekly (20/100/200) , Daily (50/100/200/365) and 4H (200) —rendered on any chart timeframe. Your favorite HTF MAs stay on screen no matter what TF you’re currently analyzing.
---
Features
* **MA types:** SMA, EMA, VWMA, Hull.
* **Fully configurable:** toggle each line, set periods, colors, and thickness.
* **Two alert modes (see below):** intrabar vs confirmed HTF close.
* **Works on any symbol & chart TF** using `request.security` to fetch HTF data.
---
Alerts & Modes
This indicator solves the biggest problem with MTF alerts: false signals. You can choose one of two modes:
1. **Intrabar mode** — compares current chart price to the HTF MA. Triggers as soon as price crosses the HTF line; great for early signals but may update until the HTF bar closes.
2. **Confirmed mode** — checks HTF close vs HTF MA. Signals only on the higher-TF bar close; fewer false starts, no intrabar repainting on that TF.
Per-line *Cross Above / Cross Below* conditions are provided for all enabled MAs (e.g., “20W — Cross Above”, “365D — Cross Below”, etc.).
**How to use alerts:** add the script → “Create Alert” → pick any condition from the script’s list.
---
Why this helps
* Keeps Weekly/Daily structure visible while you execute on LTF.
* Classic anchors (e.g., 200D, 20W/100W/200W) are popular for trend bias, dynamic support/resistance, and pullback context.
* Lets you standardize MA references across all your lower-TF playbooks.
---
Notes on confirmation & repainting
* Intrabar signals can change until the higher-TF bar closes (that’s expected with multi-TF data).
* Confirmed mode waits for the HTF close—cleaner, but later. Choose what fits your workflow.
---
Quick setup
1. Pick `MA Type` (SMA/EMA/VWMA/Hull).
2. Enable the HTF lines you want (Weekly 20/100/200; Daily 50/100/200/365; 4H 200).
3. Choose `Alert Mode` (Intrabar vs Confirmed).
4. Style colors/widths to taste and set alerts on the lines you care about.
---
Good practice
* Combine HTF MAs with price action (swings, structure, liquidity grabs) rather than using them in isolation.
* Always validate signals in your execution TF and use a risk plan tailored to volatility.
* Protect your capital: position sizing, stops, and disciplined risk management matter more than any single line on the chart.
---
Disclaimer
For educational/informational purposes only; not financial advice. Trading involves risk—manage it responsibly.

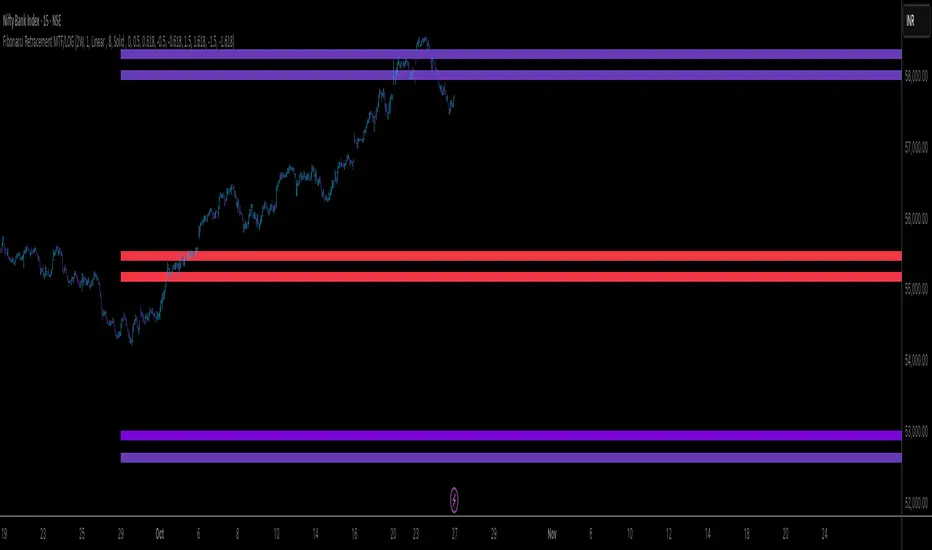
Fibonacci levels MTF 2WEEK KKKKA Fibonacci arc trading strategy uses circular arcs drawn at Fibonacci retracement levels (38.2%, 50%, 61.8%) to identify potential support and resistance zones, often intersecting with a trend line. This strategy helps traders anticipate price reversals or pullbacks, and it should be used in conjunction with other indicators

Fibonacci Retracement MTF/LOG 3 WEEK KKKKA Fibonacci arc trading strategy uses circular arcs drawn at Fibonacci retracement levels (38.2%, 50%, 61.8%) to identify potential support and resistance zones, often intersecting with a trend line. This strategy helps traders anticipate price reversals or pullbacks, and it should be used in conjunction with other indicators

Fibonacci Retracement MTF/LOG 2WEEK KKKKFibonacci retracment should be used to create a line of lines to justify the rest of indicators to reduce stress in indicators because we should not shout
DG Market Structure (Inspired By Deadcat)MS Indicator taken from Deadcat and enhanced a little bit
I added CHoCH and BOS to better tell the story of why price is moving a certain way. Also made a lot more of the values Input based for testing.
I tried to add in retracement values on the MTF chart but I don't think the math is right, maybe someone can figure out the math.
