MACD_3Color_OverlayThis was updated from script of ChrisMoody published on 4-10-2014.
This MACD is an overlayed version instead of separated indicator.
I re-color lines and histogram for my own trading strategy.
For example, look the screenshot, you can see that even though price from 1 to 2 is ascending, but on histogram, the volume from 1 to 2 is descending, which means there will be a reversal of price.
So we wait until the second red volume appears (marked with an arrow on top) we can place a short order. Or, to make sure, we can wait until the red dot (marked with "X" letter) appears to do that.
Same with buy order.
This is just a suggestion for trading strategy, not a guarantee, everything can happen, you should spend time to inspect the indicator to make sure you understand it before use for trading.
And YOU TRADE WITH YOUR OWN RISKS!
Hope you like it.
חפש סקריפטים עבור "order"

Currency Relative Strengths V.2 [GM]Version 2 Updates
Speed has been increased by ~7X
Highest and lowest pairs now highlighted using brighter colors
Re-ordered pairs from highest to lowest 'flight to risk' rating
I created this tool for the purpose of determining strongest and weakest currencies over different periods of time. Each major currency is compared to the field of other majors and its average change is measured over a predetermined period of time. The result is displayed as a percentage. I use it for trend following but it can also be used to fade exhaustion.
Instructions
Add indicator to chart
Select a time frame under settings
Place cursor over period of interest
Click "Data Window" on right hand side bar
View % change avg values for each currency

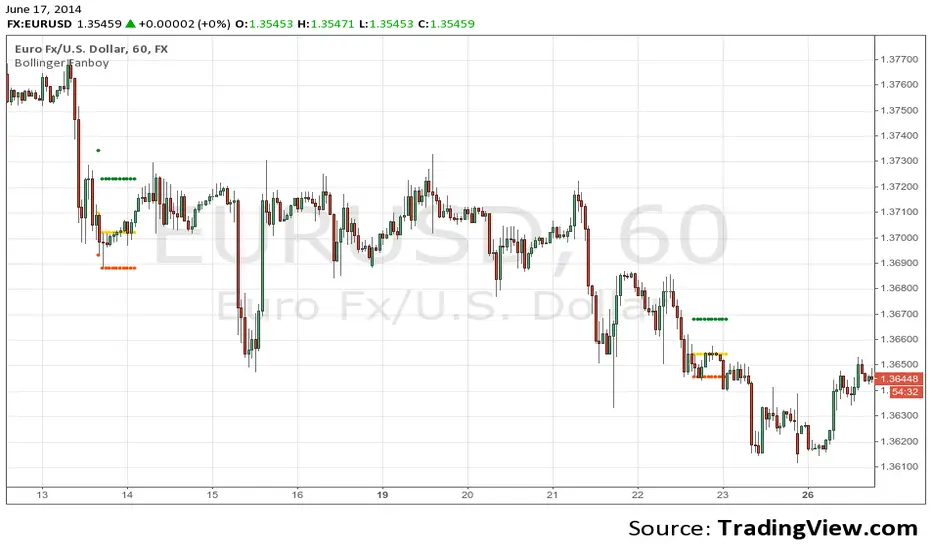
Bollinger FanboyTo use this indicator. Set pending orders to enter at "Entry", stoploss at "Stop", and profit at "Exit". Close pending order after 10 bars if it doesn't open.
Please use this at your own risk. By using this indicator you are agreeing that I am in no way liable for any financial losses that may occur indirectly or directly as a result of using this indicator.
Copyright 2014 Michael Edwards (info@bollingerfanboy.com)
Bollingfanboy.com
jjjjjjjjExplanation of the Script
Bullish and Bearish Candles: The function isBullishOrderBlock() checks if a candle is "bullish" in nature (based on body size to range ratio). Similarly, isBearishOrderBlock() checks for bearish candles.
Order Block Length and Threshold: length is the number of bars to scan for an order block, and threshold sets how strong a candle needs to be to be considered an order block.
Detection: The loop searches backward through the bars to find strong bullish and bearish order blocks, marking the price points where the strong moves happened.
Plotting: The plotshape() function is used to plot arrows or labels on the chart to mark where bullish or bearish order blocks are identified.
Improving and Customizing
Highlighting Blocks: Instead of just marking a point, you can plot horizontal boxes or shaded regions using box.new() to visually highlight the order block zone.
Use of Different Timeframes: You can modify the script to look for order blocks across multiple timeframes to increase accuracy.
Complex Rules: Depending on your strategy, you may want to add additional rules, such as looking for price to return to the order block area before confirming the strength of the block.

Trend Telescope v4 Basic Configuration
pine
// Enable only the components you need
Order Flow: ON
Delta Volume: ON
Volume Profile: ON
Cumulative Delta: ON
Volatility Indicator: ON
Momentum Direction: ON
Volatility Compression: ON
📊 Component Breakdown
1. Order Flow Analysis
Purpose: Identifies buying vs selling pressure
Visual: Histogram (Green=Buying, Red=Selling)
Calculation: Volume weighted by price position
Usage: Spot institutional order blocks
2. Delta Volume Values
Purpose: Shows volume imbalance
Bull Volume (Green): Volume on up bars
Bear Volume (Red): Volume on down bars
Usage: Identify volume divergences
3. Anchored Volume Profile
Purpose: Finds high-volume price levels
POC (Point of Control): Price with highest volume
Profile Length: Adjustable (default: 50 bars)
Usage: Identify support/resistance zones
4. Cumulative Volume Delta
Purpose: Tracks net buying/selling pressure over time
Trend Analysis: Rising=Buying pressure, Falling=Selling pressure
Divergence Detection: Price vs Delta divergences
Usage: Confirm trend strength
5. Volatility Indicator
Purpose: Measures market volatility with cycle detection
Volatility Ratio: ATR as percentage of price
Volatility Cycle: SMA of volatility (identifies periods)
Histogram: Difference between current and average volatility
Usage: Adjust position sizing, identify breakout setups
6. Real-time Momentum Direction
Purpose: Multi-factor momentum assessment
Components: Price momentum (50%), RSI momentum (30%), Volume momentum (20%)
Visual: Line plot with color coding
Labels: Clear BULLISH/BEARISH/NEUTRAL signals
Usage: Trend confirmation, reversal detection
7. Volatility Compression Analysis
Purpose: Identifies low-volatility consolidation periods
Compression Detection: True Range below threshold
Strength Meter: How compressed the market is
Histogram: Red when compressed, Gray when normal
Usage: Predict explosive moves, prepare for breakouts
⚙️ Advanced Configuration
Optimal Settings for Different Timeframes
pine
// Scalping (1-15 min)
Profile Length: 20
ATR Period: 10
Momentum Length: 8
Compression Threshold: 0.3
// Day Trading (1H-4H)
Profile Length: 50
ATR Period: 14
Momentum Length: 14
Compression Threshold: 0.5
// Swing Trading (Daily)
Profile Length: 100
ATR Period: 20
Momentum Length: 21
Compression Threshold: 0.7
Alert Setup Guide
Enable "Enable Alerts" in settings
Choose alert types:
Momentum Alerts: When momentum changes direction
Compression Alerts: When volatility compression begins
Set alert frequency to "Once Per Bar"
Configure notification preferences
🎯 Trading Strategies
Strategy 1: Compression Breakout
pine
Entry Conditions:
1. Volatility Compression shows RED histogram
2. Cumulative Delta trending upward
3. Momentum turns BULLISH
4. Price breaks above POC level
Exit: When Momentum turns BEARISH or Compression ends
Strategy 2: Momentum Reversal
pine
Entry Conditions:
1. Strong Order Flow in opposite direction
2. Momentum divergence (price makes new high/low but momentum doesn't)
3. Volume confirms the reversal
Exit: When Order Flow returns to trend direction
Strategy 3: Institutional Accumulation
pine
Identification:
1. High Cumulative Delta but flat/sideways price
2. Consistent Order Flow in one direction
3. Volume Profile shows accumulation at specific levels
Trade: Enter in direction of Order Flow when price breaks level
📈 Interpretation Guide
Bullish Signals
✅ Order Flow consistently green
✅ Cumulative Delta making higher highs
✅ Momentum above zero and rising
✅ Bull Volume > Bear Volume
✅ Price above POC level
Bearish Signals
✅ Order Flow consistently red
✅ Cumulative Delta making lower lows
✅ Momentum below zero and falling
✅ Bear Volume > Bull Volume
✅ Price below POC level
Caution Signals
⚠️ Momentum divergence (price vs indicator)
⚠️ Volatility compression (potential big move coming)
⚠️ Mixed signals across components
🔧 Troubleshooting
Common Issues & Solutions
Problem: Indicators not showing
Solution: Check "Show on Chart" is enabled
Problem: Alerts not triggering
Solution: Verify alert is enabled in both script and TradingView alert panel
Problem: Performance issues
Solution: Reduce number of enabled components or increase timeframe
Problem: Volume Profile not updating
Solution: Adjust Profile Length setting, ensure sufficient historical data
Performance Optimization
Disable unused components
Increase chart timeframe
Reduce historical bar count
Use on lower timeframes with fewer indicators enabled
💡 Pro Tips
Risk Management
Use Volatility Indicator for position sizing
Monitor Cumulative Delta for trend confirmation
Use POC levels for stop-loss placement
Multi-Timeframe Analysis
Use higher timeframe for trend direction
Use current timeframe for entry timing
Correlate signals across timeframes
Market Condition Adaptation
Trending Markets: Focus on Momentum + Order Flow
Ranging Markets: Focus on Volume Profile + Compression
High Volatility: Use smaller position sizes
Low Volatility: Prepare for compression breakouts
📚 Educational Resources
Key Concepts to Master
Volume-price relationships
Market microstructure
Institutional order flow
Volatility regimes
Momentum vs mean reversion
Recommended Learning Path
Start with Order Flow + Momentum only
Add Volume Profile once comfortable
Incorporate Volatility analysis
Master multi-component correlation
🆘 Support
Getting Help
Check component toggles are enabled
Verify sufficient historical data is loaded
Test on major pairs/indices first
Adjust settings for your trading style
Continuous Improvement
Backtest strategies thoroughly
Keep a trading journal
Adjust parameters based on market conditions
Combine with price action analysis
Remember: No indicator is perfect. Use this tool as part of a comprehensive trading plan with proper risk management. Always test strategies in demo accounts before live trading.
Happy Trading! 📈

Dammu AI ADVANCED PRO1. Indicator Overview
Name: Dammu
Type: Overlay indicator (draws on price chart)
Purpose: Combines SuperTrend, SMA/EMA trends, Swing/Structure analysis, Order Blocks, Fair Value Gaps, High/Low levels, TP/SL labels, and alerts.
Pine Script Version: v5
2. SuperTrend Module
Computes SuperTrend line using ATR and sensitivity.
Signals:
Bullish: Price crosses above SuperTrend.
Bearish: Price crosses below SuperTrend.
Plots buy/sell labels 🚀🐻 based on SMA comparison and SuperTrend cross.
3. SMA/EMA Trend Components
SMA8 & SMA9: Used for additional trend confirmation.
EMA lines: Multiple EMAs with different multipliers for trend detection.
Trend Cloud: Uses Hull MA for trend smoothing.
4. Risk Management
TP/SL Levels: Automatic calculation of stop-loss and take-profit (TP1, TP2, TP3).
Configurable ATR-based risk percentage.
Lines and labels drawn for visual TP/SL.
5. Chart Features
Smooth Range Filter: Filters noise for trend detection.
Colored Trend Cloud: Upward trend = cyan, downward = red.
Sideways Market: ADX filter to color bars purple if trend is weak/sideways.
Bar Colors: Green/red based on SuperTrend signals.
6. Swing & Structure Analysis
Detects Swing Highs/Lows, labels as HH, LH, LL, HL.
Detects CHoCH (Change of Character) or BOS (Break of Structure).
Can show internal or swing structures with configurable label size and color.
7. Order Blocks (Smart Money Concepts)
Detects Internal Order Blocks (iOB) and Swing Order Blocks (OB).
Stores top/bottom/left/time/type in arrays.
Colors and shows boxes based on bullish/bearish type.
Automatically deletes OB if price breaks the block.
8. Fair Value Gaps (FVG)
Identifies gaps between candles as potential trading zones.
Configurable bullish/bearish colors and extension bars.
9. EQH/EQL (Equal Highs/Lows)
Detects equal highs/lows using a threshold.
Plots dotted lines and labels EQH/EQL.
10. High/Low Levels MTF
Optional plotting of previous daily, weekly, monthly highs/lows.
11. Premium/Discount Zones
Plots Premium, Discount, and Equilibrium Zones.
Colors: Premium = red, Discount = green, Equilibrium = gray.
12. Alerts
Buy/Sell alerts for:
SuperTrend crossover
BOS/CHoCH (swing/internal)
EQH/EQL triggers
13. Miscellaneous
Configurable visuals: line style, label size, transparency.
Adjustable volatility filters, ATR lengths, smoothing constants.
Integrated risk & reward visualization.
✅ In short:
This is an all-in-one Smart Money + Trend indicator with SuperTrend signals, swing/structure detection, order blocks, FVGs, EQH/EQL, TP/SL visualization, and optional alerts. It’s designed for both trend-following and order-block-based trading.
If you want, I can make a super-short 1-paragraph version that summarizes it even faster for quick reference.

Dammu AI PROType & Purpose
Multi-functional trend, swing, and smart money concept indicator.
Combines SuperTrend, SMA, ATR-based risk management, swing structures, order blocks, EQH/EQL, and Fair Value Gaps (FVG).
Designed for identifying trends, entries/exits, and support/resistance zones.
2. Trend Detection
SuperTrend with ATR smoothing (nsensitivity*7 factor) for buy/sell signals.
SMA filter (8 & 9 periods) confirms trend strength.
Bar color changes:
Green if close > supertrend.
Red if close < supertrend.
Cirrus Cloud highlights trend zones with semi-transparent colors.
3. Swing & Structure
Detects pivot highs/lows and labels them as HH/LH (Highs), HL/LL (Lows).
Generates BOS (Break of Structure) and CHoCH (Change of Character) signals.
Internal swing structures and order blocks for short-term intraday moves.
4. Order Blocks
Internal Order Blocks (iOBs) and Swing Order Blocks (OBs).
Boxes drawn for bullish/bearish zones.
Auto-delete when broken.
Option to filter blocks by ATR or Cumulative Mean Range.
5. Risk Management
TP/SL levels based on ATR and user-defined % risk.
Shows lines and labels for:
Entry
Stop Loss
TP1, TP2, TP3
Adjustable line style (solid/dashed/dotted).
6. Fair Value Gaps (FVG)
Highlights bullish and bearish gaps.
Option for auto-threshold filtering.
Extendable FVG boxes.
7. EQH/EQL
Detects Equal Highs (EQH) and Equal Lows (EQL) for potential reversals.
Dotted lines with labels.
8. Smart Money Concepts (SMC) Features
Shows:
Swings (internal & swing structure)
Internal order blocks
Premium/Discount zones
Fair Value Gaps
Highs/Lows from previous day/week/month
Configurable for historical vs present display.
9. Alerts
Buy/Sell triggers:
bull = crossover of close above SuperTrend.
bear = crossunder of close below SuperTrend.
Alerts for BOS/CHoCH, EQH/EQL, and OB breaks.
10. Visualization
Trend clouds, colored bars, SMA markers, SuperTrend labels.
Multi-layered info displayed without cluttering the chart.
Customizable colors, line styles, and transparency.
✅ Summary:
This indicator is a comprehensive trading tool for trend detection, swing structure, order block analysis, and risk management. It’s built for smart money and SMC-based trading, offering visual cues and alerts for key trading decisions.

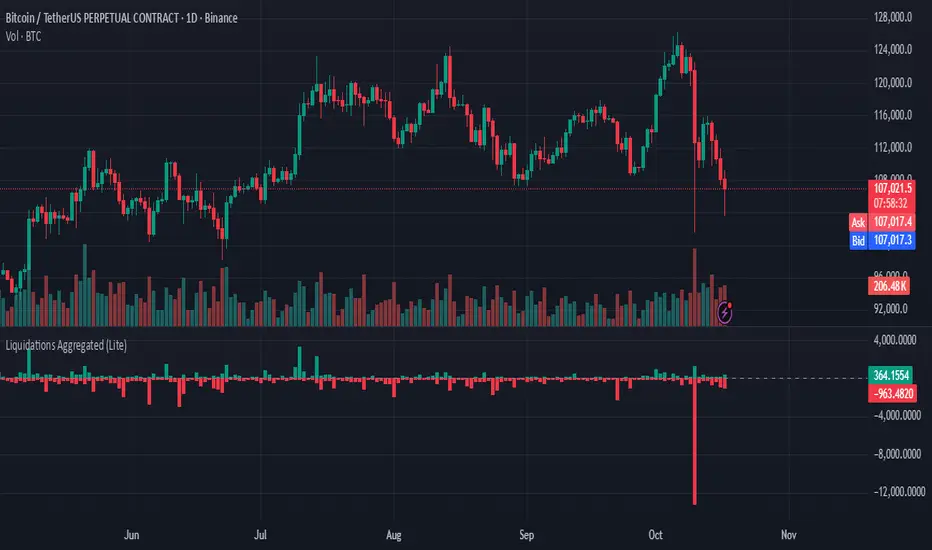
Liquidations Aggregated (Lite)Liquidations Aggregated (Lite)
The Liquidations Aggregated (Lite) script provides a unified cross-exchange visualization of short and long liquidation volumes, allowing traders to identify high-impact market events and sentiment reversals driven by forced position closures. It aggregates normalized liquidation data from Binance, Bybit, and OKX into a single coherent output, offering a consolidated perspective of derivative market stress across major venues.
Core Concept
Liquidations are involuntary closures of leveraged positions when margin requirements are breached. They represent points of structural orderflow imbalance, often triggering localized volatility spikes and price pivots. This indicator isolates and aggregates those liquidation volumes by direction (short vs. long), allowing traders to map where leveraged traders are being forced out and whether current market movement is driven by short covering or long capitulation.
Underlying Methodology
Each connected exchange provides liquidation feeds via standardized symbols (e.g., BTCUSDT.P_LQBUY or BTCUSD.P_LQSELL).
The script differentiates between:
Short Liquidations → Buy Volume: Forced covering of shorts, representing upward pressure.
Long Liquidations → Sell Volume: Forced selling of longs, representing downward pressure.
Bybit’s inverse data is normalized to align directional logic with Binance and OKX. Data is drawn through the request.security() function per symbol and per exchange, with per-exchange scaling adjustments applied to compensate for differences in reported nominal sizes (USD vs. coin-margined). The script is meant to match the calculation methods of professional-grade data sources (e.g., Velodata, Coinalyze). The value is denominated in the base currency at all times.
Computation Logic
Liquidation volumes are fetched separately for USD- and USDT-margined pairs on each exchange.
Exchange-specific magnitude adjustments are applied to account for nominal denomination differences.
Normalized liquidation buy and sell volumes are summed into two global aggregates:
combinedBuyVolumeLiquidationsShort → aggregated buy volume from forced short positions closes (Short Liquidations)
combinedSellVolumeLiquidationsLong → aggregated sell pressure from forced long position closes (Long Liquidations)
Final series are plotted as mirrored column charts around a zero baseline for direct comparison.
How to Use
Apply the script to any crypto perpetual futures symbol (e.g., BTCUSDT, ETHUSDT).
Observe teal bars (Buy Volume from Short Liquidations) for short squeezes and red bars (Sell Volume from Long Liquidations) for long wipes.
Strong teal spikes during downtrends often indicate aggressive short liquidations leading to short-term bounces.
Strong red spikes during uptrends often mark long unwinds that can trigger sharp retracements.
Sustained asymmetry in either direction suggests systemic imbalance across leveraged positioning.
First week of the yearA very simple indicator that marks a channel on the candlestick for the first week of the year.
The channel can serve as an entry/exit point with a medium and long term focus.
Note: This indicator should be observed exclusively on the weekly timeframe.
Smart Money Toolkit - PD Engine Bias Map [KedArc Quant]📄 Description
Smart Money Toolkit is an advanced multi-layer Smart Money Concepts framework that automatically detects structure shifts, premium-discount zones, and institutional order flow.
It’s built around the PD Engine, which calculates the midpoint of the most recent market swing and dynamically determines BUY or SELL bias based on where current price trades relative to that equilibrium. This toolkit visualizes structure, order blocks, and bias context in one clean map — giving traders an institutional-grade lens without signal clutter.
💡 Why It’s Unique
* Not a mashup of open-source scripts.
Every module — CHoCH/BOS logic, order-block zone detection, PD bias engine, and structure mapping — is written from scratch to ensure clean, consistent behavior in Pine Script v6.
* Bias engine with true equilibrium logic: The 50% PD (Premium-Discount) zone adapts in real time to the latest swing, giving a live institutional price map.
* Visual precision: Minimalist premium/discount shading, structured labeling (HH, HL, LH, LL, CHoCH), and context tables for clarity.
* Performance-optimized: Handles multiple visual layers (FVG, OB, CHoCH, BOS) efficiently without repainting.
🎯 Entry and Exit Logic (Discretionary Framework)
This toolkit is not a signal generator; it’s a contextual trading framework that guides your decisions.
BUY Bias (Discount Zone)
* Price trades below PD Mid → Market is in *discount*.
* Wait for a bullish CHoCH or rejection from demand OB/FVG before entering long.
* Target 1 = PD Mid; Target 2 = next opposing OB/FVG.
SELL Bias (Premium Zone)
* Price trades above PD Mid → Market is in *premium*.
* Wait for a bearish CHoCH or rejection from supply OB/FVG before shorting.
* Target 1 = PD Mid; Target 2 = next opposing OB/FVG.
This sequence enforces the institutional concept:
> Bias → Structure Shift → Confirmation → Execution
⚙️ Input Configuration
Setting Description
Swing Sensitivity Controls how far back to look for HH/LL pivots.
OB/FVG Detection Enable or disable visual order block or fair-value-gap zones.
PD Engine Toggles PD midpoint line, zone shading, and bias table.
Multi-TF Bias Sync Optionally reads higher-time-frame bias to confirm entries.
Color Themes Switch between Light / Dark / Institutional color sets.
All inputs are modular — you can show only the components you use (e.g., disable BOS/CHoCH labels or hide OB zones for a clean view).
🧮 Formula / Logic Summary
Concept Formula
PD Mid (Equilibrium) `(Recent Swing High + Recent Swing Low) / 2`
BUY Bias `close < PD Mid`
SELL Bias `close > PD Mid`
CHoCH / BOS Detected via pivot-based structure reversal: HH→LL or LL→HH
Order Block Last bullish/bearish candle before displacement.
Fair Value Gap (FVG) Gap between prior candle’s high/low and next candle’s range.
These formulas align with Smart Money Concepts taught in institutional trading frameworks.
🤝 How It Helps Traders
* Institutional Context: Instantly visualize premium vs. discount regions — see where smart money is likely accumulating or distributing.
* Bias Confidence: Removes guesswork — you know whether you should be a buyer or seller based on structure + PD bias.
* Cleaner Decision-Making: Combines all SMC elements (BOS, CHoCH, OB, FVG, PD) in one cohesive visual map.
* Timeframe Agnostic: Works seamlessly on any timeframe or instrument (Forex, Indices, Crypto, Equities).
📚 Glossary
PD Mid (Equilibrium) The midpoint between recent swing high and low — the market’s fair
value.
Premium Zone Price above PD Mid — sellers gain control.
Discount Zone Price below PD Mid — buyers gain control.
CHoCH (Change of Character) First structural signal of possible reversal.
BOS (Break of Structure) Continuation signal confirming trend direction.
OB (Order Block) Institutional candle marking accumulation/distribution.
FVG (Fair Value Gap) Imbalance zone where price moved too quickly — often
rebalanced.
❓ FAQ
Q: Is this a signal generator?
A: No — it’s a contextual framework for professional price-action trading.
Q: Does it repaint?
A: No. All structure points and bias logic are confirmed on bar close.
Q: Can it be used on any market or timeframe?
A: Yes. It’s structure-based, not instrument-specific.
Q: How often does bias change?
A: Only when a new swing high/low forms and PD recalculates — keeping the bias stable.
Q: Can I backtest it?
A: You can build an entry rule (e.g., CHoCH + OB + PD alignment) on top of it for strategy testing.
⚠️ Disclaimer
This script is provided for educational purposes only.
Past performance does not guarantee future results.
Trading involves risk, and users should exercise caution and use proper risk management when applying this strategy.

Institutional Activity DetectorInstitutional Activity Detector - Complete Tutorial
Table of Contents
Installation
Understanding the Indicator
Signal Interpretation
Settings Configuration
Trading Strategies
Best Practices
Common Mistakes to Avoid
1. Installation {#installation}
Step-by-Step Setup:
Step 1: Access TradingView
Go to TradingView.com
Log in to your account (free account works fine)
Step 2: Open Pine Editor
Click on "Pine Editor" at the bottom of the chart
If you don't see it, go to the top menu and select "Pine Editor"
Step 3: Add the Script
Click "New" to create a new indicator
Delete any default code
Copy the entire Institutional Activity Detector code
Paste it into the editor
Step 4: Save and Apply
Click "Save" (give it a name like "Inst Detector")
Click "Add to Chart"
The indicator will now appear on your chart
2. Understanding the Indicator {#understanding}
What It Detects:
This indicator identifies institutional traders (banks, hedge funds, market makers) by analyzing:
Volume Analysis
Detects unusual volume spikes that indicate large players entering
Compares current volume to 20-period average
Institutional trades create volume 2-5x normal levels
Order Flow
Delta: Difference between buying and selling volume
Positive delta = More buying pressure
Negative delta = More selling pressure
Institutions leave "footprints" in order flow
Price Action Patterns
Bullish Rejection Wicks:
| <- Small upper wick
|
███ <- Small body
███
|
|
| <- Large lower wick (rejection)
Indicates institutions bought aggressively at lower prices
Bearish Rejection Wicks:
|
|
| <- Large upper wick (rejection)
|
███ <- Small body
███
| <- Small lower wick
Indicates institutions sold aggressively at higher prices
Liquidity Grabs
Institutions often:
Push price above resistance or below support
Trigger stop losses (grab liquidity)
Reverse direction and trade the other way
Dark Pool Activity
Large block trades executed off-exchange:
High volume with minimal price movement
Indicates institutional accumulation/distribution without moving price
3. Signal Interpretation {#signals}
Signal Types:
🟢 INSTITUTIONAL BUY Signal
Appears as green triangle below candle with strength number (2-5)
What it means:
Institutions are actively accumulating (buying)
Higher strength = More confirmation factors
Strength Levels:
2-3: Moderate confidence - Wait for confirmation
4: High confidence - Strong institutional interest
5: Maximum confidence - Multiple factors aligned
🔴 INSTITUTIONAL SELL Signal
Appears as red triangle above candle with strength number (2-5)
What it means:
Institutions are actively distributing (selling)
Higher strength = More confirmation factors
🟠 Dark Pool (DP) Marker
Small orange diamond
What it means:
Large block trade executed
Accumulation/distribution happening quietly
Often precedes significant moves
Liquidity Zones
Red boxes above price = Resistance/sell liquidity
Green boxes below price = Support/buy liquidity
Institutions target these zones to trigger stops
4. Settings Configuration {#settings}
Recommended Settings by Asset Type:
For Stocks (SPY, AAPL, TSLA):
Volume Spike Multiplier: 2.0
Volume Average Period: 20
Delta Threshold: 70%
Minimum Signal Strength: 3
Timeframe: 5m, 15m, 1H
For Forex (EUR/USD, GBP/USD):
Volume Spike Multiplier: 1.5
Volume Average Period: 30
Delta Threshold: 65%
Minimum Signal Strength: 3
Timeframe: 15m, 1H, 4H
For Crypto (BTC, ETH):
Volume Spike Multiplier: 2.5
Volume Average Period: 20
Delta Threshold: 70%
Minimum Signal Strength: 4
Timeframe: 15m, 1H, 4H
For Futures (ES, NQ):
Volume Spike Multiplier: 2.0
Volume Average Period: 20
Delta Threshold: 75%
Minimum Signal Strength: 3
Timeframe: 5m, 15m, 30m
Parameter Explanations:
Volume Spike Multiplier (1.0 - 10.0)
Lower = More sensitive (more signals, some false)
Higher = Less sensitive (fewer signals, more reliable)
Start with 2.0 and adjust based on your asset's volatility
Delta Threshold % (50 - 100)
Measures buying vs selling pressure
70% = Strong institutional bias required
Lower for ranging markets, higher for trending
Minimum Signal Strength (2 - 5)
Number of factors that must align for a signal
2 = Very sensitive (many signals)
5 = Very conservative (rare signals)
Recommended: 3-4 for balance
5. Trading Strategies {#strategies}
Strategy 1: Liquidity Grab Reversal
Setup:
Price approaches a liquidity zone (green/red box)
Price penetrates the zone briefly
Institutional BUY/SELL signal appears
Price reverses away from the zone
Entry:
Enter on the signal candle close
Or wait for next candle confirmation
Stop Loss:
Below the liquidity grab low (for buys)
Above the liquidity grab high (for sells)
Take Profit:
2:1 or 3:1 risk/reward ratio
Or next opposing liquidity zone
Example:
Price drops below support → Triggers stops →
Institutional BUY signal (4-5 strength) →
Enter LONG → Price rallies
Strategy 2: Trend Continuation
Setup:
Identify the trend (higher highs/higher lows for uptrend)
Wait for pullback to support in uptrend
Institutional BUY signal appears during pullback
Confirms institutions are adding to positions
Entry:
Enter on signal with strength ≥ 4
Or next candle after signal
Stop Loss:
Below the pullback low + small buffer
Take Profit:
Previous swing high
Or trailing stop using ATR
Strategy 3: Dark Pool Accumulation
Setup:
Dark Pool (DP) markers appear multiple times
Price consolidates in tight range
Institutional BUY signal with high strength appears
Breakout occurs
Entry:
Enter on breakout candle after signal
Or on retest of breakout level
Stop Loss:
Below consolidation range
Take Profit:
Measured move (height of consolidation projected)
Strategy 4: Divergence Play
Setup:
Price makes lower low
MFI/RSI makes higher low (bullish divergence)
Institutional BUY signal appears
Volume confirms with spike
Entry:
Enter on signal candle or next
Stop Loss:
Below the divergence low
Take Profit:
Previous swing high or resistance
6. Best Practices {#best-practices}
✅ DO's:
1. Use Multiple Timeframes
Check higher timeframe for trend direction
Trade signals that align with higher timeframe
Example: 15m signals in direction of 1H trend
2. Combine with Key Levels
Support/resistance
Supply/demand zones
Previous day high/low
Round numbers (psychological levels)
3. Wait for Confirmation
Don't rush into trades
Let the signal candle close
Watch next candle for follow-through
4. Check the Metrics Table
Look at Relative Volume (should be >2.0)
Check Delta % (should be strong positive/negative)
Verify Order Flow aligns with signal
5. Consider Market Context
News events can override signals
Low liquidity times (lunch, overnight) less reliable
Major economic releases need caution
6. Paper Trade First
Test the indicator for 2-4 weeks
Learn how it behaves on your chosen assets
Develop confidence before using real money
Best Times to Trade:
Stock Market Hours:
9:30-11:30 AM EST (high volume, strong moves)
2:00-4:00 PM EST (institutional positioning)
Avoid: 11:30 AM-2:00 PM (lunch, low volume)
Forex:
London Open: 3:00-6:00 AM EST
New York Open: 8:00-11:00 AM EST
London/NY Overlap: 8:00 AM-12:00 PM EST
Crypto:
24/7 market, but highest volume during US/European hours
Watch for weekend low liquidity
7. Common Mistakes to Avoid {#mistakes}
❌ DON'T:
1. Trade Every Signal
Not all signals are equal
Focus on strength 4-5 signals
Wait for optimal setups
2. Ignore Market Structure
Don't buy into strong downtrends (catch falling knife)
Don't sell into strong uptrends (fight the tape)
Respect major support/resistance
3. Use Too Small Timeframes
1m and 2m charts are too noisy
Minimum recommended: 5m for scalping
Better: 15m, 30m, 1H for reliability
4. Overtrade
Quality over quantity
2-5 good trades per day is excellent
Forcing trades leads to losses
5. Ignore Risk Management
Always use stop losses
Risk only 1-2% per trade
Don't revenge trade after losses
6. Trade During Low Volume
Signals less reliable with low volume
Check Relative Volume metric (should be >1.5)
Avoid pre-market/after-hours for stocks
7. Misread Liquidity Grabs
Not every wick is a liquidity grab
Need volume confirmation
Must have institutional signal
Advanced Tips:
Filtering False Signals:
Use Signal Strength Filter:
Minimum strength 3 = Balanced
Minimum strength 4 = Conservative (recommended)
Minimum strength 5 = Ultra conservative
Confluence Checklist:
Signal strength ≥ 4
Relative volume > 2.0
At key support/resistance
Aligns with higher timeframe trend
Delta % strongly positive/negative
Clean price action setup
If 4+ boxes checked = High probability trade
Setting Up Alerts:
Click the three dots on the indicator
Select "Create Alert"
Choose condition:
"Institutional Buy Signal"
"Institutional Sell Signal"
"Dark Pool Activity"
Set up notification (email, SMS, app)
Save alert
Alert Strategy:
Set minimum strength to 4 for fewer, better alerts
Use for assets you can't watch constantly
Don't rely solely on alerts - check chart context
Practice Exercise:
Week 1-2: Observation
Add indicator to your favorite assets
Watch how signals develop
Note which ones lead to profitable moves
Don't trade yet - just observe
Week 3-4: Paper Trading
Use TradingView's paper trading
Trade only strength 4-5 signals
Record results in a journal
Note: entry, exit, profit/loss, what worked/didn't
Week 5+: Small Live Positions
Start with smallest position size
Trade only your best setups
Gradually increase size as you gain confidence
Keep detailed journal
Quick Reference Card:
Signal Quality Ranking:
🔥 Best Setups (Take These):
Strength 5 + Liquidity grab + Key level
Strength 4-5 + Volume >3.0 + Trend alignment
Dark Pool markers + Strength 4+ signal
✅ Good Setups:
Strength 4 at support/resistance
Strength 3-4 with strong delta
Liquidity grab + Strength 3+
⚠️ Caution (Wait for More):
Strength 2-3 in middle of nowhere
Against higher timeframe trend
Low volume (Rel Vol <1.5)
❌ Avoid:
Strength 2 only
During major news
Low liquidity hours
Against strong trend
Troubleshooting:
"Too many signals"
→ Increase Minimum Signal Strength to 4
→ Increase Volume Spike Multiplier to 2.5-3.0
"Too few signals"
→ Decrease Minimum Signal Strength to 2-3
→ Decrease Volume Spike Multiplier to 1.5
"Signals not working"
→ Check if you're trading during low volume hours
→ Verify you're using recommended timeframes
→ Make sure signals align with market structure
"Can't see liquidity zones"
→ Enable "Show Liquidity Zones" in settings
→ Adjust Swing Detection Length (try 7-15)
Resources for Further Learning:
Concepts to Study:
Order Flow Trading
Market Profile / Volume Profile
Smart Money Concepts (SMC)
Liquidity Sweeps and Stop Hunts
Institutional Order Flow
Wyckoff Method
Volume Spread Analysis (VSA)
Recommended Practice:
Study past signals on chart
Replay market using TradingView's bar replay feature
Join trading communities to share setups
Keep a detailed trading journal
Final Thoughts:
This indicator is a tool, not a crystal ball. It identifies high-probability setups where institutions are active, but still requires:
Proper risk management
Market context understanding
Patience and discipline
Continuous learning
Success Formula:
Right Tool + Proper Training + Risk Management + Discipline = Consistent Profits
Start slow, master the basics, and gradually increase complexity as you gain experience.
Good luck and trade smart! 📊📈
MK_OSFT-Momentum Confluence DetectorMOMENTUM CONFLUENCE DETECTOR - Trading Indicator Overview
What This Indicator Does
The Momentum Confluence Detector is a comprehensive Pine Script indicator designed to identify high-probability trading opportunities by detecting momentum bars that align with multiple confluence factors. It combines traditional technical analysis with advanced Smart Money Concepts to filter out noise and highlight the most significant price movements.
CORE FUNCTIONALITY
📊 Momentum Bar Detection Identifies unusual volume and bar size expansion using customizable multipliers
Detects bullish, bearish, and neutral momentum bars based on OHLC relationships
Uses moving averages to establish baseline volume and bar size thresholds
🔄 Multi-Filter Confluence System
The indicator employs up to 5 different filter types to validate momentum signals:
Level Concept Filter - Choose between:
- Support/Resistance Levels : Traditional pivot-based S/R zones with touch counting and break tracking
- Smart Money Concepts : Institutional order flow analysis including Order Blocks, Fair Value Gaps (FVGs), and market structure breaks
Trend Filter : EMA/SMA-based trend direction confirmation with alignment requirements
Breakout Filter : Detects price breakouts beyond recent highs/lows with percentage thresholds
Volatility Filter : ATR expansion confirmation to ensure signals occur during active market conditions
Market Session Filter : Filters signals to specific trading sessions (Tokyo, London, New York)
ADVANCED FEATURES
🎯 Smart Money Concepts Integration
Order Blocks : Identifies institutional supply/demand zones from major and minor structure breaks
Fair Value Gaps (FVGs) : Detects price imbalances and tracks their evolution through partial fills and inversions
Market Structure : Recognizes Break of Structure (BOS) and Change of Character (CHoCH) patterns
Retracement Patterns : Tracks HLH (Higher-Low-Higher) and LHL (Lower-High-Lower) institutional patterns
📈 Support/Resistance System
Multi-timeframe pivot detection (3, 5, 7-bar spans)
Volume-weighted strength calculation for level importance
Dynamic level merging and break tracking
Automatic level type classification (Support/Resistance/Flip zones)
⚙️ Intelligent Filtering Logic
ALL Mode : Requires all enabled filters to pass (high precision)
ANY Mode : Requires at least one filter to pass (higher frequency)
Real-time filter status tracking and visualization
Visual Features
Signal Markers : Clear triangular markers for qualified momentum bars
Unfiltered Signals : Optional display of raw momentum bars for comparison
Level Visualization : Dynamic S/R level boxes and lines with strength indicators
Structure Lines : BOS/CHoCH break visualization with major/minor classification
Fair Value Gaps : Color-coded boxes showing bullish/bearish FVGs with partial fill tracking and IFVG conversion
Order Blocks : Institutional supply/demand zones displayed as colored boxes with major/minor classification
Information Table : Real-time display of signal details and filter status
Session Boxes : Visual representation of active trading sessions
Practical Applications
✅ Swing Trading : Identify high-probability reversal and continuation setups
✅ Day Trading : Spot intraday momentum shifts with institutional backing
✅ Multi-Timeframe Analysis : Combine major and minor structure analysis
✅ Risk Management : Filter out low-quality setups using confluence requirements
✅ Educational : Understand market structure and institutional order flow
Customization Options
Adjustable momentum thresholds for different market conditions
Comprehensive filter settings with individual enable/disable controls
Visual customization for colors, sizes, and display preferences
Alert system with detailed signal information
Performance optimization settings for different chart timeframes
Who Should Use This Indicator
This indicator is suitable for traders who:
Want to combine multiple technical analysis approaches
Seek to understand institutional market behavior
Prefer confluence-based trading setups
Need customizable filtering for different market conditions
Value comprehensive signal validation over high-frequency alerts
The Momentum Confluence Detector transforms complex market analysis into clear, actionable signals by requiring multiple forms of confirmation before highlighting trading opportunities.

CNagda-MomentumX - Institutional FlowMomentumX is designed to empower traders with a deeper understanding of market movements by focusing on Institutional Flow and advanced market structure analytics. The core goal is to identify and visualize where major market participants are operating, and to translate these complex footprints into clear, actionable trading signals — all in real time.
Real-time institutional activity mapping
Actionable entry and exit signals based on live market structure
Intuitive dashboard and dynamic chart visuals
Fully customizable modules for trend, liquidity, and order blocks
Core Logic Design
At the heart of MomentumX lies a robust algorithmic engine built to capture and surface institutional trading behavior. By leveraging advanced mathematical models, the indicator calculates institutional volume ratios and price momentum to pinpoint aggressive moves from large participants.
Institutional Volume & Price Momentum:
Utilizes custom volume indicators and price change analysis to detect strong buying or selling pressure, filtering out retail noise.
Liquidity Grab Detection & Activity Zones:
The script identifies liquidity grabs by monitoring abrupt price sweeps at major support/resistance levels—often where institutions trigger stop hunts or reversals. All critical activity zones are automatically color-coded on the chart for instant recognition.
Dashboard Visualization:
A fully dynamic dashboard table overlays live scores for accumulation, distribution, strength, and weakness—giving traders a real-time scan of market health.
Trendline & Order Block Architecture:
The logic auto-detects pivot highs/lows to draw smart trendlines, while the order block system highlights key reversal areas and breaker zones—making market structure clear and actionable.
MomentumX is packed with high-performance modules, each engineered to simplify complex market behavior and enhance decision-making for traders:
Institutional Flow Signals:
Instantly identifies spots where institutional players drive momentum, using unique volume and price activity analytics.
Bullish/Bearish Liquidity Grab Detection:
Marks abrupt price moves that signal stop hunts or reversals, letting traders anticipate snap-backs or trend shifts.
Trendline Auto-Detection:
Smartly draws trendlines based on significant swing highs and lows, automatically adjusting as price evolves.
Order Block System (Rejection/Breaker):
Spots and highlights key reversal zones with order block rectangles, confirming rejections or breakouts at strategic levels.
Dashboard and Bar Coloring:
A clean dashboard overlay presents live market scores, while dynamic bar coloring makes trend, strength, and high-activity periods instantly visible.
User Input Toggles for Each Module:
Every major feature is fully customizable—enable or disable modules to match individual trading setups or preferences.
Scripting/Development
MomentumX’s scripting process is modular, enabling clarity, scalability, and fast optimization throughout development:
Initialization & Inputs:
Start by defining all user input options, module toggles, color settings, and calculation parameters—ensuring maximum flexibility early on.
Core Calculation Functions:
Script advanced institutional volume and price momentum algorithms. Build out swing length logic, market state filters, and activity scoring methods.
Detection Engines:
Develop and integrate engines for liquidity grabs, automated trendline detection, and order block identification—each with dedicated functions for speed and precision.
Visual Overlays & Plotting:
Implement powerful plotting logic for colored bars, score dashboards, trendlines, reversal zones, and liquidity markers—making every data point clear and actionable on the chart.
Testing Handlers:
Add diagnostic panels and debug outputs to refine calculations and assure accuracy in every market environment.
Sample Trade Setups (Usage)
Cnagda MomentumX delivers clarity for multiple trading styles by providing timely, actionable setups grounded in institutional behavior and market structure. Here’s how traders can leverage the indicator for confident decision-making:
Liquidity Grab Reversal
Enter trades around detected liquidity grabs when price sweeps major support/resistance and the dashboard signals a momentum shift.
Example: Wait for a bullish/Bearish grab near market lows/high, with institutional flow turning positive/negative—enter long/short for potential mean reversion.
Order Block Breakout
Trade breakouts when price cleanly rejects or flips key order block zones highlighted on the chart.
Example: Short at a marked breaker block after a rejection signal, confirmed by a downward institutional activity spike.
Trendline Continuation
Ride established market moves by entering on trendline confirmations plotted by the auto-detect system.
Example: Go long after a trendline retest, confirmed by a green bar color and dashboard strength score.
Dashboard Confirmation
Combine dashboard metrics (strength, accumulation, distribution) with bar color overlays for multi-factor entries.
Example: Enter trades only when all market signals align in real time for maximum probability.
For Short Entry check -- Weakness : For Long Entry Check - Strength With Other Indications
MomentumX is not just another indicator – it’s your edge for reading the market like an insider. By transparently mapping institutional flow, uncovering hidden liquidity zones, and color-coding every major structure shift, MomentumX transforms complexity into actionable clarity. Whether you’re scalping, swing trading, or investing, you’ll gain a decisive, real-time advantage on every chart.
Embrace smarter decisions, adapt to changing market conditions instantly, and join a new generation of technically empowered traders.
Customize, observe, and let the market reveal opportunities in a way you’ve never experienced before.
Happy Trading

TA█ TA Library
📊 OVERVIEW
TA is a Pine Script technical analysis library. This library provides 25+ moving averages and smoothing filters , from classic SMA/EMA to Kalman Filters and adaptive algorithms, implemented based on academic research.
🎯 Core Features
Academic Based - Algorithms follow original papers and formulas
Performance Optimized - Pre-calculated constants for faster response
Unified Interface - Consistent function design
Research Based - Integrates technical analysis research
🎯 CONCEPTS
Library Design Philosophy
This technical analysis library focuses on providing:
Academic Foundation
Algorithms based on published research papers and academic standards
Implementations that follow original mathematical formulations
Clear documentation with research references
Developer Experience
Unified interface design for consistent usage patterns
Pre-calculated constants for optimal performance
Comprehensive function collection to reduce development time
Single import statement for immediate access to all functions
Each indicator encapsulated as a simple function call - one line of code simplifies complexity
Technical Excellence
25+ carefully implemented moving averages and filters
Support for advanced algorithms like Kalman Filter and MAMA/FAMA
Optimized code structure for maintainability and reliability
Regular updates incorporating latest research developments
🚀 USING THIS LIBRARY
Import Library
//@version=6
import DCAUT/TA/1 as dta
indicator("Advanced Technical Analysis", overlay=true)
Basic Usage Example
// Classic moving average combination
ema20 = ta.ema(close, 20)
kama20 = dta.kama(close, 20)
plot(ema20, "EMA20", color.red, 2)
plot(kama20, "KAMA20", color.green, 2)
Advanced Trading System
// Adaptive moving average system
kama = dta.kama(close, 20, 2, 30)
= dta.mamaFama(close, 0.5, 0.05)
// Trend confirmation and entry signals
bullTrend = kama > kama and mamaValue > famaValue
bearTrend = kama < kama and mamaValue < famaValue
longSignal = ta.crossover(close, kama) and bullTrend
shortSignal = ta.crossunder(close, kama) and bearTrend
plot(kama, "KAMA", color.blue, 3)
plot(mamaValue, "MAMA", color.orange, 2)
plot(famaValue, "FAMA", color.purple, 2)
plotshape(longSignal, "Buy", shape.triangleup, location.belowbar, color.green)
plotshape(shortSignal, "Sell", shape.triangledown, location.abovebar, color.red)
📋 FUNCTIONS REFERENCE
ewma(source, alpha)
Calculates the Exponentially Weighted Moving Average with dynamic alpha parameter.
Parameters:
source (series float) : Series of values to process.
alpha (series float) : The smoothing parameter of the filter.
Returns: (float) The exponentially weighted moving average value.
dema(source, length)
Calculates the Double Exponential Moving Average (DEMA) of a given data series.
Parameters:
source (series float) : Series of values to process.
length (simple int) : Number of bars for the moving average calculation.
Returns: (float) The calculated Double Exponential Moving Average value.
tema(source, length)
Calculates the Triple Exponential Moving Average (TEMA) of a given data series.
Parameters:
source (series float) : Series of values to process.
length (simple int) : Number of bars for the moving average calculation.
Returns: (float) The calculated Triple Exponential Moving Average value.
zlema(source, length)
Calculates the Zero-Lag Exponential Moving Average (ZLEMA) of a given data series. This indicator attempts to eliminate the lag inherent in all moving averages.
Parameters:
source (series float) : Series of values to process.
length (simple int) : Number of bars for the moving average calculation.
Returns: (float) The calculated Zero-Lag Exponential Moving Average value.
tma(source, length)
Calculates the Triangular Moving Average (TMA) of a given data series. TMA is a double-smoothed simple moving average that reduces noise.
Parameters:
source (series float) : Series of values to process.
length (simple int) : Number of bars for the moving average calculation.
Returns: (float) The calculated Triangular Moving Average value.
frama(source, length)
Calculates the Fractal Adaptive Moving Average (FRAMA) of a given data series. FRAMA adapts its smoothing factor based on fractal geometry to reduce lag. Developed by John Ehlers.
Parameters:
source (series float) : Series of values to process.
length (simple int) : Number of bars for the moving average calculation.
Returns: (float) The calculated Fractal Adaptive Moving Average value.
kama(source, length, fastLength, slowLength)
Calculates Kaufman's Adaptive Moving Average (KAMA) of a given data series. KAMA adjusts its smoothing based on market efficiency ratio. Developed by Perry J. Kaufman.
Parameters:
source (series float) : Series of values to process.
length (simple int) : Number of bars for the efficiency calculation.
fastLength (simple int) : Fast EMA length for smoothing calculation. Optional. Default is 2.
slowLength (simple int) : Slow EMA length for smoothing calculation. Optional. Default is 30.
Returns: (float) The calculated Kaufman's Adaptive Moving Average value.
t3(source, length, volumeFactor)
Calculates the Tilson Moving Average (T3) of a given data series. T3 is a triple-smoothed exponential moving average with improved lag characteristics. Developed by Tim Tillson.
Parameters:
source (series float) : Series of values to process.
length (simple int) : Number of bars for the moving average calculation.
volumeFactor (simple float) : Volume factor affecting responsiveness. Optional. Default is 0.7.
Returns: (float) The calculated Tilson Moving Average value.
ultimateSmoother(source, length)
Calculates the Ultimate Smoother of a given data series. Uses advanced filtering techniques to reduce noise while maintaining responsiveness. Based on digital signal processing principles by John Ehlers.
Parameters:
source (series float) : Series of values to process.
length (simple int) : Number of bars for the smoothing calculation.
Returns: (float) The calculated Ultimate Smoother value.
kalmanFilter(source, processNoise, measurementNoise)
Calculates the Kalman Filter of a given data series. Optimal estimation algorithm that estimates true value from noisy observations. Based on the Kalman Filter algorithm developed by Rudolf Kalman (1960).
Parameters:
source (series float) : Series of values to process.
processNoise (simple float) : Process noise variance (Q). Controls adaptation speed. Optional. Default is 0.05.
measurementNoise (simple float) : Measurement noise variance (R). Controls smoothing. Optional. Default is 1.0.
Returns: (float) The calculated Kalman Filter value.
mcginleyDynamic(source, length)
Calculates the McGinley Dynamic of a given data series. McGinley Dynamic is an adaptive moving average that adjusts to market speed changes. Developed by John R. McGinley Jr.
Parameters:
source (series float) : Series of values to process.
length (simple int) : Number of bars for the dynamic calculation.
Returns: (float) The calculated McGinley Dynamic value.
mama(source, fastLimit, slowLimit)
Calculates the Mesa Adaptive Moving Average (MAMA) of a given data series. MAMA uses Hilbert Transform Discriminator to adapt to market cycles dynamically. Developed by John F. Ehlers.
Parameters:
source (series float) : Series of values to process.
fastLimit (simple float) : Maximum alpha (responsiveness). Optional. Default is 0.5.
slowLimit (simple float) : Minimum alpha (smoothing). Optional. Default is 0.05.
Returns: (float) The calculated Mesa Adaptive Moving Average value.
fama(source, fastLimit, slowLimit)
Calculates the Following Adaptive Moving Average (FAMA) of a given data series. FAMA follows MAMA with reduced responsiveness for crossover signals. Developed by John F. Ehlers.
Parameters:
source (series float) : Series of values to process.
fastLimit (simple float) : Maximum alpha (responsiveness). Optional. Default is 0.5.
slowLimit (simple float) : Minimum alpha (smoothing). Optional. Default is 0.05.
Returns: (float) The calculated Following Adaptive Moving Average value.
mamaFama(source, fastLimit, slowLimit)
Calculates Mesa Adaptive Moving Average (MAMA) and Following Adaptive Moving Average (FAMA).
Parameters:
source (series float) : Series of values to process.
fastLimit (simple float) : Maximum alpha (responsiveness). Optional. Default is 0.5.
slowLimit (simple float) : Minimum alpha (smoothing). Optional. Default is 0.05.
Returns: ( ) Tuple containing values.
laguerreFilter(source, length, gamma, order)
Calculates the standard N-order Laguerre Filter of a given data series. Standard Laguerre Filter uses uniform weighting across all polynomial terms. Developed by John F. Ehlers.
Parameters:
source (series float) : Series of values to process.
length (simple int) : Length for UltimateSmoother preprocessing.
gamma (simple float) : Feedback coefficient (0-1). Lower values reduce lag. Optional. Default is 0.8.
order (simple int) : The order of the Laguerre filter (1-10). Higher order increases lag. Optional. Default is 8.
Returns: (float) The calculated standard Laguerre Filter value.
laguerreBinomialFilter(source, length, gamma)
Calculates the Laguerre Binomial Filter of a given data series. Uses 6-pole feedback with binomial weighting coefficients. Developed by John F. Ehlers.
Parameters:
source (series float) : Series of values to process.
length (simple int) : Length for UltimateSmoother preprocessing.
gamma (simple float) : Feedback coefficient (0-1). Lower values reduce lag. Optional. Default is 0.5.
Returns: (float) The calculated Laguerre Binomial Filter value.
superSmoother(source, length)
Calculates the Super Smoother of a given data series. SuperSmoother is a second-order Butterworth filter from aerospace technology. Developed by John F. Ehlers.
Parameters:
source (series float) : Series of values to process.
length (simple int) : Period for the filter calculation.
Returns: (float) The calculated Super Smoother value.
rangeFilter(source, length, multiplier)
Calculates the Range Filter of a given data series. Range Filter reduces noise by filtering price movements within a dynamic range.
Parameters:
source (series float) : Series of values to process.
length (simple int) : Number of bars for the average range calculation.
multiplier (simple float) : Multiplier for the smooth range. Higher values increase filtering. Optional. Default is 2.618.
Returns: ( ) Tuple containing filtered value, trend direction, upper band, and lower band.
qqe(source, rsiLength, rsiSmooth, qqeFactor)
Calculates the Quantitative Qualitative Estimation (QQE) of a given data series. QQE is an improved RSI that reduces noise and provides smoother signals. Developed by Igor Livshin.
Parameters:
source (series float) : Series of values to process.
rsiLength (simple int) : Number of bars for the RSI calculation. Optional. Default is 14.
rsiSmooth (simple int) : Number of bars for smoothing the RSI. Optional. Default is 5.
qqeFactor (simple float) : QQE factor for volatility band width. Optional. Default is 4.236.
Returns: ( ) Tuple containing smoothed RSI and QQE trend line.
sslChannel(source, length)
Calculates the Semaphore Signal Level (SSL) Channel of a given data series. SSL Channel provides clear trend signals using moving averages of high and low prices.
Parameters:
source (series float) : Series of values to process.
length (simple int) : Number of bars for the moving average calculation.
Returns: ( ) Tuple containing SSL Up and SSL Down lines.
ma(source, length, maType)
Calculates a Moving Average based on the specified type. Universal interface supporting all moving average algorithms.
Parameters:
source (series float) : Series of values to process.
length (simple int) : Number of bars for the moving average calculation.
maType (simple MaType) : Type of moving average to calculate. Optional. Default is SMA.
Returns: (float) The calculated moving average value based on the specified type.
atr(length, maType)
Calculates the Average True Range (ATR) using the specified moving average type. Developed by J. Welles Wilder Jr.
Parameters:
length (simple int) : Number of bars for the ATR calculation.
maType (simple MaType) : Type of moving average to use for smoothing. Optional. Default is RMA.
Returns: (float) The calculated Average True Range value.
macd(source, fastLength, slowLength, signalLength, maType, signalMaType)
Calculates the Moving Average Convergence Divergence (MACD) with customizable MA types. Developed by Gerald Appel.
Parameters:
source (series float) : Series of values to process.
fastLength (simple int) : Period for the fast moving average.
slowLength (simple int) : Period for the slow moving average.
signalLength (simple int) : Period for the signal line moving average.
maType (simple MaType) : Type of moving average for main MACD calculation. Optional. Default is EMA.
signalMaType (simple MaType) : Type of moving average for signal line calculation. Optional. Default is EMA.
Returns: ( ) Tuple containing MACD line, signal line, and histogram values.
dmao(source, fastLength, slowLength, maType)
Calculates the Dual Moving Average Oscillator (DMAO) of a given data series. Uses the same algorithm as the Percentage Price Oscillator (PPO), but can be applied to any data series.
Parameters:
source (series float) : Series of values to process.
fastLength (simple int) : Period for the fast moving average.
slowLength (simple int) : Period for the slow moving average.
maType (simple MaType) : Type of moving average to use for both calculations. Optional. Default is EMA.
Returns: (float) The calculated Dual Moving Average Oscillator value as a percentage.
continuationIndex(source, length, gamma, order)
Calculates the Continuation Index of a given data series. The index represents the Inverse Fisher Transform of the normalized difference between an UltimateSmoother and an N-order Laguerre filter. Developed by John F. Ehlers, published in TASC 2025.09.
Parameters:
source (series float) : Series of values to process.
length (simple int) : The calculation length.
gamma (simple float) : Controls the phase response of the Laguerre filter. Optional. Default is 0.8.
order (simple int) : The order of the Laguerre filter (1-10). Optional. Default is 8.
Returns: (float) The calculated Continuation Index value.
📚 RELEASE NOTES
v1.0 (2025.09.24)
✅ 25+ technical analysis functions
✅ Complete adaptive moving average series (KAMA, FRAMA, MAMA/FAMA)
✅ Advanced signal processing filters (Kalman, Laguerre, SuperSmoother, UltimateSmoother)
✅ Performance optimized with pre-calculated constants and efficient algorithms
✅ Unified function interface design following TradingView best practices
✅ Comprehensive moving average collection (DEMA, TEMA, ZLEMA, T3, etc.)
✅ Volatility and trend detection tools (QQE, SSL Channel, Range Filter)
✅ Continuation Index - Latest research from TASC 2025.09
✅ MACD and ATR calculations supporting multiple moving average types
✅ Dual Moving Average Oscillator (DMAO) for arbitrary data series analysis
Apex Edge – HTF Overlay Candles“Trade your 5m chart with the eyes of the 1H — Apex Edge brings higher-timeframe structure and liquidity sweeps directly onto your execution chart.”
Apex Edge – HTF Overlay Candles
The Apex Edge – HTF Overlay Candles indicator overlays higher-timeframe (HTF) candles directly onto your lower-timeframe chart. Instead of flipping between timeframes, you see HTF structure “breathe” live on your execution chart.
What It Does
• HTF Body Boxes → open/close zones drawn as semi-transparent rectangles.
• HTF Wick Boxes → high/low extremes projected as envelopes around each body.
• Midpoint Line → a dynamic equilibrium line that flips bias as price trades above or below.
• Sweep Arrows → one-time markers showing the first liquidity raid at HTF highs or lows.
Under the Hood
This isn’t just a visual overlay — it’s engineered for accuracy and performance in PineScript.
1. HTF Data Retrieval
• Uses request.security() to import open, high, low, close, time from any selected HTF.
• lookahead=barmerge.lookahead_off ensures OHLC values update bar by bar as the HTF
candle builds.
• When the HTF bar closes, boxes and midpoint lock to historical values — matching the
native HTF chart exactly.
2. Box Construction
• Body box: built from HTF open → close.
• Wick box: built from HTF high → low.
• Boxes extend dynamically across each HTF period, updating in real time, then freeze at
close.
3. Midpoint Logic
• (htfOpen + htfClose) / 2 calculates intrabar midpoint.
• Line drawn edge-to-edge across the active HTF body.
• Style, width, color, and opacity are user-controlled.
4. Sweep Detection
• Flags (sweepedHigh / sweepedLow) prevent clutter: only the first tap per side per HTF
candle is marked.
• Lower-timeframe price breaking the HTF high/low triggers the sweep arrow.
• Arrows are offset above/below wick envelopes for clean visuals.
5. Customisation
• Every layer (body, wick, midpoint, arrows) has independent color + opacity settings.
• Arrow size, arrow color, and transparency are adjustable.
• Default HTF = 1H (perfect for 5m/15m traders) but can be switched to 30m, 4H, Daily,
etc.
Why It’s Useful
• HTF intent + LTF execution without chart hopping.
• Liquidity mapping: see where liquidity is swept in real time.
• Bias clarity: midpoint line defines HTF equilibrium.
• Clean signals: only the first sweep prints — no spam.
What Makes It Different
Most MTF overlays just plot candles or single lines. This tool:
• Splits body vs wick zones for institutional precision.
• Updates live intrabar (no repainting).
• Highlights liquidity sweeps clearly.
• Built for readability and professional use — not another retail signal toy.
Cheat-Sheet Playbook
1️⃣ Structure Bias
• Above midpoint line = bullish intent.
• Below midpoint line = bearish intent.
• Chop around midpoint = no clear direction.
2️⃣ Liquidity Sweeps
• ▲ Green up arrow below wick box = sell-side liquidity taken → watch for longs.
• ▼ Red down arrow above wick box = buy-side liquidity taken → watch for shorts.
• First sweep is the cleanest.
3️⃣ Trade Logic
• Body box = where institutions transact.
• Wick box = liquidity traps.
• Midpoint = bias filter.
• Best setups occur when sweep + midpoint flip align.
4️⃣ Example (5m + 1H Overlay)
1. ▲ Green up arrow prints below HTF wick.
2. Price reclaims the body box.
3. Midpoint flips to support.
4. Enter long → stop below sweep → targets = midpoint first, opposite wick second.
In short:
• Boxes = structure
• Wicks = liquidity pools
• Midpoint = bias line
• Arrows = liquidity sweeps
This is your SMC edge on one chart — HTF structure and liquidity fused directly into your execution timeframe.

ATAI Volume analysis with price action V 1.00ATAI Volume Analysis with Price Action
1. Introduction
1.1 Overview
ATAI Volume Analysis with Price Action is a composite indicator designed for TradingView. It combines per‑side volume data —that is, how much buying and selling occurs during each bar—with standard price‑structure elements such as swings, trend lines and support/resistance. By blending these elements the script aims to help a trader understand which side is in control, whether a breakout is genuine, when markets are potentially exhausted and where liquidity providers might be active.
The indicator is built around TradingView’s up/down volume feed accessed via the TradingView/ta/10 library. The following excerpt from the script illustrates how this feed is configured:
import TradingView/ta/10 as tvta
// Determine lower timeframe string based on user choice and chart resolution
string lower_tf_breakout = use_custom_tf_input ? custom_tf_input :
timeframe.isseconds ? "1S" :
timeframe.isintraday ? "1" :
timeframe.isdaily ? "5" : "60"
// Request up/down volume (both positive)
= tvta.requestUpAndDownVolume(lower_tf_breakout)
Lower‑timeframe selection. If you do not specify a custom lower timeframe, the script chooses a default based on your chart resolution: 1 second for second charts, 1 minute for intraday charts, 5 minutes for daily charts and 60 minutes for anything longer. Smaller intervals provide a more precise view of buyer and seller flow but cover fewer bars. Larger intervals cover more history at the cost of granularity.
Tick vs. time bars. Many trading platforms offer a tick / intrabar calculation mode that updates an indicator on every trade rather than only on bar close. Turning on one‑tick calculation will give the most accurate split between buy and sell volume on the current bar, but it typically reduces the amount of historical data available. For the highest fidelity in live trading you can enable this mode; for studying longer histories you might prefer to disable it. When volume data is completely unavailable (some instruments and crypto pairs), all modules that rely on it will remain silent and only the price‑structure backbone will operate.
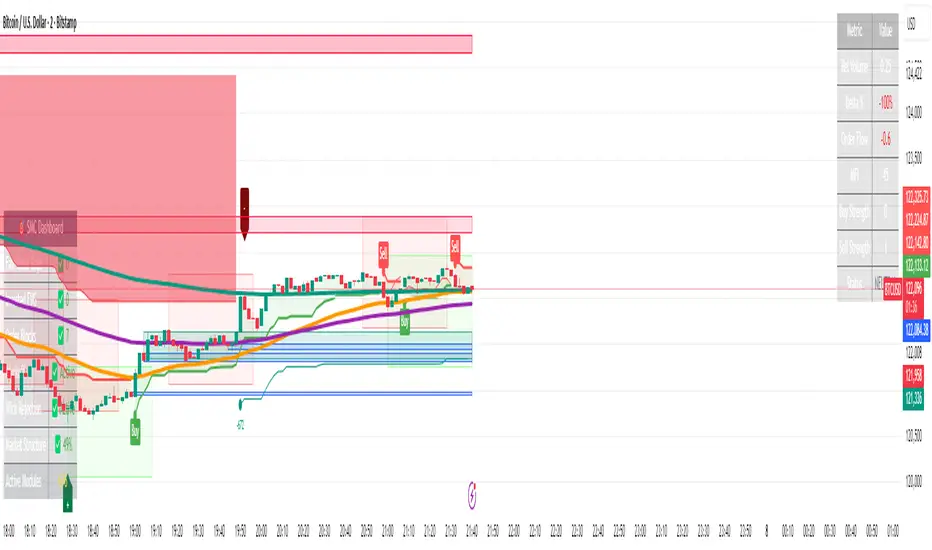
Figure caption, Each panel shows the indicator’s info table for a different volume sampling interval. In the left chart, the parentheses “(5)” beside the buy‑volume figure denote that the script is aggregating volume over five‑minute bars; the center chart uses “(1)” for one‑minute bars; and the right chart uses “(1T)” for a one‑tick interval. These notations tell you which lower timeframe is driving the volume calculations. Shorter intervals such as 1 minute or 1 tick provide finer detail on buyer and seller flow, but they cover fewer bars; longer intervals like five‑minute bars smooth the data and give more history.
Figure caption, The values in parentheses inside the info table come directly from the Breakout — Settings. The first row shows the custom lower-timeframe used for volume calculations (e.g., “(1)”, “(5)”, or “(1T)”)
2. Price‑Structure Backbone
Even without volume, the indicator draws structural features that underpin all other modules. These features are always on and serve as the reference levels for subsequent calculations.
2.1 What it draws
• Pivots: Swing highs and lows are detected using the pivot_left_input and pivot_right_input settings. A pivot high is identified when the high recorded pivot_right_input bars ago exceeds the highs of the preceding pivot_left_input bars and is also higher than (or equal to) the highs of the subsequent pivot_right_input bars; pivot lows follow the inverse logic. The indicator retains only a fixed number of such pivot points per side, as defined by point_count_input, discarding the oldest ones when the limit is exceeded.
• Trend lines: For each side, the indicator connects the earliest stored pivot and the most recent pivot (oldest high to newest high, and oldest low to newest low). When a new pivot is added or an old one drops out of the lookback window, the line’s endpoints—and therefore its slope—are recalculated accordingly.
• Horizontal support/resistance: The highest high and lowest low within the lookback window defined by length_input are plotted as horizontal dashed lines. These serve as short‑term support and resistance levels.
• Ranked labels: If showPivotLabels is enabled the indicator prints labels such as “HH1”, “HH2”, “LL1” and “LL2” near each pivot. The ranking is determined by comparing the price of each stored pivot: HH1 is the highest high, HH2 is the second highest, and so on; LL1 is the lowest low, LL2 is the second lowest. In the case of equal prices the newer pivot gets the better rank. Labels are offset from price using ½ × ATR × label_atr_multiplier, with the ATR length defined by label_atr_len_input. A dotted connector links each label to the candle’s wick.
2.2 Key settings
• length_input: Window length for finding the highest and lowest values and for determining trend line endpoints. A larger value considers more history and will generate longer trend lines and S/R levels.
• pivot_left_input, pivot_right_input: Strictness of swing confirmation. Higher values require more bars on either side to form a pivot; lower values create more pivots but may include minor swings.
• point_count_input: How many pivots are kept in memory on each side. When new pivots exceed this number the oldest ones are discarded.
• label_atr_len_input and label_atr_multiplier: Determine how far pivot labels are offset from the bar using ATR. Increasing the multiplier moves labels further away from price.
• Styling inputs for trend lines, horizontal lines and labels (color, width and line style).
Figure caption, The chart illustrates how the indicator’s price‑structure backbone operates. In this daily example, the script scans for bars where the high (or low) pivot_right_input bars back is higher (or lower) than the preceding pivot_left_input bars and higher or lower than the subsequent pivot_right_input bars; only those bars are marked as pivots.
These pivot points are stored and ranked: the highest high is labelled “HH1”, the second‑highest “HH2”, and so on, while lows are marked “LL1”, “LL2”, etc. Each label is offset from the price by half of an ATR‑based distance to keep the chart clear, and a dotted connector links the label to the actual candle.
The red diagonal line connects the earliest and latest stored high pivots, and the green line does the same for low pivots; when a new pivot is added or an old one drops out of the lookback window, the end‑points and slopes adjust accordingly. Dashed horizontal lines mark the highest high and lowest low within the current lookback window, providing visual support and resistance levels. Together, these elements form the structural backbone that other modules reference, even when volume data is unavailable.
3. Breakout Module
3.1 Concept
This module confirms that a price break beyond a recent high or low is supported by a genuine shift in buying or selling pressure. It requires price to clear the highest high (“HH1”) or lowest low (“LL1”) and, simultaneously, that the winning side shows a significant volume spike, dominance and ranking. Only when all volume and price conditions pass is a breakout labelled.
3.2 Inputs
• lookback_break_input : This controls the number of bars used to compute moving averages and percentiles for volume. A larger value smooths the averages and percentiles but makes the indicator respond more slowly.
• vol_mult_input : The “spike” multiplier; the current buy or sell volume must be at least this multiple of its moving average over the lookback window to qualify as a breakout.
• rank_threshold_input (0–100) : Defines a volume percentile cutoff: the current buyer/seller volume must be in the top (100−threshold)%(100−threshold)% of all volumes within the lookback window. For example, if set to 80, the current volume must be in the top 20 % of the lookback distribution.
• ratio_threshold_input (0–1) : Specifies the minimum share of total volume that the buyer (for a bullish breakout) or seller (for bearish) must hold on the current bar; the code also requires that the cumulative buyer volume over the lookback window exceeds the seller volume (and vice versa for bearish cases).
• use_custom_tf_input / custom_tf_input : When enabled, these inputs override the automatic choice of lower timeframe for up/down volume; otherwise the script selects a sensible default based on the chart’s timeframe.
• Label appearance settings : Separate options control the ATR-based offset length, offset multiplier, label size and colors for bullish and bearish breakout labels, as well as the connector style and width.
3.3 Detection logic
1. Data preparation : Retrieve per‑side volume from the lower timeframe and take absolute values. Build rolling arrays of the last lookback_break_input values to compute simple moving averages (SMAs), cumulative sums and percentile ranks for buy and sell volume.
2. Volume spike: A spike is flagged when the current buy (or, in the bearish case, sell) volume is at least vol_mult_input times its SMA over the lookback window.
3. Dominance test: The buyer’s (or seller’s) share of total volume on the current bar must meet or exceed ratio_threshold_input. In addition, the cumulative sum of buyer volume over the window must exceed the cumulative sum of seller volume for a bullish breakout (and vice versa for bearish). A separate requirement checks the sign of delta: for bullish breakouts delta_breakout must be non‑negative; for bearish breakouts it must be non‑positive.
4. Percentile rank: The current volume must fall within the top (100 – rank_threshold_input) percent of the lookback distribution—ensuring that the spike is unusually large relative to recent history.
5. Price test: For a bullish signal, the closing price must close above the highest pivot (HH1); for a bearish signal, the close must be below the lowest pivot (LL1).
6. Labeling: When all conditions above are satisfied, the indicator prints “Breakout ↑” above the bar (bullish) or “Breakout ↓” below the bar (bearish). Labels are offset using half of an ATR‑based distance and linked to the candle with a dotted connector.
Figure caption, (Breakout ↑ example) , On this daily chart, price pushes above the red trendline and the highest prior pivot (HH1). The indicator recognizes this as a valid breakout because the buyer‑side volume on the lower timeframe spikes above its recent moving average and buyers dominate the volume statistics over the lookback period; when combined with a close above HH1, this satisfies the breakout conditions. The “Breakout ↑” label appears above the candle, and the info table highlights that up‑volume is elevated relative to its 11‑bar average, buyer share exceeds the dominance threshold and money‑flow metrics support the move.
Figure caption, In this daily example, price breaks below the lowest pivot (LL1) and the lower green trendline. The indicator identifies this as a bearish breakout because sell‑side volume is sharply elevated—about twice its 11‑bar average—and sellers dominate both the bar and the lookback window. With the close falling below LL1, the script triggers a Breakout ↓ label and marks the corresponding row in the info table, which shows strong down volume, negative delta and a seller share comfortably above the dominance threshold.
4. Market Phase Module (Volume Only)
4.1 Concept
Not all markets trend; many cycle between periods of accumulation (buying pressure building up), distribution (selling pressure dominating) and neutral behavior. This module classifies the current bar into one of these phases without using ATR , relying solely on buyer and seller volume statistics. It looks at net flows, ratio changes and an OBV‑like cumulative line with dual‑reference (1‑ and 2‑bar) trends. The result is displayed both as on‑chart labels and in a dedicated row of the info table.
4.2 Inputs
• phase_period_len: Number of bars over which to compute sums and ratios for phase detection.
• phase_ratio_thresh : Minimum buyer share (for accumulation) or minimum seller share (for distribution, derived as 1 − phase_ratio_thresh) of the total volume.
• strict_mode: When enabled, both the 1‑bar and 2‑bar changes in each statistic must agree on the direction (strict confirmation); when disabled, only one of the two references needs to agree (looser confirmation).
• Color customisation for info table cells and label styling for accumulation and distribution phases, including ATR length, multiplier, label size, colors and connector styles.
• show_phase_module: Toggles the entire phase detection subsystem.
• show_phase_labels: Controls whether on‑chart labels are drawn when accumulation or distribution is detected.
4.3 Detection logic
The module computes three families of statistics over the volume window defined by phase_period_len:
1. Net sum (buyers minus sellers): net_sum_phase = Σ(buy) − Σ(sell). A positive value indicates a predominance of buyers. The code also computes the differences between the current value and the values 1 and 2 bars ago (d_net_1, d_net_2) to derive up/down trends.
2. Buyer ratio: The instantaneous ratio TF_buy_breakout / TF_tot_breakout and the window ratio Σ(buy) / Σ(total). The current ratio must exceed phase_ratio_thresh for accumulation or fall below 1 − phase_ratio_thresh for distribution. The first and second differences of the window ratio (d_ratio_1, d_ratio_2) determine trend direction.
3. OBV‑like cumulative net flow: An on‑balance volume analogue obv_net_phase increments by TF_buy_breakout − TF_sell_breakout each bar. Its differences over the last 1 and 2 bars (d_obv_1, d_obv_2) provide trend clues.
The algorithm then combines these signals:
• For strict mode , accumulation requires: (a) current ratio ≥ threshold, (b) cumulative ratio ≥ threshold, (c) both ratio differences ≥ 0, (d) net sum differences ≥ 0, and (e) OBV differences ≥ 0. Distribution is the mirror case.
• For loose mode , it relaxes the directional tests: either the 1‑ or the 2‑bar difference needs to agree in each category.
If all conditions for accumulation are satisfied, the phase is labelled “Accumulation” ; if all conditions for distribution are satisfied, it’s labelled “Distribution” ; otherwise the phase is “Neutral” .
4.4 Outputs
• Info table row : Row 8 displays “Market Phase (Vol)” on the left and the detected phase (Accumulation, Distribution or Neutral) on the right. The text colour of both cells matches a user‑selectable palette (typically green for accumulation, red for distribution and grey for neutral).
• On‑chart labels : When show_phase_labels is enabled and a phase persists for at least one bar, the module prints a label above the bar ( “Accum” ) or below the bar ( “Dist” ) with a dashed or dotted connector. The label is offset using ATR based on phase_label_atr_len_input and phase_label_multiplier and is styled according to user preferences.
Figure caption, The chart displays a red “Dist” label above a particular bar, indicating that the accumulation/distribution module identified a distribution phase at that point. The detection is based on seller dominance: during that bar, the net buyer-minus-seller flow and the OBV‑style cumulative flow were trending down, and the buyer ratio had dropped below the preset threshold. These conditions satisfy the distribution criteria in strict mode. The label is placed above the bar using an ATR‑based offset and a dashed connector. By the time of the current bar in the screenshot, the phase indicator shows “Neutral” in the info table—signaling that neither accumulation nor distribution conditions are currently met—yet the historical “Dist” label remains to mark where the prior distribution phase began.
Figure caption, In this example the market phase module has signaled an Accumulation phase. Three bars before the current candle, the algorithm detected a shift toward buyers: up‑volume exceeded its moving average, down‑volume was below average, and the buyer share of total volume climbed above the threshold while the on‑balance net flow and cumulative ratios were trending upwards. The blue “Accum” label anchored below that bar marks the start of the phase; it remains on the chart because successive bars continue to satisfy the accumulation conditions. The info table confirms this: the “Market Phase (Vol)” row still reads Accumulation, and the ratio and sum rows show buyers dominating both on the current bar and across the lookback window.
5. OB/OS Spike Module
5.1 What overbought/oversold means here
In many markets, a rapid extension up or down is often followed by a period of consolidation or reversal. The indicator interprets overbought (OB) conditions as abnormally strong selling risk at or after a price rally and oversold (OS) conditions as unusually strong buying risk after a decline. Importantly, these are not direct trade signals; rather they flag areas where caution or contrarian setups may be appropriate.
5.2 Inputs
• minHits_obos (1–7): Minimum number of oscillators that must agree on an overbought or oversold condition for a label to print.
• syncWin_obos: Length of a small sliding window over which oscillator votes are smoothed by taking the maximum count observed. This helps filter out choppy signals.
• Volume spike criteria: kVolRatio_obos (ratio of current volume to its SMA) and zVolThr_obos (Z‑score threshold) across volLen_obos. Either threshold can trigger a spike.
• Oscillator toggles and periods: Each of RSI, Stochastic (K and D), Williams %R, CCI, MFI, DeMarker and Stochastic RSI can be independently enabled; their periods are adjustable.
• Label appearance: ATR‑based offset, size, colors for OB and OS labels, plus connector style and width.
5.3 Detection logic
1. Directional volume spikes: Volume spikes are computed separately for buyer and seller volumes. A sell volume spike (sellVolSpike) flags a potential OverBought bar, while a buy volume spike (buyVolSpike) flags a potential OverSold bar. A spike occurs when the respective volume exceeds kVolRatio_obos times its simple moving average over the window or when its Z‑score exceeds zVolThr_obos.
2. Oscillator votes: For each enabled oscillator, calculate its overbought and oversold state using standard thresholds (e.g., RSI ≥ 70 for OB and ≤ 30 for OS; Stochastic %K/%D ≥ 80 for OB and ≤ 20 for OS; etc.). Count how many oscillators vote for OB and how many vote for OS.
3. Minimum hits: Apply the smoothing window syncWin_obos to the vote counts using a maximum‑of‑last‑N approach. A candidate bar is only considered if the smoothed OB hit count ≥ minHits_obos (for OverBought) or the smoothed OS hit count ≥ minHits_obos (for OverSold).
4. Tie‑breaking: If both OverBought and OverSold spike conditions are present on the same bar, compare the smoothed hit counts: the side with the higher count is selected; ties default to OverBought.
5. Label printing: When conditions are met, the bar is labelled as “OverBought X/7” above the candle or “OverSold X/7” below it. “X” is the number of oscillators confirming, and the bracket lists the abbreviations of contributing oscillators. Labels are offset from price using half of an ATR‑scaled distance and can optionally include a dotted or dashed connector line.
Figure caption, In this chart the overbought/oversold module has flagged an OverSold signal. A sell‑off from the prior highs brought price down to the lower trend‑line, where the bar marked “OverSold 3/7 DeM” appears. This label indicates that on that bar the module detected a buy‑side volume spike and that at least three of the seven enabled oscillators—in this case including the DeMarker—were in oversold territory. The label is printed below the candle with a dotted connector, signaling that the market may be temporarily exhausted on the downside. After this oversold print, price begins to rebound towards the upper red trend‑line and higher pivot levels.
Figure caption, This example shows the overbought/oversold module in action. In the left‑hand panel you can see the OB/OS settings where each oscillator (RSI, Stochastic, Williams %R, CCI, MFI, DeMarker and Stochastic RSI) can be enabled or disabled, and the ATR length and label offset multiplier adjusted. On the chart itself, price has pushed up to the descending red trendline and triggered an “OverBought 3/7” label. That means the sell‑side volume spiked relative to its average and three out of the seven enabled oscillators were in overbought territory. The label is offset above the candle by half of an ATR and connected with a dashed line, signaling that upside momentum may be overextended and a pause or pullback could follow.
6. Buyer/Seller Trap Module
6.1 Concept
A bull trap occurs when price appears to break above resistance, attracting buyers, but fails to sustain the move and quickly reverses, leaving a long upper wick and trapping late entrants. A bear trap is the opposite: price breaks below support, lures in sellers, then snaps back, leaving a long lower wick and trapping shorts. This module detects such traps by looking for price structure sweeps, order‑flow mismatches and dominance reversals. It uses a scoring system to differentiate risk from confirmed traps.
6.2 Inputs
• trap_lookback_len: Window length used to rank extremes and detect sweeps.
• trap_wick_threshold: Minimum proportion of a bar’s range that must be wick (upper for bull traps, lower for bear traps) to qualify as a sweep.
• trap_score_risk: Minimum aggregated score required to flag a trap risk. (The code defines a trap_score_confirm input, but confirmation is actually based on price reversal rather than a separate score threshold.)
• trap_confirm_bars: Maximum number of bars allowed for price to reverse and confirm the trap. If price does not reverse in this window, the risk label will expire or remain unconfirmed.
• Label settings: ATR length and multiplier for offsetting, size, colours for risk and confirmed labels, and connector style and width. Separate settings exist for bull and bear traps.
• Toggle inputs: show_trap_module and show_trap_labels enable the module and control whether labels are drawn on the chart.
6.3 Scoring logic
The module assigns points to several conditions and sums them to determine whether a trap risk is present. For bull traps, the score is built from the following (bear traps mirror the logic with highs and lows swapped):
1. Sweep (2 points): Price trades above the high pivot (HH1) but fails to close above it and leaves a long upper wick at least trap_wick_threshold × range. For bear traps, price dips below the low pivot (LL1), fails to close below and leaves a long lower wick.
2. Close break (1 point): Price closes beyond HH1 or LL1 without leaving a long wick.
3. Candle/delta mismatch (2 points): The candle closes bullish yet the order flow delta is negative or the seller ratio exceeds 50%, indicating hidden supply. Conversely, a bearish close with positive delta or buyer dominance suggests hidden demand.
4. Dominance inversion (2 points): The current bar’s buyer volume has the highest rank in the lookback window while cumulative sums favor sellers, or vice versa.
5. Low‑volume break (1 point): Price crosses the pivot but total volume is below its moving average.
The total score for each side is compared to trap_score_risk. If the score is high enough, a “Bull Trap Risk” or “Bear Trap Risk” label is drawn, offset from the candle by half of an ATR‑scaled distance using a dashed outline. If, within trap_confirm_bars, price reverses beyond the opposite level—drops back below the high pivot for bull traps or rises above the low pivot for bear traps—the label is upgraded to a solid “Bull Trap” or “Bear Trap” . In this version of the code, there is no separate score threshold for confirmation: the variable trap_score_confirm is unused; confirmation depends solely on a successful price reversal within the specified number of bars.
Figure caption, In this example the trap module has flagged a Bear Trap Risk. Price initially breaks below the most recent low pivot (LL1), but the bar closes back above that level and leaves a long lower wick, suggesting a failed push lower. Combined with a mismatch between the candle direction and the order flow (buyers regain control) and a reversal in volume dominance, the aggregate score exceeds the risk threshold, so a dashed “Bear Trap Risk” label prints beneath the bar. The green and red trend lines mark the current low and high pivot trajectories, while the horizontal dashed lines show the highest and lowest values in the lookback window. If, within the next few bars, price closes decisively above the support, the risk label would upgrade to a solid “Bear Trap” label.
Figure caption, In this example the trap module has identified both ends of a price range. Near the highs, price briefly pushes above the descending red trendline and the recent pivot high, but fails to close there and leaves a noticeable upper wick. That combination of a sweep above resistance and order‑flow mismatch generates a Bull Trap Risk label with a dashed outline, warning that the upside break may not hold. At the opposite extreme, price later dips below the green trendline and the labelled low pivot, then quickly snaps back and closes higher. The long lower wick and subsequent price reversal upgrade the previous bear‑trap risk into a confirmed Bear Trap (solid label), indicating that sellers were caught on a false breakdown. Horizontal dashed lines mark the highest high and lowest low of the lookback window, while the red and green diagonals connect the earliest and latest pivot highs and lows to visualize the range.
7. Sharp Move Module
7.1 Concept
Markets sometimes display absorption or climax behavior—periods when one side steadily gains the upper hand before price breaks out with a sharp move. This module evaluates several order‑flow and volume conditions to anticipate such moves. Users can choose how many conditions must be met to flag a risk and how many (plus a price break) are required for confirmation.
7.2 Inputs
• sharp Lookback: Number of bars in the window used to compute moving averages, sums, percentile ranks and reference levels.
• sharpPercentile: Minimum percentile rank for the current side’s volume; the current buy (or sell) volume must be greater than or equal to this percentile of historical volumes over the lookback window.
• sharpVolMult: Multiplier used in the volume climax check. The current side’s volume must exceed this multiple of its average to count as a climax.
• sharpRatioThr: Minimum dominance ratio (current side’s volume relative to the opposite side) used in both the instant and cumulative dominance checks.
• sharpChurnThr: Maximum ratio of a bar’s range to its ATR for absorption/churn detection; lower values indicate more absorption (large volume in a small range).
• sharpScoreRisk: Minimum number of conditions that must be true to print a risk label.
• sharpScoreConfirm: Minimum number of conditions plus a price break required for confirmation.
• sharpCvdThr: Threshold for cumulative delta divergence versus price change (positive for bullish accumulation, negative for bearish distribution).
• Label settings: ATR length (sharpATRlen) and multiplier (sharpLabelMult) for positioning labels, label size, colors and connector styles for bullish and bearish sharp moves.
• Toggles: enableSharp activates the module; show_sharp_labels controls whether labels are drawn.
7.3 Conditions (six per side)
For each side, the indicator computes six boolean conditions and sums them to form a score:
1. Dominance (instant and cumulative):
– Instant dominance: current buy volume ≥ sharpRatioThr × current sell volume.
– Cumulative dominance: sum of buy volumes over the window ≥ sharpRatioThr × sum of sell volumes (and vice versa for bearish checks).
2. Accumulation/Distribution divergence: Over the lookback window, cumulative delta rises by at least sharpCvdThr while price fails to rise (bullish), or cumulative delta falls by at least sharpCvdThr while price fails to fall (bearish).
3. Volume climax: The current side’s volume is ≥ sharpVolMult × its average and the product of volume and bar range is the highest in the lookback window.
4. Absorption/Churn: The current side’s volume divided by the bar’s range equals the highest value in the window and the bar’s range divided by ATR ≤ sharpChurnThr (indicating large volume within a small range).
5. Percentile rank: The current side’s volume percentile rank is ≥ sharp Percentile.
6. Mirror logic for sellers: The above checks are repeated with buyer and seller roles swapped and the price break levels reversed.
Each condition that passes contributes one point to the corresponding side’s score (0 or 1). Risk and confirmation thresholds are then applied to these scores.
7.4 Scoring and labels
• Risk: If scoreBull ≥ sharpScoreRisk, a “Sharp ↑ Risk” label is drawn above the bar. If scoreBear ≥ sharpScoreRisk, a “Sharp ↓ Risk” label is drawn below the bar.
• Confirmation: A risk label is upgraded to “Sharp ↑” when scoreBull ≥ sharpScoreConfirm and the bar closes above the highest recent pivot (HH1); for bearish cases, confirmation requires scoreBear ≥ sharpScoreConfirm and a close below the lowest pivot (LL1).
• Label positioning: Labels are offset from the candle by ATR × sharpLabelMult (full ATR times multiplier), not half, and may include a dashed or dotted connector line if enabled.
Figure caption, In this chart both bullish and bearish sharp‑move setups have been flagged. Earlier in the range, a “Sharp ↓ Risk” label appears beneath a candle: the sell‑side score met the risk threshold, signaling that the combination of strong sell volume, dominance and absorption within a narrow range suggested a potential sharp decline. The price did not close below the lower pivot, so this label remains a “risk” and no confirmation occurred. Later, as the market recovered and volume shifted back to the buy side, a “Sharp ↑ Risk” label prints above a candle near the top of the channel. Here, buy‑side dominance, cumulative delta divergence and a volume climax aligned, but price has not yet closed above the upper pivot (HH1), so the alert is still a risk rather than a confirmed sharp‑up move.
Figure caption, In this chart a Sharp ↑ label is displayed above a candle, indicating that the sharp move module has confirmed a bullish breakout. Prior bars satisfied the risk threshold — showing buy‑side dominance, positive cumulative delta divergence, a volume climax and strong absorption in a narrow range — and this candle closes above the highest recent pivot, upgrading the earlier “Sharp ↑ Risk” alert to a full Sharp ↑ signal. The green label is offset from the candle with a dashed connector, while the red and green trend lines trace the high and low pivot trajectories and the dashed horizontals mark the highest and lowest values of the lookback window.
8. Market‑Maker / Spread‑Capture Module
8.1 Concept
Liquidity providers often “capture the spread” by buying and selling in almost equal amounts within a very narrow price range. These bars can signal temporary congestion before a move or reflect algorithmic activity. This module flags bars where both buyer and seller volumes are high, the price range is only a few ticks and the buy/sell split remains close to 50%. It helps traders spot potential liquidity pockets.
8.2 Inputs
• scalpLookback: Window length used to compute volume averages.
• scalpVolMult: Multiplier applied to each side’s average volume; both buy and sell volumes must exceed this multiple.
• scalpTickCount: Maximum allowed number of ticks in a bar’s range (calculated as (high − low) / minTick). A value of 1 or 2 captures ultra‑small bars; increasing it relaxes the range requirement.
• scalpDeltaRatio: Maximum deviation from a perfect 50/50 split. For example, 0.05 means the buyer share must be between 45% and 55%.
• Label settings: ATR length, multiplier, size, colors, connector style and width.
• Toggles : show_scalp_module and show_scalp_labels to enable the module and its labels.
8.3 Signal
When, on the current bar, both TF_buy_breakout and TF_sell_breakout exceed scalpVolMult times their respective averages and (high − low)/minTick ≤ scalpTickCount and the buyer share is within scalpDeltaRatio of 50%, the module prints a “Spread ↔” label above the bar. The label uses the same ATR offset logic as other modules and draws a connector if enabled.
Figure caption, In this chart the spread‑capture module has identified a potential liquidity pocket. Buyer and seller volumes both spiked above their recent averages, yet the candle’s range measured only a couple of ticks and the buy/sell split stayed close to 50 %. This combination met the module’s criteria, so it printed a grey “Spread ↔” label above the bar. The red and green trend lines link the earliest and latest high and low pivots, and the dashed horizontals mark the highest high and lowest low within the current lookback window.
9. Money Flow Module
9.1 Concept
To translate volume into a monetary measure, this module multiplies each side’s volume by the closing price. It tracks buying and selling system money default currency on a per-bar basis and sums them over a chosen period. The difference between buy and sell currencies (Δ$) shows net inflow or outflow.
9.2 Inputs
• mf_period_len_mf: Number of bars used for summing buy and sell dollars.
• Label appearance settings: ATR length, multiplier, size, colors for up/down labels, and connector style and width.
• Toggles: Use enableMoneyFlowLabel_mf and showMFLabels to control whether the module and its labels are displayed.
9.3 Calculations
• Per-bar money: Buy $ = TF_buy_breakout × close; Sell $ = TF_sell_breakout × close. Their difference is Δ$ = Buy $ − Sell $.
• Summations: Over mf_period_len_mf bars, compute Σ Buy $, Σ Sell $ and ΣΔ$ using math.sum().
• Info table entries: Rows 9–13 display these values as texts like “↑ USD 1234 (1M)” or “ΣΔ USD −5678 (14)”, with colors reflecting whether buyers or sellers dominate.
• Money flow status: If Δ$ is positive the bar is marked “Money flow in” ; if negative, “Money flow out” ; if zero, “Neutral”. The cumulative status is similarly derived from ΣΔ.Labels print at the bar that changes the sign of ΣΔ, offset using ATR × label multiplier and styled per user preferences.
Figure caption, The chart illustrates a steady rise toward the highest recent pivot (HH1) with price riding between a rising green trend‑line and a red trend‑line drawn through earlier pivot highs. A green Money flow in label appears above the bar near the top of the channel, signaling that net dollar flow turned positive on this bar: buy‑side dollar volume exceeded sell‑side dollar volume, pushing the cumulative sum ΣΔ$ above zero. In the info table, the “Money flow (bar)” and “Money flow Σ” rows both read In, confirming that the indicator’s money‑flow module has detected an inflow at both bar and aggregate levels, while other modules (pivots, trend lines and support/resistance) remain active to provide structural context.
In this example the Money Flow module signals a net outflow. Price has been trending downward: successive high pivots form a falling red trend‑line and the low pivots form a descending green support line. When the latest bar broke below the previous low pivot (LL1), both the bar‑level and cumulative net dollar flow turned negative—selling volume at the close exceeded buying volume and pushed the cumulative Δ$ below zero. The module reacts by printing a red “Money flow out” label beneath the candle; the info table confirms that the “Money flow (bar)” and “Money flow Σ” rows both show Out, indicating sustained dominance of sellers in this period.
10. Info Table
10.1 Purpose
When enabled, the Info Table appears in the lower right of your chart. It summarises key values computed by the indicator—such as buy and sell volume, delta, total volume, breakout status, market phase, and money flow—so you can see at a glance which side is dominant and which signals are active.
10.2 Symbols
• ↑ / ↓ — Up (↑) denotes buy volume or money; down (↓) denotes sell volume or money.
• MA — Moving average. In the table it shows the average value of a series over the lookback period.
• Σ (Sigma) — Cumulative sum over the chosen lookback period.
• Δ (Delta) — Difference between buy and sell values.
• B / S — Buyer and seller share of total volume, expressed as percentages.
• Ref. Price — Reference price for breakout calculations, based on the latest pivot.
• Status — Indicates whether a breakout condition is currently active (True) or has failed.
10.3 Row definitions
1. Up volume / MA up volume – Displays current buy volume on the lower timeframe and its moving average over the lookback period.
2. Down volume / MA down volume – Shows current sell volume and its moving average; sell values are formatted in red for clarity.
3. Δ / ΣΔ – Lists the difference between buy and sell volume for the current bar and the cumulative delta volume over the lookback period.
4. Σ / MA Σ (Vol/MA) – Total volume (buy + sell) for the bar, with the ratio of this volume to its moving average; the right cell shows the average total volume.
5. B/S ratio – Buy and sell share of the total volume: current bar percentages and the average percentages across the lookback period.
6. Buyer Rank / Seller Rank – Ranks the bar’s buy and sell volumes among the last (n) bars; lower rank numbers indicate higher relative volume.
7. Σ Buy / Σ Sell – Sum of buy and sell volumes over the lookback window, indicating which side has traded more.
8. Breakout UP / DOWN – Shows the breakout thresholds (Ref. Price) and whether the breakout condition is active (True) or has failed.
9. Market Phase (Vol) – Reports the current volume‑only phase: Accumulation, Distribution or Neutral.
10. Money Flow – The final rows display dollar amounts and status:
– ↑ USD / Σ↑ USD – Buy dollars for the current bar and the cumulative sum over the money‑flow period.
– ↓ USD / Σ↓ USD – Sell dollars and their cumulative sum.
– Δ USD / ΣΔ USD – Net dollar difference (buy minus sell) for the bar and cumulatively.
– Money flow (bar) – Indicates whether the bar’s net dollar flow is positive (In), negative (Out) or neutral.
– Money flow Σ – Shows whether the cumulative net dollar flow across the chosen period is positive, negative or neutral.
The chart above shows a sequence of different signals from the indicator. A Bull Trap Risk appears after price briefly pushes above resistance but fails to hold, then a green Accum label identifies an accumulation phase. An upward breakout follows, confirmed by a Money flow in print. Later, a Sharp ↓ Risk warns of a possible sharp downturn; after price dips below support but quickly recovers, a Bear Trap label marks a false breakdown. The highlighted info table in the center summarizes key metrics at that moment, including current and average buy/sell volumes, net delta, total volume versus its moving average, breakout status (up and down), market phase (volume), and bar‑level and cumulative money flow (In/Out).
11. Conclusion & Final Remarks
This indicator was developed as a holistic study of market structure and order flow. It brings together several well‑known concepts from technical analysis—breakouts, accumulation and distribution phases, overbought and oversold extremes, bull and bear traps, sharp directional moves, market‑maker spread bars and money flow—into a single Pine Script tool. Each module is based on widely recognized trading ideas and was implemented after consulting reference materials and example strategies, so you can see in real time how these concepts interact on your chart.
A distinctive feature of this indicator is its reliance on per‑side volume: instead of tallying only total volume, it separately measures buy and sell transactions on a lower time frame. This approach gives a clearer view of who is in control—buyers or sellers—and helps filter breakouts, detect phases of accumulation or distribution, recognize potential traps, anticipate sharp moves and gauge whether liquidity providers are active. The money‑flow module extends this analysis by converting volume into currency values and tracking net inflow or outflow across a chosen window.
Although comprehensive, this indicator is intended solely as a guide. It highlights conditions and statistics that many traders find useful, but it does not generate trading signals or guarantee results. Ultimately, you remain responsible for your positions. Use the information presented here to inform your analysis, combine it with other tools and risk‑management techniques, and always make your own decisions when trading.
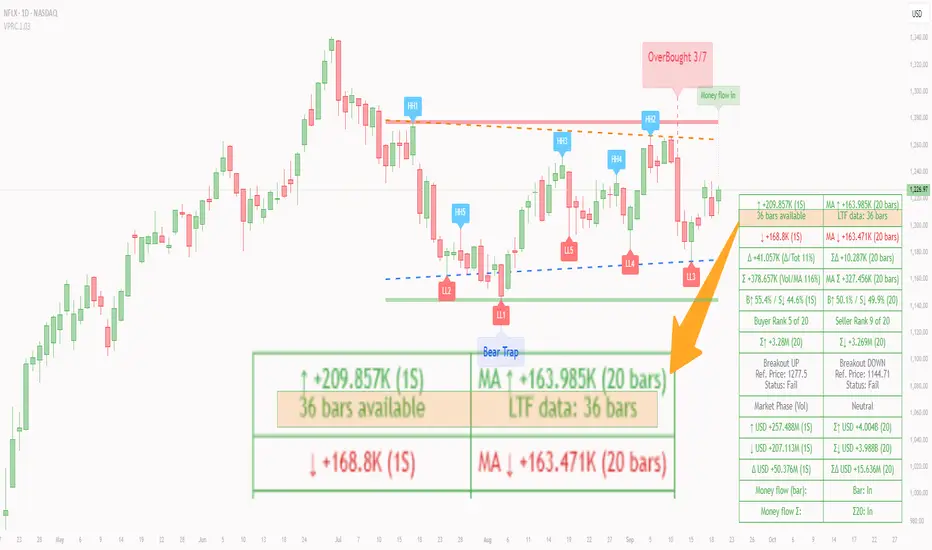
FlowScope [Hapharmonic]FlowScope: Uncover the Market's True Intent 🔬
Ever wished you could look inside the candles and see where the real action is happening? FlowScope is your microscope for the market's flow, designed to give you a powerful edge by revealing the volume distribution that price action alone can't show you.
Instead of just looking at the open, high, low, and close, FlowScope lets you dive deeper into the market's auction process. It groups candles together and builds a detailed Volume Profile for that period, showing you exactly where the trading happened and revealing the story behind the price action.
Let's explore how you can use it to gain a powerful new edge.
🧐 Core Concept: How It Works
At its heart, FlowScope does three key things:
It Groups Candles: You decide how many candles to group together. For example, setting " Group Candles " to 4 on a 5-minute chart effectively gives you a detailed 20-minute candle and profile. This helps you see the bigger picture and filter out market noise.
It Builds a Volume Profile: For each group, FlowScope analyzes the volume at every single price level. It then displays this as a horizontal histogram (we call this a "footprint" or profile). Longer bars mean more volume was traded at that price, indicating a "fair" price or an area of acceptance. Shorter bars mean price moved through quickly, indicating rejection.
It Creates a Custom "Grouped Candle": To summarize the group's overall price action, FlowScope draws a single, custom candle representing the entire group's:
Open: The open of the first candle in the group.
High: The absolute highest price reached within the group.
Low: The absolute lowest price reached within the group.
Close: The close of the last candle in the group.
This gives you a crystal-clear view of the group's net result, free from the back-and-forth noise of the individual candles inside it.
Below are some of the stunning preset color palettes you can choose from to customize your view:
🚀 How to Use: Practical Applications
FlowScope isn't just for looking pretty; it's a powerful analysis tool. Here are a few ways to integrate it into your trading:
Identify High-Volume Nodes (HVNs): Look for the longest bars in the profile. These are price levels where the market spent the most time and traded the most volume. HVNs often act as powerful "magnets" for price, becoming key areas of support and resistance.
Spot Low-Volume Nodes (LVNs): These are areas with very short bars or gaps in the profile. They represent price levels that the market moved through quickly and inefficiently. If price returns to an LVN, it's likely to move through it quickly again.
Analyze the Summary Box: This is where the real magic happens! ✨
Total Volume (Σ): The total volume for the entire group.
Buy (B) vs. Sell (S) Volume: FlowScope analyzes the lower timeframe action to estimate the buying and selling pressure that made up the total volume. Is a big red candle mostly aggressive selling, or was it just a lack of buyers? The B/S data gives you clues. A high-volume candle with nearly 50/50 buy/sell pressure might indicate absorption or a potential reversal.
Use the Grouped Candle for Clarity: Is the market in a clear uptrend, or is it just choppy? The grouped candle can give you a much clearer signal. A series of strong, green grouped candles shows much more conviction than a mix of small green and red candles.
⚙️ Settings & Customization
This is where you can truly make FlowScope your own. Let's walk through each setting.
Profile Settings
Group Candles: The number of standard chart candles you want to combine into a single FlowScope profile. A setting of 1 will analyze every single bar. A higher number gives you a broader market view. When Group Candles is set to 5, the data from the 5 individual candles are combined, and the volume is calculated accordingly.
Max Profile Boxes: This setting is more than just a number; it's a smart limit that ensures your profiles are always readable and relevant to the current market conditions.
Adaptive Sizing (The Ideal Goal): FlowScope first tries to create the perfect profile by making each volume box's height proportional to the current market volatility. It calculates an "ideal" box height based on the Average True Range ( ATR / 10 ). This is powerful because it automatically adapts: you get smaller, more detailed boxes in quiet, low-volatility markets, and larger, clearer boxes in volatile, fast-moving markets.
The Safety Cap (Your Setting): However, what if you group several candles during a massive price move? The price range could be huge! If we only used the small, ATR-based box height, you might end up with hundreds of tiny, unreadable boxes. This is where your Max Profile Boxes setting (defaulting to 50) comes in. It acts as a maximum detail cap . If the adaptive, volatility-based calculation determines that it would need more boxes than your setting (e.g., more than 50), the indicator will override it. It will then simply divide the entire price range of the group into exactly the number of boxes you specified (e.g., 50).
In short: You are setting the maximum allowable detail. FlowScope intelligently adapts the profile's granularity below that limit based on market volatility, ensuring you always get a clear and meaningful picture.
Style
Show Profile BG: A simple toggle to show or hide the faint background color behind the volume bars. Turning it off can create a cleaner look.
Color Mode: This dropdown controls how the volume profile text is colored.
Custom Gradient: This mode uses the three custom colors you select in the "Profile Colors" section to create a beautiful gradient across the profile.
Candle Color: This mode colors the profile based on whether the grouped candle was bullish (green) or bearish (red). The color will be a gradient, with the most intense color applied to the box with the highest volume; the colors of the other boxes will fade out from that point. It's a great way to see the profile's "mood" at a glance.
Profile Colors 🎨
Use Preset Palette: This is the master switch!
If checked: You can choose from 10 stunning, pre-designed color palettes from the Palette dropdown. The custom color pickers below will be disabled.
If unchecked (Default): The Palette dropdown will be disabled, and you can now choose your own three colors for the gradient.
Palette: (Only active when "Use Preset Palette" is checked) . Choose from 10 luxurious, eye-catching color schemes like "Solar Flare" or "Deep Space" to instantly change the look and feel of your chart.
Low Price / Mid Price / High Price: (Only active when "Use Preset Palette" is unchecked) . These three color pickers allow you to design your own unique gradient for the Custom Gradient color mode.
Candle Display
These settings control the custom "Grouped Candle" that summarizes the profile. When using the "Show Custom Candle" feature, you should change the chart's candlestick display to Bars for a cleaner view.
Show Custom Candle: This is the main toggle. When you check this box, the original chart candles will be hidden, and your custom FlowScope candle will be displayed instead. This custom candle is intentionally small to ensure it does not visually overlap with the volume profile boxes.
Show Body: (Only active when "Show Custom Candle" is checked) . Toggles the visibility of the candle's body.
Wick Width & Body Width: (Only active when "Show Custom Candle" is checked) . These sliders let you control the thickness of the wick and body lines to match your personal style.
Up Color / Down Color: (Only active when "Show Custom Candle" is checked) . Choose the colors for your bullish and bearish custom candles.
Experiment with the settings, find a style that works for you, and start seeing the market in a whole new light.
Happy trading! 📈😊

ATR SL/TPStop Loss Finder ATR
A Stop Loss Finder ATR indicator is a dynamic risk management tool leveraging the Average True Range (ATR) to identify and track optimal stop-loss levels based on current market volatility.
A stop hunt indicator is a technical tool designed to identify potential instances where large market participants, often referred to as "smart money," deliberately move the price to trigger a large number of stop-loss orders, creating a temporary price distortion before reversing the trend. These indicators aim to help traders detect these events to either avoid being stopped out or to enter trades in the direction of the anticipated reversal.
For example, a long wick below support with high volume may signal a bullish stop-hunt , indicating that the price has been driven down to trigger sell-stop orders before reversing upward. Conversely, a long wick above resistance with high volume may signal a bearish stop-hunt , suggesting the price was pushed up to trigger buy-stop orders before reversing downward. The presence of such wicks is often associated with candlestick patterns like hammers or shooting stars.
Unlike fixed stop-losses, this indicator adapts its distance from the current price using a customizable ATR multiplier, ensuring that stop-loss levels are neither too tight (prone to being triggered by normal market noise) nor too wide (exposing capital to excessive risk) . The core function calculates the true range—considering the current high-low range, gaps up, and gaps down—over a user-defined period (typically 14 bars), then applies a multiplier to generate a volatility-adjusted stop-loss distance . This approach allows the indicator to dynamically widen stops during high-volatility periods and tighten them during calm markets, providing a more responsive and context-aware exit strategy.
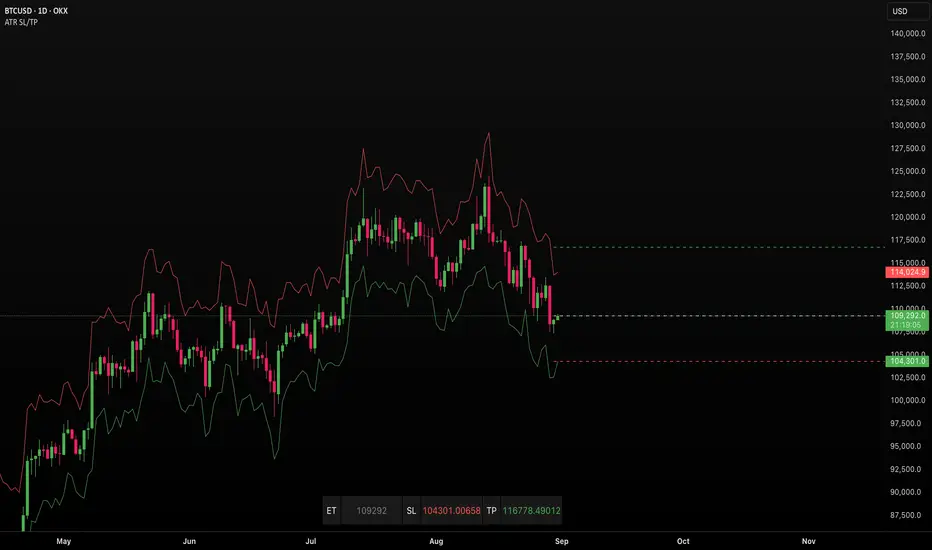
Daily HOD / LOD Anchored VWAP (24/7 Markets)mart Daily HOD/LOD Anchored VWAP (Auto Detect + Alerts)
This indicator automatically anchors VWAP at the High of Day (HOD) and Low of Day (LOD) for each session/day.
No more manual anchoring — the script tracks intraday highs and lows in real-time and resets cleanly at the start of each trading day or session.
✨ Features
✅ Auto-anchored AVWAP at daily High and Low
✅ Works for stock markets (with fixed sessions) and crypto markets (24/7)
✅ Clean reset every session/day
✅ Separate AVWAP lines for HOD and LOD
✅ Customizable colors & line widths
✅ Alerts included 🚨 (get notified instantly when a new High/Low AVWAP starts)
📈 Use Cases
Spot true intraday support/resistance levels
Track where institutions may be defending positions
Combine with price action, orderflow, or volume profile strategies
Perfect for intraday trading, scalping, and swing entries
⚡ Alerts
New HOD AVWAP → Fires when price makes a fresh high of day, starting a new anchored VWAP.
New LOD AVWAP → Fires when price makes a fresh low of day, starting a new anchored VWAP.
🛠️ Settings
Show/hide HOD or LOD VWAP
Customize line colors and thickness
Works seamlessly across stocks, futures, forex, and crypto
💡 Pro Tip:
AVWAP from the high and low of the day often acts as a magnet for price. Watch how price reacts when revisiting these levels — confluence with other indicators = high-probability setups.
⚠️ Disclaimer:
This script is for educational purposes only. It is not financial advice. Always manage your own risk.
(LES/SES) Compliment Net Volume(LES/SES) Compliment Net Volume
(LES/SES) Compliment Net Volume is a volume-based confirmation tool designed to show whether buyers or sellers are truly in control behind the candles. It acts as a compliment to the Long Elite Squeeze (LES) and Short Elite Squeeze (SES) frameworks, giving traders a clearer view of momentum strength.
Note! {Short Elite Squeeze (SES) Will be released in the Future}
-Designed to take shorts opposite of the long trades from LES
🔹 Core Logic
Net Volume Calculation – Positive volume when price closes higher, negative when price closes lower.
Cumulative Smoothing – Uses a rolling SMA of cumulative differences to remove noise.
Color Coding –
Green → Buyer dominance
Red → Seller dominance
Gray → Neutral pressure
🔹 How to Use
Above zero (green) → Buyers dominate → supports long setups (LES).
Below zero (red) → Sellers dominate → supports short setups (SES).
Flat/gray → No clear pressure → signals caution or chop.
This makes it easier to confirm when market participation aligns with a potential entry or exit.
🔹 Credit
The Compliment Net Volume was developed by Hunter Hammond (Elite x FineFir) as part of the LES/SES system.
The concept builds on classic Net Volume and cumulative volume analysis principles shared by the TradingView community, but has been uniquely adapted into the LES/SES framework.
⚠️ Disclaimer: This is a framework tool, not financial advice. Use with proper risk management.

Market structure + TF Bucket Market Structure + TF Bucket
This Pine Script™ indicator, published under the Mozilla Public License 2.0, extends the "Market Structure" script by mickes (), with full credit to mickes. It integrates the enhanced MarketStructure library by Fenomentn (), also based on mickes’ library under MPL 2.0, to provide advanced market structure analysis with multi-timeframe pivot length customization.
Functionality
Market Structure Analysis: Detects internal (orderflow) and swing market structures, visualizing Break of Structure (BOS), Change of Character (CHoCH), Equal High/Low (EQH/EQL), and liquidity zones using the MarketStructure library.
Timeframe Bucket (TF Bucket): Dynamically adjusts pivot lengths for six user-defined timeframes (e.g., 3m, 5m, 10m, 15m, 4h, 12h), optimizing structure detection across different chart timeframes.
Trend Strength Visualization: Displays a trend strength metric (from the library) for internal and swing structures, indicating trend reliability based on pivot frequency and volatility.
Statistics Table: Shows yearly counts of BOS and CHoCH events for internal and swing structures, configurable by a user-defined period.
Screener Support: Outputs BOS and CHoCH signals for TradingView’s screener, with a configurable signal persistence period.
Customizable Alerts: Enables alerts for BOS and CHoCH events, separately configurable for internal and swing structures.
Methodology
Pivot Detection: Uses the library’s Pivot function, which applies a volatility filter (ATR-based) to confirm significant pivots, reducing false signals in low-volatility markets.
TF Bucket: Maps user-selected timeframes to Pine Script’s timeframe.period using f_getTimeframePeriod, applying custom pivot lengths when the chart’s timeframe matches a selected one (or base lengths in Static mode).
Trend Strength: Calculates a score as pivotCount / LeftLength * (currentATR / ATR), displayed via labels to help traders assess trend reliability.
BOS/CHoCH Detection: Identifies BOS when price breaks a pivot in the trend direction and CHoCH when price reverses against the trend, labeling events as “MSF” or “MSF+” based on pivot patterns.
EQH/EQL and Liquidity: Draws boxes for equal high/low zones within ATR-based thresholds and visualizes liquidity levels with confirmation bars.
Statistics and Screener: Tracks BOS/CHoCH events in a yearly table and outputs signals for screener use, with persistence controlled by a user-defined period.
Usage
Integration: Apply the indicator to any chart and import the library via import Fenomentn/MarketStructure/1.
Configuration: Set up to six timeframes with custom pivot lengths, enable/disable internal and swing structures, configure alerts, and adjust statistics years in the settings panel.
Alerts: Enable BOS and CHoCH alerts for real-time notifications, triggered on bar close to avoid repainting.
Screener: Use the plotted signals to monitor BOS/CHoCH events across multiple tickers in TradingView’s screener.
Best Practices: Optimal for forex and crypto charts on 1m to 12h timeframes. Adjust pivot lengths and the library’s volatility threshold for specific market conditions.
Originality
This indicator enhances mickes’ original script with:
Timeframe Bucket: Dynamic pivot length selection for multi-timeframe analysis, not present in the original.
Trend Strength Display: Visualizes the library’s TrendStrength metric for enhanced trend analysis.
Enhanced Library Integration: Leverages Fenomentn/MarketStructure/1, which adds a volatility-based pivot filter, dynamic label sizing, and customizable BOS/CHoCH visualization styles.No additional open-source code was reused beyond mickes’ script and library, fully credited under MPL 2.0.

MarketStructureLibMarketStructure Library
This library extends the "MarketStructure" library by mickes () under the Mozilla Public License 2.0, credited to mickes. It provides functions for detecting and visualizing market structure, including Break of Structure (BOS), Change of Character (CHoCH), Equal High/Low (EQH/EQL), and liquidity zones, with enhancements for improved accuracy and customization.
Functionality
Market Structure Detection: Identifies internal (orderflow) and swing market structures using pivot points, with support for BOS, CHoCH, and EQH/EQL.
Volatility Filter: Only confirms pivots when the ATR exceeds a user-defined threshold, reducing false signals in low-volatility markets.
Trend Strength Metric: Calculates a trend strength score based on pivot frequency and volatility, stored in the Structure type for use in scripts.
Customizable Visualizations: Allows users to configure line styles and colors for BOS and CHoCH, and label sizes for pivots, BOS, CHoCH, and liquidity.
Liquidity Zones: Visualizes liquidity levels with confirmation bars and lookback periods.
Methodology
Pivot Detection: Uses ta.pivothigh and ta.pivotlow with a volatility filter (ATR multiplier) to confirm significant pivots.
Trend Strength: Computes a score as pivotCount / LeftLength * (currentATR / ATR), reflecting trend reliability based on pivot frequency and market volatility.
BOS/CHoCH Logic: Detects BOS when price breaks a pivot in the trend direction, and CHoCH when price reverses against the trend, with labels for "MSF" or "MSF+" based on pivot patterns.
EQH/EQL Zones: Creates boxes around equal highs/lows within an ATR-based threshold, with optional extension.
Visualization: Draws lines and labels for BOS, CHoCH, and liquidity, with user-defined styles, colors, and sizes.
Usage
Integration: Import into Pine Script indicators (e.g., import Fenomentn/MarketStructure/1) to analyze market structure.
Configuration: Set pivot lengths, volatility threshold, label sizes, and visualization styles via script inputs.
Alerts: Enable alerts for BOS, CHoCH, and EQH/EQL events, triggered on bar close to avoid repainting.
Best Practices: Use on forex or crypto charts (1m to 12h timeframes) for optimal results. Adjust the volatility threshold for different market conditions.
Originality
This library builds on mickes’ framework by adding:
A volatility-based pivot filter to enhance signal accuracy.
A trend strength metric for assessing trend reliability.
Dynamic label sizing and customizable visualization styles for better usability. No additional open-source code was reused beyond mickes’ library, credited under MPL 2.0.
Developed by Fenomentn. Published under Mozilla Public License 2.0.

Cheat CodeWhy Monday & Friday
Monday evening (NY): frequently seeds the weekly expansion. Its DR/IDR often acts as a weekly “starter envelope,” useful for breakout continuation or fade back into the box plays as liquidity builds.
Friday evening (NY): often exposes end-of-week traps (run on stops into the close) and sets expectation boundaries into the following week. Carry these levels forward to catch Monday’s reaction to Friday’s closing structure.
Typical use-cases
Breakout & retest:
Price closes outside the Monday DR/IDR → look for retests of the band edge for continuation.
Liquidity sweep (“trap”) recognition:
Friday session wicks briefly beyond Friday DR/IDR then closes back inside → watch for mean reversion early next week.
Bias filter:
Above both Monday DR midline and Friday DR midline → bias long until proven otherwise; the inverse for shorts.
Session open confluence:
Reactions at the open line frequently mark decision points for momentum vs. fade setups.
(This is a levels framework, not a signals engine. Combine with your execution model: orderflow, S/R, session timing, or higher-TF bias.)
Inputs & styling (quick reference)
Display toggles (per day):
Show DR / IDR / Middle DR / Middle IDR
Show Opening Line
Show DR/IDR Box (choose DR or IDR as box source)
Show Price Labels
Style controls (per day):
Line width (1–4), style (Solid/Dashed/Dotted)
Independent colors for DR, IDR, midlines, open line
Box background opacity
Timezone:
Default America/New_York (changeable).
Optional on-chart warning if your chart TZ differs.
Practical notes
Works on intraday charts; levels are anchored using weekly timestamps for accuracy on any symbol.
Live updating: During the Mon/Fri calc windows, DR/IDR highs/lows and midlines keep updating until the session ends.
Clean drawings: Lines, box, and labels are created once per session and then extended/updated—efficient on resources even with long display windows.
Max elements: Script reserves ample line/box/label capacity for stability across weeks.