Pattern Finder Pro [M/W Recognition]Description
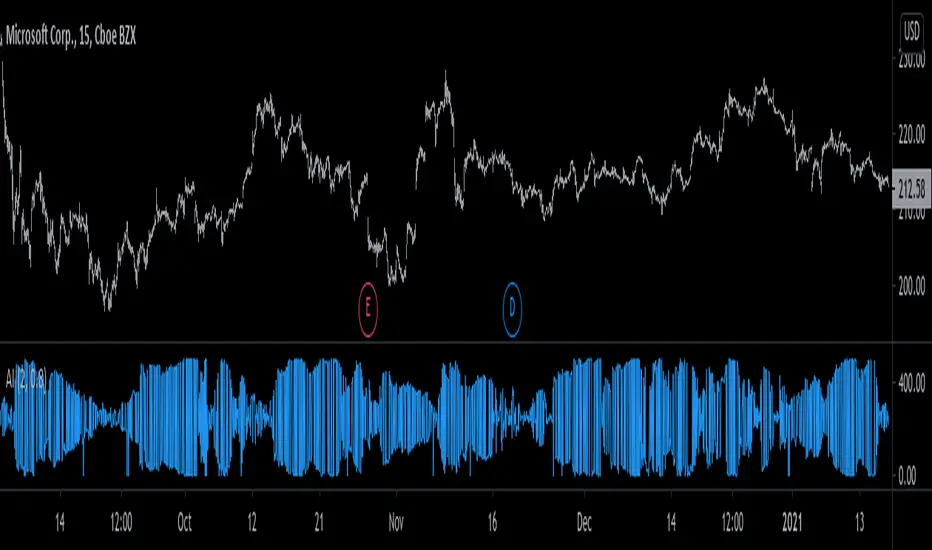
PatternFinder detects M patterns (bearish) and W patterns (bullish) with three variants each.
Now includes **optional volume confirmation** to filter for higher-probability setups.
אינדיקטור Pine Script®