Pivot Points High Low (%-Auslenkung)Marks swing highs and lows only when the price deviation between opposite pivots exceeds a user-defined percentage threshold.
חפש סקריפטים עבור "pivot"

Pivot Points LIVE [CHE]Title:
Pivot Points LIVE Indicator
Subtitle:
Advanced Pivot Point Analysis for Real-Time Trading
Presented by:
Chervolino
Date:
September 24, 2024
Introduction
What are Pivot Points?
Definition:
Pivot Points are technical analysis indicators used to determine potential support and resistance levels in financial markets.
Purpose:
They help traders identify possible price reversal points and make informed trading decisions.
Overview of Pivot Points LIVE :
A comprehensive indicator designed for real-time pivot point analysis.
Offers advanced features for enhanced trading strategies.
Key Features
Pivot Points LIVE Includes:
Dynamic Pivot Highs and Lows:
Automatically detects and plots pivot high (HH, LH) and pivot low (HL, LL) points.
Customizable Visualization:
Multiple options to display markers, price labels, and support/resistance levels.
Fractal Breakouts:
Identifies and marks breakout and breakdown events with symbols.
Line Connection Modes:
Choose between "All Separate" or "Sequential" modes for connecting pivot points.
Pivot Extension Lines:
Extends lines from the latest pivot point to the current bar for trend analysis.
Alerts:
Configurable alerts for breakout and breakdown events.
Inputs and Configuration
Grouping Inputs for Easy Customization:
Source / Length Left / Length Right:
Pivot High Source: High price by default.
Pivot Low Source: Low price by default.
Left and Right Lengths: Define the number of bars to the left and right for pivot detection.
Colors: Customizable colors for pivot high and low markers.
Options:
Display Settings:
Show HH, LL, LH, HL markers and price labels.
Display support/resistance level extensions.
Option to show levels as a fractal chaos channel.
Enable fractal breakout/down symbols.
Line Connection Mode:
Choose between "All Separate" or "Sequential" for connecting lines.
Line Management:
Set maximum number of lines to display.
Customize line colors, widths, and styles.
Pivot Extension Line:
Visibility: Toggle the display of the last pivot extension line.
Customization: Colors, styles, and width for extension lines.
How It Works - Calculating Pivot Points
Pivot High and Pivot Low Detection:
Pivot High (PH):
Identified when a high price is higher than a specified number of bars to its left and right.
Pivot Low (PL):
Identified when a low price is lower than a specified number of bars to its left and right.
Higher Highs, Lower Highs, Higher Lows, Lower Lows:
Higher High (HH): Current PH is higher than the previous PH.
Lower High (LH): Current PH is lower than the previous PH.
Higher Low (HL): Current PL is higher than the previous PL.
Lower Low (LL): Current PL is lower than the previous PL.
Visual Elements
Markers and Labels:
Shapes:
HH and LH: Downward triangles above the bar.
HL and LL: Upward triangles below the bar.
Labels:
Optionally display the price levels of HH, LH, HL, and LL on the chart.
Support and Resistance Levels:
Extensions:
Lines extending from pivot points to indicate potential support and resistance zones.
Chaos Channels:
Display levels as a fractal chaos channel for enhanced trend analysis.
Fractal Breakout Symbols:
Buy Signals: Upward triangles below the bar.
Sell Signals: Downward triangles above the bar.
Slide 7: Line Connection Modes
All Separate Mode:
Description:
Connects pivot highs with pivot highs and pivot lows with pivot lows separately.
Use Case:
Ideal for traders who want to analyze highs and lows independently.
Sequential Mode:
Description:
Connects all pivot points in the order they occur, regardless of being high or low.
Use Case:
Suitable for identifying overall trend direction and momentum.
Pivot Extension Lines
Purpose:
Trend Continuation:
Visualize the continuation of the latest pivot point's price level.
Customization:
Colors:
Differentiate between bullish and bearish extensions.
Styles:
Solid, dashed, or dotted lines based on user preference.
Width:
Adjustable line thickness for better visibility.
Dynamic Updates:
The extension line updates in real-time as new bars form, providing ongoing trend insights.
Alerts and Notifications
Configurable Alerts:
Fractal Break Arrow:
Triggered when a breakout or breakdown occurs.
Long and Short Signals:
Specific alerts for bullish breakouts (Long) and bearish breakdowns (Short).
Benefits:
Timely Notifications:
Stay informed of critical market movements without constant monitoring.
Automated Trading Strategies:
Integrate with trading bots or automated systems for executing trades based on alerts.
Customization and Optimization
User-Friendly Inputs:
Adjustable Parameters:
Tailor pivot detection sensitivity with left and right lengths.
Color and Style Settings:
Match the indicator aesthetics to personal or platform preferences.
Line Management:
Maximum Lines Displayed:
Prevent chart clutter by limiting the number of lines.
Dynamic Line Handling:
Automatically manage and delete old lines to maintain chart clarity.
Flexibility:
Adapt to Different Markets:
Suitable for various financial instruments including stocks, forex, and cryptocurrencies.
Scalability:
Efficiently handles up to 500 labels and 100 lines for comprehensive analysis.
Practical Use Cases
Identifying Key Support and Resistance:
Entry and Exit Points:
Use pivot levels to determine optimal trade entry and exit points.
Trend Confirmation:
Validate market trends through the connection of pivot points.
Breakout and Breakdown Strategies:
Trading Breakouts:
Enter long positions when price breaks above pivot highs.
Trading Breakdowns:
Enter short positions when price breaks below pivot lows.
Risk Management:
Setting Stop-Loss and Take-Profit Levels:
Utilize pivot levels to place strategic stop-loss and take-profit orders.
Slide 12: Benefits for Traders
Real-Time Analysis:
Provides up-to-date pivot points for timely decision-making.
Enhanced Visualization:
Clear markers and lines improve chart readability and analysis efficiency.
Customizable and Flexible:
Adapt the indicator to fit various trading styles and strategies.
Automated Alerts:
Stay ahead with instant notifications on key market events.
Comprehensive Toolset:
Combines pivot points with fractal analysis for deeper market insights.
Conclusion
Pivot Points LIVE is a robust and versatile indicator designed to enhance your trading strategy through real-time pivot point analysis. With its advanced features, customizable settings, and automated alerts, it equips traders with the tools needed to identify key market levels, execute timely trades, and manage risks effectively.
Ready to Elevate Your Trading?
Explore Pivot Points LIVE and integrate it into your trading toolkit today!
Q&A
Questions?
Feel free to ask any questions or request further demonstrations of the Pivot Points LIVE indicator.

MTF Order Block FinderAn Order Block is a special type of pivot point that satisfies the following requirement:
A Bull/Bear candle followed by X consecutive candles in the opposite direction.
Order Blocks are interesting areas that are frequently revisited and can be treated as Support/Resistance levels.
Often, you can see explosive price rejection of these areas via long wicks, high volume, and rapid price change.
Features
Choose from two themes:
- LIGHT: a classic Red and Green representing Bearish and Bullish OBs, respectively
- DARK: a clean Blue and White scheme
Choose from two drawing styles:
- LINE: three lines representing the High, Low, and Mid price levels of the OB candle
- BOX: a bounded area similar to the "rectangle" tool
Chose a custom timeframe:
- From 1 Minute (useful for Seconds interval) up to 1 Month
Note, this setting is experimental and choosing a timeframe that is extraordinarily large may not function properly.
Filter order blocks with two settings:
- Number of consecutive bars
- Minimum % change of the potential OB bar (default 0.25%)
Keep your charts clean and show only relevant OBs
- Maximum number of Bullish zones to show
- Maximum number of Bearish zones to show
FAQ
Q: How do I trade with this indicator?
A:Personally, I use a fast entry indicator to confirm Long/Short position when price is rejected. I set my SL and TP based on the current Zone and the next one, if available.
Q: Does this repaint?
A:Yes and this is okay! The "Bear" and "Bull" signals are not meant for taking positions, only showing which candle reveals the Order Block. The Zone is much more useful to us and can result in several successful trades in the near future when treated as a support/resistance area.
Q What's the winrate?
A:Hard to say - this isn't a standalone strategy and I haven't been able to properly backtest it quite yet.

PriceCatch Opensource CPRHi Friends & TradingView community.
Greetings to you.
Some traders like to use Central Pivot Range (CPR) in their chart for assessing price movement. It is usually used in combination with Pivot Levels.
Calculating CPR is a simple matter. There a few CPR scripts in the Public Library, but have the code hidden. I thought there may many users who may want to know how CPR is calculated and study it for use in their own scripts. So, here is the CPR script with the code. Use it as you please.
Note: CPR is plotted only on intra-day time-frames.
The light magenta (band) range is current day CPR.
The light blue (band) range is tomorrow's CPR projected for you today itself based on current day's price action and range.
Queries / feedback welcome.
All the best.
PS: The script is developed to the best of my ability and as with all indicators, you have to decide if it might be useful to you when adding to your chart.

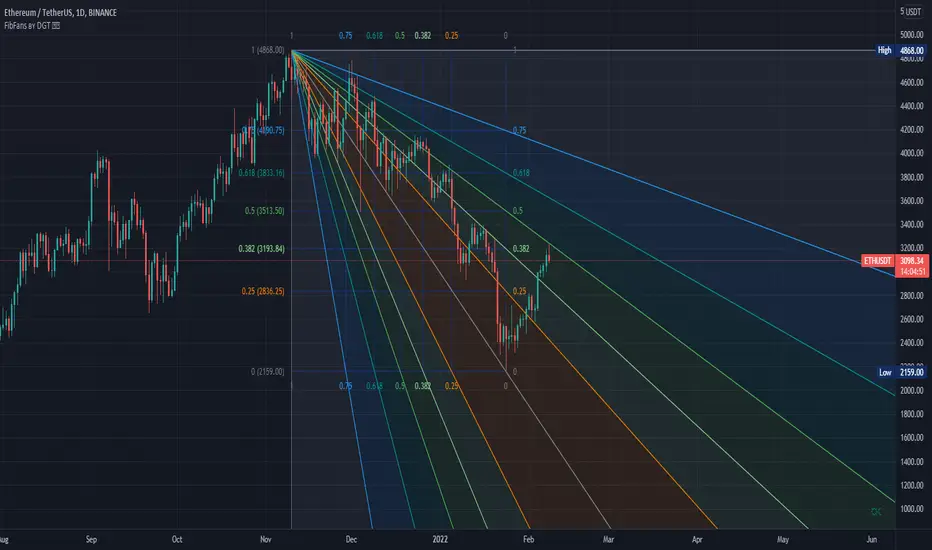
Auto Fib Speed Resistance Fans by DGTFibonacci Speed and Resistance Fan is an analytical drawing tool used to indicate the support and resistance levels of an existing trend and the price level at which possible changes in the trend may occur.
A Fibonacci Speed Resistance Fan consists of a trend line drawn between two extreme points - a trough and opposing peak or a peak and opposing trough - on which a set of sequential speed resistance lines are drawn above (which represents time) and below (which represents price). These lines are drawn based on time/price percentages of the distance between the beginning and the end of the trend line.
Speed resistance lines not only help to measure trend corrections but also measure the speed of a trend (the rate at which a trendline ascends or descends)
Traders can use the lines of the Fibonacci Speed and Resistance Fan to predict key points of resistance or support, at which they might expect price trends to reverse. Once a trader identifies patterns within a chart, they can use those patterns to predict future price movements and future levels of support and resistance. Traders use the predictions to time their trades. Key support and resistance levels tend to occur frequently at the 61.8-percent level on both uptrends and downtrends.
Please check for further details in the education post that I will share shortly after this publication :
Nobody appears to know whether Fibonacci tools work because markets exhibit some form of natural pattern or because many investors use Fibonacci ratios to predict price movements, making them a self-fulfilling prophecy.
█ Study OPTIONS
Auto Fibonacci Speed and Resistance Fan , the main aim of the study
- Pivot threshold can be adjusted via “Deviation” and “Depth” input options
- Historical Fans option will allow plotting of Speed and Resistance Fans on previous pivot high/lows
- Ability to set ALERTs for the Speed and Resistance Levels
- Price Grid Lines if extended it will result with Fib Retracement levels
- All lines, line levels are customizable, default values are set exactly to the same with the available Fib Speed and Resistance Fan drawing tool
Zig Zag – Derived from build-in Auto Fib Retracement with some customization options.
Example Usages :
Disclaimer :
Trading success is all about following your trading strategy and the indicators should fit within your trading strategy, and not to be traded upon solely
The script is for informational and educational purposes only. Use of the script does not constitute professional and/or financial advice. You alone have the sole responsibility of evaluating the script output and risks associated with the use of the script. In exchange for using the script, you agree not to hold dgtrd TradingView user liable for any possible claim for damages arising from any decision you make based on use of the script
Zig Zag High LowZig Zag script that uses local minimums and maximums as pivot points. It can be used as a source for pattern recognition.

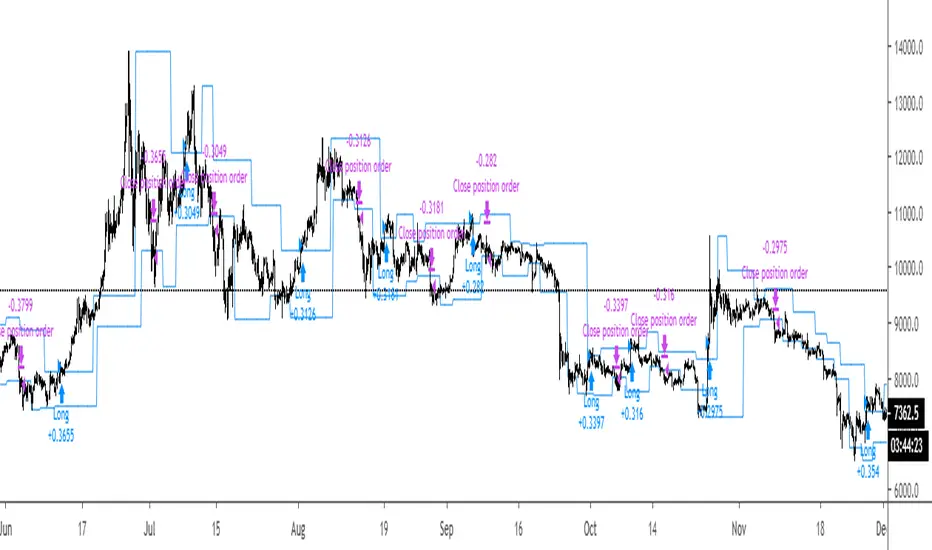
Breakout Strategy #1Breakout above previous pivot points trigger a long. Close below pivot lows trigger the exit.
Most effective during trends.
R100 Wave v2 (*v*)This is a Wave (or Zig Zag) indicator I made to use in conjunction with the Wave Volume indicator I use.
It uses the Jurik moving average to determine turning points, and will plot the tops and bottoms of the wave based on the most recent high- so you can also use to quickly find pivot highs and lows. If you are using with the R100 Wave Volume indicator, first adjust the wave to fit better (if required) using the Jurik length and/or power, and then use the same settings on the Wave Volume indicator. Default settings work pretty well for most stocks, but adjusting the length between 8 and 14 should be enough for a good fit, or adjust the power between 1 and 3, or get fussy and tweak it with both.
The Jurik MA has been modified to include a VWAP component, so will only work where you have volume. The last "leg" of the wave will move about until the next pivot high or low is found and then will remain fixed.
I hope you find some value with it. Only conditions of use are that if you improve it, let me know and if you publish something that uses it, don't hide the code! Enjoy!
Code pinched and modified from Zero Lag ZigZag by Duyck - thankyou
Jurik Moving Average (for turning points) by Everget - thankyou
and Weis Wave by Modhelius - thankyou

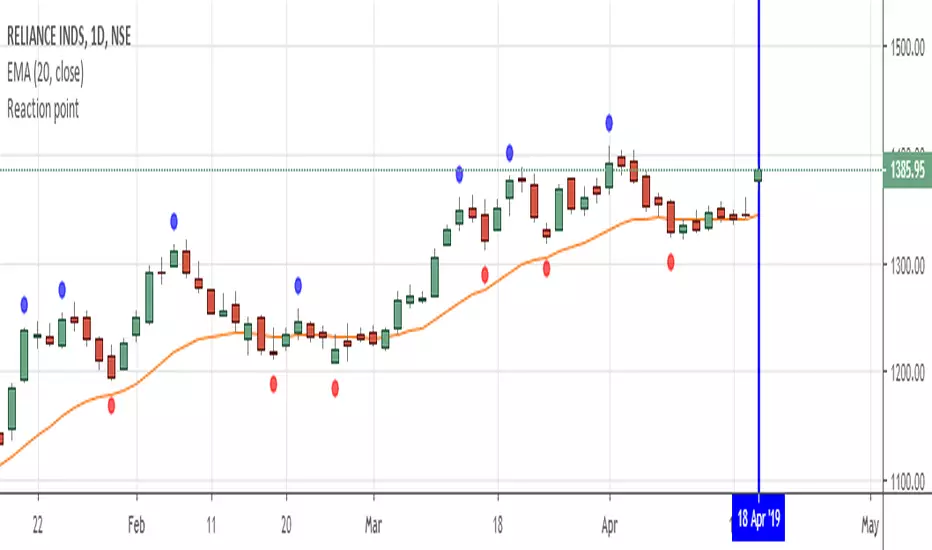
Reaction pointShows the pivot high and pivot low to analyse reaction swing...theory is mentioned in john crane book :"Advanced Swing Trading "...Any further modifications are welcome....
Pivot Edge ProOverview
Smart Pivot Analytics is a highly accurate technical analysis tool designed to identify and validate significant price levels. Unlike standard pivot indicators that only mark recent highs, this tool backtests each identified pivot against thousands of historical candlesticks to calculate its real-world “success rate.”
Key Features
Historical Backtesting: The indicator scans up to 4,900 historical columns to find every instance where price interacted with a specific pivot level.
Strength Score (%): Each level is assigned a percentage score based on its reversal rate. It calculates how many times the price has successfully reached and rejected the level, providing a statistical “hit rate.”
Dynamic Hit Counter: Displays the exact number of times a level has been tested (hit), helping traders distinguish between new levels and established “old” levels.
Smart Filtering: To keep the chart clean, the indicator automatically filters out weak levels and prevents “clutter” by merging levels that are too close together.
Infinite Left Projection: Lines extend left to infinity, allowing traders to see the historical significance of a level across the entire price history at a glance.
How to Trade with It
Red Levels (High Power > 75%): These are “Top Reaction Zones”. Expect a strong price rejection or significant breakout when these levels are tested.
Orange Levels (Medium Power): Suitable for profit targets or as secondary confirmation for entering a trade.
Encounter: Use these levels in conjunction with your existing strategy. When a high power pivot aligns with your entry signal, the probability of a successful trade increases significantly.
Technical Parameters
Lookback Period: Defines how far back in history the script calculates power.
Touch Radius: The "sensitivity" of the level (how close the price has to get to be considered a "hit").
Minimum Strength: A filter to show only the most reliable levels.

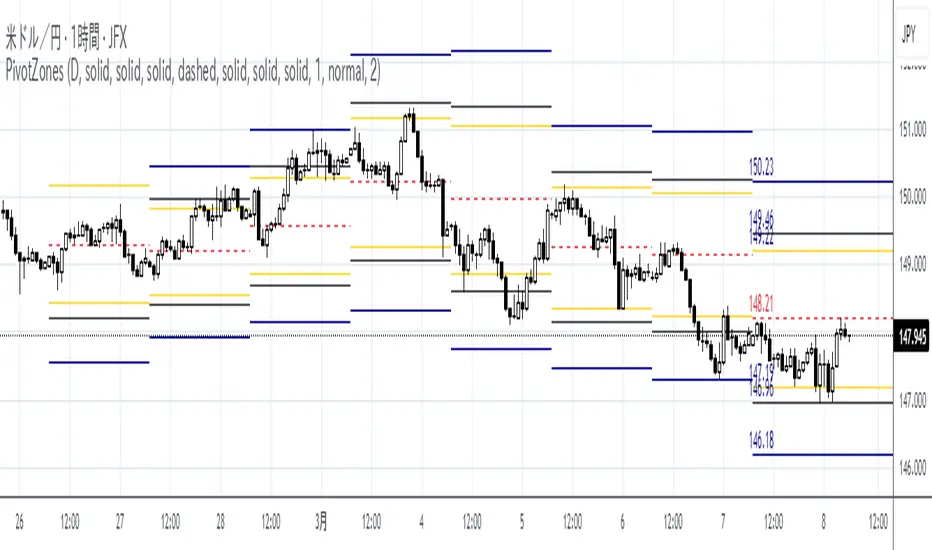
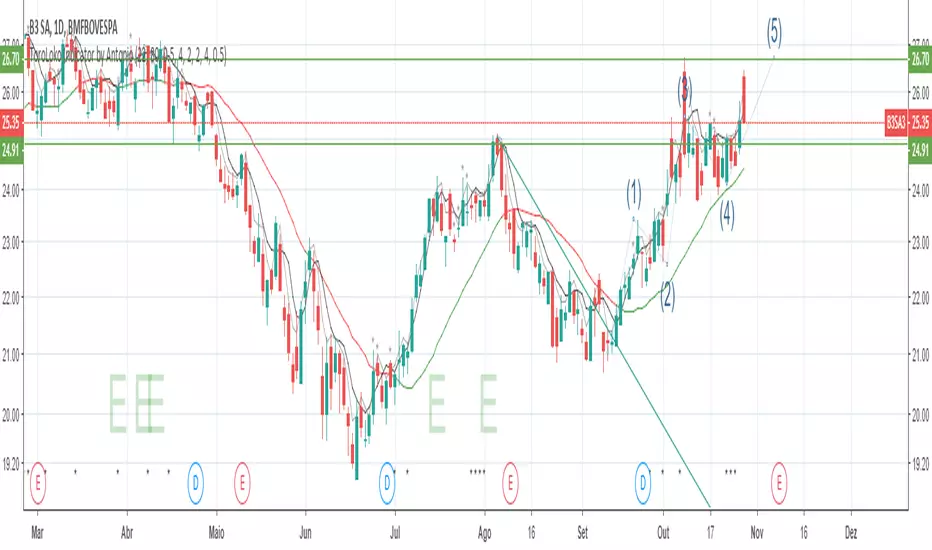
Pivot Points High LowGaneshA Pivot Points High/Low indicator that:
Detects swing highs (ta.pivothigh) and swing lows (ta.pivotlow) using configurable left/right bar lengths.
Draws labels at the confirmed pivot points:
Down labels at pivot highs (potential resistance).
Up labels at pivot lows (potential support).
Lets you customize text color and label fill color separately for highs and lows.
It’s designed for overlay (on-price chart), with max_labels_count=500 to allow many labels.

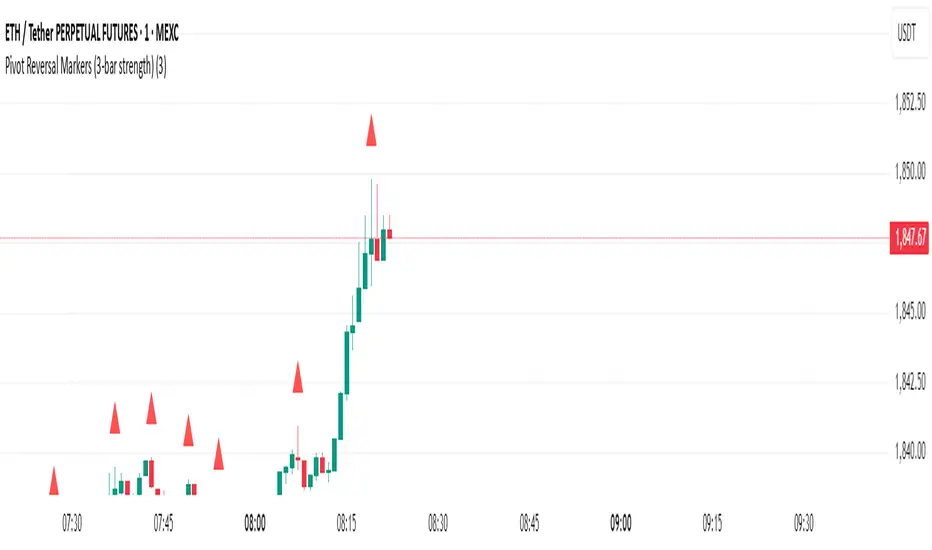
Pivot Reversal Markers (3-bar strength)### Pivot Reversal Markers (3-Bar Strength)
**Overview:**
This indicator identifies and marks pivot high and pivot low reversal points on your chart using a customizable pivot strength. Ideal for traders seeking clear visual signals of potential reversals.
**Settings:**
* **Pivot Strength:** Number of bars checked before and after to confirm a pivot (default = 3).
**Signals:**
* 🔺 **Red Triangle (Pivot High):** Potential short entry or reversal from upward to downward trend.
* 🔻 **Green Triangle (Pivot Low):** Potential long entry or reversal from downward to upward trend.
**Usage:**
Combine these pivot signals with other technical analysis tools or indicators for optimal results.
Pivot ATR Zones [v6]🟩 Pivot ATR Zones
Overview:
The Pivot ATR Zones indicator plots dynamic support and resistance zones based on pivot highs and lows, combined with ATR (Average True Range) volatility levels. It helps traders visually identify potential long and short trade areas, along with realistic target and stop loss zones based on market conditions.
Features:
Automatically detects pivot highs and lows
Draws ATR-based entry zones on the chart
Plots dynamic take-profit and stop-loss levels using ATR multipliers
Color-coded long (green) and short (red) zones
Entry arrow markers for clearer trade visualization
Real-time alerts when new zones form
Best For:
Scalpers, intraday traders, and swing traders who want a visual, volatility-aware way to mark potential trade areas based on key pivot structures.
How to Use:
Look for newly formed green zones for long opportunities and red zones for short setups.
Use the dashed lines as dynamic take-profit and stop levels, tuned to the current ATR value.
Combine with other confirmation tools or indicators for optimal results.
Pivot Point Calculator PPC V2 by [KhedrFx]📈 Trade Smarter with the Pivot Point Calculator (PPC) by KhedrFx
Want to spot key price levels and make better trading decisions? The Pivot Point Calculator (PPC) by KhedrFx is your go-to TradingView tool for identifying potential support and resistance zones. Whether you’re a Scalper trader, day trader, swing trader, or long-term investor, this script helps you plan precise entries and exits with confidence.
🔹 How to Use Pivot Points in Trading
📊 Step 1: Identify Key Levels
The PPC automatically plots:
Pivot Point (P): The main level where sentiment shifts between bullish and bearish.
Support Levels (S1, S2, S3): Areas where price may bounce higher.
Resistance Levels (R1, R2, R3): Areas where price may face selling pressure.
These levels act as dynamic price zones, helping you anticipate potential market movements.
🔥 Step 2: Choose Your Trading Strategy
1️⃣ Breakout Trading
Buy when the price breaks above the pivot point (P) with strong momentum.
Sell when the price drops below the pivot point (P) with strong momentum.
Use R1, R2, or R3 as profit targets in an uptrend and S1, S2, or S3 in a downtrend.
2️⃣ Reversal (Bounce) Trading
Buy when the price pulls back to S1, S2, or S3 and shows bullish confirmation (e.g., candlestick patterns like a bullish engulfing or hammer).
Sell when the price rallies to R1, R2, or R3 and shows bearish confirmation (e.g., rejection wicks or a bearish engulfing pattern).
🎯 Step 3: Set Smart Stop-Loss & Take-Profit Levels
Stop-Loss: Place it slightly below support (for buy trades) or above resistance (for sell trades).
Take-Profit: Use the next pivot level as a target.
Extreme Zones: R3 and S3 often signal strong reversals or breakouts—watch them closely!
🚀 How to Get Started
1️⃣ Add the PPC script to your TradingView chart.
2️⃣ Choose a timeframe that fits your strategy (5m, 15m, 30m, 1H, 4H, Daily, or Weekly).
3️⃣ Use the pivot points and support/resistance levels to fine-tune your trade entries, exits, and risk management.
⚠️ Trade Responsibly
This tool helps you analyze the market, but it’s not a guarantee of profits. Always do your own research, manage risk, and trade with caution.
💡 Ready to take your trading to the next level? Try the Pivot Point Calculator (PPC) by KhedrFx and start trading with confidence today! 🚀

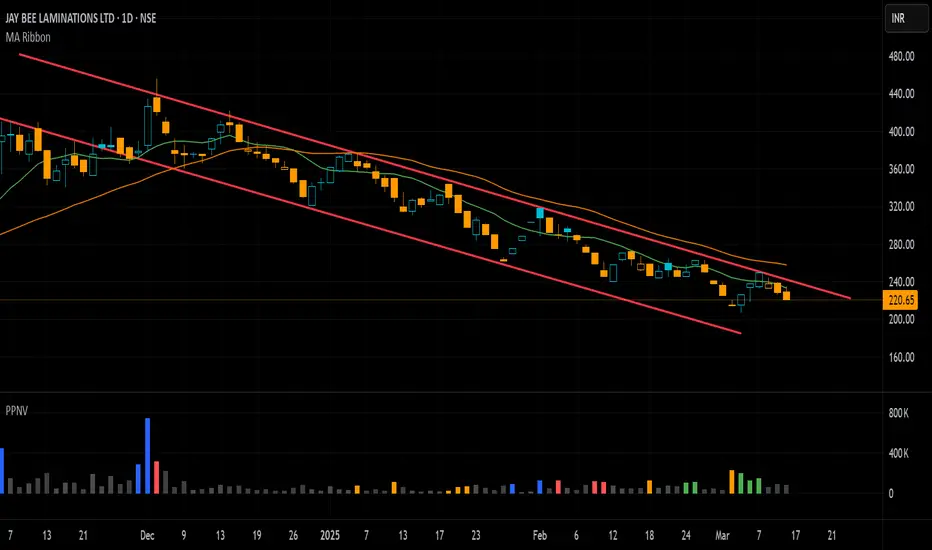
Pivot P/N VolumesTitle: Pivot P/N Volumes
Short Title: PPNV
Description:
The "Pivot P/N Volumes" indicator is a minimalistic volume analysis tool designed to cut through market noise and highlight key volume events in a separate pane. It strips away conventional volume clutter, focusing on four distinct volume types with clear visual cues, making it ideal for traders seeking actionable insights without distractions.
Key Features:
Blue Bars: Pocket Pivot Volumes (PPV) - Up-day volumes exceeding the highest down-day volume of the last 10 down-days, signaling potential bullish strength.
Orange Bars: Pivot Negative Volumes - Down-day volumes greater than the highest up-day volume of the last 10 up-days, indicating significant bearish pressure.
Red Bars: Down-day volumes above the 50-period EMA of volume, highlighting above-average selling activity.
Green Bars: Up-day volumes above the 50-period EMA of volume, showing above-average buying interest.
Noise: All other volumes are muted as dark grey (down-days) or light grey (up-days) for easy filtering.
Pivot-based Swing Highs and LowsRelease Notes for Pivot-based Swing Highs and Lows Indicator with HH, HL, LH, LL and Labels
Version 1.0.0
Release Date: 29th Sept 2024
Overview:
This Pine Script version 5 indicator is designed to identify and display Swing Highs and Swing Lows based on pivot points. The indicator visually marks Higher Highs (HH), Lower Highs (LH), Higher Lows (HL), and Lower Lows (LL) on the chart. The release introduces an improved visual representation with dotted lines and colored labels for easy identification of market structure, using plotshape() and line.new().
Key Features:
1. Pivot-Based Swing Identification:
The indicator uses ta.pivothigh() and ta.pivotlow() to detect significant pivot points on the chart.
The length of the pivot can be adjusted through the pivot_length parameter, allowing users to customize the sensitivity of swing identification.
2. Swing Highs and Lows with Labels:
Higher High (HH) and Lower High (LH) points are marked with green downward triangles.
Higher Low (HL) and Lower Low (LL) points are marked with red upward triangles.
The plotshape() function is used to provide clear visual markers, making it easy to spot the changes in market structure.
3. Dotted Line Visuals:
Green Dotted Lines: Connect Higher Highs (HH) and Higher Lows (HL) to their corresponding previous swings.
Red Dotted Lines: Connect Lower Highs (LH) and Lower Lows (LL) to their corresponding previous swings.
The use of color-coded dotted lines ensures better visual understanding of the trend continuation or reversal patterns.
4. Customizable Input:
The user can adjust the pivot_length parameter to fine-tune the detection of pivot highs and lows according to different timeframes or trading strategies.
Usage:
Higher High (HH): Green downward triangle, indicating a new high compared to the previous pivot high.
Lower High (LH): Green downward triangle, indicating a lower high compared to the previous pivot high.
Higher Low (HL): Red upward triangle, indicating a higher low compared to the previous pivot low.
Lower Low (LL): Red upward triangle, indicating a new lower low compared to the previous pivot low.
Dotted Lines: Connect previous swing points, helping users visualize the trend and potential market structure changes.
Improvements:
Label Substitution: In place of label.new() (which might cause issues in some environments), the indicator now uses plotshape() to provide a reliable and visually effective solution for marking swings.
Streamlined Performance: The logic for determining higher highs, lower highs, higher lows, and lower lows has been optimized for smooth performance across multiple timeframes.
Known Limitations:
No Direct Text Labels: Due to the constraints of plotshape(), text labels like "HH", "LH", "HL", and "LL" are not directly displayed. Instead, color-coded shapes are used for easy identification.
How to Use:
Apply the script to your chart via the TradingView Pine Editor.
Customize the pivot_length to suit your trading style or the timeframe you are analyzing.
Monitor the chart for marked Higher Highs, Lower Highs, Higher Lows, and Lower Lows for potential trend continuation or reversal opportunities.
Use the dotted lines to trace the evolution of market structure.
Please share your comments, thoughts. Also please follow me for more scripts in future. Mean time Happy Trading :)

Weighted Moving Range with Trend Signals (WMR-TS)Weighted Moving Range with Trend Signals (WMR-TS)
Technical analysis involves analyzing statistical trends from trading activity , such as price movement and volume, to make trading decisions. Technical indicators are mathematical calculations based on the price, volume, or open interest of a security or contract. They are used by traders to analyze price movements and predict future market behavior. The WMR-TS indicator combines weighted moving averages and range calculations to identify key trading levels and generate buy/sell signals. It dynamically adjusts to market conditions, offering traders insights into potential support, resistance, and trend reversal points. Key levels are color-coded for quick interpretation. It utilizes weighted moving averages (WMA) and range calculations to determine these levels, making it a robust tool for both trending and ranging markets.
SUMMARY
Parameters :
WMA Length : Determines the length for the primary weighted moving average.
Highest High Length : Sets the period for calculating the highest high.
Lowest Low Length : Sets the period for calculating the lowest low.
Range Corrector : Adjusts the range calculation slightly for fine-tuning.
Top Level : Multiplier for determining the top level from the calculated range.
Bottom Level : Multiplier for determining the bottom level from the calculated range.
Levels Visibility : Sets how many recent bars will display the levels.
Trading Zones :
Short Area : Highlighted zone indicating potential shorting opportunities.
Long Area : Highlighted zone indicating potential buying opportunities.
The Levels :
Wave (Yellow): Midpoint of the calculated range, adjusted by WMA.
Top Level (Red): Calculated upper boundary of the trading range.
Sell Level (Pink): Intermediate sell level.
Resistance Level (Magenta): Immediate resistance level.
Support Level (Cyan): Immediate support level.
Buy Level (Light Green): Intermediate buy level.
Bottom Level (Dark Green): Calculated lower boundary of the trading range.
Interpreting the Signals :
Hammer Signal : Red circles above bars indicate potential sell signals.
Rocket Signal : Green circles below bars indicate potential buy signals.
KEY CONCEPTS
Highest High and Lowest Low :
These values represent the highest high ( HH ) and lowest low ( LL ) over a specified number of periods.
Support Level :
This is the lower boundary of the trading range. It is a price level where demand is strong enough to prevent the price from falling further. As the price approaches the support level, it is likely to bounce back up.
Resistance Level :
This is the upper boundary of the trading range. It is a price level where supply is strong enough to prevent the price from rising further. As the price approaches the resistance level, it is likely to pull back down.
THE USE OF MULTIPLIERS :
The script uses several multipliers to adjust and fine-tune the calculated support and resistance levels, as well as to control the range and sensitivity of these levels. Here is a detailed explanation of these multipliers and their purpose:
Range Corrector : This multiplier adjusts the calculated high ( H ) and low ( L ) levels, adding flexibility to how these levels are positioned relative to the highest high and lowest low. It ranges from -1 to 1 , with a default value of 0 . The use of positive values increase the range, making the calculated levels further apart. Thus, using negative values decrease the range, bringing the calculated levels closer together.
Top Level : This multiplier adjusts the distance of the top level from the calculated high H ) level. It fluctuates from 0 to 2 , with a default value of 0.382 . Higher values will push the top level further above the high level, while lower values will bring it closer.
Bottom Level : This multiplier adjusts the distance of the bottom support level from the calculated low support level. Ranging from 0 to 2, with a default value of 0.214, the higher values will push the bottom level further below the low level, while lower values will bring it closer.
The script plots the support and resistance levels on the chart, allowing traders to visualize the trading range. Color-coded zones are used to indicate areas where buying or selling opportunities may arise based on the current price relative to the trading range. A trading range refers to the area between a price's support and resistance levels over a specific period of time. Within this range, the price of the security fluctuates up and down but does not break out above the resistance or below the support. Support and resistance levels to make trading decisions. Buying near the support level and selling near the resistance level is a common strategy. When the price moves above the resistance level, it is called a breakout . A breakout often indicates that the price may start a new upward trend . Conversely, when the price moves below the support level, it is called a breakdown . A breakdown often indicates that the price may start a new downward trend . By understanding and utilizing trading ranges, traders can make more informed decisions, optimize their trading strategies, and manage risk more effectively.
Understanding Moving Averages
A moving average (MA) is a widely used technical indicator that helps smooth out price data by creating a constantly updated average price. The main purpose of using a moving average is to identify the direction of the trend and to reduce the "noise" of random price fluctuations. The Weighted Moving Average ( WMA ) assigns different weights to each period, with more recent periods typically given more weight. A 10-day WMA might give the most recent day a weight of 10, the second most recent day a weight of 9, and so on. It is useful for traders who want to emphasize recent price data more than older data. When the price is above the moving average, it suggests an Bullish trend . A Bearish Trend is expected to take place when the price is below the moving average. Understanding the price reactions around these levels can be used to make trading decisions.
APPLYING CONCEPTS
Support and Resistance Calculations in the Script :
The script calculates dynamic support and resistance levels using weighted moving averages ( WMA s) and the highest high and lowest low over specified periods. Buy ( Rocket ) and sell ( Hammer ) signals are generated based on the crossing of the price with calculated top and bottom levels.These signals help traders identify potential entry and exit points within the trading range .
Weighted Moving Average (WMA) Application in the Script
This script calculates a special trendWMA using the close price that helps in creating a more dynamic moving average that considers both high and low price actions. This modified WMA is used in conjunction with highest high and lowest low values over specified periods to calculate dynamic support and resistance levels.
Explanation of the Levels in the Script
By understanding these levels, traders can make more informed decisions about where to enter and exit trades, manage risk, and anticipate potential market movements. The script incorporates several key levels levels that traders can use to better anticipate price movements and make more informed trading decisions. Leveraging the principles of Fibonacci retracement ratios ( 23.6%, 38.2%, 50%, 61.8%, and 100% ) to identify key support and resistance zones can also serve for gauging the overall market sentiment.
Top Level and Sell Leve l: Used to identify potential resistance zones where the price may reverse or pause.
Support Level and Buy Level : Used to identify potential support zones where the price may bounce.
Upper and Lower Pivot Values : Serve as intermediate levels for possible price retracements or extensions within the trading range.
Wave Level : Indicates the central trend direction, which can be useful for gauging the overall market sentiment.
Alerts are a crucial part of the script as they notify traders of potential buy and sell signals based on predefined conditions. There are two main alerts: one for a " Hammer " signal (sell condition) and one for a " Rocket " signal (buy condition).
Adjust the input parameters to fit your trading style and the specific asset being analyzed. Shorter lengths may be more responsive to price changes but can produce more false signals , while longer lengths provide smoother signals but may lag . Always backtest the indicator on historical data to understand its behavior and performance. Also remember that different markets may require different parameter settings for optimal performance.
Keep in mind that by nature like all moving averages, WMAs lag behind price action. This means that signals may be delayed. The indicator performs differently in various market conditions. Always consider the overall market context when interpreting signals.
Adjusting parameters like the range corrector and visibility can help tailor the indicator to specific market conditions or trading strategies, improving its effectiveness. The script uses the calculated levels to plot lines and fill zones on the chart, helping traders visualize potential support, resistance, and trend reversal points. The use of multipliers allows for dynamic adjustment of these levels, making the indicator flexible and adaptable to different market conditions.
I think traders can make more informed decisions about where to enter and exit trades, manage risk, and anticipate potential market movements following this code. Stay safe and always remember that market is always changing. Use this tool if you want, please stay informed and plan safe trades,
D.

Pivot Point Moving Average (PPMA)The script is an implementation of an indicator called "PPMA", which stands for "Pivot Point Moving Average." This indicator is designed to be used as a overlay, meaning that it will be plotted on top of the underlying asset's price chart.
The main function of the PPMA indicator is to calculate a moving average based on pivot points of the underlying asset. Pivot points are commonly used in technical analysis to identify key levels of support and resistance, and this indicator uses the pivot points in a unique way to calculate the moving average.
The indicator's main function, "ppma()," is defined as taking two input parameters, "left" and "right." These parameters determine the number of bars to the left and right of a pivot point that will be used to calculate the moving average. The function uses the "ta.pivothigh()" and "ta.pivotlow()" functions to identify pivot points for the high and low prices, respectively. Then the function uses the "ta.change()" function to identify if there is a change in pivot point.
The function keeps track of the number of bars and their sum from the last pivot point until the next pivot point is reached. If there is a change in pivot point, it will reset the count and sum. It will return the sum divided by the count, which is the moving average of the prices between the two pivot points.
The script then uses the PPMA function to plot the moving average on the chart using the "plot()" function. The user is able to adjust the number of bars to the left and right of the pivot point using the "left" and "right" input parameters.
In summary, the PPMA indicator is a unique moving average that uses pivot points to calculate the average. It is designed to be used as an overlay on top of an underlying asset's price chart and can be adjusted by the user to suit their needs. It can help traders identify key levels of support and resistance in the underlying asset.

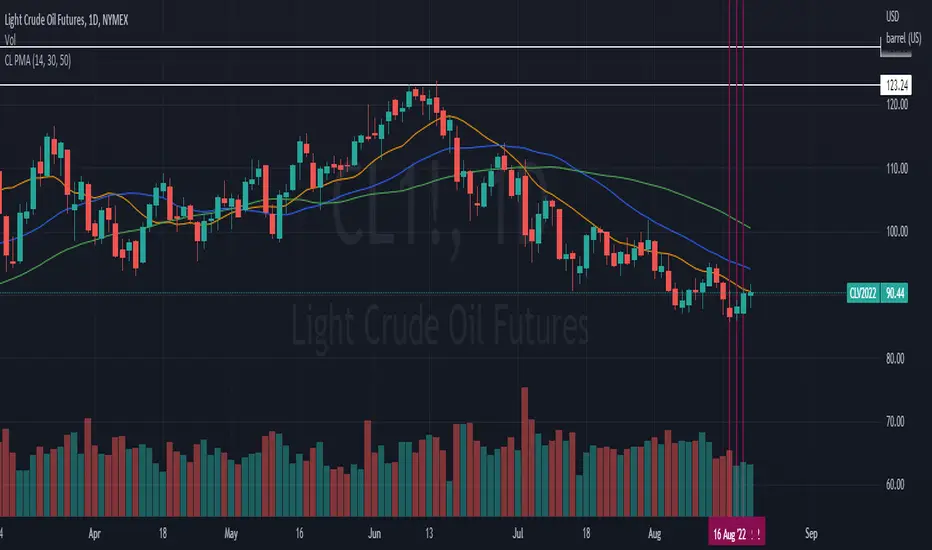
CL PMAPivot moving averages useing SMA's. This study is just a tweak from the study already done by @QUANTCT. I just cleaned it up and used SMAs instead of EMAs so he deserves most credit.
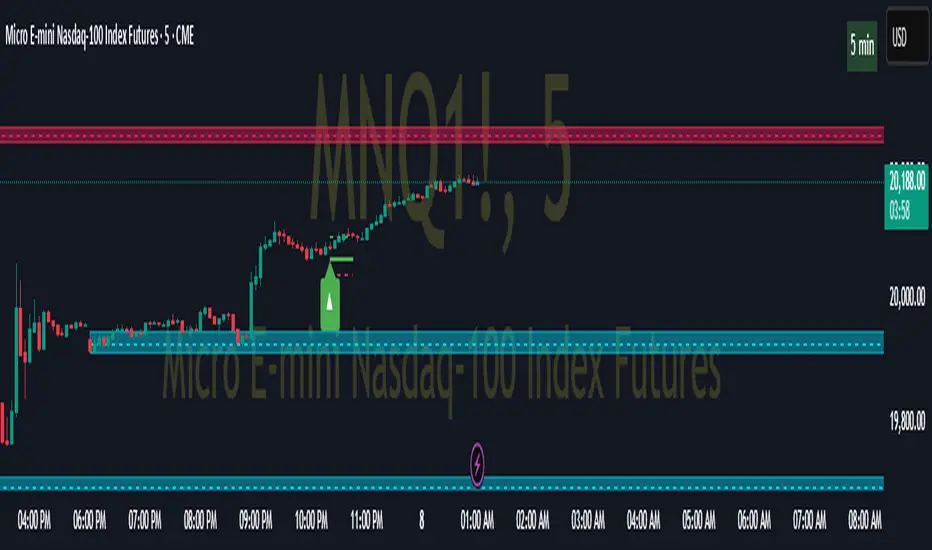
[FN] Strategy - Store Level on ConditionThis is a function that you can use in strategies. Not a strategy in and of itself.
Example thumbnail is showing the function applied to a strategy.
Oftentimes, I am asked a question regarding how to hold a variable at a specific, constant level over a conditional period of time. This question is always asked in a very long convoluted way like "I want the strategy to know what the high of the last pivot was while I'm in a long." or some other variation of wanting a script to remember something from prior bars.
This function is designed to store a price or some numeric level on the bar that your conditional (bool) statements determine that it should be stored. In this construct, you would set conditional statement(s) to flip the 'hold condition' to be true on the next bar, then hold that value until either the "hold condition" is no longer true or the initial conditions trigger again, causing an update to the level that you want to capture.
You still have to come up with the logic for the start condition and hold condition on your own, but I've provided an example that should give you an idea of how to accomplish this and customize/deploy the function for your purposes.
The function will return 'na' when neither the start condition nor hold condition are true. There's multiple ways to implement this and variations on how the level is chosen. I've written extensive notes in the script to guide you through the logic behind the function. My hope is that it will be useful to those trying to build strategies or anyone attempting to get their script to remember a level under given conditions.
In the thumbnail example, the take profit level is defined at the beginning of the trade and held until the take profit order executes. The order execution is a separate matter. However, storing the take-profit level at a static value is key to telling the strategy.exit() function what price to execute a limit exit order at.
Example: strategy.exit("Exit Long", from_entry = "long", qty_percent = 100, limit = stored_value)
Let me know how it works out for you and if I can be of any assistance.
Note: Strategy results are mainly derived from the fact that the strategy is long-only, the NQ only goes up, and there is no stop loss in place. So don't ask for the specific strategy, because unless you're trading a single contract with a $500,000 account, you'll probably get liquidated using this strategy as it is presented.
