Adaptive Trend Cloud + Smart Reversal Zones [@darshakssc]This indicator combines a volatility-adjusted trend cloud with RSI- and volume-based reversal signals to help traders visually spot potential trend continuation or reversal zones.
It’s designed to look clean, colorful, and informative — great for both beginners and experienced traders looking for chart clarity and actionable insights.
🔍 How It Works
🔵 1. Trend Cloud
1. The cloud is created using a 34-period EMA as the base and adjusted with a 14-period ATR multiplier.
2. When price is above the EMA, the cloud turns green (bullish).
3. When price is below the EMA, it turns red (bearish).
4. A neutral gray tone shows when price is inside the cloud, signaling potential indecision.
🔁 2. Smart Reversal Signal Logic
1. Signals appear only when price enters the cloud zone, indicating a potential change in direction.
2. To confirm the reversal, the following conditions must also be met:
3. RSI is below 40 (for bullish reversals) or above 60 (for bearish reversals)
4. A volume spike occurs (1.8× the 20-bar volume average)
5. A cooldown of 10 bars between signals prevents overplotting
🎯 3. TP & SL Labels
1. When a valid buy or sell signal appears:
🎯 TP (Take Profit) is placed at 2× ATR distance
🛑 SL (Stop Loss) is placed at 1× ATR distance
These levels are shown via chart labels for visual reference
🛎️ 4. Alerts
1. Built-in alerts trigger on:
🟢 Buy reversal signals
🔴 Sell reversal signals
✅ How to Use
1. Apply the indicator to any chart (works best on 5min–4h timeframes)
2. Look for the 🟢 Buy / 🔴 Sell labels when price touches the cloud
3. Use the visual TP/SL markers as reference zones — not financial advice
4. Combine with your own risk management, price action or confluence tools
⚙️ Customization Options
1. EMA & ATR lengths and multipliers
2. RSI and volume thresholds
3. Signal cooldown to reduce noise
4. Toggle TP/SL zones on or off
⚠️ Disclaimer
This script is for educational purposes only and does not constitute financial advice. Always test on demo accounts and combine with your own trading system.
חפש סקריפטים עבור "price action"

Macro Nexus Model | MrAlvarezMacro Nexus Model (MNM)
The Macro Nexus Model (MNM) is a sophisticated, next-generation oscillator engineered to synthesise the intricate dynamics of the global financial system into an actionable signal. Where traditional indicators are limited to price action, the MNM provides a quantitative measure of the underlying macro forces driving assets like Bitcoin.
Key Features:
Dynamic & Regime-Aware: Unlike static indicators, the MNM is built on a dynamic engine that identifies the prevailing market regime. It understands that the factors driving the market during periods of expansion are fundamentally different from those that matter during systemic contractions.
Intelligent, Self-Adjusting Weights: At its core, the MNM analyses a diverse basket of global macro inputs—including global growth indicators, credit spreads, central bank liquidity, and safe-haven flows. The indicator's proprietary engine continuously and smoothly adjusts the importance of each of these factors based on its real-time assessment of the global risk environment.
The Macro Trend Line: The final output is a single, smoothed line representing the net macro pressure on risk assets. A positive value indicates a supportive, expansionary environment, while a negative value signals a contractionary environment where caution is warranted.
Automated Divergence Detection: The MNM automatically identifies and plots powerful bullish and bearish divergences between the macro trend and price, providing clear, early warnings of potential market tops and bottoms.
The Macro Nexus Model is more than an indicator; it is a sophisticated dashboard for quantifying the primary forces driving the market. Use it to elevate your analysis, gain a decisive edge, and make more informed, data-driven decisions.

Liquidity Trap Zones [PhenLabs]📊 Liquidity Trap Zones
Version: PineScript™ v6
📌 Description
The goal of the Liquidity Trap Zones indicator is to try and help traders identify areas where market liquidity appears abundant but is actually thin or artificial, helping traders avoid potential fake outs and false breakouts. This advanced indicator analyzes the relationship between price wicks and volume to detect “mirage” zones where large price movements occur on low volume, indicating potential liquidity traps.
By highlighting these deceptive zones on your charts, the indicator helps traders recognize where institutional players might be creating artificial liquidity to trap retail traders. This enables more informed decision-making and better risk management when approaching key price levels.
🚀 Points of Innovation
Mirage Score Algorithm: Proprietary calculation that normalizes wick size relative to volume and average bar size
Dynamic Zone Creation: Automatically generates gradient-filled zones at trap locations with ATR-based sizing
Intelligent Zone Management: Maintains clean charts by limiting displayed zones and auto-updating existing ones
Scale-Invariant Design: Works across all assets and timeframes with intelligent normalization
Real-Time Detection: Identifies trap zones as they form, not after the fact
Volume-Adjusted Analysis: Incorporates tick volume when available for more accurate detection
🔧 Core Components
Mirage Score Calculator: Analyzes the ratio of price wicks to volume, normalized by average bar size
ATR-Based Filter: Ensures only significant price movements are considered for trap zone creation
EMA Smoothing: Reduces noise in the mirage score for clearer signals
Gradient Zone Renderer: Creates visually distinct zones with multiple opacity levels for better visibility
🔥 Key Features
Real-Time Trap Detection: Identifies liquidity mirages as they develop during live trading
Dynamic Zone Sizing: Adjusts zone height based on current market volatility (ATR)
Smart Zone Management: Automatically maintains a clean chart by limiting the number of displayed zones
Customizable Sensitivity: Fine-tune detection parameters for different market conditions
Visual Clarity: Gradient-filled zones with distinct borders for easy identification
Status Line Display: Shows current mirage score and threshold for quick reference
🎨 Visualization
Gradient Trap Zones: Purple gradient boxes with darker centers indicating trap strength
Mirage Score Line: Orange line in status area showing current liquidity quality
Threshold Reference: Gray line showing your configured detection threshold
Extended Zone Display: Zones automatically extend forward as new bars form
📖 Usage Guidelines
Detection Settings
Smoothing Length (EMA) - Default: 10 - Range: 1-50 - Description: Controls responsiveness of mirage score. Lower values make detection more sensitive to recent price action
Mirage Threshold - Default: 5.0 - Range: 0.1-20.0 - Description: Score above this level triggers trap zone creation. Higher values reduce false positives but may miss subtle traps
Filter Settings
ATR Length for Range Filter - Default: 14 - Range: 1-50 - Description: Period for volatility calculation. Standard 14 works well for most timeframes
ATR Multiplier - Default: 1.0 - Range: 0.0-5.0 - Description: Minimum bar range as multiple of ATR. Higher values filter out smaller moves
Display Settings
Zone Height Multiplier - Default: 0.5 - Range: 0.1-2.0 - Description: Controls trap zone height relative to ATR. Adjust for visual preference
Max Trap Zones - Default: 5 - Range: 1-20 - Description: Maximum zones displayed before oldest are removed. Balance clarity vs. history
✅ Best Use Cases
Identifying potential fakeout levels before entering trades
Confirming support/resistance quality by checking for liquidity traps
Avoiding stop-loss placement in trap zones where sweeps are likely
Timing entries after trap zones are cleared
Scalping opportunities when price approaches known trap zones
⚠️ Limitations
Requires volume data - less effective on instruments without reliable volume
May generate false signals during news events or genuine volume spikes
Not a standalone system - combine with price action and other indicators
Zone creation is based on historical data - future price behavior not guaranteed
💡 What Makes This Unique
First indicator to specifically target liquidity mirages using wick-to-volume analysis
Proprietary normalization ensures consistent performance across all markets
Visual gradient design makes trap zones immediately recognizable
Combines multiple volatility and volume metrics for robust detection
🔬 How It Works
1. Wick Analysis: Calculates upper and lower wicks for each bar. Normalizes by average bar size to ensure scale independence
2. Mirage Score Calculation: Divides total wick size by volume to identify thin liquidity. Applies EMA smoothing to reduce noise. Scales result for optimal visibility
3. Zone Creation: Triggers when smoothed score crosses threshold. Creates gradient boxes centered on trap bar. Sizes zones based on current ATR for market-appropriate scaling
💡 Note: Liquidity Trap Zones works best when combined with traditional support/resistance analysis and volume profile indicators. The zones highlight areas of deceptive liquidity but should not be the sole factor in trading decisions. Always use proper risk management and confirm signals with price action.

HMA Trend Line (Croc Signal Line)HMA Trend Line (Croc Signal Line) — The Ultimate Hull Moving Average Trend Indicator
Full English description here:
What is the HMA Trend Line (Croc Signal Line)?
The HMA Trend Line (Croc Signal Line) is a powerful, adaptive trend indicator for TradingView, based on the Hull Moving Average (HMA). This indicator is designed to help traders identify real market trends with less lag and reduced noise compared to traditional moving averages like SMA (Simple Moving Average) and EMA (Exponential Moving Average).
Why use the HMA Trend Line?
+ Faster Trend Detection: The Hull Moving Average (HMA) responds more quickly to price action, giving you earlier buy and sell signals.
+ Smoother and Cleaner: It provides a visually clean trend line that avoids the choppiness of classic EMAs and SMAs.
+ Reduced Lag: The HMA Trend Line follows the market closer, helping you avoid late entries or exits and spot trend reversals sooner.
+ Dynamic Support and Resistance: Use the line as a dynamic support or resistance to manage trades and identify pullbacks or breakouts.
What does “Croc Signal Line” mean?
The “Croc” in Croc Signal Line stands for:
+ Clean
+ Responsive
+ Optimized
+ Curve
This highlights the unique advantage of this indicator: a curve that is both fast-reacting and smooth, helping traders focus on real trends and filter out market noise.
How does the Hull Moving Average (HMA) work?
The HMA was developed by Alan Hull and uses weighted moving averages and a unique calculation to deliver both responsiveness and smoothness. Unlike standard moving averages, the HMA reacts faster to new price moves and avoids false signals in ranging or volatile markets.
How to use the HMA Trend Line (Croc Signal Line) on TradingView?
+ Watch for price crossing above the trend line for potential bullish signals, and below for bearish signals.
+ Use on any timeframe: from 1-minute scalping to daily, weekly, or even monthly charts.
+ Works with all asset classes: Forex, stocks, indices, cryptocurrencies, commodities, and futures.
+ Combine with other indicators (like Stochastics, RSI, or volume) for confirmation and to build your unique trading strategy.
+ Adjust the Signal Line Period for your market and style: shorter periods for faster markets, longer for smoother trends.
Who should use this indicator?
+ Day traders, swing traders, and long-term investors looking for reliable, actionable trend signals.
+ Anyone seeking a cleaner, more responsive alternative to the classic moving averages.
+ Traders who want a simple, visually clear way to filter out market noise and see real price direction.
Disclaimer:
This indicator is for educational and study purposes only. Please perform your own backtesting and analysis before using it in live trading. This script does not constitute financial advice. Use at your own risk.
--------

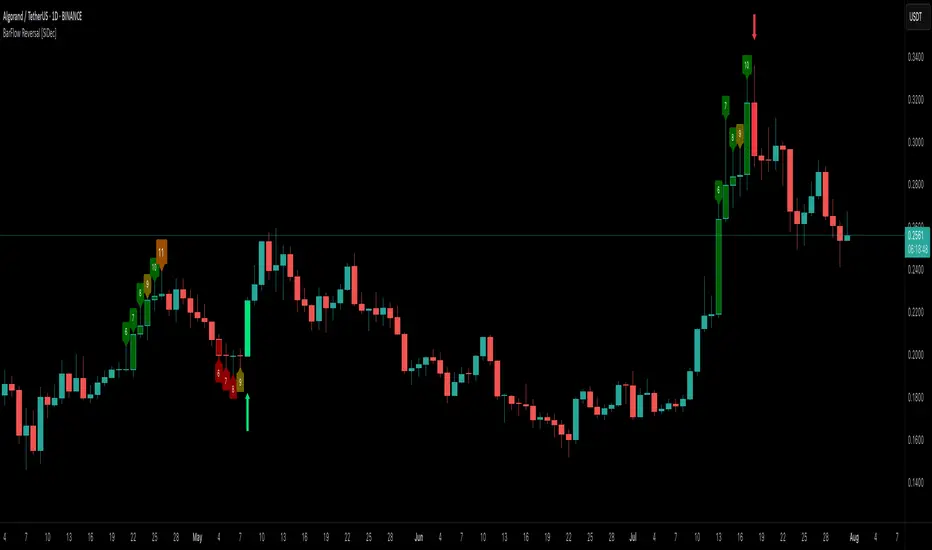
BarFlow Reversal [SiDec]BarFlow Reversal is a powerful indicator designed to help traders spot momentum exhaustion and potential turning points using consecutive candle streaks. It tracks up- and down-runs, highlights key exhaustion counts (like 9, 11, 13, 15), and provides clean visual signals alongside an optional multi-timeframe dashboard — giving you a powerful, customisable momentum map right on your chart.
Overview
Main Components
1. Run Counters
gCnt increments on up‑closes or dojis; rCnt increments on down‑closes or dojis.
seqCount is the larger of those two, and only streaks at or above your Min Consecutive
Special “strong” counts are emphasised with larger labels and unique colours.
2. Reversal Signals
➡️ An arrow plots when a streak of at least your Reversal Threshold is followed by:
A candle closing opposite the streak
Volume above a configurable multiple of its 25‑bar average
ATR expanding
➡️ Arrows come in three strengths (Weak, Strong, Max) based on the prior streak length and your predefined “strong” counts.
3. Bar Shading
Optionally tint each bar during an active run for instant visual feedback on trend direction and strength.
4. Multi‑Timeframe Dashboard
Displays current vs. previous run counts on 1H, 4H, 12H, Daily, Weekly, and Monthly.
Colour‑coded cells show direction and highlight special counts, so you can quickly assess broader momentum.
5. Clean Label Management
Automatically removes outdated streak labels to keep your chart uncluttered.
Labels are positioned just above or below bars and offset slightly to avoid overlap.
Inputs at a Glance
Appearance: Choose Classic, Mono, or Manual theme; set Dark/Light background.
Counting: Define minimum streak length, list of strong counts, and toggle bar shading.
Trend & Filters: Adjust volume multiplier, reversal threshold, and enable/disable arrow plotting.
Dashboard & Cleanup: Show or hide the multi‑timeframe table; auto‑clear old labels.
Colours: Fully customise run labels, special counts, arrows, and dashboard.
Important Trading Note
BarFlow Reversal is not a standalone indicator.
It’s designed to be used in combination with other confluence factors — such as key support/resistance levels, supply/demand zones, VWAP, Fibonacci, liquidity zones, or your preferred price action setups.
While BarFlow Reversal can help you identify moments of exhaustion or likely reversals, it does not provide full trade signals on its own.
Make sure to combine it with proper confirmation tools and risk management before entering trades.
Here are some example screenshots of this indicator in action:
Quick Start
Once you click “Add to favorites,” you’ll find BarFlow Reversal under Indicators for quick use on any chart.
Tweak inputs to match your trading style: set streak lengths, arrow sensitivity, and colour themes.
Watch as BarFlow Reversal highlights exhaustion points and reversal opportunities—across all your favorite timeframes.
If you find it helpful, feel free to leave a like or comment and let me know how you use BarFlow Reversal in your own trading!
Happy trading! 📈
Ralph Indicator - ZaraTrust Smart MoneyThe Ralph Indicator – ZaraTrust Smart Money is a powerful yet simple Smart Money Concepts (SMC) based tool designed for traders who want to trade like institutions. It auto-detects high-probability Buy/Sell zones, Support/Resistance levels, and Demand/Supply areas on the chart — giving you clear, visual, and actionable signals without the clutter.
⸻
🔍 Key Features:
✅ Smart Money Structure
• Uses pivot-based logic to identify potential structure points
• Helps you understand market flow (e.g., BOS, CHoCH simplified logic)
✅ Automatic Support & Resistance
• Plots major levels based on significant highs and lows
• Helps catch key reversal or breakout zones
✅ Demand & Supply Zones
• Visually shows areas where price may react strongly
• Based on smart pivot detection from recent swings
✅ Buy/Sell Trade Signals
• Highlights buy when price breaks resistance (possible bullish shift)
• Highlights sell when price breaks support (possible bearish shift)
✅ Clean & Easy UI
• Toggle features on/off from settings panel
• Labels and shapes are plotted clearly on the chart for instant reading
⸻
🛠️ Recommended Use:
• Use on 15min to 4H timeframe for intraday or swing trading
• Combine with price action (e.g., confirmation candles, liquidity grab)
• Works best when paired with institutional logic (OBs, FVG, liquidity)
⸻
⚠️ Disclaimer:
This indicator is a tool, not a signal service.
It does not guarantee 98% accuracy, but it’s designed to highlight smart money zones and high-probability areas. Always do your own risk management and backtest before using on a live account.

Signalgo S/RSignalgo S/R
Signalgo S/R is a cutting-edge TradingView indicator engineered for traders who want to leverage support and resistance (S/R) in a way that goes far beyond traditional methods. This overview will help you understand its unique approach, inputs, entry and exit strategies, and what truly sets it apart.
How Signalgo S/R Works
Multi-Timeframe S/R Detection
Layered Analysis: Signalgo S/R continuously scans price action across a wide spectrum of timeframes, from 1 minute up to 3 months. This multi-layered approach ensures that both short-term and long-term S/R levels are dynamically tracked and updated.
Advanced Pivot Recognition: Instead of simply plotting static lines, the indicator uses a sophisticated pivot recognition system to identify only the most relevant and recent S/R levels, adapting as the market evolves.
Synchronized Structure: By aligning S/R levels across timeframes, it builds a robust market structure that highlights truly significant zones—areas where price is most likely to react.
Intelligent Breakout & Reversal Signals
Close Confirmation: The indicator only triggers a breakout or breakdown signal when price not just touches, but closes beyond a key S/R level, dramatically reducing false signals.
Multi-Timeframe Confirmation: True buy or sell signals require agreement across several timeframes, filtering out noise and improving reliability.
One-Time Event Detection: Each breakout or breakdown is recognized only once per occurrence, eliminating repetitive signals from the same event.
Inputs & User Controls
Preset Parameters:
Pivot Length: Adjusts how sensitive the S/R detection is to price swings.
Label Offset: Fine-tunes the placement of visual labels for clarity.
Trade Management Controls:
Show TP/SL Logic: Toggle to display or hide take-profit (TP) and stop-loss (SL) levels.
ATR Length & Multipliers: Adapt SL and TP distances to current volatility.
Enable Trailing Stop: Option to activate dynamic stop movement after TP1 is reached.
Entry & Exit Strategy
Entry Logic
Long (Buy) Entry: Triggered when multiple timeframes confirm a breakout above resistance, signaling strong upward momentum.
Short (Sell) Entry: Triggered when multiple timeframes confirm a breakdown below support, indicating strong downward momentum.
Exit & Trade Management
Stop Loss (SL): Automatically set based on recent volatility, always adapting to current market conditions.
Take Profits (TP1, TP2, TP3): Three profit targets are set at increasing reward multiples, allowing for partial exits or scaling out.
Trailing Stop: After the first profit target is reached, the stop loss moves to breakeven and a trailing stop is activated, locking in gains as the trade continues.
Event Markers: Each time a TP or SL is hit, a visual label is placed on the chart for full transparency.
What Separates Signalgo S/R from Traditional S/R Indicators?
True Multi-Timeframe Synchronization: Most S/R tools only look at a single timeframe or plot static levels. Signalgo S/R dynamically aligns levels across all relevant timeframes, providing a comprehensive market map.
Event-Driven, Not Static: Instead of plotting every minor swing, it intelligently filters for only the most actionable S/R levels and signals—reducing chart clutter and focusing attention on what matters.
Breakout Confirmation Logic: Requires a close beyond S/R, not just a wick, to validate breakouts or breakdowns. This greatly reduces false positives.
Automated, Adaptive Trade Management: Built-in TP/SL and trailing logic mean you get not just signals, but a full trade management suite—something rarely found in standard S/R indicators.
Visual & Alert Integration: Every signal, TP/SL event, and trailing stop is visually marked and can trigger TradingView alerts, keeping you informed in real time.
Trading Strategy Application
Scalping to Swing Trading: The multi-timeframe logic makes it suitable for all trading styles, from fast intraday moves to longer-term position trades.
Systematic, Disciplined Execution: By automating entries, exits, and risk management, Signalgo S/R helps you trade with confidence and consistency, removing emotion from the process.
Noise Reduction: The advanced filtering logic means you only see the highest-probability setups, helping you avoid common S/R “fakeouts.”

Jags Dynamic S/R with Breakout & Weakness SignalsThis script is designed to automatically identify and display significant support and resistance levels on your chart. It then goes a step further by actively monitoring for potential breakouts and signs of support weakness.
Core Functionality: Identifying Key Levels
At its heart, the script uses a pivot logic to find recent price highs and lows, which it then plots as horizontal lines representing potential resistance and support, respectively. You have full control over how these levels are identified:
Timeframe: You can choose to find these pivot points on the current chart's timeframe or a higher one (e.g., daily pivots on an hourly chart).
Lookback Period: You can define how many bars to the left and right of a pivot point the script should consider, allowing you to fine-tune the significance of the levels it identifies.
Line Management: To keep your chart clean, you can set the maximum number of support and resistance lines to display. The script also has a clever "merge" feature that combines new pivot levels with existing ones if they are very close together, preventing clutter.
Breakout Detection
A key feature of this indicator is its ability to signal when the price breaks through one of these identified support or resistance levels. You can enable or disable this feature and choose from several confirmation methods to suit your trading style:
Simple Price Action: A breakout is confirmed simply by the price closing above a resistance level or below a support level.
ATR (Average True Range): For a breakout to be valid, the price must close a certain distance (based on the ATR) beyond the level, filtering out minor fluctuations.
Volume: This option adds another layer of confirmation by requiring a significant increase in trading volume during the breakout, suggesting strong conviction behind the move.
Momentum: This method uses the RSI (Relative Strength Index) to confirm that the breakout is supported by strong underlying momentum.
Quantitative: A more advanced option that uses a combination of the Rate of Change (ROC) and a Volume-Weighted Moving Average (VWMA) to provide a robust, multi-faceted confirmation of the breakout.
When a confirmed breakout occurs, the script will:
Color the breakout bar green for a bullish breakout (upward) or red for a bearish breakout (downward).
Place an arrow below a bullish breakout or above a bearish breakout.
Trigger an alert to notify you of the event.
Support Weakness Detection
To provide an early warning of a potential breakdown, the script includes a unique "Support Weakness Detection" feature. When enabled, it looks for a specific confluence of bearish signals as the price approaches a support level:
The price is hovering just above a key support level.
The short-term trend has already turned bearish (based on a moving average).
Momentum is fading (indicated by a falling RSI).
If all these conditions are met, a blue down-arrow will appear above the price bar, signalling that the nearby support may not hold.
Candle Emotion Oscillator [CEO]Candle Emotion Oscillator (CEO) - Revolutionary User Guide
🧠 World's First Market Psychology Oscillator
The Candle Emotion Oscillator (CEO) is a groundbreaking indicator that measures market emotions through pure candle price action analysis. This is the first oscillator ever created that translates candle patterns into psychological states, giving you unprecedented insight into market sentiment.
🚀 Revolutionary Concept
What Makes CEO Unique
100% Pure Price Action: No volume, no external data - just candle analysis
Market Psychology: Measures actual emotions: Fear, Greed, Panic, Euphoria
Never Been Done Before: First oscillator to analyze market emotions
Exhaustion Prediction: Detects emotional fatigue before reversals
Fast Response: Perfect for your 2-5 minute scalping setup
The Four Core Emotions
🟢 GREED (Positive Values)
What it measures: Market conviction and decisiveness
Candle Pattern: Large bodies, small wicks
Psychology: Traders are confident and decisive
Oscillator: Positive values (0 to +100)
Trading Implication: Trend continuation likely
🔴 FEAR (Negative Values)
What it measures: Market uncertainty and indecision
Candle Pattern: Small bodies, large wicks
Psychology: Traders are uncertain and hesitant
Oscillator: Negative values (0 to -100)
Trading Implication: Consolidation or reversal likely
🚀 EUPHORIA (Extreme Positive)
What it measures: Excessive optimism and buying pressure
Candle Pattern: Large green bodies with upper wicks
Psychology: Extreme bullish sentiment
Oscillator: Values above +60
Trading Implication: Overbought, reversal warning
💥 PANIC (Extreme Negative)
What it measures: Capitulation and selling pressure
Candle Pattern: Large red bodies with lower wicks
Psychology: Extreme bearish sentiment
Oscillator: Values below -60
Trading Implication: Oversold, reversal opportunity
📊 Visual Elements Explained
Main Components
Thick Colored Line: Primary emotion oscillator
Green: Greed (positive emotions)
Red: Fear (negative emotions)
Bright Green: Euphoria (extreme positive)
Dark Red: Panic (extreme negative)
Thin Blue Line: Emotion trend (longer-term context)
Background Gradient: Emotional intensity
Darker = stronger emotions
Lighter = weaker emotions
Diamond Signals: 🔶 Emotional exhaustion detected
Rocket Signals: 🚀 Extreme euphoria warning
Explosion Signals: 💥 Extreme panic warning
Information Table (Top Right)

Hour-Stats v2cHour-Stats Indicator
The Hour-Stats indicator is a powerful, data-driven tool designed specifically for NQ futures traders who rely on statistically significant hourly price action probabilities. While traditional indicators typically focus only on the likelihood of prices returning to the opening price, Hour-Stats distinguishes itself by offering detailed statistical analysis across multiple critical price points.
Leveraging over 15 years of historical data, this indicator provides traders with robust probabilities for three unique hourly metrics:
Return to Hourly Open – The percentage likelihood of price revisiting the hourly open after breaking the high or low.
Return to Previous Hour Midpoint (PHM) – Offers clear probabilities of price returning to the midpoint (50%) of the previous hour’s range, a valuable metric for gauging reversals and continuations.
Opposite Extreme Targeting – Calculates the statistical likelihood of price moving to the opposite end (high or low) of the previous hour’s candle range, offering actionable insights for range trading strategies.
Additionally, Hour-Stats presents the historical probabilities of hourly highs and lows forming within three distinct 20-minute segments of each trading hour. This breakdown gives traders a precise understanding of when peaks or troughs are most likely, enhancing entry and exit timing.
The indicator’s settings are highly customizable, allowing traders to personalize visuals such as vertical and horizontal line colors, line styles (dotted, dashed, solid), and line thickness. Further customization includes label sizing, label positioning, and the ability to adjust visual dimming of swept price levels, providing clarity and ease of use during live market conditions.
Inspired by NQ Stats' concept (details available at nqstats, Hour-Stats expands significantly upon the original idea, delivering a uniquely comprehensive suite of hourly probability analytics for informed decision-making in futures trading.
Disclaimer: Futures trading involves significant risk. Traders should conduct their own due diligence and are responsible for their trading outcomes. Historical probabilities do not guarantee future results.

IME's Community First Presented FVGsIME's Community First Presented FVGs v1.5 - Advanced Implementation
ORIGINALITY & INNOVATION
This indicator advances beyond basic Fair Value Gap detection by implementing a sophisticated 24-hour FVG lifecycle management system aligned with institutional trading patterns. While many FVG indicators simply detect gaps and extend them indefinitely, this implementation introduces temporal intelligence that mirrors how institutional algorithms actually manage these inefficiencies.
Key Innovations that set this apart:
- 24-Hour Lifecycle Management: FVGs extend dynamically until 16:59, then freeze until removal at 17:00 next day
- Institutional Day Alignment: Recognizes 18:00-16:59 trading cycles vs standard calendar days
- Multi-Session Detection: Simultaneous monitoring of Midnight, London, NY AM, and NY PM sessions
- Advanced Classification System: A.FVG detection with volume imbalance analysis vs classic FVG patterns
- Volatility Settlement Logic: Blocks contamination from opening mechanics (3:01+, 0:01+, 13:31+ rules)
- Visual Enhancement System: C.E. lines, contamination warnings, dark mode support with proper transparency handling
BASED ON ICT CONCEPTS
This indicator implements First Presented Fair Value Gap methodology taught by ICT (Inner Circle Trader). The original F.P. FVG concepts, timing rules, and session-based detection are credited to ICT's educational material. This implementation extends those foundational concepts with advanced lifecycle management and institutional alignment features.
ICT's Core F.P. FVG Rules Implemented:
- First clean FVG after session opening (avoids opening contamination)
- 3-candle pattern requirement for valid detection
- Session-specific timing windows and volatility settlement
- Consequent Encroachment level identification
IME's Advanced Enhancements:
- Automated lifecycle management with institutional day recognition
- Multi-session simultaneous monitoring with proper isolation
- Advanced visual system with transparency states for aged FVGs
- A.FVG classification with volume imbalance detection algorithms
HOW IT WORKS
Core Detection Engine
The indicator monitors four key institutional sessions using precise timing windows:
- Midnight Session: 00:01-00:30 (blocks 00:00 contamination)
- London Session: 03:01-03:30 (blocks 03:00 contamination)
- NY AM Session: 09:30-10:00 (configurable 9:30 detection)
- NY PM Session: 13:31-14:00 (blocks 13:30 contamination)
During each session window, the algorithm scans for the first valid FVG pattern using ICT's 3-candle rule while applying volatility settlement principles to avoid false signals from opening mechanics.
Advanced Classification System
Classic FVG Detection:
Standard 3-candle wick-to-wick gap where candle 1 and 3 don't overlap, creating an inefficiency that institutions must eventually fill.
A.FVG (Advanced FVG) Detection:
Enhanced pattern recognition that includes volume imbalance analysis (deadpool detection) to identify more significant institutional inefficiencies. A.FVGs incorporate both the basic gap plus additional price imbalances between candle bodies, creating larger, more significant levels.
24-Hour Lifecycle Management
Phase 1 - Dynamic Extension (Creation Day):
From detection until 16:59 of creation day, FVGs extend in real-time as new bars form, maintaining their relevance as potential support/resistance levels.
Phase 2 - Freeze Period (Next Day):
At 16:59, FVGs stop extending and "freeze" at their final size, remaining visible as reference levels but no longer growing. This prevents outdated levels from contaminating fresh analysis.
Phase 3 - Cleanup (17:00 Next Day):
Exactly 24+ hours after creation, FVGs are automatically removed to maintain chart clarity. This timing aligns with institutional trading cycle completion.
Institutional Day Logic
The algorithm recognizes that institutional trading days run from 18:00-16:59 (not midnight-midnight). This alignment ensures FVGs are managed according to institutional timeframes rather than arbitrary calendar boundaries.
Contamination Avoidance System
Volatility Settlement Principle:
Opening mechanics create artificial volatility that can produce false FVG signals. The indicator automatically blocks detection during exact session opening times (X:00) and requires settlement time (X:01+) before identifying clean institutional inefficiencies.
Special NY AM Handling:
Provides configurable 9:30 detection for advanced users who want to capture potential opening range FVGs, with clear visual warnings about contamination risk.
VISUAL SYSTEM
Color Intelligence
- Current Day FVGs: Full opacity with session-specific colors
- Previous Day FVGs: 70% transparency for historical reference
- Special Timing (9:30): Dedicated warning color with alert labels
- Dark Mode Support: Automatic text/line color adaptation
Enhanced Visual Elements
C.E. (Consequent Encroachment) Lines:
Automatically calculated 50% levels within each FVG, representing the most likely fill point based on institutional behavior patterns. These levels extend and freeze with their parent FVG.
Contamination Warnings:
Visual alerts when FVGs are detected during potentially contaminated timing, helping traders understand signal quality.
Session Identification:
Clear labeling system showing FVG type (FVG/A.FVG), session origin (NY AM, London, etc.), and creation date for easy reference.
HOW TO USE
Basic Setup
1. Session Selection: Enable/disable specific sessions based on your trading strategy
2. FVG Type: Choose between Classic FVGs or A.FVGs depending on your analysis preference
3. Visual Preferences: Adjust colors, text size, and enable dark mode if needed
Trading Applications
Intraday Reference Levels:
Use current day FVGs as potential support/resistance for price action analysis. The dynamic extension ensures levels remain relevant throughout the trading session.
Multi-Session Analysis:
Monitor how price interacts with FVGs from different sessions to understand institutional flow and market structure.
C.E. Level Trading:
Focus on the 50% consequent encroachment levels for high-probability entry points when price approaches FVG zones.
Historical Context:
Previous day FVGs (shown with transparency) provide context for understanding market structure evolution across multiple trading days.
Advanced Features
9:30 Special Detection:
For experienced traders, enable 9:30 FVG detection to capture opening range inefficiencies, but understand the contamination risks indicated by warning labels.
A.FVG vs Classic Toggle:
Switch between detection modes based on market conditions - A.FVGs for trending environments, Classic FVGs for ranging conditions.
Best Practices
- Use on 1-minute to 15-minute timeframes for optimal session detection
- Combine with other institutional concepts (order blocks, liquidity levels) for comprehensive analysis
- Pay attention to transparency states - current day FVGs are more actionable than previous day references
- Consider C.E. levels as primary targets rather than full FVG fills
TECHNICAL SPECIFICATIONS
Platform: Pine Script v6 for optimal performance and reliability
Timeframe Compatibility: All timeframes (optimized for 1M-15M)
Market Compatibility: 24-hour markets (Forex, Crypto, Futures)
Session Management: Automatic trading day detection with weekend handling
Memory Management: Intelligent capacity limits with automatic cleanup
Performance: Optimized algorithms for smooth real-time operation
CLOSED SOURCE JUSTIFICATION
This indicator is published as closed source to protect the proprietary algorithms that enable:
- Precise 24-hour lifecycle timing calculations with institutional day alignment
- Advanced A.FVG classification with sophisticated volume imbalance detection
- Complex multi-session coordination with contamination filtering
- Optimized memory management preventing performance degradation
- Specialized visual state management for transparency and extension logic
The combination of these advanced systems creates a unique implementation that goes far beyond basic FVG detection, warranting protection of the underlying computational methods while providing full transparency about functionality and usage.
PERFORMANCE CHARACTERISTICS
Real-Time Operation: Smooth performance with minimal resource usage
Accuracy: Precise session detection with timezone consistency
Reliability: Robust error handling and edge case management
Scalability: Supports multiple simultaneous FVGs without performance impact
This advanced implementation represents significant evolution beyond basic FVG indicators, providing institutional-grade analysis tools for serious traders while maintaining the clean visual presentation essential for effective technical analysis.
IMPORTANT DISCLAIMERS
Past performance does not guarantee future results. This indicator is an educational tool based on ICT's Fair Value Gap concepts and should be used as part of a comprehensive trading strategy. Users should understand the risks involved in trading and consider their risk tolerance before making trading decisions. The indicator identifies potential support/resistance levels but does not predict market direction with certainty.
2 days ago
Release Notes
IME's Community First Presented FVGs v1.5.2 - Critical Bug Fixes
Bug Fixes:
v1.5.1 - Fixed 9:30 Contamination Blocking:
Issue: When 9:30 detection toggle was OFF, script still detected 9:30 candles as F.P. FVGs
Fix: Added proper contamination blocking logic that prevents 9:30 middle candle detection when toggle is OFF
Result: Toggle OFF now correctly shows clean F.P. FVGs at 9:31+ (proper ICT volatility settlement)
v1.5.2 - Fixed A.FVG Box Calculation Accuracy:
Issue: A.FVG boxes incorrectly included ALL body levels even when no actual deadpool existed between specific candles
Fix: Implemented selective body level inclusion - only adds body prices where actual volume imbalances exist
Result: A.FVG boxes now accurately represent only areas with real institutional volume imbalances
Impact:
More Accurate Detection: 9:30 contamination properly blocked when disabled
Precise A.FVG Zones: Boxes only include levels with actual deadpools/volume imbalances
Institutional Accuracy: Both fixes align detection with true institutional trading principles
Technical Details:
Enhanced contamination blocking checks middle candle timing in normal mode
A.FVG calculation now selectively includes body levels based on individual deadpool existence
Maintains backward compatibility with all existing features and settings
These fixes ensure the indicator provides institutionally accurate FVG detection and sizing for professional trading analysis.

Velocity + Momentum (SMA-Based)Velocity + Momentum (SMA-Based) is a clean, powerful oscillator that measures price acceleration using SMA-derived velocity and dual momentum signals. This tool is ideal for identifying directional shifts, exhaustion points, and early entries across any market or timeframe.
How It Works:
This indicator calculates velocity as the distance between the current close and a simple moving average of the open price. Then, it applies two smoothed moving averages to this velocity line:
• Internal Momentum (shorter-term smoothing)
• External Momentum (longer-term context, hidden by default)
The result is a layered view of how fast price is moving and whether that move is gaining or losing strength.
How to Use:
• The green/red histogram shows current velocity (positive = bullish, negative = bearish)
• The teal/maroon line tracks internal momentum and provides short-term signal turns
• The black/gray (hidden) line reflects external momentum and supports broader trend alignment
• Watch for crosses above/below the zero line for confirmation of directional strength
• Use the built-in alerts to catch real-time shifts in all three layers of movement: velocity, internal, and external
Why It's Useful:
• Detects subtle transitions before price structure changes
• Helps filter out noise by comparing short-term vs long-term motion
• Ideal for scalpers, swing traders, and trend-followers alike
• Pairs well with structure-based tools or price action zones
• Works on any asset and timeframe
This indicator simplifies momentum analysis by giving you actionable, multi-layered feedback on how price is accelerating — and when that’s likely to reverse.

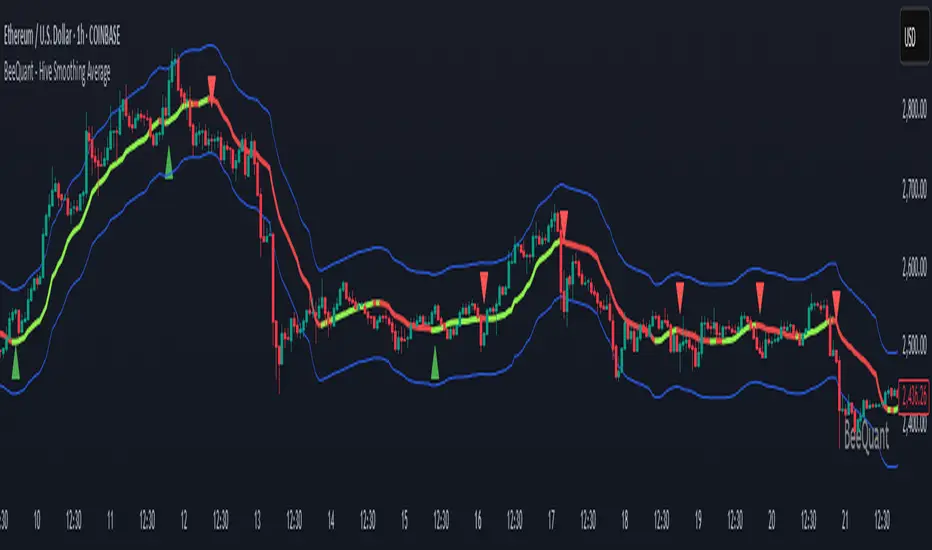
BeeQuant - Hive Smoothing Average🔶 OVERVIEW
The "Hive Smoothing Average" is your gateway to crystal-clear market insights, a truly advanced tool that cuts through confusing price "noise" to reveal the true underlying trend. Imagine having a panoramic view of the market's true direction, unclouded by minor ups and downs. This powerful indicator dynamically filters out market distractions, presenting you with a highly refined line that not only shows you the genuine path of price but also changes color. It’s built for traders who demand clarity and want to confidently spot opportunities that others might miss in messy charts.
__________________________________________________________________________
🧠 CONCEPTS
At its heart, the "Hive Smoothing Average" employs a sophisticated multi-stage processing system to transform raw price data into an incredibly smooth and responsive smoothed moving average line. It's designed to give you an unparalleled view of market direction and momentum.
⬜ Synthesizes multiple smoothing layers to deliver a balanced representation of underlying price action.
⬜ Offers enhanced visual consistency by filtering volatility distortion without delay-based lag.
⬜ Presents color-coded transitions and signal markers to aid in directional conviction and structural flow.
⬜ Embeds a modular smoothing core adaptable across market environments and asset classes.
Hive Smoothing Average doesn't forecast, it refines. It provides a more coherent view of price evolution, allowing for higher-confidence discretion and more robust strategy overlays.
__________________________________________________________________________
✨ FEATURES
Hive Smoothing Average is loaded with flexibility and visual power to enhance your decision-making:
🔹Customizable Smoothing
Tailor the indicator’s core behavior using a wide range of smoothing algorithms — from classic to advanced — to match your trading tempo and asset dynamics.
🔹 Intelligent Color Feedback
The line color dynamically shifts to reflect meaningful trend transitions, offering at-a-glance clarity without crowding your chart.
🔹 Trend Signal Markers
Built-in arrow markers highlight potential transitions in price momentum, acting as subtle nudges to investigate further.
🔹 Multi-Timeframe Ready
Designed to operate cleanly across all timeframes, from scalping micro-trends to monitoring macro cycles.
🔹 External Source Collaboration
Hive Smoothing Average includes two flexible input channels that can seamlessly connect with other indicators on your chart.
🔹 Adaptive Bands
A powerful enhancement to the Hive framework, the optional Standard Deviation Bands add dynamic context to price behavior by highlighting how far price is moving relative to its recent average volatility.
Length: Controls the lookback period for volatility calculation.
Lower values (e.g., 20 – 50) make the bands highly reactive Higher values (e.g., 200 – 500) smooth out the bands (classic envelope systems )
These bands offer valuable visual cues for both volatility expansion and mean reversion potential, especially when combined with Hive’s core candle coloration logic.
🔹Non-Repainting Logic for Historical Reliability
Each "Hive Smoothing Average" is plotted only when its internal reconstruction conditions are fully met and confirmed. This ensures that the historical display of Hive Smoothing Average does not repaint, providing a high degree of reliability and trust in past signals and visualizations.
🔹Cross-Market Versatility
This indicator is engineered to perform with precision across all major markets—whether you're trading forex, commodities, stocks, or indices. Its adaptive logic automatically aligns with the unique volatility and structure of each asset class, delivering consistently reliable insights no matter where you trade.
__________________________________________________________________________
⚙️ USAGE
Getting started with Hive Smoothing Average is seamless and intuitive:
✨ Apply to Any Chart
Simply add the indicator to any asset or timeframe and see immediate transformation in chart clarity.
💹 Source Data Flexibility
Choose your preferred price data source for each smoothing stage (e.g., Close, Open, High, Low), providing complete control over the input feeding the sophisticated smoothing algorithms.
🛠️ Adjust Smoothing Behavior
Choose your preferred initial and final smoothing types (EMA, HMA, ALMA, etc.), and tweak lengths for desired responsiveness or smoothness.
📐 Use Bands for Confluence
Enable the Bands mode to visualize dynamic zones around your smoothed price. Useful for breakout validation and fade zones.
🟩 Green Smoother Line
Indicates strengthening bullish bias and upward progression.
🟥 Red Smoother Line
Suggests weakening or shifting trend toward bearish territory.
📈 Arrow Signals
Upward or downward triangles appear when directional bias changes — confirming subtle pivots in trend behavior.
🎯 Offset Adjustment
Fine-tune the visual positioning of the smoothed line and bands on your chart with a convenient "Offset" input.
📏 Lookback Filter
Activate the “Lookback Filter” setting to remove weaker signals based on custom historical logic. By checking recent candle behavior, it filters out low-quality transitions and only keeps strong, confirmed shifts — helping you avoid noise and stay focused on reliable breakouts.
Experiment with settings based on your trading timeframe. Short-term traders may prefer fast-reactive configurations, while swing or positional traders can explore higher-period smoothings for structural signals.
__________________________________________________________________________
⚠️ LIMITATIONS
While Hive Smoothing Average delivers incredible trend clarity, it’s essential to use it within its designed purpose:
👉 Visual Clarity, Not Trade Calls: This tool enhances visibility of market behavior, not automatic signals. Use it as a trusted lens — not a standalone system.
👉 Reactive, Not Predictive: Hive Smoothing Average responds to price action with refined smoothing. It is not a forecasting model.
👉 Config-Sensitive Output: Different smoothing setups can produce different levels of sensitivity or delay. Calibration matters — explore what fits your asset and style.
👉 Focuses on Price Action Only: It does not integrate volume, fundamentals, or external market influences. It’s engineered purely for price structure refinement.
█ ▒▒▒▒▒▒▒▒▒▒▒▒▒▒▒▒▒▒▒▒▒▒▒ 『•••• ✎ ••••』 ▒▒▒▒▒▒▒▒▒▒▒▒▒▒▒▒▒▒▒▒▒▒▒▒ █
🎯 CONCLUSION
Hive Smoothing Average provides a high-performance, low-noise framework to view price with remarkable clarity. With its adaptive smoothing layers, bands support, and intelligent signal markers, it becomes a powerful tool to enhance your trend confidence and charting efficiency. By furnishing immediate, data-driven feedback on the market's core momentum and signaling critical turning points, it profoundly empowers traders to rapidly ascertain nascent market shifts and identify pivotal directional changes. Seamlessly integrate this sophisticated visual tool within your pre-existing technical analysis architecture to acquire a sharper, more insightful perspective, and fundamentally elevate your strategic acumen, optimizing your decision-making processes to a degree previously unattainable. It's about experiencing the market's true rhythm.
▣▣▣▣▣▣▣▣▣▣▣▣▣▣▣▣▣▣▣▣▣▣▣▣▣▣▣▣▣▣▣▣▣▣▣▣▣▣▣▣▣▣▣▣▣▣▣▣▣▣▣
🚨 RISK DISCLAIMER
Engagement in financial market speculation inherently carries a substantial degree of inherent risk, and the potential for capital diminution, potentially exceeding initial deposits, is a pervasive and non-trivial consideration. All content, algorithmic tools, scripts, articles, and educational materials disseminated by "Hive Smoothing Average" are exclusively purposed for informational and pedagogical objectives, strictly for reference. Historical performance data, whether explicitly demonstrated or implicitly suggested, offers no infallible assurance or guarantee of future outcomes. Users bear sole and ultimate accountability for their individual trading decisions and are emphatically urged to meticulously assess their financial disposition, risk tolerance parameters, and conduct independent due diligence prior to engaging in any speculative market activity.
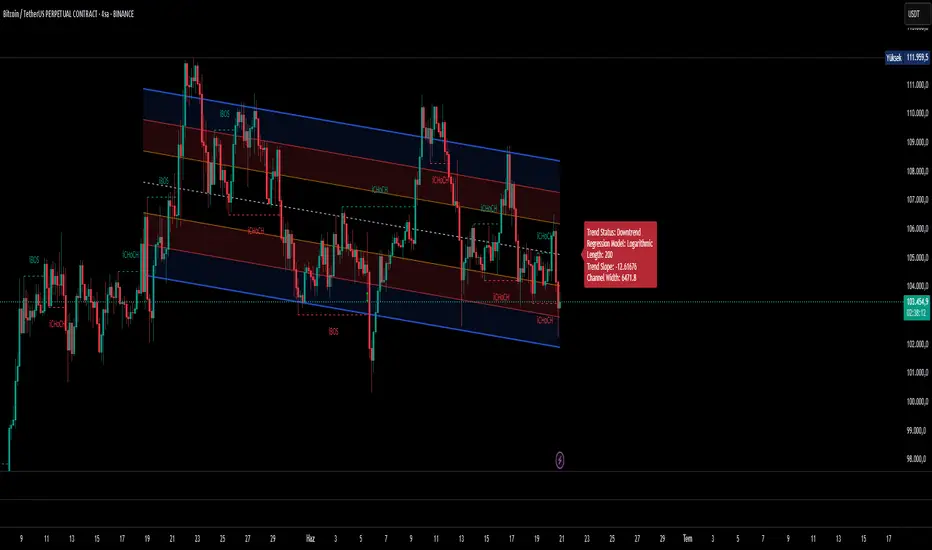
Ultimate Regression Channel v5.0 [WhiteStone_Ibrahim]Ultimate Regression Channel v5.0: Comprehensive User Guide
This indicator is designed to visualize the current trend, potential support/resistance levels, and market volatility through a statistical analysis of price action. At its core, it plots a regression line (a trend line) based on prices over a specific period and adds channels based on standard deviation around this line.
1. Core Features and Settings
Length Mode:
Numerical (Manual): You define the number of bars to be used for the regression channel calculation. You can use lower values (e.g., 50-100) for short-term analysis and higher values (e.g., 200-300) to identify long-term trends.
Automatic (Based on Market Structure): This mode automatically draws the channel starting from the highest high or lowest low that has formed within the Auto Scan Period. This allows the indicator to adapt itself to significant market turning points (swing points), which is highly useful.
Regression Model:
Linear: Calculates the trend as a straight line. It generally works well in stable, short-to-medium-term trends.
Logarithmic: Calculates the trend as a curved line. It more accurately reflects price action, especially on long-term charts or for assets that experience exponential growth/decline (like cryptocurrencies or growth stocks).
Channel Widths:
These settings determine how far from the central trend line (in terms of standard deviations) the channels will be drawn.
The 0 (Inner), 1 (Middle), and 2 (Outer) channels represent the "normal" range of price movement and the "extreme" zones. Statistically, about 95% of all price action occurs within the outer channels (2nd standard deviation).
2. Visual Extras and Their Interpretation
Breakout Style:
This feature alerts you when the price closes above the uppermost channel (Channel 2) with a green arrow/background or below the lowermost channel with a red arrow/background.
This is a very important signal. A breakout can signify that the current trend is strengthening and likely to continue (a breakout/trend-following strategy) or that the market has become overextended and may be due for a reversal (an exhaustion/top-bottom signal). It is critical to confirm this signal with other indicators (e.g., RSI, Volume).
Info Label:
This provides an at-a-glance summary of the channel on the right side of the chart:
Trend Status: Identifies the trend as "Uptrend," "Downtrend," or "Sideways" based on the slope of the centerline. The Horizontal Threshold setting allows you to filter out noise by treating very small slopes as "Sideways."
Regression Model and Length: Shows your current settings.
Trend Slope: A numerical value representing how steep or weak the trend is.
Channel Width: Shows the price difference between the outermost channels. This is a measure of current volatility. A widening channel indicates increasing volatility, while a narrowing one indicates decreasing volatility.
3. What Users Should Pay Attention To & Best Practices
Define Your Strategy: Mean Reversion or Breakout?
Mean Reversion: If the market is in a ranging or gently trending phase, the price will tend to revert to the centerline after hitting the outer channels (overbought/oversold zones). In this case, the outer channels can be considered opportunities to sell (upper channel) or buy (lower channel).
Breakout: If a strong trend is in place, a price close beyond an outer channel can be a sign that the trend is accelerating. In this scenario, one might consider taking a position in the direction of the breakout. Correctly analyzing the current market state (ranging vs. trending) is key to deciding which strategy to employ.
Don't Use It in Isolation: No indicator is a holy grail. Use the Regression Channel in conjunction with other tools. Confirm signals with RSI divergences for overbought/oversold conditions, Moving Averages for the overall trend direction, or Volume indicators to confirm the strength of a breakout.
Choose the Right Model: On shorter-term charts (e.g., 1-hour, 4-hour), the Linear model is often sufficient. However, on long-term charts like the daily, weekly, or monthly, the Logarithmic model will provide much more accurate results, especially for assets with parabolic movements.
The Power of Automatic Mode: The Automatic length mode is often the most practical choice because it finds the most logical starting point for you. It saves you the trouble of adjusting settings, especially when analyzing different assets or timeframes.
Use the Alerts: If you don't want to miss the moment the price touches a key channel line, set up an alert from the Alert Settings section for your desired line (e.g., only the "Outer Channels"). This helps you catch opportunities even when you are not in front of the screen.
5DMA Optional HMA Entry📈 5DMA Optional HMA Entry Signal – Precision-Based Momentum Trigger
Category: Trend-Following / Reversal Timing / Entry Optimization
🔍 Overview:
The 5DMA Optional HMA Entry indicator is a refined price-action entry tool built for traders who rely on clean trend alignment and precise timing. This script identifies breakout-style entry points when price gains upward momentum relative to short-term moving averages — specifically the 5-day Simple Moving Average (5DMA) and an optional Hull Moving Average (HMA).
Whether you're swing trading stocks, scalping ETFs like UVXY or VXX, or looking for pullback recovery entries, this tool helps time your long entries with clarity and flexibility.
⚙️ Core Logic:
Primary Condition (Always On):
🔹 Close must be above the 5DMA – ensuring upward short-term momentum is confirmed.
Optional Condition (Toggled by User):
🔹 Close above the HMA – adds slope-responsive trend filtering for smoother setups. Enable or disable via checkbox.
Bonus Entry Filter (Optional):
🔹 Green Candle Wick Breakout – optional pattern logic that detects bullish momentum when the high pierces above both MAs, with a green body.
Reset Mechanism:
🔁 Signal resets only after price closes back below all active MAs (5DMA and HMA if enabled), reducing noise and avoiding repeated signals during chop.
🧠 Why This Works:
This indicator captures the kind of setups that professional traders look for:
Momentum crossovers without chasing late.
Mean reversion snapbacks that align with fresh bullish moves.
Avoids premature entries by requiring clear structure above moving averages.
Optional HMA filter allows adaptability: turn it off during choppy markets or range conditions, and on during trending environments.
🔔 Features:
✅ Adjustable HMA Length
✅ Enable/Disable HMA Filter
✅ Optional Green Wick Breakout Detection
✅ Visual “Buy” label plotted below qualifying bars
✅ Real-time Alert Conditions for automated trading or manual alerts
🎯 Use Cases:
VIX-based ETFs (e.g., UVXY, VXX): Catch early breakouts aligned with volatility spikes.
Growth Stocks: Time pullback entries during bullish runs.
Futures/Indices: Combine with macro levels for intraday scalps or swing setups.
Overlay on Trend Filters: Combine with RSI, MACD, or VWAP for confirmation.
🛠️ Recommended Settings:
For smooth setups in volatile names, use:
HMA Length: 20
Keep green wick filter ON
For fast momentum trades, disable the HMA filter to act on 5DMA alone.
⭐ Final Thoughts:
This script is built to serve both systematic traders and discretionary scalpers who want actionable signals without noise or lag. The toggleable HMA feature lets you adjust sensitivity depending on market conditions — a key edge in adapting to volatility cycles.
Perfect for those who value clean, non-repainting entries rooted in logical structure.

Session Range ProjectionsSession Range Projections
Purpose & Concept:
Session Range Projections is a comprehensive trading tool that identifies and analyzes price ranges during user-defined time periods. The indicator visualizes high-probability reversal zones and profit targets by projecting Fibonacci levels from custom session ranges, making it ideal for traders who focus on time-based market structure analysis.
Key Features & Calculations:
1. Custom Time Range Analysis
- Define any time period for range calculation - from traditional sessions (Asian, London, NY) to custom periods like opening ranges, hourly ranges, or 4-hour blocks
- Automatically captures the highest and lowest prices within your specified timeframe
- Supports multiple timezone selections for global market analysis
- Flexible enough for intraday scalping ranges or longer-term swing trading setups
2. Premium & Discount Zones
- Automatically divides the range into premium (above 50%) and discount (below 50%) zones
- Visual differentiation helps identify institutional buying and selling areas
- Color-coded boxes clearly mark these critical price zones
3. Optimal Trade Entry (OTE) Zones
- Highlights the 79-89% retracement zone in premium territory
- Highlights the 11-21% retracement zone in discount territory
- These zones represent high-probability reversal areas based on institutional order flow concepts
4. Fibonacci Projections
- Projects 11 customizable Fibonacci extension levels from the range extremes
- Levels extend both above and below the range for symmetrical analysis
- Each level can be individually toggled and color-customized
- Default levels include common retracement ratios: -0.5, -1.0, -2.0, -2.33, -2.5, -3.0, -4.0, -4.5, -6.0, -7.0, -8.0
How to Use:
Set Your Time Range: Input your desired session start and end times (24-hour format)
Select Timezone: Choose the appropriate timezone for your trading session
Customize Display: Toggle various visual elements based on your preferences
Monitor Price Action: Watch for reactions at projected levels and OTE zones
Set Alerts: Configure sweep alerts for when price breaks above/below range extremes
Input Parameters Explained:
Time Range Settings
Range Start/End Hour & Minute: Define your analysis period
Time Zone: Ensure accurate session timing across different markets
Visual Settings
Range Box: Toggle the premium/discount zone visualization
Horizontal Lines: Customize high/low line appearance
Internal Range Levels: Show/hide equilibrium and OTE zones
Labels: Configure text display for key levels
Fibonacci Projections: Enable/disable extension levels
Display Settings
Historical Ranges: Show up to 10 previous session ranges
Alert Type: Choose between high sweep, low sweep, or both
Trading Applications:
Session-Based Trading: Analyze specific market sessions (Asian, London, New York, opening ranges, hourly ranges)
Reversal Trading: Identify high-probability reversal zones at OTE levels
Breakout/Reversal Trading: Monitor range breaks/reversals with built-in sweep alerts
Risk Management: Use Fibonacci projections as profit targets or rejection areas
Multi-Timeframe Analysis: Apply to any timeframe for various trading styles
Important Notes:
This indicator is for educational purposes only and should not be considered financial advice
Past performance does not guarantee future results
Always use proper risk management when trading
The indicator automatically manages historical data to maintain chart performance

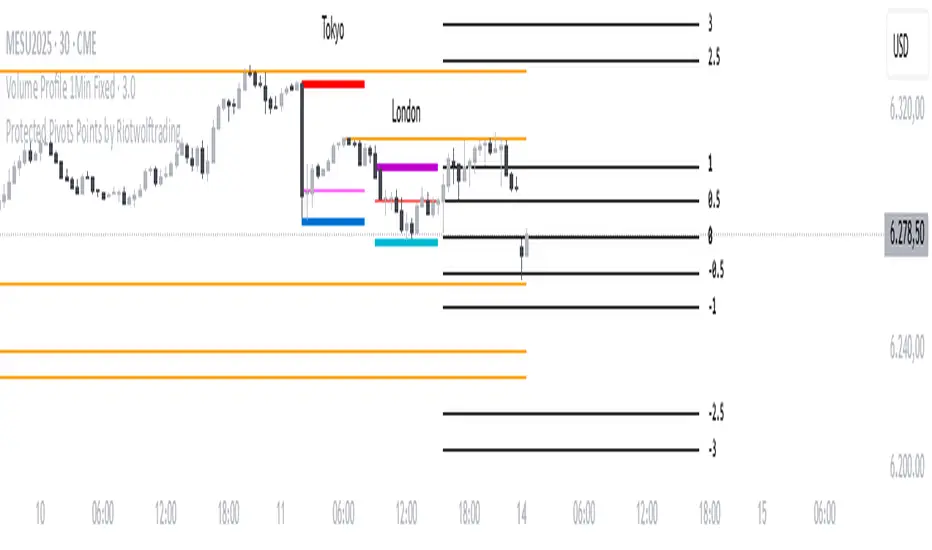
Protected Pivots Points by RiotwolftradingProtected Pivots Points by Riotwolftrading
---
You have an advanced visual tool designed for traders who want to identify and manage key price levels with maximum precision.
This script detects protected pivots (significant highs and lows) and marks them with horizontal lines on the chart. These lines automatically extend for a fixed number of bars or until price invalidates the level with a closing break.
---
🚀 What makes this indicator special?
---
✅ Protected pivot detection:
The indicator identifies protected highs and lows using a fixed pivot strength
✅ Wick break detection (liquidity sweep visualization):
When a wick crosses the pivot level **without the candle closing beyond the level, the indicator automatically changes the line’s color and style.
👉 This immediately shows the trader that the level was tested but remains structurally valid.
✅ Highly customizable visuals:
* Choose whether to show color for protected highs, lows, or wick break levels.
* Set your own colors, line styles (solid, dashed, dotted), and line widths.
---
### 🌟 Why is wick break detection so valuable?
---
💡 Instant context on price action:
No need to manually check every candle to see if a level was barely tested. The indicator changes the line’s appearance automatically, so you can focus on decisions.
💡 Clear distinction between untouched levels and tested levels:
* A level with no wick test is pristine support/resistance.
* A level tested by a wick but not invalidated is still valid — but may have been swept for liquidity.
💡 Crucial for precision trading strategies:
This is particularly important for strategies that rely on:
✅ Liquidity sweeps / stop hunts.
✅ Reversals from tested zones.
✅ Smart Money Concepts (SMC).
✅ ICT concepts, breakers, Quasimodo, BOS/MSS.
The wick break visualization helps filter false breakouts and highlights areas where institutional players may have stepped in.
💡 Avoid premature exits or entries:**
The color/style change tells you a level was tested but not broken, so you avoid overreacting to wick activity.
---
### ⚡ Example use case**
Imagine a protected low line:
🔹 Price dips and its wick touches the level — the line changes color (e.g. violet solid line).
🔹 The level is still valid because the close didn’t break it.
🔹 This could signal a stop hunt or liquidity grab, with a possible reversal opportunity right at that level.
---
### 🧭 **Why most pivot indicators don’t offer this**
Most pivot indicators:
❌ Simply mark the level and remove it after a close break.
❌ Don’t distinguish between a wick test and a true break.
🌟 **This indicator does — giving traders an extra layer of market insight.**
---
### ⚠ **Disclaimer**
This indicator is a visual aid to help identify key levels and price reactions. It does **not** generate buy or sell signals and should be used alongside your trading analysis and strategy.
---
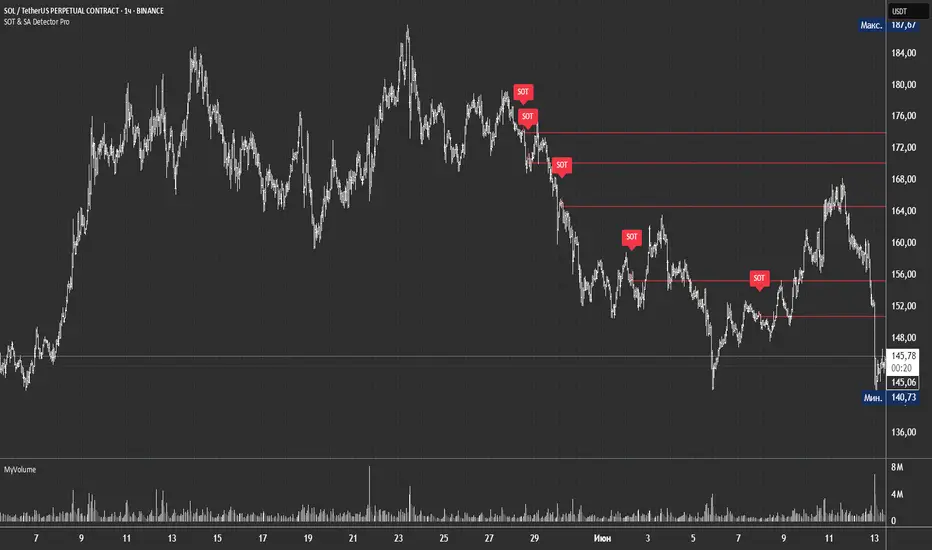
SOT & SA Detector ProSOT & SA Detector Pro- Advanced Reversal Pattern Recognition
OVERVIEW
The SOT & SA Detector is an educational indicator designed to identify potential market reversal points through systematic analysis of candlestick patterns, volume confirmation, and price wave structures. SOT (Shorting of Thrust) signals suggest potential bearish reversals after upward price movements, while SA (Selling Accumulation) signals indicate possible bullish reversals following downward trends. This tool helps traders recognize key market transition points by combining multiple technical criteria for enhanced signal reliability.
═══════════════════════════════════════════════════════════════
HOW IT WORKS
Technical Methodology
The indicator employs a multi-factor analysis approach that evaluates:
Wave Structure Analysis: Identifies minimum 2-bar directional waves (upward for SOT, downward for SA)
Price Delta Validation: Ensures closing price changes remain within specified percentage thresholds (default 0.3%) best 0.1.
Candlestick Tail Analysis: Measures rejection wicks using configurable tail multipliers
Volume Confirmation: Requires increased volume compared to previous periods
Pattern Confirmation: Validates signals through subsequent price action
Signal Generation Process
Pattern Recognition: Scans for qualifying candlestick formations with appropriate tail characteristics
Volume Verification: Confirms patterns with volume expansion using adjustable multiplier
Price Confirmation: Validates signals when price breaks and closes beyond pattern extremes
Signal Display: Places labeled markers and draws horizontal reference levels
Mathematical Foundation
Delta calculation: math.abs(close - close ) / close <= deltaPercent / 100
Tail analysis: (high - close ) >= tailMultiplier * (close - low ) for SOT
Volume filter: volume >= volume * volumeFactor
═══════════════════════════════════════════════════════════════
KEY FEATURES
Dual Pattern Recognition: Identifies both bullish (SA) and bearish (SOT) reversal candidates
Volume Integration: Incorporates volume analysis for enhanced signal validation
Customizable Parameters: Adjustable wave length, delta percentage, tail multiplier, and volume factor
Visual Clarity: Color-coded bar highlighting, labeled signals, and horizontal reference levels
Time-Based Filtering: Configurable analysis period to focus on recent market activity
Non-Repainting Signals: Confirmed signals remain stable and do not change with new price data
Alert System: Built-in notifications for both initial signals and subsequent confirmations
═══════════════════════════════════════════════════════════════
HOW TO USE
Signal Interpretation
Red SOT Labels: Appear above potential bearish reversal candles with downward-pointing markers
Green SA Labels: Display below potential bullish reversal candles with upward-pointing markers
Horizontal Lines: Extend from signal levels to provide ongoing reference points
Bar Coloring: Highlights qualifying pattern candles for visual emphasis
Trading Application
This indicator serves as an educational tool for pattern recognition and should be used in conjunction with additional analysis methods. Consider SOT signals as potential areas of selling pressure following upward moves, while SA signals may indicate buying interest after downward price action.
Best Practices
Combine with trend analysis and support/resistance levels
Consider overall market context and timeframe alignment
Use proper risk management techniques
Validate signals with additional technical indicators
═══════════════════════════════════════════════════════════════
SETTINGS
Analysis Days (Default: 20)
Controls the lookback period for signal detection. Higher values extend historical analysis while lower values focus on recent activity.
Minimum Bars in Wave (Default: 2)
Sets the minimum consecutive bars required to establish directional wave patterns. Increase for stronger trend confirmation.
Max Close Change % (Default: 0.3) best 0.1.
Defines acceptable closing price variation between consecutive bars. Lower values require tighter price consolidation.
Tail Multiplier (Default: 1.0) best 1.5 or more.
Adjusts sensitivity for candlestick tail analysis. Higher values require more pronounced rejection wicks.
Volume Factor (Default: 1.0)
Sets volume expansion threshold compared to previous period. Values above 1.0 require volume increases.
═══════════════════════════════════════════════════════════════
LIMITATIONS
Market Conditions
May produce false signals in highly volatile or low-volume conditions
Effectiveness varies across different market environments and timeframes
Requires sufficient volume data for optimal performance
Signal Timing
Signals appear after pattern completion, not in real-time during formation
Confirmation signals depend on subsequent price action
Historical signals do not guarantee future market behavior
Technical Constraints
Limited to analyzing price and volume data only
Does not incorporate fundamental analysis or external market factors
Performance may vary significantly across different trading instruments
═══════════════════════════════════════════════════════════════
IMPORTANT DISCLAIMERS
This indicator is designed for educational purposes and technical analysis learning. It does not constitute financial advice, investment recommendations, or trading signals. Past performance does not guarantee future results. Trading involves substantial risk of loss, and this tool should be used alongside proper risk management techniques and additional analysis methods.
Always conduct thorough analysis using multiple indicators and consider market context before making trading decisions. The SOT & SA patterns represent potential reversal points but do not guarantee price direction changes.
═══════════════════════════════════════════════════════════════
Credits: Original concept and Pine Script implementation by Everyday_Trader_X
Version: Pine Script v6 compatible
Category: Technical Analysis / Reversal Detection
Overlay: Yes (displays on price chart)
GCM Price Based ColorIndicator Name:
GCM Price Based Color Indicator
Detailed Description:
The GCM Price Based Color Indicator is a unique tool designed to help traders spot potential "pump" events in the market. Unlike traditional Volume Rate of Change (VROC) indicators, this script is conditional: it calculates a VROC value only when both the average volume and the price are increasing. This focus helps filter out volume surges that don't accompany immediate price appreciation, highlighting more relevant "pump" signals.
Key Features & Calculation Logic:
Conditional Volume Rate of Change (VROC):
It first calculates a Simple Moving Average (SMA) of the volume over a user-defined length (lookback period).
It then checks two conditions:
Is the current SMA volume greater than the previous bar's SMA volume (i.e., volumeIncreasing)?
Is the current close price greater than the previous bar's close price (i.e., valueIncreasing)?
Only if both volume Increasing AND value Increasing are true, a VROC value is calculated as (current _ MA _ volume - previous _ MA _ volume) * (100 / previous _ MA _ volume). Otherwise, the VROC for that bar is 0.
Historical Normalization:
The raw VROC value is then normalized against its own historical maximum value observed since the indicator was applied. This scaling brings all VROC values into a common 0-100 range.
Why is this important? Normalization makes the indicator's readings comparable across different assets (e.g., high-volume vs. low-volume stocks/cryptos) and different timeframes, making it easier to interpret the strength of a "pump" relative to its own past.
Dynamic Plot Color (Price-Based):
The plot line's color itself provides an immediate visual cue about the current bar's price action:
Green: close is greater than close (price is up for the current bar).
Red: close is less than close (price is down for the current bar).
Grey: close is equal to close (price is flat for the current bar).
Important Note: The plot color reflects the price movement of the current bar, not the magnitude of the VROC Normalized value itself. This means you can have a high vrocNormalized value (indicating a strong conditional volume surge) but a red plot color if the very next bar's price closes lower, providing a multi-faceted view.
Thresholds & Alerts:
Two horizontal lines (small Pump Threshold and big Pump Threshold) are plotted to visually mark significant levels of normalized pump strength.
Customizable alerts can be set up to notify you when VROC Normalized reaches or exceeds these thresholds, helping you catch potential pump events in real-time.
How to Use It:
Identify Potential Pumps: Look for upward spikes in the VROC Normalized line. Higher spikes indicate stronger pump signals (i.e., a larger increase in average volume coinciding with an increasing price).
Monitor Thresholds: Pay attention when the VROC Normalized line crosses above your small Pump Threshold or big Pump Threshold. These are configurable levels to suit different assets and trading styles.
Observe Plot Color: The line color provides crucial context. A high VROC Normalized (strong pump signal) with a green line indicates current price momentum is still positive. If VROC Normalized is high but the line turns red, it might suggest the initial pump is losing steam or experiencing a pullback.
Combine with Other Tools: This indicator is best used in conjunction with other technical analysis tools (e.g., support/resistance, trend lines, other momentum indicators) for confirmation and a more holistic trading strategy.
Indicator Inputs:
Lookback period (1 - 4999) (default: 420): This length determines the period for the Simple Moving Average (SMA) of volume. A higher value will smooth the volume average more, reacting slower, while a lower value will make it more reactive. Adjust based on the timeframe and asset volatility.
Big Pump Threshold (0.01 - 99.99) (default: 10.0): The normalized VROC Normalized level that signifies a "Big Pump." When VROC Normalized reaches or exceeds this level, an alert can be triggered.
Small Pump Threshold (0.01 - 99.99) (default: 0.5): The normalized VROC Normalized level that signifies a "Small Pump." This is a lower threshold for earlier or less significant pump activity.
Alerts:
Small Pump: Triggers when VROC Normalized crosses above or equals the small Pump Threshold.
Big Pump: Triggers when VROC Normalized crosses above or equals the big Pump Threshold.
Best Practices & Considerations:
Timeframes: The indicator can be used on various timeframes, but its effectiveness may vary. Experiment to find what works best for your chosen asset and trading style.
Volatility: Highly volatile assets might require different threshold settings compared to less volatile ones.
Lag: Due to the use of a Simple Moving Average (SMA) for volume, there will be some inherent lag in the calculation.
Normalization Start: The historic Max for normalization starts with a default value of 10.0. For the very first bars, or if there hasn't been a significant VROC yet, the VROC Normalized might behave differently until a true historical maximum VROC establishes itself.
Not Financial Advice: This indicator is a tool for analysis and does not constitute financial advice. Always perform your own research and manage your risk.

RSI MSB | QuantMAC📊 RSI MSB | QuantMAC
🎯 Overview
The RSI MSB (Momentum Shifting Bands) represents a groundbreaking fusion of traditional RSI analysis with advanced momentum dynamics and adaptive volatility bands. This sophisticated indicator combines RSI smoothing , relative momentum calculations , and dynamic standard deviation bands to create a powerful oscillator that automatically adapts to changing market conditions, providing superior signal accuracy across different trading environments.
🔧 Key Features
Hybrid RSI-Momentum Engine : Proprietary combination of smoothed RSI with relative momentum analysis
Dynamic Adaptive Bands : Self-adjusting volatility bands that respond to indicator strength
Dual Trading Modes : Flexible Long/Short or Long/Cash strategies for different risk preferences
Advanced Performance Analytics : Comprehensive metrics including Sharpe, Sortino, and Omega ratios
Smart Visual System : Dynamic color coding with 9 professional color schemes
Precision Backtesting : Date range filtering with detailed historical performance analysis
Real-time Signal Generation : Clear entry/exit signals with customizable threshold sensitivity
Position Sizing Intelligence : Half Kelly criterion for optimal risk management
📈 How The MSB Technology Work
The Momentum Shifting Bands technology is built on a revolutionary approach that combines multiple signal sources into one cohesive system:
RSI Foundation : 💪
Calculate traditional RSI using customizable length and source
Apply exponential smoothing to reduce noise and false signals
Normalize values for consistent performance across different timeframes
Momentum Analysis Engine : ⚡
Compute fast and slow momentum using rate of change calculations
Calculate relative momentum by comparing fast vs slow momentum
Normalize momentum values to 0-100 scale for consistency
Apply smoothing to create stable momentum readings
Dynamic Combination : 🔄
The genius of MSB lies in its weighted combination of RSI and momentum signals. The momentum weight parameter allows traders to adjust the balance between RSI stability and momentum responsiveness, creating a hybrid indicator that captures both trend continuation and reversal signals.
Adaptive Band System : 🎯
Calculate dynamic standard deviation multiplier based on indicator strength
Generate upper and lower bands that expand during high volatility periods
Create normalized oscillator that scales between band boundaries
Provide visual reference for overbought/oversold conditions
⚙️ Comprehensive Parameter Control
RSI Settings : 📊
RSI Length: Controls the period for RSI calculation (default: 21)
Source: Price input selection (close, open, high, low, etc.)
RSI Smoothing: Reduces noise in RSI calculations (default: 20)
Momentum Settings : 🔥
Fast Momentum Length: Short-term momentum period (default: 19)
Slow Momentum Length: Long-term momentum period (default: 21)
Momentum Weight: Balance between RSI and momentum (default: 0.6)
Oscillator Settings : ⚙️
Base Length: Foundation moving average for band calculations (default: 40)
Standard Deviation Length: Period for volatility measurement (default: 53)
SD Multiplier: Base band width adjustment (default: 0.7)
Oscillator Multiplier: Scaling factor for oscillator values (default: 100)
Signal Thresholds : 🎯
Long Threshold: Bullish signal trigger level (default: 93)
Short Threshold: Bearish signal trigger level (default: 53)
🎨 Advanced Visual System
Main Chart Elements : 📈
Dynamic Shifting Bands: Upper and lower bands with intelligent transparency
Adaptive Fill Zone: Color-coded area between bands showing current market state
Basis Line: Moving average foundation displayed as subtle reference points
Smart Bar Coloring: Candles change color based on oscillator state for instant visual feedback
Oscillator Pane : 📊
Normalized MSB Oscillator: Main signal line with dynamic coloring based on market state
Threshold Lines: Horizontal reference lines for entry/exit levels
Zero Line: Central reference for oscillator neutrality
Color State Indication: Line colors change based on bullish/bearish conditions
📊 Professional Performance Metrics
The built-in analytics suite provides institutional-grade performance measurement:
Net Profit % : Total strategy return percentage
Maximum Drawdown % : Worst peak-to-trough decline
Win Rate % : Percentage of profitable trades
Profit Factor : Ratio of gross profits to gross losses
Sharpe Ratio : Risk-adjusted return measurement
Sortino Ratio : Downside-focused risk adjustment
Omega Ratio : Probability-weighted performance ratio
Half Kelly % : Optimal position sizing recommendation
Total Trades : Complete transaction count
🎯 Strategic Trading Applications
Long/Short Mode : ⚡
Maximizes profit potential by capturing both upward and downward price movements. The MSB technology helps identify when momentum is building in either direction, allowing for optimal position switches between long and short positions.
Long/Cash Mode : 🛡️
Conservative approach ideal for retirement accounts or risk-averse traders. The indicator's adaptive nature helps identify the best times to be invested versus sitting in cash, protecting capital during adverse market conditions.
🚀 Unique Advantages
Traditional Indicators vs RSI MSB :
Static vs Dynamic: While most indicators use fixed parameters, MSB bands adapt based on indicator strength
Single Signal vs Multi-Signal: Combines RSI reliability with momentum responsiveness
Lagging vs Balanced: Optimized balance between signal speed and accuracy
Simple vs Intelligent: Advanced momentum analysis provides superior market insight
💡 Professional Setup Guide
For Day Trading (Short-term) : 📱
RSI Length: 14-18
RSI Smoothing: 12-15
Momentum Weight: 0.7-0.8
Thresholds: Long 90, Short 55
For Swing Trading (Medium-term) : 📊
RSI Length: 21-25 (default range)
RSI Smoothing: 18-22
Momentum Weight: 0.5-0.7
Thresholds: Long 93, Short 53 (defaults)
For Position Trading (Long-term) : 📈
RSI Length: 25-30
RSI Smoothing: 25-30
Momentum Weight: 0.4-0.6
Thresholds: Long 95, Short 50
🧠 Advanced Trading Techniques
MSB Divergence Analysis : 🔍
Watch for divergences between price action and MSB readings. When price makes new highs/lows but the oscillator doesn't confirm, it often signals upcoming reversals or momentum shifts.
Band Width Interpretation : 📏
Expanding Bands: Increasing volatility, expect larger price moves
Contracting Bands: Decreasing volatility, prepare for potential breakouts
Band Touches: Price touching outer bands often signals reversal opportunities
Multi-Timeframe Analysis : ⏰
Use MSB on higher timeframes for trend direction and lower timeframes for precise entry timing. The momentum component makes it particularly effective for timing entries within established trends.
⚠️ Important Risk Disclaimers
Critical Risk Factors :
Market Conditions: No indicator performs equally well in all market environments
Backtesting Limitations: Historical performance may not reflect future market behavior
Parameter Sensitivity: Different settings may produce significantly different results
Volatility Risk: Momentum-based indicators can be sensitive to extreme market conditions
Capital Risk: Always use appropriate position sizing and stop-loss protection
📚 Educational Benefits
This indicator provides exceptional learning opportunities for understanding:
Advanced RSI analysis and momentum integration techniques
Adaptive indicator design and dynamic band calculations
The relationship between momentum shifts and price movements
Professional risk management using Kelly Criterion principles
Modern oscillator interpretation and multi-signal analysis
🔍 Market Applications
The RSI MSB works effectively across various markets:
Forex : Excellent for currency pair momentum analysis
Stocks : Individual equity and index trading with momentum confirmation
Commodities : Adaptive to commodity market momentum cycles
Cryptocurrencies : Handles extreme volatility with momentum filtering
Futures : Professional derivatives trading applications
🔧 Technical Innovation
The RSI MSB represents advanced research into multi-signal technical analysis. The proprietary momentum-RSI combination has been optimized for:
Computational Efficiency : Fast calculation even on high-frequency data
Signal Clarity : Clear, actionable trading signals with reduced noise
Market Adaptability : Automatic adjustment to changing momentum conditions
Parameter Flexibility : Wide range of customization options for different trading styles
🔔 Updates and Evolution
The RSI MSB | QuantMAC continues to evolve with regular updates incorporating the latest research in momentum-based technical analysis. The comprehensive parameter set allows for extensive customization and optimization across different market conditions.
Past Performance Disclaimer : Past performance results shown by this indicator are hypothetical and not indicative of future results. Market conditions change continuously, and no trading system or methodology can guarantee profits or prevent losses. Historical backtesting may not reflect actual trading conditions including market liquidity, slippage, and fees that would affect real trading results.
Master The Markets With Multi-Signal Intelligence! 🎯📈
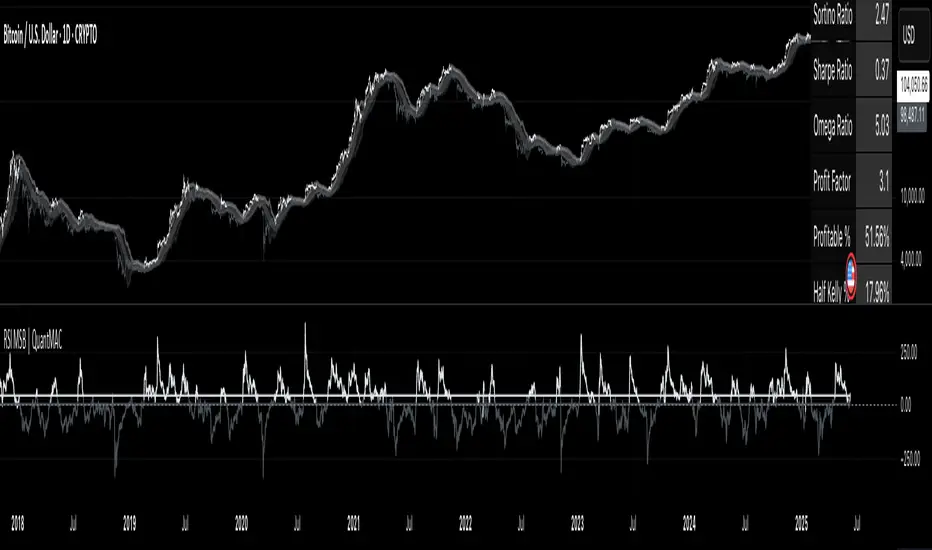
21DMA Structure Counter (EMA/SMA Option)21DMA Structure Counter (EMA/SMA Option)
Overview
The 21DMA Structure Counter is an advanced technical indicator that tracks consecutive periods where price action remains above a 21-period moving average structure. This indicator helps traders identify momentum phases and potential trend exhaustion points using statistical analysis.
Key Features
Moving Average Structure
- Configurable MA Type: Choose between EMA (Exponential Moving Average) or SMA (Simple Moving Average)
- 21-Period Default: Optimized for the widely-watched 21-period moving average
- Triple MA Structure: Tracks high, close, and low moving averages for comprehensive analysis
Statistical Analysis
- Cycle Counting: Automatically counts consecutive periods above the MA structure
- Historical Data: Maintains up to 2,500 historical cycles (approximately 10 years of daily data)
- Z-Score Calculation: Provides statistical context using mean and standard deviation
- Multiple Standard Deviation Levels: Displays +1, +2, and +3 standard deviation thresholds
Visual Indicators
Color-Coded Bars:
- Gray: Below 10-year average
- Yellow: Between average and +1 standard deviation
- Orange: Between +1 and +2 standard deviations
- Red: Between +2 and +3 standard deviations
- Fuchsia: Above +3 standard deviations (extreme readings)
Breadth Integration
- Multiple Breadth Options: NDFI, NDTH, NDTW (NASDAQ breadth indicators), or VIX
- Background Shading: Visual alerts when breadth reaches extreme levels
- High/Low Thresholds: Customizable levels for breadth analysis
- Real-time Display: Current breadth value shown in data table
Smart Reset Logic
- High Below Structure Reset: Automatically resets count when daily high falls below the lowest MA
- Flexible Hold Period: Continues counting during temporary weakness as long as structure isn't violated
- Precise Entry/Exit: Strict criteria for starting cycles, flexible for maintaining them
How to Use
Trend Identification
- Rising Counts: Indicate sustained momentum above key moving average structure
- Extreme Readings: Z-scores above +2 or +3 suggest potential trend exhaustion
- Historical Context: Compare current cycles to 10-year statistical averages
Risk Management
- Breadth Confirmation: Use breadth shading to confirm market-wide strength/weakness
- Statistical Extremes: Exercise caution when readings reach +3 standard deviations
- Reset Signals: Pay attention to structure violations for potential trend changes
Multi-Timeframe Application
- Daily Charts: Primary timeframe for swing trading and position management
- Weekly/Monthly: Longer-term trend analysis
- Intraday: Shorter-term momentum assessment (adjust MA period accordingly)
Settings
Moving Average Options
- Type: EMA or SMA selection
- Period: Default 21 (customizable)
- Reset Days: Days below structure required for reset
Visual Customization
- Standard Deviation Lines: Toggle and customize colors for +1, +2, +3 SD
- Breadth Selection: Choose from NDFI, NDTH, NDTW, or VIX
- Threshold Levels: Set custom high/low breadth thresholds
- Table Styling: Customize text colors, background, and font size
Technical Notes
- Data Retention: Maintains 2,500 historical cycles for robust statistical analysis
- Real-time Updates: Calculations update with each new bar
- Breadth Integration: Uses security() function to pull external breadth data
- Performance Optimized: Efficient array management prevents memory issues
Best Practices
1. Combine with Price Action: Use alongside support/resistance and chart patterns
2. Monitor Breadth Divergences: Watch for breadth weakness during strong readings
3. Respect Statistical Extremes: Exercise caution at +2/+3 standard deviation levels
4. Context Matters: Consider overall market environment and sector rotation
5. Risk Management: Use appropriate position sizing, especially at extreme readings
Disclaimer
This indicator is for educational and informational purposes only. It should not be used as the sole basis for trading decisions. Always combine with other forms of analysis and proper risk management techniques.
Compatible with Pine Script v6 | Optimized for daily timeframes | Best used on major indices and liquid stocks

RSI Shifting Band Oscillator | QuantMAC📊 RSI Shifting Band Oscillator | QuantMAC
🎯 Overview
The RSI Shifting Band Oscillator represents a breakthrough in adaptive technical analysis, combining the innovative dual-stage RSI processing with dynamic volatility bands to create an oscillator that automatically adjusts to changing market momentum conditions. This cutting-edge indicator goes beyond traditional static approaches by using smoothed RSI to dynamically shift band width based on momentum transitions, providing superior signal accuracy across different market regimes.
🔧 Key Features
Revolutionary Dual RSI Technology: Proprietary two-stage RSI calculation with exponential smoothing that measures momentum transitions in real-time
Dynamic Adaptive Bands: Self-adjusting volatility bands that expand and contract based on RSI distance from equilibrium
Dual Trading Modes: Flexible Long/Short or Long/Cash strategies for different trading preferences
Advanced Performance Analytics: Comprehensive metrics including Sharpe, Sortino, and Omega ratios
Smart Visual System: Dynamic color coding with 9 professional color schemes
Precision Backtesting: Date range filtering with detailed historical performance analysis
Real-time Signal Generation: Clear entry/exit signals with customizable threshold sensitivity
Position Sizing Intelligence: Half Kelly criterion for optimal risk management
📈 How The Dual RSI Technology Works
The Dual RSI system is the heart of this indicator's innovation. Unlike traditional RSI implementations, this approach analyzes the smoothed momentum transitions between different RSI states, providing early warning signals for momentum regime changes.
RSI Calculation Process:
Calculate traditional RSI using specified length and price source
Apply exponential moving average smoothing to reduce noise
Measure RSI distance from neutral 50 level to determine momentum strength
Use RSI deviation to dynamically adjust standard deviation multipliers
Create adaptive bands that respond to momentum conditions
Generate normalized oscillator values for clear signal interpretation
The genius of this dual RSI approach lies in its ability to detect when markets are transitioning between momentum and consolidation periods before traditional indicators catch up. This provides traders with a significant edge in timing entries and exits.
⚙️ Comprehensive Parameter Control
RSI Settings:
RSI Length: Controls the lookback period for momentum analysis (default: 14)
RSI Smoothing: Reduces noise in RSI calculations using EMA (default: 20)
Source: Price input selection (close, open, high, low, etc.)
Oscillator Settings:
Base Length: Foundation moving average for band calculations (default: 40)
Standard Deviation Length: Period for volatility measurement (default: 26)
SD Multiplier: Base band width adjustment (default: 2.7)
Oscillator Multiplier: Scaling factor for oscillator values (default: 100)
Signal Thresholds:
Long Threshold: Bullish signal trigger level (default: 90)
Short Threshold: Bearish signal trigger level (default: 56)
🎨 Advanced Visual System
Main Chart Elements:
Dynamic Shifting Bands: Upper and lower bands that automatically adjust width based on RSI momentum
Adaptive Fill Zone: Color-coded area between bands showing current market state
Basis Line: Moving average foundation displayed as subtle reference points
Smart Bar Coloring: Candles change color based on oscillator state for instant visual feedback
Oscillator Pane:
Normalized RSI Oscillator: Main signal line centered around zero with dynamic coloring
Threshold Lines: Horizontal reference lines for entry/exit levels
Zero Line: Central reference for oscillator neutrality
Color State Indication: Line colors change based on bullish/bearish conditions
📊 Professional Performance Metrics
The built-in analytics suite provides institutional-grade performance measurement:
Net Profit %: Total strategy return percentage
Maximum Drawdown %: Worst peak-to-trough decline
Win Rate %: Percentage of profitable trades
Profit Factor: Ratio of gross profits to gross losses
Sharpe Ratio: Risk-adjusted return measurement
Sortino Ratio: Downside-focused risk adjustment
Omega Ratio: Probability-weighted performance ratio
Half Kelly %: Optimal position sizing recommendation
Total Trades: Complete transaction count
🎯 Strategic Trading Applications
Long/Short Mode: ⚡
Maximizes profit potential by capturing both upward and downward price movements. The dual RSI technology helps identify when momentum is strengthening or weakening, allowing for optimal position switches between long and short.
Long/Cash Mode: 🛡️
Conservative approach ideal for retirement accounts or risk-averse traders. The indicator's adaptive nature helps identify the best times to be invested versus sitting in cash, protecting capital during adverse market conditions.
🚀 Unique Advantages
Traditional Indicators vs RSI Shifting Bands:
Static vs Dynamic: While most indicators use fixed parameters, RSI bands adapt in real-time
Lagging vs Leading: Dual RSI detects momentum transitions before they fully manifest
One-Size vs Adaptive: The same settings work across different market conditions
Simple vs Intelligent: Advanced momentum analysis provides superior market insight
💡 Professional Setup Guide
For Day Trading (Short-term):
RSI Length: 10-12
RSI Smoothing: 15-18
Base Length: 25-30
Thresholds: Long 85, Short 60
For Swing Trading (Medium-term):
RSI Length: 14-16 (default range)
RSI Smoothing: 20-25
Base Length: 40-50
Thresholds: Long 90, Short 56 (defaults)
For Position Trading (Long-term):
RSI Length: 18-21
RSI Smoothing: 25-30
Base Length: 60-80
Thresholds: Long 92, Short 50
🧠 Advanced Trading Techniques
RSI Divergence Analysis:
Watch for divergences between price action and smoothed RSI readings. When price makes new highs/lows but RSI doesn't confirm, it often signals upcoming reversals.
Band Width Interpretation:
Expanding Bands: Increasing momentum, expect larger price moves
Contracting Bands: Decreasing momentum, prepare for potential breakouts
Band Touches: Price touching outer bands often signals reversal opportunities
Multi-Timeframe Analysis:
Use RSI oscillator on higher timeframes for trend direction and lower timeframes for precise entry timing.
⚠️ Important Risk Disclaimers
Past performance is not indicative of future results. This indicator represents advanced technical analysis but should never be used as the sole basis for trading decisions.
Critical Risk Factors:
Market Conditions: No indicator performs equally well in all market environments
Backtesting Limitations: Historical performance may not reflect future market behavior
Momentum Risk: Adaptive indicators can be sensitive to extreme momentum conditions
Parameter Sensitivity: Different settings may produce significantly different results
Capital Risk: Always use appropriate position sizing and stop-loss protection
📚 Educational Benefits
This indicator provides exceptional learning opportunities for understanding:
Advanced RSI analysis and momentum measurement techniques
Adaptive indicator design and implementation
The relationship between momentum transitions and price movements
Professional risk management using Kelly Criterion principles
Modern oscillator interpretation and signal generation
🔍 Market Applications
The RSI Shifting Band Oscillator works across various markets:
Forex: Excellent for currency pair momentum analysis
Stocks: Individual equity and index trading
Commodities: Adaptive to commodity market momentum cycles
Cryptocurrencies: Handles extreme momentum variations effectively
Futures: Professional derivatives trading applications
🔧 Technical Innovation
The RSI Shifting Band Oscillator represents years of research into adaptive technical analysis. The proprietary dual RSI calculation method has been optimized for:
Computational Efficiency: Fast calculation even on high-frequency data
Noise Reduction: Advanced smoothing without excessive lag
Market Adaptability: Automatic adjustment to changing conditions
Signal Clarity: Clear, actionable trading signals
🔔 Updates and Evolution
The RSI Shifting Band Oscillator | QuantMAC continues to evolve with regular updates incorporating the latest research in adaptive technical analysis. The code is thoroughly documented for transparency and educational purposes.
Trading Notice: Financial markets involve substantial risk of loss. The RSI Shifting Band Oscillator is a sophisticated technical analysis tool designed to assist in trading decisions but cannot guarantee profitable outcomes.
---
Master The Markets With Adaptive Intelligence! 🎯📈

Smart Bar Counter with Alerts🚀 Smart Bar Counter with Alerts 🚀
-----------------------------------------------------
Overview
-----------------------------------------------------
Ever wanted to count a specific number of bars from a key point on your chart—such as after a Break of Structure (BOS), the start of a new trading session, or from any point of interest— without having to stare at the screen?
This "Smart Bar Counter" indicator was created to solve this exact problem. It's a simple yet powerful tool that allows you to define a custom "Start Point" and a "Target Bar Count." Once the target count is reached, it can trigger an Alert to notify you immediately.
-----------------------------------------------------
Key Features
-----------------------------------------------------
• Manual Start Point: Precisely select the date and time from which you want the count to begin, offering maximum flexibility in your analysis.
• Custom Bar Target: Define exactly how many bars you want to count, whether it's 50, 100, or 200 bars.
• On-Chart Display: A running count is displayed on each bar after the start time, allowing you to visually track the progress.
• Automatic Alerts: Set up alerts to be notified via TradingView's various channels (pop-up, mobile app, email) once the target count is reached.
-----------------------------------------------------
How to Use
-----------------------------------------------------
1. Add this indicator to your chart.
2. Go to the indicator's Settings (Gear Icon ⚙️).
- Select Start Time: Set the date and time you wish to begin counting.
- Number of Bars to Count: Input your target number.
3. Set up the Alert ( Very Important! ).
- Right-click on the chart > Select " Add alert ."
- In the " Condition " dropdown, select this indicator: Smart Bar Counter with Alerts .
- In the next dropdown, choose the available alert condition.
- Set " Options " to Once Per Bar Close .
- Choose your desired notification methods under " Alert Actions ."
- Click " Create ."
-----------------------------------------------------
Use Cases
-----------------------------------------------------
• Post-Event Analysis: Count bars after a key event like a Break of Structure (BOS) or Change of Character (CHoCH) to observe subsequent price action.
• Time-based Analysis: Use it to count bars after a market open for a specific session (e.g., London, New York).
• Strategy Backtesting: Useful for testing trading rules that are based on time or a specific number of bars.
-----------------------------------------------------
Final Words
-----------------------------------------------------
Hope you find this indicator useful for your analysis and trading strategies! Feel free to leave comments or suggestions below.
