Nifty36ScannerThis code is written for traders to be able to automatically scan 36 stocks of their choice for MACD , EMA200 + SuperTrend and Half Trend . Traders can be on any chart, and if they keep this scanner/indicator on , it will start displaying stocks meeting scanning criteria on the same window without having to go to Screener section and running it again and again. It will save time for traders and give them real time signals.
Indicators for scanning stocks are:
MACD
EMA200
Supertrend
HalfTrend - originally developed by EVERGET
Combination of EMA200 crossover/under and MACD crossover/under has worked well for me for long time, so using this combination as one of the criteria to
Scan the stocks. Using Everget's Half Trend method confirms the signal given by MACD , EMA200 and Supertrend Crossover.
I have added 36 of my favourite stocks from Nifty 50 lot. Users of this script can use the same stocks or change it by going into the settings of this scanner.
The Code is divided into 3 Sections
Section 1: Accepting input from users as boolean so that they can scan on the basis of one of the criteria or any combination of the criteria.
Section 2: "Screener function" to calculate Buy/ Sell on the basis of scanning criteria selected y the user.
screener=>
= ta.supertrend(2.5,10)
Buy/Sell on the basis of Supertrend crossing Close of the candle
//using ta.macd function to calculate MACD and Signal
= ta.macd(close, 12, 26, 9)
using HalfTrend indicator to calculate Buy/Sell signals , removed all the plotting functions from the code of Half Trend
Bringing Stock Symbols in S series variables
s1=input.symbol('NSE:NIFTY1!', title='Symbol1', group="Nifty50List", inline='0')
Assigning Bull/Bear ( Buy/Sell) signals to each stocks selected
=request.security(s1, tf, screener())
Assign BUY to all the stocks showing Buy signals using
buy_label1:= c1?buy_label1+str.tostring(s1)+'\n': buy_label1
Follow the same process for SELL Signals
Section 3: Plotting labels for the BUY/SELL result on the in terms of label for any stocks meeting the criteria with deletion of any previous signals to avoid clutter on the chart with so many signals generated in each candle
Display Buy siganaling stocks in teh form of label using Label.new function with parameters as follows:
barindex
close as series
color
textcolor
style as label_up,
yloc =price
textalign=left
Delete all the previous labels
label.delete(lab_buy )
STOCKS SELECTION
We have given range f 36 stocks from NIFTY 50 that can be selected at anytime,. User can chose their own 36 stocks using setting button.
INDICATORS SELECTION
1. MACD: It i sone of the most reliable trading strategy with 39.3% Success rate with 1.187 as profit factor for NIFTY Index on Daily time frame
2. EAM200 + Super trend : Combination of EMA200 crossover and Super trend removes any false positives and considered a very reliable way of scanning for Buy/Sell signals
3. HALF TREND: Originally developed as an indicator by Everget and modified as strategy by AlgoMojo, it generates Buy/Sell signals with 40.2% success rate with 1.469 as profit faction, on 15 minutes timeframe.
חפש סקריפטים עבור "profit factor"

Open High Low StrategyThis is a very simple, yet effective and to some extend widely followed scalping strategy to capture the underling sentiments of the counter whether it will go up or down.
What is it?
This is Open-High-Low (OLH) strategy.
As you already aware of Candlestick patterns, there is patterns called as Marubozu patterns where the sell wick or buy wick either ceases to exists (or very small). This is exactly in the same principle.
In OLH strategy: The buy signal appears when the Open Price is the Low Price. It means if you draw the candlestick, there is no bottom wick. So after the opening of the candle, the demand drives the price up to the level, some selling may or may not come and closes in green. This indicates a strong upward biasness of the underlying counter.
Similarly, a sell signal appears when the Open price is the High Price. It means there is no upper wick. So there is no buying pressure, since the opening of the candle, sellers are in force and pulls down the price to a closing.
This strategy generates the signal at the close of the candle (technically barstate.isconfirmed). Because until the bar is real-time there is no option to know the final closing or high. So you will see the bar on which it generates the buy or sell signal is actually indicates the previous bar as OLH bar.
To determine the Stop-Loss, it uses the most widely known SL calculation of:
For buy signal, it takes the low of the last 7 candles and substract the ATR (Average True Range) of 14-period.
For sell signal, it takes the high of the last 7 candles and add it to the ATR (Average True Range) of 14-period.
One can plot the SL lines as dotted green and red lines as well to see visually.
Default Risk:Reward is 1:2, Can be customizable.
What is Unique?
Of course the utter simplistic nature of this strategy is it's key point. Very easy and intuitive to understand.
There are awesome strategies in this forum that talks about the various indicators combinations and what not.
Instead of all this, in a 15m NSE:NIFTY chart, it generates a good ~ 47% profit-factor with 1:2 Risk Reward ratio. Means if you loose a trade you will loose 1% of account and if you win you will gain 2%. Means 3 trades (2 profits and 1 loss) in a trading session result 3% overall gain for the day. (Assuming you are ready with 1% draw down of your account per trade, at max).
Disclaimer:
This piece of software does not come up with any warrantee or any rights of not changing it over the future course of time.
We are not responsible for any trading/investment decision you are taking out of the outcome of this indicator.

Vin's Playzone Strategy How it works
Playzone is a very simple system, utilizing just two exponential moving
averages. The 'Zones' in which different 'actions' should be taken is
highlighted with different colors on the chart. Calculations for the zones
are based on the relative position of price to the two EMA lines and the
relationship between the two EMAs
How to use
The basic method for using Playzone is to follow the green/red color.
Buy when bar closes in green.
Sell when bar closes in red.
Using it this way is safe but slow and is expected to have around 35-40%
accuracy, while yielding around 2-3 profit factors. The system works best
on larger time frames.
The more advanced method uses the zones to switch between different
trading system and biases, or in conjunction with other indicators.
example 1:
Buy when Yellow-Green and Bullish Divergence between price and RSI is visible,
if not Buy on Green and vise-versa
example 2:
Set up a long-biased grid and trade long only when actionzone is in green
change the bias to short when actionzone turns to te bearish side(red)
(Look at colors on a larger time frame)
"We let the market tell us what to do, Not to outguess what the market gonna do."

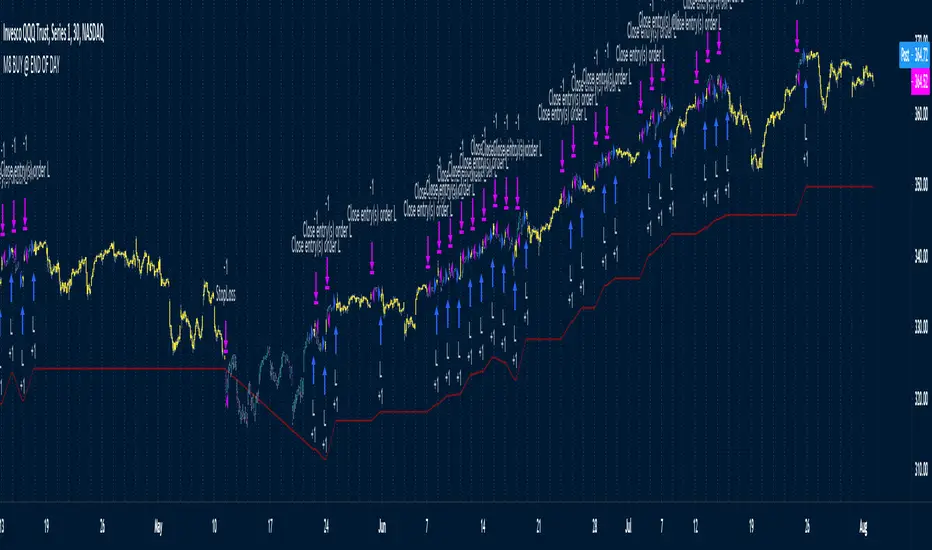
M8 BUY @ END OF DAYI've read a couple of times at a couple of different places that most of the move in the market happens after hours, meaning during non-standard trading hours.
After-market and pre-market hours and have seen data presented showing that systems which bought just before end normal market hours and sold the next morning had really amazing resutls.
But when testing those I found the results to be quite poor compared to the pretty graphs I saw, and after much tweaking and trying different ideas I gave up on the idea until I recently decided to try a new position management system.
The System
Buys at the end of the trading day before the close
Sells the next morning at the open IF THE CLOSE OF THE CURRENT BAR IS HIGHER THAN THE ENTRY PRICE
When the current price is not higher, the system will keep the position open until it EITHER gets stops out or closes on profit <<< this is WHY it has the high win %
The system has a high win ratio because it will keep that one position open until it either reaches profit or stops out
This "system" of waiting, and keeping the trade open, actually turned out to be a fantastic way to kind of put the complete trading strategy in a kind of limbo mode. It either waits for market failure or for a profit.
I don't really care about win % at all, almost always high win % ratio systems are just nonsense. What I look for is a PF -- profit factor of 1.5 or above, and a relatively smooth equity curve. -- This has both.
The Stop Loss setting is set @ .95, meaning a 5% stop loss. The Red Line on the chart is the stop loss line.
There is no set profit target -- it simply takes what the market gives.
Non-Repainting System
This does use a 200D Simple Moving Average as a filter. Like a Green Light / Red Light traffic light, the system will only trade long when the price is above its 200 Moving average.
Here is the code: "F1 = close > sma(security(syminfo.tickerid, "D", close ), MarketFilterLen) // HIGH OF OLD DATA -- SO NO REPAINTING"
I use "close ", so that's data from two days ago, it's fixed, confirmed, non-repainting data from the higher timeframe.
-- I would only suggest using this on direction tickers like SPY, QQQ, SSO, TQQQ, market sectors with additional filters in place.
10PreBuyerQuite a simple system
Uses a moving average, the blue line to try and get filled at favorable prices
The MA is multiplied by a number (e.g. .90) which means the system tries to get filled at a 10% lower price (on the Blue MA line)
This means that stop limit buy orders have to be set in advance on the blue line and hope that they would get filled when there is a temporary drop in price
This obviously works best on tickers with a clear long-term up direction
The multiplier can be set to .95 to try and get in on 5% drops instead of 10% drops
"Prof TRG %" determines what profit target you'd like the system to use, default is 1.2 meaning a 20% target, but 1.05, 1.10, and 1.30 would also be good considerations
"Loss TRG %" determines what stop-loss target you'd like the system to use, default is 0.90, meaning 10% stop loss, but, .95, and .85 would also be good considerations
The Profit Target line is green
The Stop Loss target line is red
Using the combination of the Stop Loss inputs and Profit Target inputs you can determine your own RR (Risk to reward ratios), for example, 1:1, 2:1, 3:1, 5:1
Let me know if anything is unclear and I'll try to clarify.
Again, this system assumes that you'll have waiting stop limit orders that are trying to get filled on the blue line, is below price most of the time -- so it's trying to get in on temporary drops on instruments that have a long term uptrend.
1:1 RR ratio would mean high win %
1:5 RR ratios would mean low win %
Not that win % matters, the important things IMO to pay attention to is Profit Factor and a relatively smooth equity cruve

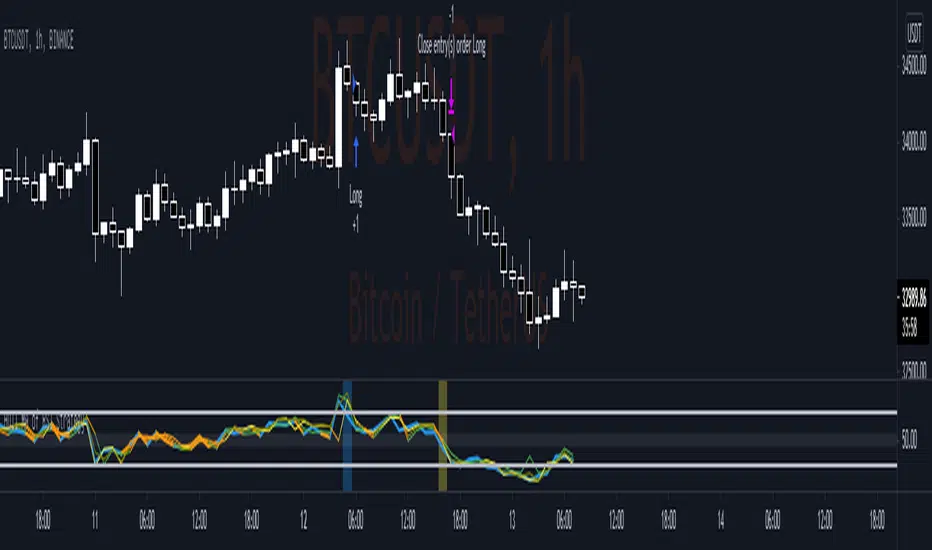
Hull MA of RSI StrategyThis simple strategy base on RSI value of Close Price, High Price, Low Price, Median Price and RSI value smoothed by Hull Moving Average.
1. Optimize parameter on BTC H1 Binance chart
RSI period: 13
Hull MA period: 3
Middle Channel: 55-45
Overbough / Oversold: 70-30
2. Setup
2.1 Long Condition
- RSI of Close Price crossunder Overbought
- Close Price lower than Median Price (HL2)
- RSI of Median Price above Overbought
2.2 Close Long Position
- RSI of Close Price crossover Overbought (Take profit)
or
- RSI of Low Price crossunder upper value of Middle Channel (Stop loss)
2.2 Short Condition
- RSI of Close Price crossover Oversold
- Close Price higher than Median Price (HL2)
- RSI of Median Price below Oversold
2.2 Close Long Position
- RSI of Close Price crossunder Oversold (Take profit)
or
- RSI of High Price crossover lower value of Middle Channel (Stop loss)
3. Idea
- Follow strong momentum of Price to catch Flash Buy/Sell Bar in Crypto Market
- RSI of High Price and Low Price help to regconize setup failure quickly.
- This case study desire to find a balance of Winrate, Profit factor, Sharpe Ratio
High/low crypto strategy with MACD/PSAR/ATR/EWaveToday I am glad to bring you another great creation of mine, this time suited for crypto markets.
MARKET
Its a high and low strategy, designed for crypto markets( btcusd , btcusdt and so on), and suited for for higher time charts : like 1hour, 4hours, 1 day and so on.
Preferably to use 1h time charts.
COMPONENTS
Higher high and lower low between different candle points
MACD with simple moving average
PSAR for uptrend and downtrend
Trenddirection made of a modified moving average and ATR
And lastly elliot wave oscillator to have an even better precision for entries and exits.
ENTRY DESCRIPTION
For entries we have : when the first condition is meet(we have a succession on higher high or lower lows), then we check the macd histogram level, then we pair that with psar for the direction of the trend, then we check the trend direction based on atr levels with MA applied on it and lastly to confirm the direction we check the level of elliot wave oscillator. If they are all on the same page we have a short or a long entry.
STATS
Its a low win percentage , we usually have between 10-20% win rate, but at the same time we use a 1:30 risk reward ratio .
By this we achieve an avg profit factor between 1.5- 2.5 between different currencies.
RISK MANAGEMENT
In this example, the stop loss is 0.5% of the price fluctuation ( 10.000 -> 9950 our sl), and tp is 15% (10.000 - > 11500).
In this example also we use a 100.000 capital account, risking 5% on each trade, but since its underleveraged, we only use 5000 of that ammount on every trade. With leveraged it can be achieved better profits and of course at the same time we will encounter bigger losses.
The comission applied is 5$ and a slippage of 5 points aswell added.
For any questions or suggestions regarding the script , please let me know.

Lagged Donchian Channel + EMAThis strategy is based on a lagged 24 periods Donchian Channel and a 200 periods EMA .
The enter positions are calculated this way :
Bull entry
1. we wait for the close of a candle below the channel and it must be below the 200 EMA
2. the following candle must be a green one and close in the lagged channel
3. we put a long order at the close of the second candle, a stop loss at the low of last 3 candles and a x3 take profit
Bear entry
1. we wait for the close of a candle above the channel and it must be above the 200 EMA
2. the following candle must be a red one and close in the lagged channel
3. we put a short order at the close of the second candle, a stop loss at the high of last 3 candles and a x3 take profit
For both long or short positions :
If the order is not filled, it's cancelled if the price reach 50% of the TP or if the price reach the stop loss level
The position is closed if a new bear/bull condition appears in the other side of the position (if a bear appears when you're long and inversement)
Features :
Position calculator's included with leverage option
Labels of position can be plotted or not
Bull/Bear channels can be plotted with red and green filled
All parameters can be changed for backtesting
Better results have been got with defaults parameters on LTCUSDTPERP in H1 timeframe => profit factor of 2.84 with almost 100 positions.
Hope this strategy will be useful and it would be cool if I could get feedback, comments or better combinations of parameters !!
Don't hesitate to like and leave a comment ;)
@Mysteriown

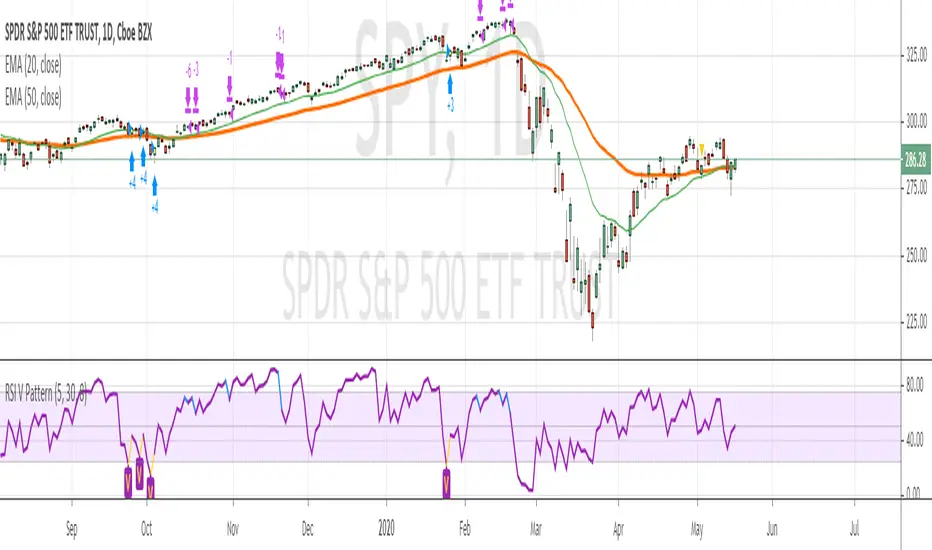
RSI V Pattern strategyThis strategy based on RSI for swing trading or short term trading
Strategy Rules
=============
LONG
1. ema20 is above ema50 --- candles are colored green on the chart
2. RSI value sharply coming up
previous candle1 low is previous candle2 low and previous candle1 RSI value is less than previous candle2
current candle RSI value is greater than previous candle1 and crossing above 30
above which makes a V shape on RSI indicator, colored in yellow on the chart , price bar is colored in yellow
3. Enter Long when the above V pattern occurs
EXIT LONG
1. when the RSI reaches 70 , close half position and move stop loss to up
2. when RSI reaches high value 90, close 3/4 position
3. when RSI crossing below 10 OR stopLoss hit , whichever happens first , close whole position
Note : take profit levels are colored in blue on RSI and Price candles
I have tested SPY , QQQ on daily chart , performance results are with 80% win rate and more than 3 profit factor
Happy Trading
Monthly MA Close Generates buy or sell signal if monthly candle closes above or below the signal MA.
Long positions only.
Inputs:
-Change timeframe MA
-Change period MA
-Use SMA or EMA
-Display MA
-Use another ticker as signal
-Select time period for backtesting
This script is not necessarily written to maximize profits, but to minimize losses.
Although it can outperform 'Buy & Hold' on some occasions when there is a multiple month bearisch trend.
You can optimise this strategy by changing the signal MA inputs.
I would suggest aiming for the best Profit Factor starting from the monthly ("M") setting.
You can always fine-tune the results at a lower timeframe.
The option to use another ticker for providing signals can give you a more stable and unified results.
For example using AMEX:SPY as signal with default parameters gives better results with NASDAQ:AAPL than if you would use NASDAQ:AAPL itself.
I used the anti-repainting function from PineCoders to prevent repainting.
This script is best used for multi-month trading positions & Daily or 4H setting of your chart.

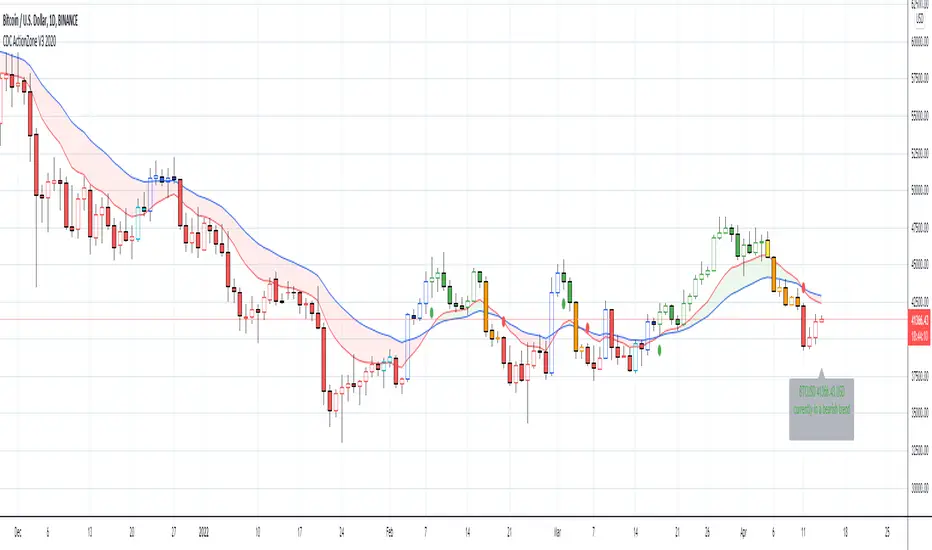
CDC ActionZone V3 2020## CDC ActionZone V3 2020 ##
This is an update to my earlier script, CDC ActionZone V2
The two scripts works slightly differently with V3 reacting slightly faster.
The main update is focused around conforming the standard to Pine Script V4.
## How it works ##
ActionZone is a very simple system, utilizing just two exponential moving
averages. The 'Zones' in which different 'actions' should be taken is
highlighted with different colors on the chart. Calculations for the zones
are based on the relative position of price to the two EMA lines and the
relationship between the two EMAs
CDCActionZone is your barebones basic, tried and true, trend following system
that is very simple to follow and has also proven to be relatively safe.
## How to use ##
The basic method for using ActionZone is to follow the green/red color.
Buy when bar closes in green.
Sell when bar closes in red.
There is a small label to help with reading the buy and sell signal.
Using it this way is safe but slow and is expected to have around 35-40%
accuracy, while yielding around 2-3 profit factors. The system works best
on larger time frames.
The more advanced method uses the zones to switch between different
trading system and biases, or in conjunction with other indicators.
example 1:
Buy when blue and Bullish Divergence between price and RSI is visible,
if not Buy on Green and vise-versa
example 2:
Set up a long-biased grid and trade long only when actionzone is in
green, yellow or orange.
change the bias to short when actionzone turns to te bearish side
(red, blue, aqua)
(Look at colors on a larger time frame)
## Note ##
The price field is set to close by default. change to either HL2 or OHLC4
when using the system in intraday timeframes or on market that does not close
(ie. Cryptocurrencies)
## Note2 ##
The fixed timeframe mode is for looking at the current signal on a larger time frame
ie. When looking at charts on 1h you can turn on fixed time frame on 1D to see the
current 'zone' on the daily chart plotted on to the hourly chart.
This is useful if you wanted to use the system's 'Zones' in conjunction with other
types of signals like Stochastic RSI, for example.
BitMEX pump catcher - MACDThis is a modified version of the BitMEX pump catcher by Jomy .
I have tweaked the algorithm to use the difference in MACD to get the correct direction of entries rather than using direction of candles which are not always indicative of trend direction. These changes increase net profit, profitable trades, while reducing drawdown.
Below is a copy and paste of Jomy's explanation of the algorithm.
What is going on here? This strategy is pretty simple. We start by measuring a very long chunk of volume history on BitMEX:XBTUSD 1 hour chart to find out if the current volume is high or low. At 1.0 the indicator is showing we are at 100% of normal historical volume . The blue line is a measure of recent volume! This indicator gets interested when the volume drops below 90% of the regular volume (0.9), and then comes back up over 90%. There's usually a pump of increased price activity during this time. When the 0.9 line is crossed by the blue line, the indicator surveys the last 2 bars of price action to figure out which way we're going, long or short. Green is long. Red is short. To exit the trade we use a 7 period fast ema of the volume crossing under an 11 ema slower period which shows declining interest in the market signifying an end to the pump or dump. The profit factor is quite high with 5x leverage, but historically we see 50% drawdown -- very risky. 1x leverage looks nice and tight with very low drawdown. Play with the inputs to see what matches your own risk profile. I would not recommend taking this into much lower timeframes as trading fees are not included in the profit calculations. Please don't get burned trading on stupid high leverage. This indicator is probably not going to work well on alts, as Bitcoin FOMO build up and behavior is different. This whole indicator is tuned to Bitcoin , and attempts to trade only the meatiest part of the market moves.
Jomy should get full credit to this indicator

BitMEX pump catcherWhat is going on here? This strategy is pretty simple. We start by measuring a very long chunk of volume history on BitMEX:XBTUSD 1 hour chart to find out if the current volume is high or low. At 1.0 the indicator is showing we are at 100% of normal historical volume. The blue line is a measure of recent volume! This indicator gets interested when the volume drops below 90% of the regular volume (0.9), and then comes back up over 90%. There's usually a pump of increased price activity during this time. When the 0.9 line is crossed by the blue line, the indicator surveys the last 2 bars of price action to figure out which way we're going, long or short. Green is long. Red is short. To exit the trade we use a 7 period fast ema of the volume crossing under an 11 ema slower period which shows declining interest in the market signifying an end to the pump or dump. The profit factor is quite high with 5x leverage, but historically we see 50% drawdown -- very risky. 1x leverage looks nice and tight with very low drawdown. Play with the inputs to see what matches your own risk profile. I would not recommend taking this into much lower timeframes as trading fees are not included in the profit calculations. Please don't get burned trading on stupid high leverage. This indicator is probably not going to work well on alts, as Bitcoin FOMO build up and behavior is different. This whole indicator is tuned to Bitcoin, and attempts to trade only the meatiest part of the market moves.
Weaknesses: it can sometimes pick to trade the wrong direction if if hits support or resistance and changes direction after a trade is entered. Use a stoploss.
Strengths: It usually gets things right. Historically over 57% right.
Use at your own risk!

Strategy for The Bitcoin Buy/Sell IndicatorThis is the strategy for
Starting with a capital of $3,000 XBT , one might have $15,975 dollar worth of XBT plus whatever the bitcoin has appreciated over the years.
The Sharpe Ratio: 0.586, Net Profit is 532%, 57 closed trades from 2017 till today, Profit factor of 3.745 (aka for every dollar loss, there is 3.745 dollar profit) with 14% drawdown .
Let that sink in.

Adaptive Zero Lag EMA [STUDY]A user has asked for the Study/Indicator version of this Strategy .
If you encounter the error "loop....>100ms" simply toggle the eye icon to hide and unhide the indicator
The following is simply quoted from my previous post for your convenience: (obviously there won't be risk, Stop Loss, or Take profit parameters!)
OPERATING PRINCIPLE
The strategy is based on Ehlers idea that any indicator can be turned into a signal-producing trade system through smoothing and other filtering processes.
In fact, I'm using his Zero Lag EMA ( ZLEMA ) as a baseline indicator as well as some code snippets he has made public (1). God bless open source!
Next, I've provided the option to use an Instantaneous Frequency Measurement (IFM) method, which will adaptively choose the best period for the ZLEMA (2)
I've written other studies that use the differential calculus approximations for IFM, so it was only natural to include them in this strategy.
The primary two are Cosine IFM (3) and In-phase Quadrature IFM (4). You can also find an indicator with both plotted and the ability to average them together, as one IFM prefers long periods and the other short. (5)
BEFORE WE BEGIN
1. This strategy only runs on "normal" FX pairs ( EURUSD , GBPJPY , AUDUSD ...) and will fail on Metals or Commodities.
Cryptos are largely untested.
2. Please run it on these time frames: M15 to D.
Anything outside this range will likely fail.
HOW TO USE AND SUCCEED
1. If the Default settings don't produce good results right off the bat, then lower gain limit to 1 or 2 and threshold to 0.01.
2. Test each setting under adaptive method. If you want to leave it Off, then I'd recommend using some kind of IFM (see my links below) to
discover the most efficient period to use.
3. Once you have the best adaptive method chosen, begin incrementing gain limit until you find a nice balance between profit factor ( PF ) and drawdown.
4. Now, begin incrementing threshold. The goal is to have PF above 2 and a drawdown as low as possible.
5. Finally, change the source! Typically, close is the best option, but I have run into cases where high
yielded the highest returns and win rate.
6. Sit back, relax, and tweak the risk until you're happy with the return and drawdown amounts.
ADVANCED
You may need to adjust take profit (TP) points and stop loss (SL) points to create the best entry possible. Don't be greedy! You'll likely have poor
results if the TP is set to 300 and SL is 50.
If you are trading a pair that has a long Dominant Cycle Period, then you may increase Max Period to allow the IFM
to accept longer periods. Any period above the Max Period will be rejected. This may increase lag time!
Cheers and good luck trading!
-DasanC
(1)www.mesasoftware.com
(2)www.jamesgoulding.com
(3) Cosine IFM
(4) I-Q IFM
(5) Averaging IFM
IFM stands for Instantaneous frequency measurement
Adaptive Zero Lag EMA v2This is my most successful strategy to date! Please enjoy and join the Open Source movement by sharing your code and ideas online!
OPERATING PRINCIPLE
The strategy is based on Ehlers idea that any indicator can be turned into a signal-producing trade system through smoothing and other filtering processes.
In fact, I'm using his Zero Lag EMA (ZLEMA) as a baseline indicator as well as some code snippets he has made public (1). God bless open source!
Next, I've provided the option to use an Instantaneous Frequency Measurement (IFM) method, which will adaptively choose the best period for the ZLEMA (2)
I've written other studies that use the differential calculus approximations for IFM, so it was only natural to include them in this strategy.
The primary two are Cosine IFM (3) and In-phase Quadrature IFM (4). You can also find an indicator with both plotted and the ability to average them together, as one IFM prefers long periods and the other short. (5)
BEFORE WE BEGIN
1. This strategy only runs on "normal" FX pairs (EURUSD, GBPJPY, AUDUSD ...) and will fail on Metals or Commodities.
Cryptos are largely untested.
2. Please run it on these time frames: M15 to D.
Anything outside this range will likely fail.
HOW TO USE AND SUCCEED
1. If the Default settings don't produce good results right off the bat, then lower gain limit to 1 or 2 and threshold to 0.01.
2. Test each setting under adaptive method . If you want to leave it Off , then I'd recommend using some kind of IFM (see my links below) to
discover the most efficient period to use.
3. Once you have the best adaptive method chosen, begin incrementing gain limit until you find a nice balance between profit factor (PF) and drawdown.
4. Now, begin incrementing threshold . The goal is to have PF above 2 and a drawdown as low as possible.
5. Finally, change the source ! Typically, close is the best option, but I have run into cases where high
yielded the highest returns and win rate.
6. Sit back, relax, and tweak the risk until you're happy with the return and drawdown amounts.
ADVANCED
You may need to adjust take profit (TP) points and stop loss (SL) points to create the best entry possible. Don't be greedy! You'll likely have poor
results if the TP is set to 300 and SL is 50.
If you are trading a pair that has a long Dominant Cycle Period , then you may increase Max Period to allow the IFM
to accept longer periods. Any period above the Max Period will be rejected. This may increase lag time!
Cheers and good luck trading!
-DasanC
PS - This code doesn't repaint or have future-leak, which was present in Pinescript v2.
PPS - Believe me! These returns are typical! Sometimes you must push aside the "if it's too good to be true..." mindset that society has ingrained in you.
Do you really believe the most successful pass up opportunities before investigating them? ;)
(1) Ehlers & Ric Zero Lag EMA
(2) Measuring Cycles by Ehlers
(3) Cosine IFM
(4) Inphase Quadrature IFM
(5) Averaging IFM

CCI Level Zero Strategy (by Marcoweb) v1.0Hi guys,
My strategy is ready :)
Finally the zero level of the CCI gives the start and stop to my positions. As you could notice, setting up the CCI length to 340 area on 1 minute chart will let the profit factor go up to 20% from an already wonderful 16%. This is a great result cause will let profitable trades run while stopping the wrong ones with a very limited loss. What makes our profit are not several small little positions that are clearly unrepitable in real trade but few and very profitable positions in which jumping in will be easier due to their length (71 bars average).
Please share with me your impressions and suggestions.
Have a nice trade :)

Vix FIX / StochRSI StrategyThis strategy is based off of Chris Moody's Vix Fix Indicator . I simply used his indicator and added some rules around it, specifically on entry and exits.
Rules :
Enter upon a filtered or aggressive entry
If there are multiple entry signals, allow pyramiding
Exit when there is Stochastic RSI crossover above 80
This works great on a number of stocks. I am keeping a list of stocks with decent Profit Factors and clean equity curves here .
Possible ways to use this:
Modify this script and setup alerts around the various entries
Use as is with different stocks or currency pairs
Modify entry / exit points to make it more profitable for even more symbols and currencies

MULTIPLE TIME-FRAME STRATEGY(TREND, MOMENTUM, ENTRY) Hey everyone, this is one strategy that I have found profitable over time. It is a multiple time frame strategy that utilizes 3 time-frames. Highest time-frame is the trend, medium time-frame is the momentum and short time-frame is the entry point.
Long Term:
- If closed candle is above entry then we are looking for longs, otherwise we are looking for shorts
Medium Term:
- If Stoch SmoothK is above or below SmoothK and the momentum matches long term trend then we look for entries.
Short Term:
- If a moving average crossover(long)/crossunder(short) occurs then place a trade in the direction of the trend.
Close Trade:
- Trade is closed when the Medium term SmoothK Crosses under/above SmoothD.
You can mess with the settings to get the best Profit Factor / Percent Profit that matches your plan.
Best of luck!

MACD, backtest 2015+ only, cut in half and doubledThis is only a slight modification to the existing "MACD Strategy" strategy plugin!
found the default MACD strategy to be lacking, although impressive for its simplicity. I added "year>2014" to the IF buy/sell conditions so it will only backtest from 2015 and beyond ** .
I also had a problem with the standard MACD trading late, per se. To that end I modified the inputs for fast/slow/signal to double. Example: my defaults are 10, 21, 10 so I put 20, 42, 20 in. This has the effect of making a 30min interval the same as 1 hour at 10,21,10. So if you want to backtest at 4hr, you would set your time interval to 2hr on the main chart. This is a handy way to make shorter time periods more useful even regardless of strategy/testing, since you can view 15min with alot less noise but a better response.
Used on BTCCNY OKcoin, with the chart set at 45 min (so really 90min in the strategy) this gave me a percent profitable of 42% and a profit factor of 1.998 on 189 trades.
Personally, I like to set the length/signals to 30,63,30. Meaning you need to triple the time, it allows for much better use of shorter time periods and the backtests are remarkably profitable. (i.e. 15min chart view = 45min on script, 30min= 1.5hr on script)
** If you want more specific time periods you need to try plugging in different bar values: replace "year" with "n" and "2014" with "5500". The bars are based on unix time I believe so you will need to play around with the number for n, with n being the numbers of bars.

CamarillaStrategy -V1 - H4 and L4 breakout - exits addedExits added using trailing stops.
2.6 Profit Factor and 76% Profitable on SPY , 5M - I think it's a pretty good number for an automated strategy that uses Pivots. I don't think it's possible to add volume and day open price in relation to pivot levels -- that's what I do manually ..
Still trying to add EMA for exits.. it will increase profitability. You can play in pinescript with trailing stops entries..

Ultimate Oscillator Trading StrategyThe Ultimate Oscillator Trading Strategy implemented in Pine Script™ is based on the Ultimate Oscillator (UO), a momentum indicator developed by Larry Williams in 1976. The UO is designed to measure price momentum over multiple timeframes, providing a more comprehensive view of market conditions by considering short-term, medium-term, and long-term trends simultaneously. This strategy applies the UO as a mean-reversion tool, seeking to capitalize on temporary deviations from the mean price level in the asset’s movement (Williams, 1976).
Strategy Overview:
Calculation of the Ultimate Oscillator (UO):
The UO combines price action over three different periods (short-term, medium-term, and long-term) to generate a weighted momentum measure. The default settings used in this strategy are:
Short-term: 6 periods (adjustable between 2 and 10).
Medium-term: 14 periods (adjustable between 6 and 14).
Long-term: 20 periods (adjustable between 10 and 20).
The UO is calculated as a weighted average of buying pressure and true range across these periods. The weights are designed to give more emphasis to short-term momentum, reflecting the short-term mean-reversion behavior observed in financial markets (Murphy, 1999).
Entry Conditions:
A long position is opened when the UO value falls below 30, indicating that the asset is potentially oversold. The value of 30 is a common threshold that suggests the price may have deviated significantly from its mean and could be due for a reversal, consistent with mean-reversion theory (Jegadeesh & Titman, 1993).
Exit Conditions:
The long position is closed when the current close price exceeds the previous day’s high. This rule captures the reversal and price recovery, providing a defined point to take profits.
The use of previous highs as exit points aligns with breakout and momentum strategies, as it indicates sufficient strength for a price recovery (Fama, 1970).
Scientific Basis and Rationale:
Momentum and Mean-Reversion:
The strategy leverages two well-established phenomena in financial markets: momentum and mean-reversion. Momentum, identified in earlier studies like those by Jegadeesh and Titman (1993), describes the tendency of assets to continue in their direction of movement over short periods. Mean-reversion, as discussed by Poterba and Summers (1988), indicates that asset prices tend to revert to their mean over time after short-term deviations. This dual approach aims to buy assets when they are temporarily oversold and capitalize on their return to the mean.
Multi-timeframe Analysis:
The UO’s incorporation of multiple timeframes (short, medium, and long) provides a holistic view of momentum, unlike single-period oscillators such as the RSI. By combining data across different timeframes, the UO offers a more robust signal and reduces the risk of false entries often associated with single-period momentum indicators (Murphy, 1999).
Trading and Market Efficiency:
Studies in behavioral finance, such as those by Shiller (2003), show that short-term inefficiencies and behavioral biases can lead to overreactions in the market, resulting in price deviations. This strategy seeks to exploit these temporary inefficiencies, using the UO as a signal to identify potential entry points when the market sentiment may have overly pushed the price away from its average.
Strategy Performance:
Backtests of this strategy show promising results, with profit factors exceeding 2.5 when the default settings are optimized. These results are consistent with other studies on short-term trading strategies that capitalize on mean-reversion patterns (Jegadeesh & Titman, 1993). The use of a dynamic, multi-period indicator like the UO enhances the strategy’s adaptability, making it effective across different market conditions and timeframes.
Conclusion:
The Ultimate Oscillator Trading Strategy effectively combines momentum and mean-reversion principles to trade on temporary market inefficiencies. By utilizing multiple periods in its calculation, the UO provides a more reliable and comprehensive measure of momentum, reducing the likelihood of false signals and increasing the profitability of trades. This aligns with modern financial research, showing that strategies based on mean-reversion and multi-timeframe analysis can be effective in capturing short-term price movements.
References:
Fama, E. F. (1970). Efficient Capital Markets: A Review of Theory and Empirical Work. The Journal of Finance, 25(2), 383-417.
Jegadeesh, N., & Titman, S. (1993). Returns to Buying Winners and Selling Losers: Implications for Stock Market Efficiency. The Journal of Finance, 48(1), 65-91.
Murphy, J. J. (1999). Technical Analysis of the Financial Markets: A Comprehensive Guide to Trading Methods and Applications. New York Institute of Finance.
Poterba, J. M., & Summers, L. H. (1988). Mean Reversion in Stock Prices: Evidence and Implications. Journal of Financial Economics, 22(1), 27-59.
Shiller, R. J. (2003). From Efficient Markets Theory to Behavioral Finance. Journal of Economic Perspectives, 17(1), 83-104.
Williams, L. (1976). Ultimate Oscillator. Market research and technical trading analysis.

Profit and Stoploss CalculatorThis script is designed to display three stop loss areas to assist either with automation of risk management or identify and alert when price is in a range of a trade for risk to reward ratio.
In this version there are three stop losses and 1 PT. Mainly because i will most likely only be using 1 of the SL to pair with the PT.
Stoploss areas are displayed on both sides of the price for long and short calculations along with the two profit factors but the settings in the indicator it self apply to both sides in terms of percentage.
