Profit MonitorProfit monitor refers to a tool or system used to track and analyze a company's financial performance, specifically its profitability. This can be in the form of software, spreadsheet, or dashboard that displays key metrics such as revenue, expenses, and net profit over time. The goal of a profit monitor is to give stakeholders, such as business owners, investors, or managers, a clear and up-to-date view of the company's financial health, enabling them to make informed decisions and identify areas for improvement.
חפש סקריפטים עבור "profit"
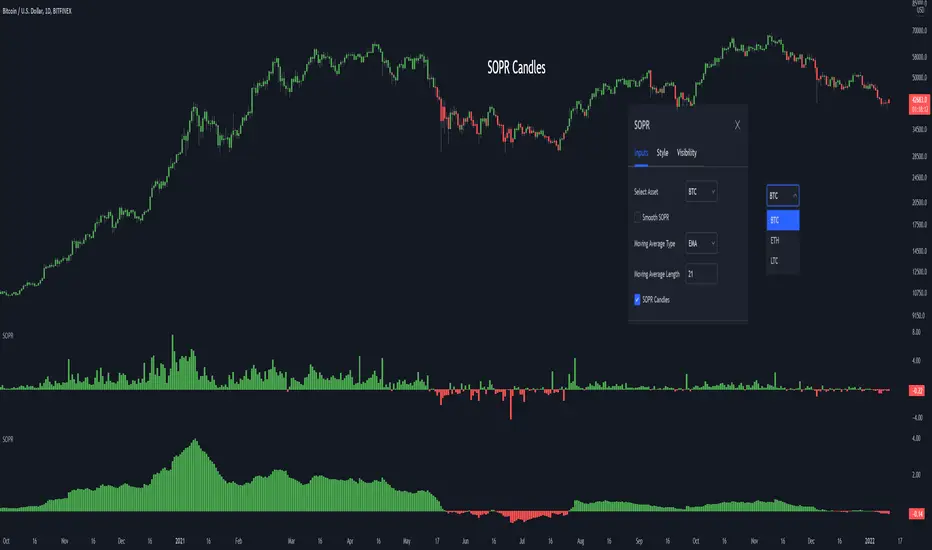
SOPR - Spent Output Profit RatioThe SOPR (Spent Output Profit Ratio) indicator provides insight into macro market sentiment, profitability and losses taken over a particular time-frame. It reflects the degree of realised profit for all coins moved on-chain.
SOPR is measured by considering only coins moved the timescale considered (daily, hourly etc), and taking the ratio between the fiat value at the time of UTXO creation, and the fiat value when the UTXO is spent.
SOPR values greater than 1 implies that the coins moved that day are, on average, selling at a profit (price sold is greater than the price paid).
SOPR value less than 1 implies that the coins moved that day are, on average, selling at a loss (price sold is less than the price paid).
You have the ability to see the SOPR of BTC, ETH and LTC. You can also smooth the SOPR using an EMA or SMA of your choice.
Thank you to both TradingView and Glassnode for adding all the on-chain data
Fixed Percent Stop Loss & Take Profit % - For Study Scripts===========
Fixed Percent Stop Loss & Take Profit % - { FOR STUDY SCRIPTS! }
===========
A neat example of how to set up Fixed Stops and Take Profit as a percent of the entry price - This is for setting Alerts within your own Study Script for when either your SL or TP get hit.
Yup, that's about it!
You can ignore the actual entry/exit orders - they're based on a simple MA cross and are therefore NOT relevant, NOT profitable and NOT recommended!
You should be using this code as a way of adding Stops and Takes to your own scripts - hope it helps!
Set your "Open Long/Short" Alerts to be triggered "Once per Bar Close" - Set your "SL/TP" Alerts to trigger "Once per Bar".
--
We wrote this with a bit of a rush on! ~ If you spot any mistakes/bugs just let us know and we'll get round to them asap!
-----------
Good Luck and Happy Trading!


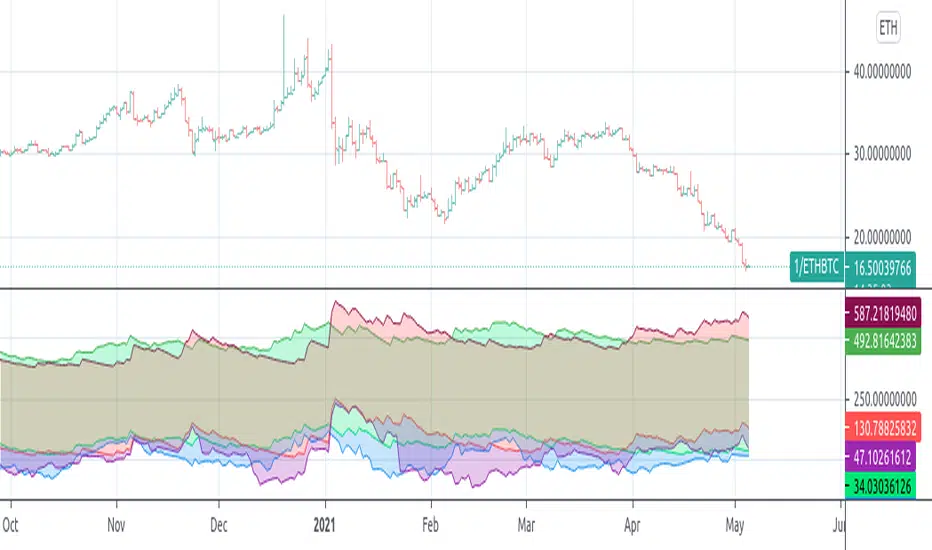
Altcoin Profitability Tracker 2Ever wonder which altcoins are performing better than Bitcoin? This script plots the profitability of 15 altcoins and BTCUSD so you can quickly determine where to invest your money.

Eze Profit - VWAP + MACD Combined SignalThe Eze Profit - VWAP + MACD Combined Signal is an advanced trading tool designed to help traders align price trends with momentum confirmation for better decision-making. By combining Volume-Weighted Average Price (VWAP) and Moving Average Convergence Divergence (MACD), this indicator provides clear entry and exit signals, allowing traders to follow trends and take advantage of momentum shifts.
How It Works:
VWAP:
VWAP represents the average price of an asset, weighted by volume, over a specific period.
It acts as a dynamic support/resistance level and trend filter. Price above VWAP indicates bullish conditions, while price below VWAP suggests bearish conditions.
MACD:
MACD measures momentum through the difference between fast and slow exponential moving averages (EMAs).
Signals are generated when the MACD line crosses its signal line:
Bullish Crossover: Indicates increasing upward momentum.
Bearish Crossunder: Indicates increasing downward momentum.
Combined Logic:
Long Signal: Triggered when price is above VWAP, and MACD exhibits a bullish crossover.
Short Signal: Triggered when price is below VWAP, and MACD exhibits a bearish crossunder.
The script tracks the trader's "in-position" state to prevent redundant signals and ensure clarity.
How to Use:
Use this script to identify potential long and short trading opportunities:
Buy Signal: Enter a long position when the price moves above VWAP and MACD confirms bullish momentum.
Sell Signal: Exit or short when the price drops below VWAP and MACD confirms bearish momentum.
Combine with additional tools like support/resistance, volume analysis, or candlestick patterns for confirmation.
Features:
VWAP Trend Filter: Dynamically adjusts to the trading session to identify overall trend direction.
MACD Momentum Confirmation: Detects key momentum shifts with configurable settings for fast, slow, and signal lengths.
Position State Tracking: Avoids signal redundancy by monitoring open positions.
Buy/Sell Visualizations: Plots Buy/Sell signals directly on the chart for ease of use.
Alerts: Notifies traders in real-time when a long or short signal is triggered.
Customizable Settings:
MACD Fast Length, Slow Length, and Signal Smoothing parameters.
VWAP timeframe resolution to adapt to different trading styles (e.g., intraday or daily).
Credits:
This script is based on standard VWAP and MACD calculations provided by TradingView’s library and has been enhanced with unique logic for combined signal generation.
Notes:
This indicator is intended for educational purposes and should not be considered financial advice. Use it as part of a broader trading strategy alongside other tools for optimal results.

Partial Profit Calculator [TFO]This indicator was built to help calculate the outcome of trades that utilize multiple profit targets and/or multiple entries.
In its simplest form, we can have a single entry and a single profit target. As shown below in this long trade example, the indicator will draw risk and reward boxes (red and green, respectively) with several annotations. On the left-hand side, all entries will be displayed (in this case there is only one entry, "E1"). On the bottom, the "SL" label indicates the trade's stop loss placement. On the top, all target prices are displayed (in this case there is only one target, "TP1"). Lastly, on the right-hand side a label will display the total R that is to be expected from a winning trade, where R is one's unit of risk.
In the following example, we have two target prices - one at 18600 and one at 18700. You can input as many target prices as you'd like, separated by commas, i.e. "18600,18700" in this example. Make sure the values are separated by commas only, and not spaces, new lines, etc. As a result, we can see that the indicator draws where our profit targets would be with respect to our entry, E1. The indicator assumes that equal parts of the trade position are taken off at each target price. In this example on Nasdaq futures (NQ1!), since we have 2 target prices, this would be equivalent to assuming that we take exactly half the trade position off at TP1, and the remaining half of the position at TP2.
If we wanted to take more of the position off at a certain target, we could simply duplicate the target price. Here I set the target prices to "18600,18600,18700" to enforce that two thirds of the position be taken off at TP1 and TP2, while the remaining third gets taken off at TP3.
We can also show outcome annotations to describe how much R is generated from each possible trade outcome. Using the below chart as an example, the stop loss indicates a -1R loss. The total R from this trade criteria is 1.33 R, and each target price shows how much R is being generated if one were to take off an equal part of the position at said target prices. In this case, we would generate 0.17 R from taking one third of the position off at TP1, another 0.5 R from taking one third of the position off at TP2, and another 0.67 R from taking the remaining one third of the position off at TP3, all adding up to the total R indicated on the right-hand side label.
Using multiple entries works the same way as using multiple target prices, where the input should indicate each entry price separated by commas. In this example I've used "18550,18450" to achieve an average price of 18500, as indicated by the "E_avg" label that appears when more than one entry price is utilized. We can also opt to display risk as dollars instead of R values, where you can input your desired risk per trade, and all values are shown as dollar amounts instead of R multiples, as shown below with a risk per trade of $100.
This is meant to be an educational tool for trades that utilize multiple profit targets and/or entries. Hope you like it!

Volatility Adjusted Profit Target
In my 'Volatility Adjusted Profit Target' indicator, I've crafted a dynamic tool for calculating target profit percentages suitable for both long and short trading strategies. It evaluates the highest and lowest prices over the anticipated duration of your trade, establishing a profit target that shifts with market volatility. As volatility increases, the potential for profit follows, with the target percentage rising accordingly; conversely, it declines with decreasing volatility. As a trader, setting an optimal Take Profit level has always been a challenge. This indicator not only helps in determining that level but also dynamically adjusts it throughout the trade's duration, providing a strategic edge in volatile markets.

ATR profit and loss linesWhat is ATR?
Taking a candlestick, the following 3 transactions are calculated:
1-The difference between the high of the day and the low of the day
2-The difference between today's high and yesterday's close
3-The difference between today's low and yesterday's close
Atr takes the average of these 14-day candlesticks after making their calculations and it predicts how high or low a candle can go and these give us support and resistance helps with points
If you have noticed a rise in your chart and have no idea how high it will go, you can use Atr profit and loss lines.
The red zone is the stop point, the blue zones are the snow zones.
Must be used with macd. macd is validator.
There is an increase in your chart, you opened the atr profit and loss lines upwards and if macd gives you an increase, it is recommended that you enter the trade at that time. It is recommended to increase your loss line 1 step in the direction of profit every 2 profit breaks on atr profit and loss lines.
ATR Nedir?
Bir mum barı ele alınarak şu 3 işlem hesaplanır:
1-Günün yükseği ile günün düşüğü farkı
2-Günün yükseği ile dünün kapanışının farkı
3-Günün düşüğü ile dünkü kapanışın farkı
ATR ise 14 günlük bu mum barlarının hesaplarını yaptıktan sonra ortalamasını alır ve bir mumum ne kadar yükselip düşebileceği konusunda tahmin verir ve bunlar bize destek ve direnç noktaları konusunda yardımcı olur
Eğer grafiğinizde bir yükseliş farketmişseniz ne kadar yükseleceği konusunda fikriniz yoksa Atr kar zarar çizgilerini kullanabilirsiniz.
Kırmızı bölge durdurma noktası,mavi bölgeler kar bölgeleridir.
Macd ile birlikte kullanılmalıdır.macd doğrulayıcıdır.
Grafiğinizde yükseliş var,atr kar zarar çizgilerini yukarı yönlü açtınız ve macd size yükseliş veriyorsa işte o sırada işleme girmeniz tavsiye edilir.atr kar zarar çizgilerinde her 2 kar kırılımında bir zarar çizginizi kar yönünde 1 kademe arttırmanız önerilir

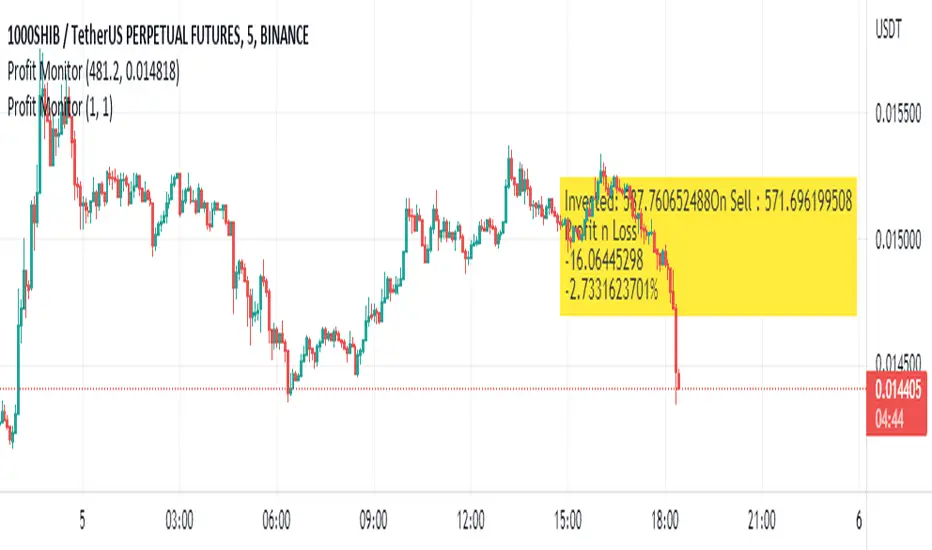
Manual PnL (Profit and Loss) % Tracker - spot long only
This is a manual profit and loss tracker. It takes the user's manual input of total cost and quantity, and then outputs a table on the bottom right of the chart showing the profit or loss %, average purchase price, gross profit or loss, and market value.
Instructions:
1. Double click the indicator title at the top left of the chart
2. Select the "Inputs" tab and click the empty field next to "Symbol" to enter the traded symbol+exchange. This entry MUST be the same as the chart you are on, for example BTCUSDT/BINANCE (indicator will not display otherwise)
3. Enter the Total Cost and Qty of shares/coins owned
4. Optional - change positive or negative colors
5. Optional - under the "Style" tab, change the color of the average price (AVG) line
Note that for the average price (AVG) line to be shown/hidden you must enable/disable "Indicator and financials labels" in the scales settings.
For crypto or other tickers that have prices in many decimal places I would suggest, for the sake of accuracy, adjusting the decimal places in the code so that for prices under $1 you will display more info.
For example let's say you purchase x number of crypto at a price of 0.031558 you should change the code displaying "0.00" on line 44 to "0.000000"
This will ensure that the output table and plotted line will calculate an average price with the same number of decimals.

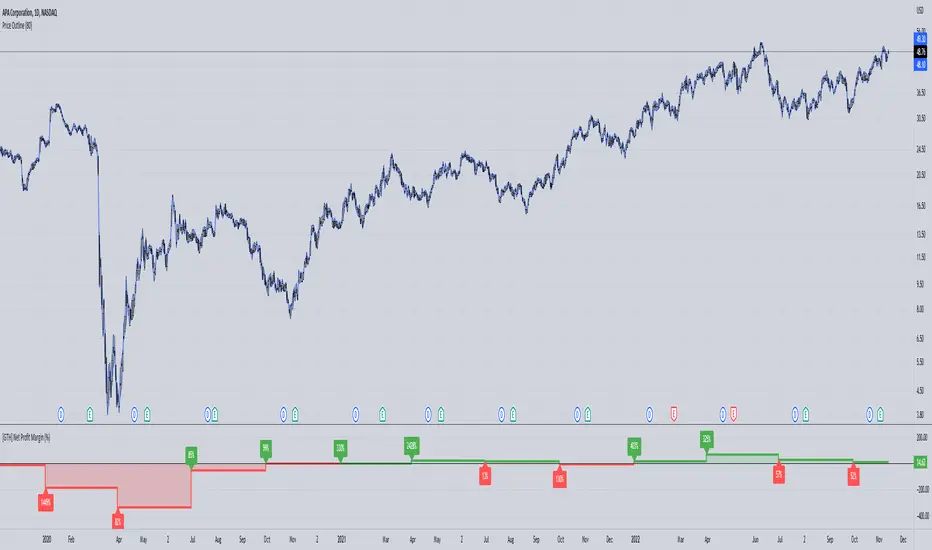
[GTH] Net Profit Margin (%)Displays the Net Profit Margin in a more "readable" fashion than the built-in TV Indicator.
This indicator concludes the series of 'Minervini-indicators', consisting of "GTH Earnings", "GTH Revenues" and "GTH Net Profit Margin (%)".
Famous trader Mark Minervini repeately describes rising earnings, revenues and net profit margin as the most important financials for finding superperformers.
In case of reporting a malfunction: Please be specific. Statements like "does not work" are useless. Thanks.
Artharjan Profit & Loss CalculatorHi,
Artharjan Profit and Loss Calculator allows users to calculate Profit and Loss of their trades and see it on the chart itself
Users are supposed to select either Long or Short, Enter quantity and enter traded price. The live P&L will be plotted on the chart.
Happy trading :-)
Rahul

Indicator - ATR Profit Loss - DGHi Traders,
This is an on chart indicator that can be used for setting take profit and stop losses very easily using the Average True Range Indicator (ATR). Using a volatility adjusted TP and SL will allow you to set your targets and losses based on market conditions. In the settings, you are able to adjust how much of a multiplier you require depending on your risk tolerance and strategy. For those that follow the NNFX method, the defult settings are preset to 1xATR TP and 1.5xATR SL.
How to use:
- For longs, 'isLong' box must be ticked, for shorts, this box is unticked
- For longs, green line is TP, red line is SL
- For shorts, red line is TP, green line is SL
Regards,
Dillon Grech

Profit HarbingerProfit Harbinger is privately owned paid indicator on trading view, It is what I consider to be the current precipices of my trading journey. After years of trading stocks and crypto working tirelessly to perfect my strategy it was only after really sitting down with my mentor and teacher that we developed the alpha version of this strategy. After working for what seemed like forever on the math, and code. I developed this indicator to work in my stead. This indicator is the development of the aforementioned strategy converted into a machine to take all the emotions out of trading the various trade-able assets.

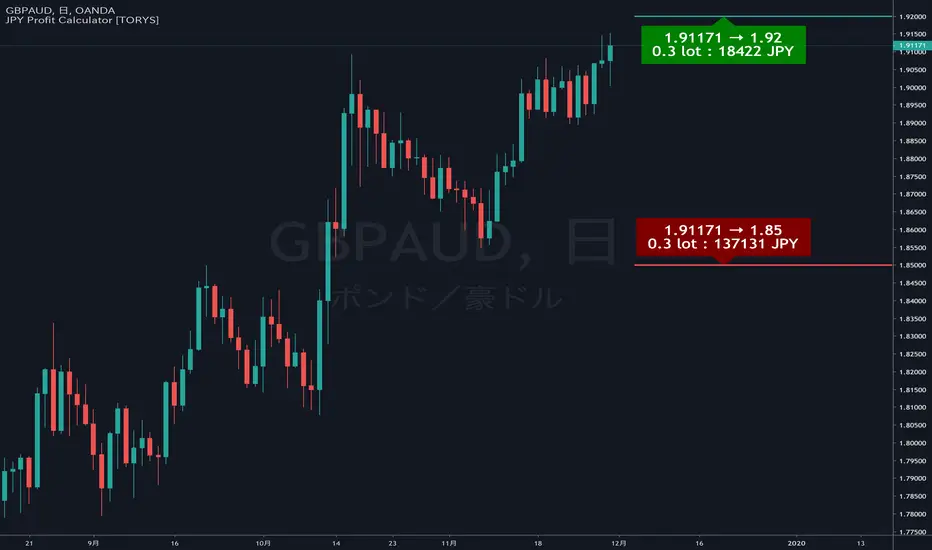
JPY Profit Calculator [TORYS]This is an indicator that automatically calculates profit and loss in Japanese yen.
Please enter the cross yen price.
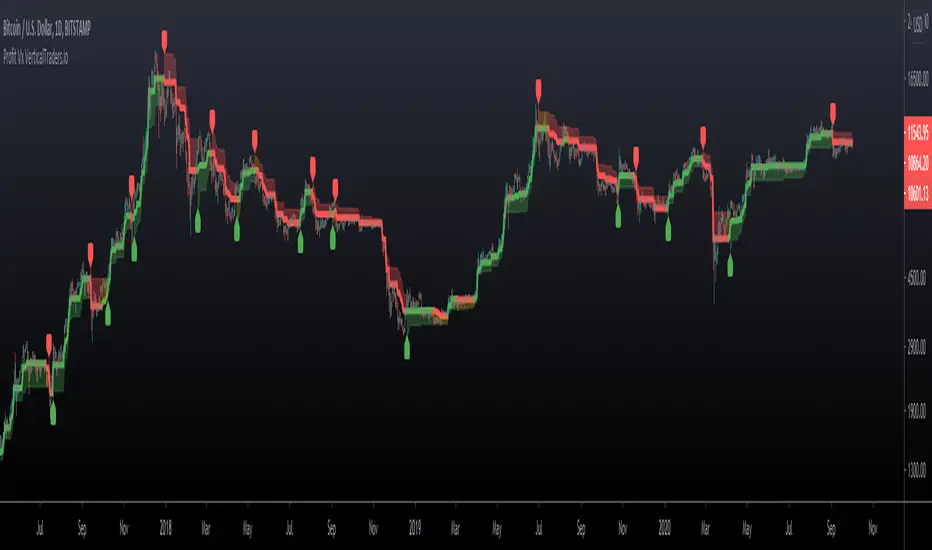
Profit VxProfit Vx
- Labels for Long and Short entries
- Take Profit point base on %
- Candlestick color, orange is warning or not trending zone
Enhanced RSI KDE | Advanced FiltersThis is an enhanced version of the excellent RSI (Kernel Optimized) indicator originally created by @fluxchart. Full credit goes to fluxchart for the innovative KDE (Kernel Density Estimation) concept and the solid foundation that made this enhancement possible.
🙏 CREDITS & ACKNOWLEDGMENTS
Original Creator: @fluxchart - RSI (Kernel Optimized)
Original Concept: Kernel Density Estimation applied to RSI pivot analysis
Enhancement: Advanced filtering system and signal optimization- profitgang
License: Mozilla Public License 2.0
🚀 WHAT'S NEW IN THIS ENHANCED VERSION
Building upon fluxchart's brilliant KDE RSI foundation, this version adds:
🔥 Advanced Filtering System:
Multi-Timeframe Confluence - Confirms signals across higher timeframes
Volume Confirmation - Only signals on above-average volume
Volatility Range Filter - Avoids signals in choppy or extreme conditions
Trend Context Analysis - Considers overall market direction
Adaptive Pivot Detection - Adjusts sensitivity based on market volatility
🎯 Signal Quality Improvements:
Confluence Scoring - Each signal gets a quality score (1-6)
Label Cooldown System - Prevents chart clutter with smart spacing
Higher Activation Thresholds - More selective signal generation
Risk Management Integration - Auto stop-loss and take-profit levels
📊 Enhanced Dashboard:
Real-time filter status monitoring
KDE probability percentages
Confluence scores for both directions
Volume and volatility readings
⚙️ HOW IT WORKS
The indicator maintains fluxchart's core KDE methodology:
Collects RSI values at historical pivot points
Creates probability density functions using Gaussian/Uniform/Sigmoid kernels
Identifies high-probability zones for potential reversals
NEW: Multiple filters must align before generating signals, dramatically reducing false positives while maintaining the accuracy of high-probability setups.
🎛️ RECOMMENDED SETTINGS
Confluence Score: 5/6 (very selective)
Activation Threshold: Medium or High
Multi-Timeframe: Enabled with 2/2 alignment
Volume Filter: Enabled (1.5x threshold)
All other filters: Enabled for maximum quality
📈 BEST USE CASES
Swing Trading - Higher timeframe confirmation reduces whipsaws
Quality over Quantity - Fewer but much higher probability signals
Risk Management - Built-in stop/target levels for each signal
Multi-Asset Analysis - Works on stocks, crypto, forex, commodities
⚠️ IMPORTANT NOTES
This is a quality-focused indicator - expect fewer but better signals
Backtest thoroughly on your specific assets and timeframes
The original fluxchart indicator remains excellent for different trading styles
Consider this an alternative approach, not a replacement
🤝 COLLABORATION & FEEDBACK
Special thanks to @fluxchart for creating the original innovative KDE RSI concept. This enhancement wouldn't exist without that solid foundation.
Feel free to suggest improvements or share your results! The goal is to build upon great work in the community.

Floor and Roof Indicator with SignalsFloor and Roof Indicator with Trading Signals
A comprehensive support and resistance indicator that identifies premium and discount zones with automated signal generation.
Key Features:
Dynamic Support/Resistance Zones: Calculates floor (support) and roof (resistance) levels using price action and volatility
Premium/Discount Zone Identification: Highlights areas where price may find resistance or support
Customizable Signal Frequency: Control how often signals are displayed (every Nth occurrence)
Visual Signal Table: Optional table showing the last 5 long and short signal prices
Multiple Timeframe Compatibility: Works across all timeframes
Technical Details:
Uses ATR-based calculations for dynamic zone width adjustment
Combines Bollinger Bands with highest/lowest price analysis
Smoothing options for cleaner signal generation
Fully customizable colors and display options
How to Use:
Floor Zones (Blue): Potential support areas where long positions may be considered
Roof Zones (Pink): Potential resistance areas where short positions may be considered
Signal Crosses: Visual markers when price interacts with key levels
Signal Table: Track recent signal prices for analysis
Settings:
Length: Period for calculations (default: 200)
Smooth: Smoothing factor for cleaner signals
Zone Width: Adjust the thickness of support/resistance zones
Signal Frequency: Control signal display frequency
Visual Options: Customize colors and table position
Alerts Available:
Long signal alerts when price touches discount zones
Short signal alerts when price reaches premium zones
Educational Purpose: This indicator is designed to help traders identify potential support and resistance areas. Always combine with proper risk management and additional analysis.
This description focuses on the technical aspects and educational value while avoiding any language that could be interpreted as financial advice or guaranteed profits.

Dynamic TestingInput Parameters
`lookbackPeriod` : Number of candles to check for determining the highest high (resistance) and lowest low (support) levels.
`atrPeriod` : The period for calculating the Average True Range (ATR), a measure of market volatility.
`atrMultiplierSL` : Multiplier to calculate the stop-loss distance relative to the ATR.
`atrMultiplierTP1` and `atrMultiplierTP2` : Multipliers to calculate two take-profit levels relative to ATR.
`rewardToRisk` : The ratio between reward (profit) and risk (stop loss) for trade management.
---
Core Calculations
ATR (Average True Range)
atr = ta.atr(atrPeriod)
ATR is computed using the specified period to gauge price volatility.
Volume SMA
volumeSMA = ta.sma(volume, atrPeriod)
The script calculates the simple moving average of volume over the same period as ATR. This is used as a threshold for validating high-volume scenarios.
---
Support and Resistance Levels
`support` : Lowest price over the last `lookbackPeriod` candles.
`resistance` : Highest price over the same period.
`supportBuffer` and `resistanceBuffer` : These are "buffered" zones around support and resistance, calculated using half of the ATR to prevent false breakouts.
---
Entry Scenarios
Bullish Entry (`isBullishEntry`)
The close is above the buffered support level.
The low of the current candle touches or breaks below the support level.
The trading volume is greater than the `volumeSMA`.
Bearish Entry (`isBearishEntry`)
The close is below the buffered resistance level.
The high of the current candle touches or exceeds the resistance level.
The trading volume is greater than the `volumeSMA`.
---
Box Visualization
Bullish and Bearish Boxes
Bullish Box (`bullishBox`):
- A green, semi-transparent rectangle around the support level to highlight the bullish entry zone.
- Dynamically updates based on recent price action.
Bearish Box (`bearishBox`):
- A red, semi-transparent rectangle around the resistance level to highlight the bearish entry zone.
- Adjusts similarly as price evolves.
---
Stop Loss and Take Profit Calculations
Bullish Trades
Stop Loss (`bullishSL`): Calculated as support - atrMultiplierSL * ATR .
Take Profit 1 (`bullishTP1`): support + rewardToRisk * atrMultiplierTP1 * ATR .
Take Profit 2 (`bullishTP2`): support + rewardToRisk * atrMultiplierTP2 * ATR .
Bearish Trades
Stop Loss (`bearishSL`): resistance + atrMultiplierSL * ATR .
Take Profit 1 (`bearishTP1`): resistance - rewardToRisk * atrMultiplierTP1 * ATR .
Take Profit 2 (`bearishTP2`): resistance - rewardToRisk * atrMultiplierTP2 * ATR .
---
Visualization for Key Levels
Bullish Scenario
Green lines represent `bullishTP1` and `bullishTP2` for profit targets.
A red line indicates the `bullishSL` .
Labels like "TP1," "TP2," and "SL" dynamically appear at respective levels to make the targets and risk visually clear.
Bearish Scenario
Red lines represent `bearishTP1` and `bearishTP2` .
A green line marks the `bearishSL` .
Similar dynamic labeling for `TP1` , `TP2` , and `SL` at corresponding bearish levels.
---
Dynamic Updates
Both the entry boxes and key level visualizations (lines and labels) adjust dynamically based on real-time price and volume data.
---
Purpose
Identify high-probability bullish and bearish trade setups.
Define clear entry zones (using boxes) and exit levels (TP1, TP2, SL).
Incorporate volatility (via ATR) and volume into decision-making.
---
Technical Summary
Dynamically visualize support/resistance levels.
Set risk-managed trades using ATR-based stop-loss and profit levels.
Automate visual trade zones for enhanced chart clarity.
---

All-Market Monitor 中文說明
全能市場監測者是一款多功能指標,為交易者提供全面的市場監控,包含價格趨勢、移動平均線、交易量及風險管理等數據。此指標支援多項參數設置,方便交易者根據需求調整配置,實現更靈活的交易策略。
參數說明:
SMA長度設定:可調整7條不同長度的SMA (簡單移動平均線),提供不同時間框架的趨勢信息。
交易量倍數:設置交易量的倍數,強調異常的交易量變化。當交易量倍數達到指定條件時,K線會改變顏色,以便快速辨識市場中的顯著變動。
最低低點期間:設定計算最低價格線的期間,用於判斷進場後的趨勢止盈位置。此支撐線能幫助交易者在趨勢中保護利潤。
ATR期數與倍數:ATR (平均真實範圍) 用於計算止損線,期數及倍數可調整,以便根據波動性設定更合適的止損範圍。
進場價位與USDT總量:用戶可以輸入預計的進場價位和總資金量,指標會根據風險控制自動計算建倉金額。風險控制是每筆交易僅損失5%的總資金,以更好地管理風險。
倍數 (槓桿):此參數允許用戶設置槓桿倍數,用於計算最終所需的資金。
表格功能
指標的表格功能在圖表上顯示進場價位、止損點和建倉金額。表格顏色清晰對比,提供了簡明的交易數據概覽,使交易者能夠快速查看並根據當前市場情況做出風險控制決策。
交易量支撐效果
此指標在異常交易量倍數達到特定條件時會標示不同顏色,表現出強烈的市場關注度。當交易量出現突增或高於SMA交易量的情況時,往往顯示出支撐或阻力的信號。特別在價格頂部或底部時,這些異常交易量常會產生支撐效果,暗示該區域可能形成穩固的價格支撐或阻力。
這款指標適合希望嚴謹管理風險的交易者,適用於日內和長期策略,並能提供穩定的市場監控信息。
English Description
All-Market Monitor is a versatile indicator providing traders with comprehensive market insights, including price trends, moving averages, volume analysis, and risk management. This indicator supports multiple adjustable parameters, allowing traders to configure the settings for more adaptable trading strategies.
Parameter Descriptions:
SMA Length Settings: Configurable lengths for seven different SMAs (Simple Moving Averages) to provide trend information across various time frames.
Volume Multiplier: Sets the multiplier for trading volume to highlight unusual volume spikes. When volume conditions meet specified criteria, the candles change colors for easy recognition of significant market moves.
Lowest Low Period: Defines the period for calculating the lowest price line, which serves as a trailing take-profit level after entry. This support line helps traders secure profits in a trending market.
ATR Period and Multiplier: The ATR (Average True Range) is used to calculate a dynamic stop-loss level. Adjustable period and multiplier provide flexibility in setting stop levels based on market volatility.
Entry Price and Total USDT: Allows input of the intended entry price and total capital in USDT. The indicator calculates the required position size based on a risk management rule, where each trade is limited to a maximum loss of 5% of total capital.
Leverage: Users can set the leverage multiplier, which adjusts the final required USDT for entry.
Table Feature
The table feature provides an on-chart display of entry price, stop-loss level, and required position size, with distinct colors for easy reference. This layout delivers a clear summary of key trading metrics, enabling traders to make risk-adjusted decisions in real time.
Volume Support Effect
When unusual volume spikes meet specific criteria, the indicator highlights candles with distinct colors, representing heightened market interest. These volume spikes often indicate support or resistance levels, especially at price peaks or troughs, where high volume can signal potential support effects, indicating that prices may hold within these regions due to strong buying or selling interest.
This indicator is ideal for traders focused on rigorous risk management, suitable for both intraday and long-term strategies, offering reliable market monitoring insights.

DMI MTF Color Table v5DMI Multi-Timeframe Color Table v5
A comprehensive DMI (Directional Movement Index) table that displays trend direction and strength across multiple timeframes simultaneously. This indicator helps traders quickly assess market conditions and identify confluence across different time horizons.
Features:
Multi-timeframe analysis (7 configurable timeframes)
Color-coded cells based on trend strength and direction
Real-time current market condition display
Customizable strength thresholds and color schemes
Multiple display modes (All, DI+ Only, DI- Only, ADX Only)
Text-based strength classifications (STRONG/MEDIUM/WEAK)
Directional bias indicators (BULL/BEAR)
How It Works:
The table shows DI+, DI-, and ADX values across your chosen timeframes with intelligent color coding:
Green shades indicate bullish momentum (DI+ > DI-)
Red shades indicate bearish momentum (DI- > DI+)
Color intensity reflects trend strength based on ADX values
Current market condition appears in top-right corner
Display Options:
Toggle numerical values, strength text, and timeframe labels
Adjustable table size and transparency
Customizable color schemes for all conditions
Optional current timeframe DMI plot overlay
Educational Use:
This tool is designed for educational purposes to help understand multi-timeframe analysis and DMI interpretation. All trading decisions should be based on your own analysis and risk management.
Credits:
Original concept and development by Profitgang. If you use or modify this script, please provide appropriate credit to the original author.
Note: This indicator is for analysis purposes only. Past performance does not guarantee future results. Always conduct your own research and consider your risk tolerance before making trading decisions.
