Cyatophilum SuperTrend [BACKTEST]The SuperTrend Indicator and Strategy built upon Average True Range.
- Backtest Version -
>> READ HOW TO USE HERE <<
חפש סקריפטים עבור "range"

Noro's DDL StrategyThe lime area is a downward shift in price.
The red area is a price shift up.
Yellow background - signal for opening position.
If the lime range is less than the long parameter, open the long position.
If the candle is green, close the long position.
If the red range is more than a short parameter, open a short position.
If the candle is red, close the short position.

SUPERTREND ATR WITH TRAILING STOP LOSS## THIS SCRIPT IS ON GITHUB
## MORE BACKTEST
SuperTrend is a moving stop and reversal line based on the volatility (ATR).
The strategy will ride up your stop loss when price moviment 1%.
The strategy will close your operation when the market price crossed the stop loss.
The strategy will close operation when the line based on the volatility will crossed
The strategy has the following parameters:
+ **ATR PERIOD** - To select number of bars back to execute calculation
+ **ATR MULTPLIER** - To add a multplier factor on volatility
+ **INITIAL STOP LOSS** - Where can isert the value to first stop.
+ **POSITION TYPE** - Where can to select trade position.
+ **BACKTEST PERIOD** - To select range.
## DISCLAIMER
1. I am not licensed financial advisors or broker dealers. I do not tell you when or what to buy or sell. I developed this software which enables you execute manual or automated trades multiple trades using TradingView. The software allows you to set the criteria you want for entering and exiting trades.
2. Do not trade with money you cannot afford to lose.
3. I do not guarantee consistent profits or that anyone can make money with no effort. And I am not selling the holy grail.
4. Every system can have winning and losing streaks.
5. Money management plays a large role in the results of your trading. For example: lot size, account size, broker leverage, and broker margin call rules all have an effect on results. Also, your Take Profit and Stop Loss settings for individual pair trades and for overall account equity have a major impact on results. If you are new to trading and do not understand these items, then I recommend you seek education materials to further your knowledge.
**YOU NEED TO FIND AND USE THE TRADING SYSTEM THAT WORKS BEST FOR YOU AND YOUR TRADING TOLERANCE.**
**I HAVE PROVIDED NOTHING MORE THAN A TOOL WITH OPTIONS FOR YOU TO TRADE WITH THIS PROGRAM ON TRADINGVIEW.**
## NOTE
I accept suggestions to improve the script.
If you encounter any problems i will be happy to share with me.
+ Authors: @exit490
+ Revision: v1.0.0
+ Date: 5-Aug-2019
+ Pinescript version: 4
## LICENSE
Copyright 2019 Mauricio Pimenta / exit490
SuperTrend with Trailing Stop Loss script may be freely distributed under the (../LICENSE).

TRAILING STOP LOSS TO LONG AND SHORT##THIS SCRIPT IS ON GITHUB
This TradingView strategy it is designed to integrate with other strategies with indicators.
It performs a trailing stop loss from entry and exit conditions.
In this strategy you can add conditions for long and short positions.
The strategy will ride up your stop loss when price moviment 1%.
The strategy will close your operation when the market price crossed the stop loss.
Also is possible to select the period that strategy will execute the backtest.
The strategy has the following parameters:
+ **INITIAL STOP LOSS** - Where can isert the value to first stop.
+ **POSITION TYPE** - Where can to select trade position.
+ **BACKTEST PERIOD** - To select range.
## DISCLAIMER
1. I am not licensed financial advisors or broker dealers. I do not tell you when or what to buy or sell. I developed this software which enables you execute manual or automated trades multiple trades using TradingView. The software allows you to set the criteria you want for entering and exiting trades.
2. Do not trade with money you cannot afford to lose.
3. I do not guarantee consistent profits or that anyone can make money with no effort. And I am not selling the holy grail.
4. Every system can have winning and losing streaks.
5. Money management plays a large role in the results of your trading. For example: lot size, account size, broker leverage, and broker margin call rules all have an effect on results. Also, your Take Profit and Stop Loss settings for individual pair trades and for overall account equity have a major impact on results. If you are new to trading and do not understand these items, then I recommend you seek education materials to further your knowledge.
**YOU NEED TO FIND AND USE THE TRADING SYSTEM THAT WORKS BEST FOR YOU AND YOUR TRADING TOLERANCE.**
**I HAVE PROVIDED NOTHING MORE THAN A TOOL WITH OPTIONS FOR YOU TO TRADE WITH THIS PROGRAM ON TRADINGVIEW.**
## NOTE
I accept suggestions to improve the script.
If you encounter any problems I will be happy to share with me.
+ Authors: @exit490
+ Revision: v1.0.0
+ Date: 03-Aug-2019
+ Pinescript version: 4
## LICENSE
Copyright 2019 Mauricio Pimenta / exit490
Trailing Stop Loss script may be freely distributed under the MIT license .

Stochastic + ATRStochastic oscillator with dynamic buy/sell levels. Levels calculate with volatility/averag true range. No repaint

Stochastic + ATRIt is a stochastic with dynamic buy sell levels. Levels are calculate from volatility/average true range. No repaints

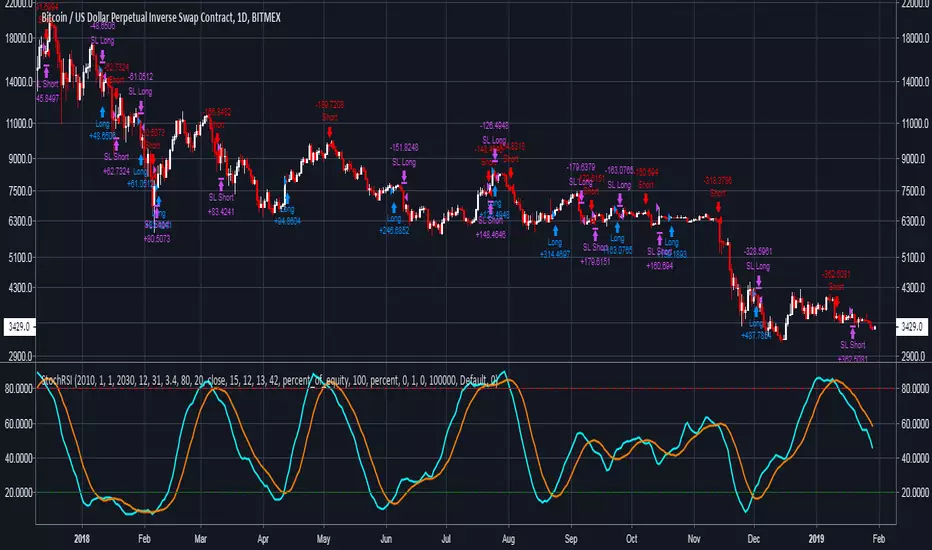
QuantNomad - Pivot Reversal Strategy - XBTUSD - 1hPivot reversal strategy almost always works pretty good for crypto.
Here is setup with 4 left, 4 right bars for pivot points for XBTUSD 1h chart.
It shows a pretty nice performance of 350% with only 10% dd, Sharpe is 1.16.
If you're interested in using this strategy in my scripts you can find alerts for it and a version with added backtesting range.
And remember:
Past performance does not guarantee future results.

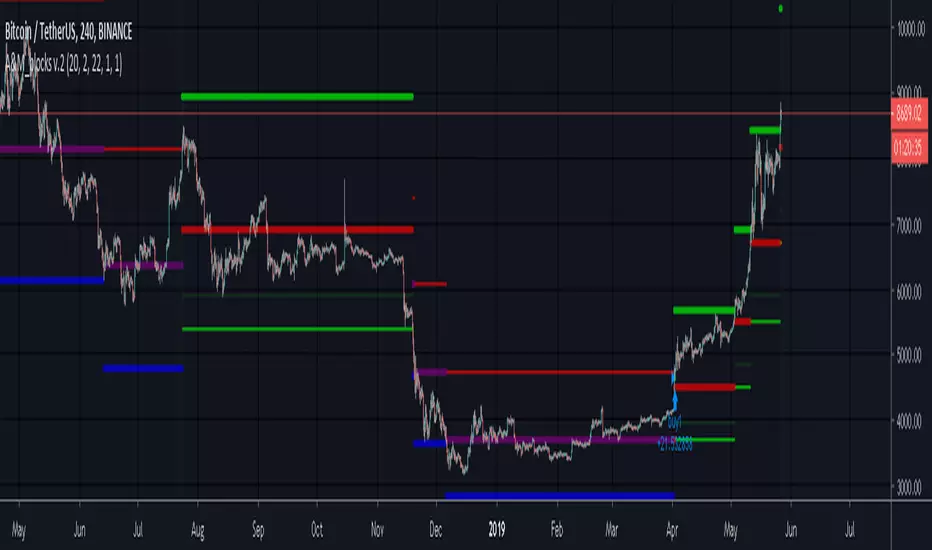
A&M_blocks v.2This is re production of Renko chart.
It draws lines that shows the location of the current box boundaries...using percentage instead of fixed box size or average true range.
Combo Strategies 123 Reversal and 3-Bar-Reversal-Pattern This is combo strategies for get
a cumulative signal. Result signal will return 1 if two strategies
is long, -1 if all strategies is short and 0 if signals of strategies is not equal.
First strategy
This System was created from the Book "How I Tripled My Money In The
Futures Market" by Ulf Jensen, Page 183. This is reverse type of strategies.
The strategy buys at market, if close price is higher than the previous close
during 2 days and the meaning of 9-days Stochastic Slow Oscillator is lower than 50.
The strategy sells at market, if close price is lower than the previous close price
during 2 days and the meaning of 9-days Stochastic Fast Oscillator is higher than 50.
Secon strategy
This startegy based on 3-day pattern reversal described in "Are Three-Bar
Patterns Reliable For Stocks" article by Thomas Bulkowski, presented in
January,2000 issue of Stocks&Commodities magazine.
That pattern conforms to the following rules:
- It uses daily prices, not intraday or weekly prices;
- The middle day of the three-day pattern has the lowest low of the three days, with no ties allowed;
- The last day must have a close above the prior day's high, with no ties allowed;
- Each day must have a nonzero trading range.
WARNING:
- For purpose educate only
- This script to change bars colors.

SHEAVY S StrategyThe new version is completely revamped where you no longer need to follow a said system the system is now scripted into SHEAVY XV
the strategy using all the previous variables in order to go long or short .
i removed the RSI Candles as well as a few other things to clear up the screen and settings section so its not overwhelming
Make sure you adjust your trailing stop accordingly using my Hidden ATR script i will have open access too, just follow the math displayed in the left hand corner to get appropriate stop placement
If you cannot link your broker then this is how you will use SHEAVY XV
after you get a BEAR TREND or BULL TREND signal you only want to SHORT or LONG
the signals are displayed at the top for your entries going SHORT and LONG
and the conditional closes will be displayed at the bottom in the respected colors
alerts are set so you are able to appropriate send to your mobile device or email
to find out how to attain access to this script please visit the website below
www.cryptocurrentlyvip.com
MAKE SURE TO PRACTICE APPROPRIATE RISK AND MONEY MANAGEMENT
DISCLAIMER
***THIS SCRIPT WAS INTENDED FOR EXPERIMENTAL PURPOSES ONLY***
AND THE CREATOR OF THIS STRATEGY HELD WITHIN THE SCRIPT WILL NOT BE RESPONSIBLE FOR ANY LOSSES OR WINS ACCRUED.

Cryptocurrency trend following EMA Ribbon LONG only strategyThis strategy is based on EMA Ribbon and uses multiple indicators to find optimal time to enter/exit the trade and filter out false signals. The script with default setting is developed mainly for trading altcoins/stable coin pair such as ADA/USDT etc on 4h timeframe but it can be applied to any pair/any timeframe with some settings adjustments.
For plot on chart features make sure that you have both study and strategy scripts on chart with same settings.
Strategy settings description:
1. Signal EMA Length - Value for exponencial moving average (slowest from EMA Ribbon)
1a. Buy price toleration (%) - Price deviation for filtering bounces of EMA - price must close defined percents above EMA to open long trade
1b. Sell price toleration (%) - Price deviation for filtering bounces of EMA - price must close defined percents bellow EMA to close long trade
1c. EMA deelay - EMA id delayed by defined bars for smoothening
2. Filter by Fast EMA - Strategy filters signals to prevent buy while coin is dropping
2a. Fast EMA Length - Value for fast exponencial moving average
3. Filter by SMA - Strategy filters signals to confirm trend change
3a. SMA Length - Value for simple moving average
4. Filter by RSI - Strategy filters signals to prevent buing/selling overbought/oversold coins
4a. RSI Length - Length of RSI identificator
4b. RSI Source candle - What price of candle is used for RSI calculation (open, close, high, low)
4c. RSI Long condition - When buy, RSI indicator must be below this value to prevent of buying already overbought coin
4d. RSI Short condition - When sell, RSI indicator must be above this value to prevent of selling already oversold coin
5. RSI Close Trade Condition - Strategy sell coin once RSI reach defined value
5a. RSI close trade condition - Sell once RSI indicator acquires defined value
6. Close trade by Take Profit or Stop Loss Condition (STRATEGY ONLY) - Strategy sell coin once defined take profit / stoploss level is reached
6a. Take Profit (%) - Take profit value in percent
6b. Stop Loss (%) - Stop loss value in percent
6c. Plot targets on chart - defined targets will be plotted as lines on chart
7. Date range from
7a From Year - To run strategy in interval
7b From Month - To run strategy in interval
7c From Day - To run strategy in interval
8. Date range to
8a To Year - To run strategy in interval
8b To Month - To run strategy in interval
8c To Day - To run strategy in interval
9. Wait to confirm the signal
9a Wait candless to buy - strategy will wait defined candless to confirm the signal before buy
9b Wait candless to sell - strategy will wait defined candless to confirm the signal before sell
10. Plotting on chart (STUDY ONLY)
10a Plot signal line channel with bows on chart
10b Plot simple moving average on chart
10c Plot EMA Ribbon on chart
10d Plot recent support and resistance levels on chart
11. Show Every signal (STUDY ONLY) - Unchecked shows only first signal based on strategy. But if you use take profit/stoploss settings within your bot, you might want to rebuy on next signal. Checked shows signal on each candle.
Throw on chart also buld-in RSI indicator and set the same as strategy
Notice that there might be false signals, especially when the coin is not trending or is strongly manipulated. Overall strategy is profitable though. You just take some minor loses and wont miss the big move.
You may also consider to compare buy&hold return vs profit from trading this strategy. In downtrend as we have seen recently, profit may not be as high as you expect but it is still much better than just hold and hope.
You can use the strategy script for fine tunning settings and find best settings for yourself.
Study script helps you to automate trading with use of alerts perharps with 3commas bot or even trade manually based on email/sms notification setted by tradingview
Notice that study script does not handle takeprofit/stoploss order. That is why sell arrows could be plotted by study script later than strategy script. To rebuy after takeprofit/stop-loss use "11. Show Every signal (STUDY ONLY)" setting
Make sure that you keep same settings for strategy and study scripts.
If you need any help with settings do not hesitate to ask. I would also appriciate any feedback and ideas how to improve this script.
Here is backtest result from 1. Nov 2018 using constant 100USD Buy ammount:

SSR Srategy V2SSR strategy is a strategy evolved from Stochastic RSI fast and slow line crossing strategy and has the advantage of being adjustable with high degree of freedom. The full name of SSR is Smooth Stochastic RSI .
This indicator provides the following three trading mechanisms:
1. Enter each time the D and smooth D lines cross
2. Only enter when the D line and the smooth D line cross outside the threshold, and reverse trade when the next time cross outside the threshold.
3. Only enter when the D line and the smooth D line cross outside the threshold, and close the position at the next cross.
It also provides the following two functions to help u evaluate trading profit:
1. Select specific time test.
2. Stop loss setting.
P.S. If the 'Order’s limit was reached’ message appears, you can use the specific time test function to narrow the test range.

Stochastic RSI SrategyThis strategy is based on Stochastic RSI fast and slow line crossing and has the advantage of being adjustable with high degree of freedom.
This indicator provides the following three trading mechanisms:
1. Enter each time the K and D lines cross
2. Only enter when the K line and the D line cross outside the threshold, and reverse trade when the next time cross outside the threshold.
3. Only enter when the K line and the D line cross outside the threshold, and close the position at the next cross.
It also provides the following two functions to help u evaluate trading profit:
1. Select specific time test.
2. Stop loss setting.
P.S. If the 'Order’s limit was reached’ message appears, you can use the specific time test function to narrow the test range.
CS Basic Script: Customizable Volume Based Trading (Strategy)Customizable Volume Based Strategy Script that includes the Following Inputs:
- Custom Backtesting Date Range
- Optional Trailing Stop Loss
- Select the Volume Strategy Types (Crossing EMA, SMA, WMA, & Lookback)
- Adjust the MA Volume Range
- Automate with the Autoview Trading Bot
Strategy script may be tested by favoriting and adding to any chart.
Study script is available for automated trading at www.cryptoscores.org

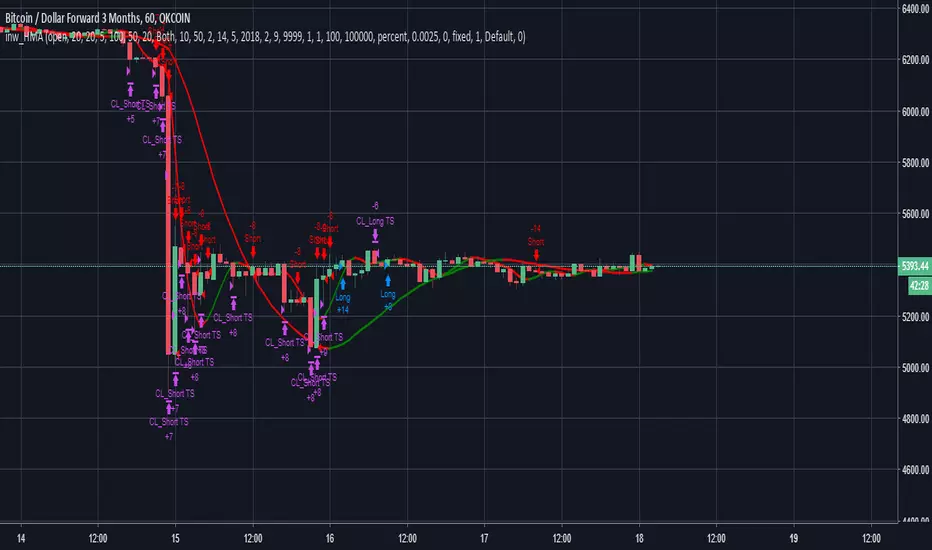
inwCoin HMA StrategySuper duper strategy using HMA ( Hull Moving Average ) 10 and 50 for decided entry ( short / long )
There are 2 type of strategies, you can choose with checkbox.
(1) Aggressive Strategy Ticked
* If ticked, strategy will enter position again if the condition met. ( both line red ) after Taking Profit ( or Stop Loss )
* It will use trailing start/stop so the profit is kinda crazy ( and yes, impossible in real world lol )
* The problem is, it will enter position like crazy and you might get a lot of loss from fee
(2) Aggressive Strategy not Ticked
* It will enter once only ( HMA10 just changed color to the same as HMA50 )
* If TP or SL already, it will wait for next signal
* Less trade, less profit, but safer. ( wait for right signal )
** For Aggressive Strategy, you can't select the date from 1/1/2018 because the trade record is way too much .... lol
** You can experiment yourself with other exchange/coin as your like.
=============================================
Test Data Detail
=============================================
Exchange : OKEX
Coin : BTCUSD3M
Timeframe : 1H
Date range : 2018/2/9 - 2019/1
For : Trailing with bot ( If you have one :P )
Config
Trade % = 20 ( You can increase trade size of your total port but it will get you into more risky trade. ( but yes, more profit ) ... u can increase trade size if you have enough profit
Trailing Start = 20 ( If you can write bot, it will start trailing when the profit % reach this value )
Trailing Stop = 5 (If you can write bot, it will take profit if the profit drop below this value from trailing start.)
Take Profit = It will set fixed TP for whipsaw case ( rarely reach this target )
Stop % = 50 ( so this trade is RR = 2 nice! )
Leverage = 20 ( so we can withstand the price fluctuation and not get liquidated, if you trade spot, please choose 1 also, please adjust TP and stop accordingly eg. leverage 1 / TP = 20 / SL = 10 )
Trade Direction = Both ( for margin market, if you want to trade spot like Binance you can choose long only )
Hull 1 Length = 10 ( Fast HMA length)
Hull 2 Length = 50 ( Slow HMA length)
Hull trend test length = 2 ( hull test range for rising or down trend )
Aggressive Strategy = YES ( enter next position if condition met immediately )
Keep It Simple, Stupid!This is a strategy that utilizes crossovers as entries and exits. You have quite a bit of freedom to choose the type of MA used, along with the source and length. You are also able adjust the backtest range. I will update with changes if any are needed, as well as a description of the update.

Lyiness-Sniper_Range_StrategyNotice the trend and the breakout!
Wait for an outbreak after the signal in the range.
Try linking it to your setup for a good result.
In the settings, you can change the colors of both the time period to make it profitable in others.
Default is set for 1 hour chart
Have fun.

multi Stochastic strategy (J)www.tradingview.com(STOCH)
The Stochastic Oscillator ( STOCH ) is a range bound momentum oscillator. The Stochastic indicator is designed to display the location of the close compared to the high/low range over a user defined number of periods. Typically, the Stochastic Oscillator is used for three things; Identifying overbought and oversold levels, spotting divergences and also identifying bull and bear set ups or signals.

Strategy - Bobo's Pivot ATR SwingHi there, welcome to my pivot ATR swing bot. I put this out there with source code hidden to see what ideas others have to use it. Also if there are any coders of trading systems out there who wanted to work with me to put this into a form that could trade automatically we could both use... I'd welcome that kind of collaboration and will happily share the underlying rules of this and the more highly developed version that isn't public.
But as it is, the signals are free for all, use them as you wish and at your own risk. If you want to discuss the code, strategy or ideas, I'm around fairly regularly just message.
The bot is fairly simple design that will give you signals for long and short intraday/week on equity futures / CFDs / ETFs. You'll see it backtests fairly well on an hourly SPX500 chart as configured. You will need to set up certain parameters to account for any different timeframes and markets you wish to trade. For me it's most effective pick out a few good swing trades per week in equity futures. However part of the idea of putting this in the public domain is to see if other people will have good but different ideas how to use it. Please share with me if so :).
The basic concept is a series of 3 lines that define the area and movement we wish to trade. The daily pivot is the central line (blue). We are looking to capture reversions to this middle line from extremes (red and green). Therefore the bot will signal exit at the close of every candle that has passed through the pivot.
Entry is decided by the outer bands around the blue line. Red is the top band, green the bottom. As configured, these are simply placed a daily ATR value apart, centred around the pivot. You can change this quite a lot though, so let's go through the settings:
Pivot Timeframe - simple, a daily pivot is calculated from the previous day's values (high + low + close)/3 . BUt the same calculation can be applied to any length candle, day, minute, month or whatever. This makes the middle target line more or less responsive to recent price action.
ATR Band Timeframe - When we calculate the average range, we need to know what candle length makes up our series. Daily candles is the default, but you can change that here.
ATR Lookback - When we calculate the average range, we need to know how many instances of the timeframe (day, minute, hour etc) we look back to create an average. The lower the lookback value, the more the width of the bands (the distance from pivot) will change quickly based on the volatility of previous candles. The higher the lookback value, the more stable the band width will be to recent volatility.
ATR divisor - The ATR value above is divided by this value, before being added or subtracted to the pivot to create the red and green lines. Default value is 2, and this means the distance from the red band to the green band will be equal to 1 ATR, as calculated according to the parameters above. Setting this to 1 would mean that each band is one ATR away from pivot (ie the bands got wider apart). Set this to 4, and it means that it is only 1/2 an ATR from green to red.
Take Profit / Stop Loss. - We know what a stop and profit target are, but worth nothing that a 0 value disables stop loss or profit targets. The bot will still close positions when crossing pivot.
Also, note the mintick value of the instrument you apply this to. For example for the CFD chart SPX500 the mintick value is 0.1. So a 100 value for stop loss = 10 points on SPX500. but if you were to trade the same thing basically, but the emini future ES, the mintick value is 0.25. So for a 10 point stop on the ES chart, you would need a value of 40 in this bot. US30 and YM have convenient mintick values of 1. Currencies can be a bit of a nightmare :).

Trailing Stops/Choose a Day of the WeekThis would be my second ever published strategy. It is almost the same as my first ever published script . I've been working primarily on UGAZ and DGAZ .
This is basically a statistical trade. It buys every morning near market open (or by choosing a "time constraint"), then immediately places a trailing stop at a specified amount in ticks (if used on UGAZ a tick = $0.01, if used on NG at tick = $0.001). I've found between 2% and 3% works well for the trailing stop (ie. if UGAZ = $75, a 3% trailing stop = $2.25)
-----What is different from my first strategy?------
You can test the trailing stop strategy one 1 day of the week. Days of the week are assigned numbers. Sunday=1, Monday=2, Tuesday=3 and so on. Just choose a number that correlates to the day of the week you want to test. The Trailing stop may go past that day, that's a good thing if it's making money.
-- Go long/Short is just that, it will buy shares/contracts or short them.
-- Trades per day. This may not be a good choice, when left on "2", it will trade once per day. If set above 2 and there is time left for another trade, an order will enter on the open of the next candle. I'm am still working on ideas for this.
-- Time constraints. When you select this check box, the strategy will limit an entry to the time specified below the "Use Time Constraints" check box. An Exit order will still continue past this window of time until it is stopped out.
---- very important ----
Due to decay, leveraged ETFs will give false results if the price gets far out of range. For example, your ETF is trading around $20 and you choose a 1 hour chart, it may back test back to a time before a reverse split. If the price gets to be too large, like $200, or $1200, the movement on the chart creates false indication of profit/loss.
--- Most important. ---
Do not trade off this strategy, you may lose lots of money. This is for educational use only.
Good luck

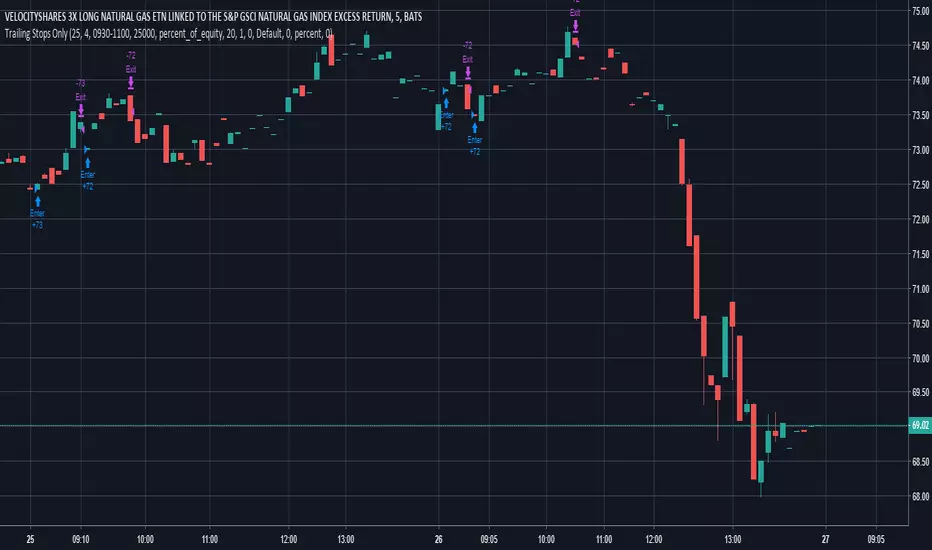
Trailing Stops Only - For Leveraged ETFs (UGAZ/DGAZ)Looking for Statistical trades that work. This one seems to work on some Leveraged ETFs with a lot of noise like UGAZ/DGAZ. It can also be used on Futures Contracts, but be sure to change up the type of investment from % of equity to contracts. Also one point I'm trying to make with this strategy is the trades are best made in the morning around market open. When used with Contracts, be sure to make use of the time settings. It will limit buying between the hours set. Selling will occur at any time the trailing stop is triggered.
This Strategy is best used on 5min or 15min charts.
!!!! very important !!!!
Due to decay, leveraged ETFs will give false results if the price gets far out of range. For example, your ETF is trading around $20 and you choose a 1 hour chart, it may back test back to a time before a reverse split. If the price gets to be too large, like $200, or $1200, the movement on the chart creates false indication of profit/loss.
Most important. Do not trade off this strategy, you may lose lots of money. This is for educational use only.
Market Facilitation Index (MFI) Backtest The Market Facilitation Index is an indicator that relates price range to
volume and measures the efficency of price movement. Use the indicator to
determine if the market is trending. If the Market Facilitation Index increased,
then the market is facilitating trade and is more efficient, implying that the
market is trending. If the Market Facilitation Index decreased, then the market
is becoming less efficient, which may indicate a trading range is developing that
may be a trend reversal.
You can change long to short in the Input Settings
WARNING:
- For purpose educate only
- This script to change bars colors.

Volatility Backtest The Volatility function measures the market volatility by plotting a
smoothed average of the True Range. It returns an average of the TrueRange
over a specific number of bars, giving higher weight to the TrueRange of
the most recent bar.
You can change long to short in the Input Settings
WARNING:
- For purpose educate only
- This script to change bars colors.
