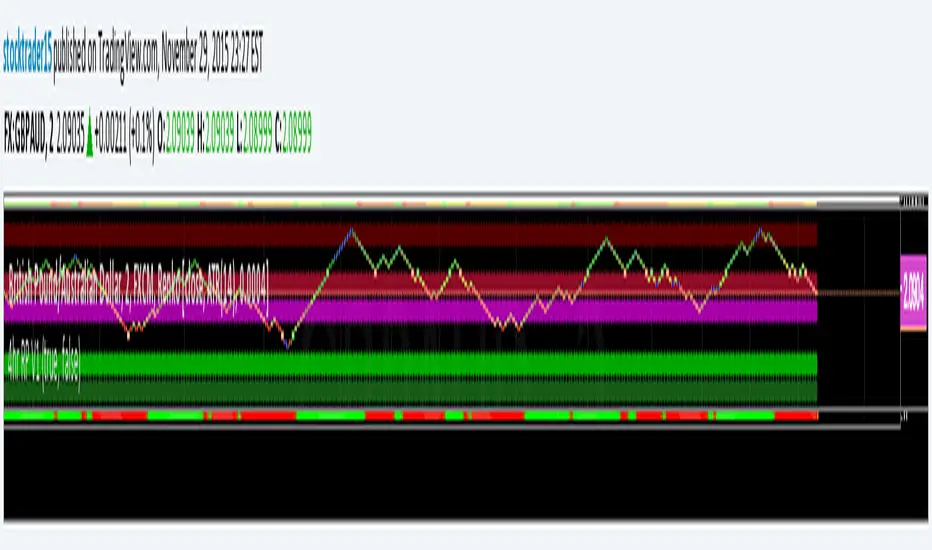
ST15 CM inspired 4hr renko Pivots
Standard pivot points do not work with ATR Renko charts, but I really enjoy using pivot points to find strong s/r, so I started to look at scripts that could provide the same results as floor trader pivots but on a renko chart. I found a script written by CM that I was able to tweak a little and I got it work with ATR renkos. The only issue now is he only wrote the script to look for 1hr pivot points so I am now in the process off writing versions that can do the 240 1d 1w and 1m pivot points as well. Here is the 4hr :) enjoy! Thank you CM :)
חפש סקריפטים עבור "renko"
Realtime RenkoI've been working on real-time renko for a while as a coding challenge. The interesting problem here is building renko bricks that form based on incoming tick data rather than waiting for bar closes. Every tick that comes through gets processed immediately, and when price moves enough to complete a brick, that brick closes and a new one opens right then. It's just neat because you can run it and it updates as you'd expect with renko, forming bricks based purely on price movement happening in real time rather than waiting for arbitrary time intervals to pass.
The three brick sizing methods give you flexibility in how you define "enough movement" to form a new brick. Traditional renko uses a fixed price range, so if you set it to 10 ticks, every brick represents exactly 10 ticks of movement. This works well for instruments with stable tick sizes and predictable volatility. ATR-based sizing calculates the average true range once at startup using a weighted average across all historical bars, then divides that by your brick value input. If you want bricks that are one full ATR in size, you'd use a brick value of 1. If you want half-ATR bricks, use 2. This inverted relationship exists because the calculation is ATR divided by your input, which lets you work with multiples and fractions intuitively. Percentage-based sizing makes each brick a fixed percentage move from the previous brick's close, which automatically scales with price level and works well for instruments that move proportionally rather than in absolute tick increments.
The best part about this implementation is how it uses varip for state management. When you first load the indicator, there's no history at all. Everything starts fresh from the moment you add it to your chart because varip variables only exist in real-time. This means you're watching actual renko bricks form from real tick data as it arrives. The indicator builds its own internal history as it runs, storing up to 250 completed bricks in memory, but that history only exists for the current session. Refresh the page or reload the indicator and it starts over from scratch.
The visual implementation uses boxes for brick bodies and lines for wicks, drawn at offset bar indices to create the appearance of a continuous renko chart in the indicator pane. Each brick occupies two bar index positions horizontally, which spaces them out and makes the chart readable. The current brick updates in real time as new ticks arrive, with its high, low, and close values adjusting continuously until it reaches the threshold to close and become finalized. Once a brick closes, it gets pushed into the history array and a new brick opens at the closing level of the previous one.
What makes this especially useful for debugging and analysis are the hover tooltips on each brick. Clicking on any brick brings up information showing when it opened with millisecond precision, how long it took to form from open to close, its internal bar index within the renko sequence, and the brick size being used. That time delta measurement is particularly valuable because it reveals the pace of price movement. A brick that forms in five seconds indicates very different market conditions than one that takes three minutes, even though both bricks represent the same amount of price movement. You can spot acceleration and deceleration in trend development by watching how quickly consecutive bricks form.
The pine logs that generate when bricks close serve as breadcrumbs back to the main chart. Every time a brick finalizes, the indicator writes a log entry with the same information shown in the tooltip. You can click that log entry and TradingView jumps your main chart to the exact timestamp when that brick closed. This lets you correlate renko brick formation with what was happening on the time-based chart, which is critical for understanding context. A brick that closed during a major news announcement or at a key support level tells a different story than one that closed during quiet drift, and the logs make it trivial to investigate those situations.
The internal bar indexing system maintains a separate count from the chart's bar_index, giving each renko brick its own sequential number starting from when the indicator begins running. This makes it easy to reference specific bricks in your analysis or when discussing patterns with others. The internal index increments only when a brick closes, so it's a pure measure of how many bricks have formed regardless of how much chart time has passed. You can match these indices between the visual bricks and the log entries, which helps when you're trying to track down the details of a specific brick that caught your attention.
Brick overshoot handling ensures that when price blows through the threshold level instead of just barely touching it, the brick closes at the threshold and the excess movement carries over to the next brick. This prevents gaps in the renko sequence and maintains the integrity of the brick sizing. If price shoots up through your bullish threshold and keeps going, the current brick closes at exactly the threshold level and the new brick opens there with the overshoot already baked into its initial high. Without this logic, you'd get renko bricks with irregular sizes whenever price moved aggressively, which would undermine the whole point of using fixed-range bricks.
The timezone setting lets you adjust timestamps to your local time or whatever reference you prefer, which matters when you're analyzing logs or comparing brick formation times across different sessions. The time delta formatter converts raw milliseconds into human-readable strings showing days, hours, minutes, and seconds with fractional precision. This makes it immediately clear whether a brick took 12.3 seconds or 2 minutes and 15 seconds to form, without having to parse millisecond values mentally.
This is the script version that will eventually be integrated into my real-time candles library. The library version had an issue with tooltips not displaying correctly, which this implementation fixes by using a different approach to label creation and positioning. Running it as a standalone indicator also gives you more control over the visual settings and makes it easier to experiment with different brick sizing methods without affecting other tools that might be using the library version.
What this really demonstrates is that real-time indicators in Pine Script require thinking about state management and tick processing differently than historical indicators. Most indicator code assumes bars are immutable once closed, so you can reference `close ` and know that value will never change. Real-time renko throws that assumption out because the current brick is constantly mutating with every tick until it closes. Using varip for state variables and carefully tracking what belongs to finalized bricks versus the developing brick makes it possible to maintain consistency while still updating smoothly in real-time. The fact that there's no historical reconstruction and everything starts fresh when you load it is actually a feature, not a limitation, because you're seeing genuine real-time brick formation rather than some approximation of what might have happened in the past.

MestreDoFOMO MACD VisualMasterDoFOMO MACD Visual
Description
MasterDoFOMO MACD Visual is a custom indicator that combines a unique approach to MACD with stochastic logic and simulated Renko-based direction signals. It is designed to help traders identify entry and exit opportunities based on market momentum and trend changes, with a clear and intuitive visualization.
How It Works
Stylized MACD with Stochastic: The indicator calculates the MACD using EMAs (exponential moving averages) normalized by stochastic logic. This is done by subtracting the lowest price (lowest low) from a defined period and dividing by the range between the highest and lowest price (highest high - lowest low). The result is a MACD that is more sensitive to market conditions, magnified by a factor of 10 for better visualization.
Signal Line: An EMA of the MACD is plotted as a signal line, allowing you to identify crossovers that indicate potential trend reversals or continuations.
Histogram: The difference between the MACD and the signal line is displayed as a histogram, with distinct colors (fuchsia for positive, purple for negative) to make momentum easier to read.
Simulated Renko Direction: Uses ATR (Average True Range) to calculate the size of Renko "bricks", generating signals of change in direction (bullish or bearish). These signals are displayed as arrows on the chart, helping to identify trend reversals.
Purpose
The indicator combines the sensitivity of the Stochastic MACD with the robustness of Renko signals to provide a versatile tool. It is ideal for traders looking to capture momentum-based market movements (using the MACD and histogram) while confirming trend changes with Renko signals. This combination reduces false signals and improves accuracy in volatile markets.
Settings
Stochastic Period (45): Sets the period for calculating the Stochastic range (highest high - lowest low).
Fast EMA Period (12): Period of the fast EMA used in the MACD.
Slow EMA Period (26): Period of the slow EMA used in the MACD.
Signal Line Period (9): Period of the EMA of the signal line.
Overbought/Oversold Levels (1.0/-1.0): Thresholds for identifying extreme conditions in the MACD.
ATR Period (14): Period for calculating the Renko brick size.
ATR Multiplier (1.0): Adjusts the Renko brick size.
Show Histogram: Enables/disables the histogram.
Show Renko Markers: Enables/disables the Renko direction arrows.
How to Use
MACD Crossovers: A MACD crossover above the signal line indicates potential bullishness, while below suggests bearishness.
Histogram: Fuchsia bars indicate bullish momentum; purple bars indicate bearish momentum.
Renko Arrows: Green arrows (upward triangle) signal a change to an uptrend; red arrows (downward triangle) signal a downtrend.
Overbought/Oversold Levels: Use the levels to identify potential reversals when the MACD reaches extreme values.
Notes
The chart should be set up with this indicator in isolation for better clarity.
Adjust the periods and ATR multiplier according to the asset and timeframe used.
Use the built-in alerts ("Renko Up Signal" and "Renko Down Signal") to set up notifications of direction changes.
This indicator is ideal for day traders and swing traders who want a visually clear and functional tool for trading based on momentum and trends.

[Autoview][BackTest]Dual MA Ribbons R0.12 by JustUncleLThis is an implementation of a strategy based on two MA Ribbons, a Fast Ribbon and a Slow Ribbon. This strategy can be used on Normal candlestick charts or Renko charts (if you are familiar with them).
The strategy revolves around a pair of scripts: One to generate alerts signals for Autoview and one for Backtesting, to tune your settings.
The risk management options are performed within the script to set SL(StopLoss), TP(TargetProfit), TSL(Trailing Stop Loss) and TTP (Trailing Target Profit). The only requirement for Autoview is to Buy and Sell as directed by this script, no complicated syntax is required.
The Dual Ribbons are designed to capture the inferred behavior of traders and investors by using two groups of averages:
> Traders MA Ribbon: Lower MA and Upper MA (Aqua=Uptrend, Blue=downtrend, Gray=Neutral), with center line Avg MA (Orange dotted line).
> Investors MAs Ribbon: Lower MA and Upper MA (Green=Uptrend, Red=downtrend, Gray=Neutral), with center line Avg MA (Fuchsia dotted line).
> Anchor time frame (0=current). This is the time frame that the MAs are calculated for. This way 60m MA Ribbons can be viewed on a 15 min chart to establish tighter Stop Loss conditions.
Trade Management options:
Option to specify Backtest start and end time.
Trailing Stop, with Activate Level (as % of price) and Trailing Stop (as % of price)
Target Profit Level, (as % of price)
Stop Loss Level, (as % of price)
BUY green triangles and SELL dark red triangles
Trade Order closed colour coded Label:
>> Dark Red = Stop Loss Hit
>> Green = Target Profit Hit
>> Purple = Trailing Stop Hit
>> Orange = Opposite (Sell) Order Close
Trade Management Indication:
Trailing Stop Activate Price = Blue dotted line
Trailing Stop Price = Fuschia solid stepping line
Target Profit Price = Lime '+' line
Stop Loss Price = Red '+' line
Dealing With Renko Charts:
If you choose to use Renko charts, make sure you have enabled the "IS This a RENKO Chart" option, (I have not so far found a way to Detect the type of chart that is running).
If you want non-repainting Renko charts you MUST use TRADITIONAL Renko Bricks. This type of brick is fixed and will not change size.
Also use Renko bricks with WICKS DISABLED. Wicks are not part of Renko, the whole idea of using Renko bricks is not to see the wick noise.
Set you chart Time Frame to the lowest possible one that will build enough bricks to give a reasonable history, start at 1min TimeFrame. Renko bricks are not dependent on time, they represent a movement in price. But the chart candlestick data is used to create the bricks, so lower TF gives more accurate Brick creation.
You want to size your bricks to 2/1000 of the pair price, so for ETHBTC the price is say 0.0805 then your Renko Brick size should be about 2*0.0805/1000 = 0.0002 (round up).
You may find there is some slippage in value, but this can be accounted for in the Backtest by setting your commission a bit higher, for Binance for example I use 0.2%
Special thanks goes to @CryptoRox for providing the initial Risk management Framework in his "How to automate this strategy for free using a chrome extension" example.

Fibonacci Renko Trend - AynetThe "Fibonacci Renko Trend - Aynet" Pine Script combines the Renko charting technique with Fibonacci retracement levels to create a highly customizable and adaptive trend-following tool. Below is a detailed explanation of the script and its components:
Scientific and Trading Applications
Noise Reduction:
By using Renko charts, the script filters out time-based noise and focuses solely on price movement, making it ideal for trend-following strategies.
Adaptability:
The ATR-based box size ensures that the Renko blocks automatically adjust to market volatility, making the tool versatile for different market conditions and asset classes.
Fibonacci-Based Decision Making:
The integration of Fibonacci retracement levels provides a structured framework for identifying key support and resistance levels. Traders can use these levels to anticipate price reversals or continuations.
Visualization:
The color-coded Renko blocks allow traders to quickly identify trends and potential reversals without additional indicators, improving decision-making efficiency.
Possible Improvements
Signal Generation:
Add entry and exit signals when price crosses significant Fibonacci levels or when a trend reversal is detected.
Multi-Timeframe Support:
Extend the script to compute Renko levels and Fibonacci ratios for multiple timeframes simultaneously.
Alerts:
Implement alert notifications for key events, such as trend changes or Fibonacci level breaches.
This script is a robust tool for traders looking to combine the simplicity of Renko charts with the analytical power of Fibonacci retracement levels. It offers a clear visualization of price trends and potential reversal points, making it suitable for both novice and experienced traders.

Custom Renko Chart by Mustafa KapuzThis Pine Script, developed by Mustafa Kapuz, offers a unique approach to visualize price movements through a custom Renko chart directly on your TradingView overlay. Unlike traditional Renko charts that are detached from time series, this script allows traders to overlay Renko-style price movements over standard charts, providing a hybrid view that combines the clarity of Renko with the context of time-based charting.
Key Features:
Adaptive Brick Size: At the heart of this script is the Brick Size input, allowing users to define the size of each Renko brick. This flexibility is crucial for tailoring the chart to various commodities or assets, as volatility and price scales differ widely across markets.
Dynamic Price Adjustment: The script dynamically adjusts to price movements, creating new bricks whenever the price moves by the predefined Brick Size from the last brick value. This adjustment is made regardless of the time elapsed, focusing solely on price action, thereby filtering out minor fluctuations and highlighting significant trends.
Visual Clarity: Rendered as a step line, the resulting Renko chart provides a clear visual representation of price trends. Each step signifies a new brick, painted in blue for easy visibility. This method simplifies the analysis of directional movements, making it easier to identify potential entry and exit points.
Usage Tips:
To optimize the chart for different markets, experiment with the Brick Size parameter. Adjusting this value allows the chart to better reflect the unique characteristics of each commodity or asset, ranging from highly volatile cryptocurrencies to more stable fiat currencies or stocks.
This custom Renko chart can be a powerful addition to your trading toolkit, especially when used in conjunction with other indicators and analysis techniques. It's designed to offer a new perspective on price movements, filtering out the 'noise' and focusing on substantial trends.
By customizing the Brick Size, traders can tailor the chart to various commodities, achieving a versatile analysis tool that adapts to different market conditions. Whether you're a seasoned trader or new to the markets, this script provides a fresh lens through which to view and interpret price action, enhancing your trading strategy with the timeless principles of Renko charting, now integrated into your TradingView experience.
[SMT] Buy & Sell Renko Based - AlertsThis is a custom indicator that implements a trading strategy based on Renko charts, but they can be used on regular candlestick charts and on any time frame. Renko charts are known for filtering market noise and displaying price movements in a clearer way. However, it is important to note that this indicator is provided for educational and informational purposes only and is not a guarantee of profitable returns.
Features:
- The indicator uses Renko charts to generate buy and sell signals.
- Renko bricks are built based on a predefined price variation, rather than time.
- The length of the Average True Range (ATR) used to calculate Renko bricks can be customized.
- Buy signals are generated when the price crosses below the current Renko brick.
- Sell signals are generated when the price crosses above the current Renko brick.
- Entry points are marked with "Buy" and "Sell" arrows on the chart.
It is essential to emphasize that no indicator or trading strategy guarantees profitable results. The financial market is complex and subject to unpredictable changes. It is recommended to perform additional tests and analysis before using this indicator on a real trading account.
Always remember to manage your risks properly and consider other factors such as fundamental analysis and market conditions when making trading decisions. The use of this indicator is entirely the user's responsibility.
DISCLAIMER: This indicator is not financial advice and should not be interpreted as such. Always consult with a qualified financial professional before making any investment decisions.

[SMT] Buy & Sell Renko Based - StrategyThis is a custom indicator that implements a trading strategy based on Renko charts, but they can be used on regular candlestick charts and on any time frame. Renko charts are known for filtering market noise and displaying price movements in a clearer way. However, it is important to note that this indicator is provided for educational and informational purposes only and is not a guarantee of profitable returns.
Features:
- The indicator uses Renko charts to generate buy and sell signals.
- Renko bricks are built based on a predefined price variation, rather than time.
- The length of the Average True Range (ATR) used to calculate Renko bricks can be customized.
- Buy signals are generated when the price crosses below the current Renko brick.
- Sell signals are generated when the price crosses above the current Renko brick.
- Entry points are marked with "Buy" and "Sell" arrows on the chart.
It is essential to emphasize that no indicator or trading strategy guarantees profitable results. The financial market is complex and subject to unpredictable changes. It is recommended to perform additional tests and analysis before using this indicator on a real trading account.
Always remember to manage your risks properly and consider other factors such as fundamental analysis and market conditions when making trading decisions. The use of this indicator is entirely the user's responsibility.
DISCLAIMER: This indicator is not financial advice and should not be interpreted as such. Always consult with a qualified financial professional before making any investment decisions.

TUE Renko Box/Time TesterThe TUE Renko Box/Time Tester is a technical indicator designed to quantify the frequency of consecutive duplicate timestamps within Renko charts on the TradingView platform. It serves the critical purpose of assessing the prevalence of identical timestamps, a crucial factor for the accurate automation of trading strategies.
The presence of duplicate timestamps can impede the reliability of automated trading systems. This indicator systematically examines Renko bars and identifies instances where successive bars share the same timestamp. The quantified data aids traders and developers in evaluating the quality and suitability of their Renko chart data for algorithmic trading purposes.
To ensure proper speed and precision in automation, traders are advised to run Renko charts on either 1-second or 5-second timeframes. Adjusting the box sizes of Renko charts based on these timeframes is essential.
The objective is to maintain the incidence of duplicate timestamps at levels below 20%, ensuring the robustness and consistency of automated trading strategies. By providing a quantitative analysis of timestamp duplication, this indicator supports traders in optimizing their trading systems for enhanced accuracy and efficiency.
The script will automatically collate only the last two days' worth of data, in order to maintain timestamp integrity. You should be able to view individual seconds on your timestamps, and if they're all reading :00 at the end, then you have ran out of seconds-level data. This is only done with a Premium or higher subscription.

Backtesting on Non-Standard Charts: Caution! - PineCoders FAQMuch confusion exists in the TradingView community about backtesting on non-standard charts. This script tries to shed some light on the subject in the hope that traders make better use of those chart types.
Non-standard charts are:
Heikin Ashi (HA)
Renko
Kagi
Point & Figure
Range
These chart types are called non-standard because they all transform market prices into synthetic views of price action. Some focus on price movement and disregard time. Others like HA use the same division of bars into fixed time intervals but calculate artificial open, high, low and close (OHLC) values.
Non-standard chart types can provide traders with alternative ways of interpreting price action, but they are not designed to test strategies or run automated traded systems where results depend on the ability to enter and exit trades at precise price levels at specific times, whether orders are issued manually or algorithmically. Ironically, the same characteristics that make non-standard chart types interesting from an analytical point of view also make them ill-suited to trade execution. Why? Because of the dislocation that a synthetic view of price action creates between its non-standard chart prices and real market prices at any given point in time. Switching from a non-standard chart price point into the market always entails a translation of time/price dimensions that results in uncertainty—and uncertainty concerning the level or the time at which orders are executed is detrimental to all strategies.
The delta between the chart’s price when an order is issued (which is assumed to be the expected price) and the price at which that order is filled is called slippage . When working from normal chart types, slippage can be caused by one or more of the following conditions:
• Time delay between order submission and execution. During this delay the market may move normally or be subject to large orders from other traders that will cause large moves of the bid/ask levels.
• Lack of bids for a market sell or lack of asks for a market buy at the current price level.
• Spread taken by middlemen in the order execution process.
• Any other event that changes the expected fill price.
When a market order is submitted, matching engines attempt to fill at the best possible price at the exchange. TradingView strategies usually fill market orders at the opening price of the next candle. A non-standard chart type can produce misleading results because the open of the next candle may or may not correspond to the real market price at that time. This creates artificial and often beneficial slippage that would not exist on standard charts.
Consider an HA chart. The open for each candle is the average of the previous HA bar’s open and close prices. The open of the HA candle is a synthetic value, but the real market open at the time the new HA candle begins on the chart is the unrelated, regular open at the chart interval. The HA open will often be lower on long entries and higher on short entries, resulting in unrealistically advantageous fills.
Another example is a Renko chart. A Renko chart is a type of chart that only measures price movement. The purpose of a Renko chart is to cluster price action into regular intervals, which consequently removes the time element. Because Trading View does not provide tick data as a price source, it relies on chart interval close values to construct Renko bricks. As a consequence, a new brick is constructed only when the interval close penetrates one or more brick thresholds. When a new brick starts on the chart, it is because the previous interval’s close was above or below the next brick threshold. The open price of the next brick will likely not represent the current price at the time this new brick begins, so correctly simulating an order is impossible.
Some traders have argued with us that backtesting and trading off HA charts and other non-standard charts is useful, and so we have written this script to show traders what happens when order fills from backtesting on non-standard charts are compared to real-world fills at market prices.
Let’s review how TV backtesting works. TV backtesting uses a broker emulator to execute orders. When an order is executed by the broker emulator on historical bars, the price used for the fill is either the close of the order’s submission bar or, more often, the open of the next. The broker emulator only has access to the chart’s prices, and so it uses those prices to fill orders. When backtesting is run on a non-standard chart type, orders are filled at non-standard prices, and so backtesting results are non-standard—i.e., as unrealistic as the prices appearing on non-standard charts. This is not a bug; where else is the broker emulator going to fetch prices than from the chart?
This script is a strategy that you can run on either standard or non-standard chart types. It is meant to help traders understand the differences between backtests run on both types of charts. For every backtest, a label at the end of the chart shows two global net profit results for the strategy:
• The net profits (in currency) calculated by TV backtesting with orders filled at the chart’s prices.
• The net profits (in currency) calculated from the same orders, but filled at market prices (fetched through security() calls from the underlying real market prices) instead of the chart’s prices.
If you run the script on a non-standard chart, the top result in the label will be the result you would normally get from the TV backtesting results window. The bottom result will show you a more realistic result because it is calculated from real market fills.
If you run the script on a normal chart type (bars, candles, hollow candles, line, area or baseline) you will see the same result for both net profit numbers since both are run on the same real market prices. You will sometimes see slight discrepancies due to occasional differences between chart prices and the corresponding information fetched through security() calls.
Features
• Results shown in the Data Window (third icon from the top right of your chart) are:
— Cumulative results
— For each order execution bar on the chart, the chart and market previous and current fills, and the trade results calculated from both chart and market fills.
• You can choose between 2 different strategies, both elementary.
• You can use HA prices for the calculations determining entry/exit conditions. You can use this to see how a strategy calculated from HA values can run on a normal chart. You will notice that such strategies will not produce the same results as the real market results generated from HA charts. This is due to the different environment backtesting is running on where for example, position sizes for entries on the same bar will be calculated differently because HA and standard chart close prices differ.
• You can choose repainting/non-repainting signals.
• You can show MAs, entry/exit markers and market fill levels.
• You can show candles built from the underlying market prices.
• You can color the background for occurrences where an order is filled at a different real market price than the chart’s price.
Notes
• On some non-standard chart types you will not obtain any results. This is sometimes due to how certain types of non-standard types work, and sometimes because the script will not emit orders if no underlying market information is detected.
• The script illustrates how those who want to use HA values to calculate conditions can do so from a standard chart. They will then be getting orders emitted on HA conditions but filled at more realistic prices because their strategy can run on a standard chart.
• On some non-standard chart types you will see market results surpass chart results. While this may seem interesting, our way of looking at it is that it points to how unreliable non-standard chart backtesting is, and why it should be avoided.
• In order not to extend an already long description, we do not discuss the particulars of executing orders on the realtime bar when using non-standard charts. Unless you understand the minute details of what’s going on in the realtime bar on a particular non-standard chart type, we recommend staying away from this.
• Some traders ask us: Why does TradingView allow backtesting on non-standard chart types if it produces unrealistic results? That’s somewhat like asking a hammer manufacturer why it makes hammers if hammers can hurt you. We believe it’s a trader’s responsibility to understand the tools he is using.
Takeaways
• Non-standard charts are not bad per se, but they can be badly used.
• TV backtesting on non-standard charts is not broken and doesn’t require fixing. Traders asking for a fix are in dire need of learning more about trading. We recommend they stop trading until they understand why.
• Stay away from—even better, report—any vendor presenting you with strategies running on non-standard charts and implying they are showing reliable results.
• If you don’t understand everything we discussed, don’t use non-standard charts at all.
• Study carefully how non-standard charts are built and the inevitable compromises used in calculating them so you can understand their limitations.
Thanks to @allanster and @mortdiggiddy for their help in editing this description.
Look first. Then leap.

Customizable Moving Average RibbonThis indicator is a highly customizable moving average ribbon with some unique features.
This script can utilize multiple unique sources, including a non-repainting renko closing price. Renko charts focus solely on price movement and minimize the impacts of time and the extra noise time creates. Employing the renko close helps smooth out the MA ribbon. Insignificant price movements will not cause a change in the plotted lines of the indicator unless a new threshold is breached or a "brick" is created. This is highly useful for quickly identifying consolidation areas or overall flat price movement.
There are two methods for selecting the box size when utilizing the renko source. Box size is critical for the overall function and efficacy of the plots you will visually see with this indicator. Box size is set automatically using the Average True Range "ATR" or manually using the "Traditional" setting. The simplest way to determine a manual box size is to take the ATR of the given instrument and round it to the nearest decimal place. As an example, if the ATR for the asset is 0.18, you would round that number to 0.2 and utilize this as your traditional box size.
The MA ribbon contains eleven adjustable moving average lines. Users can choose to turn off as many as they would like. Users can also adjust the length of the individual moving averages and the source for all moving averages. There are nine types of moving averages to choose from for the ribbon. The MA options are:
Exponential Moving Average = 'EMA'
Double Exponential Moving Average= 'DEMA'
Triple Exponential Moving Average = 'TEMA'
Simple Moving Average = 'SMA'
Relative Moving Average = 'RMA'
Volume Weighted Moving Average = 'VWMA'
Weighted Moving Average = 'WMA'
Smoothed Simple Moving Average = 'SSMA'
Hull Moving Average = 'HULL'
We believe that the ribbons features, including the line color change, help quickly identify trends and give users optimum customization. Users can select from five different color schemes including:
Green/Red
Purple/White
White/Blue
Silver / Orange
Teal/ Orange

AGHYAD_Renko+Sniper+PAB+TZ+ICHIMOKU_V21. MUST: RENKO ATR 2 YELOOW
2. STRONG: SNIPER 8,8 BUY SIGNAL
3. WEAK: TZ 6,6 BUY SIGNAL
========= SELL =========
1. STRONG: SNIPER 8,8 SELL SIGNAL
2. WEAK: TZ 6,6 SELL SIGNAL
3. WEAK: RENKO ATR 2 RED
=========NOTE=========
RENKO > SNIPER > TZ
6 minutes ago
the sniper buy signal is now based on renko

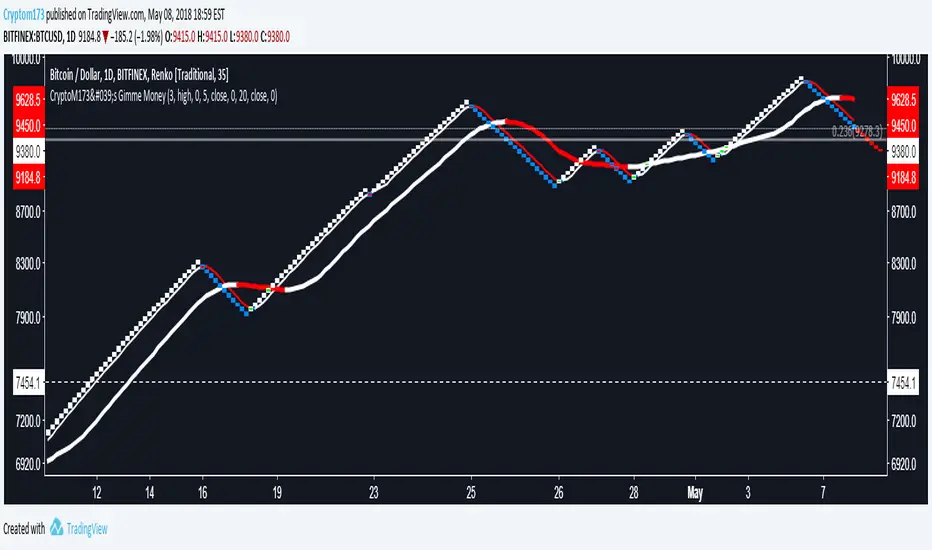
CryptoM173's Gimme MoneyLatest version. Nobody gave me feedback and managing requests to add people became a PITA. Enjoy.
I like money, you like money, this set up has the potential to make a LOT of it. That being said, I do NOTmake any warranties of this making you money, nor do I guarantee you will NOT lose money. In the end, you're the one configuring it and interpreting the results. Providing that you DO set it up correctly and it makes you obscene amounts of money, donations are always welcome (addresses below).
Before you start, it's probably you read EVERYTHING below.
You'll have to do some tweaking of the MA's to find a strat that best suits your needs. It is an indicator you're welcome to use to assist in your trading decisions. I made this script for renko charts and trading bitcoin -1.64% because the standard strat wasn't working out. if you find you're getting a lot of consecutive colored bars or crosses on Renko, you may need to switch from ATR 14 to something like Traditional 50. You will need to adjust the "box value" for traditional renko to fit the asset you're working with, on the time frame you're trading on. Smaller values (i.e. on bitcoin -1.64% I use a box value of 50 on 4hr and 1D with absurd success) but you need to make sure they're not too small, otherwise small moves may appear larger than they are, resulting in a bunch of break-even trades. If you're going to be trading cryptocurrency, it's easiest to switch back to ATR14 to get an idea of the Average Trading range to have a reference point to start from trading btc -1.64% (i.e .000034 rather than 50).
It's a great tool if you're looking to carry both swap and futs positions and keep an eye on the short term swap opportunities while monitoring the status of your futs position and help decide whether or not to close a long at a correction or not and while this strategy has been most effective for me with Renko bars, it's been very useful for monitoring futs positions on traditional charts.
For access, feel free to DM -0.34% me on twitter, @CryptoM173
If you're the generous type, feel free to donate Bitcoin to: 3BMEXWz6Es7iLdi9zAyMWWHHZPNbMKPqrV
Weis Wave Renko Panel 2 (Effort / Strength / Climax)Weis Wave Renko • Institutional HUD + Panel 2
Wyckoff / Auction Market Framework
This project consists of TWO COMPLEMENTARY INDICATORS, designed to be used together as a complete visual framework for reading Effort vs Result, Auction Direction, and Session Control, based on Wyckoff methodology and Auction Market Theory.
These tools are not trade signal generators.
They are context and decision-support instruments, built for discretionary traders who want to understand who is active, where effort is occurring, and when the auction is reaching maturity or exhaustion.
🔹 1) WEIS WAVE RENKO — INSTITUTIONAL HUD (Overlay)
📍 Location: Plotted directly on the price chart
🎯 Purpose: Fast, high-level institutional context and trade permission
The HUD answers:
“What is the current state of the auction, and is trading permitted?”
What the HUD shows:
🧠 Market Participation
Measures how much participation is present in the market:
Low Participation
Weak Participation
Active Participation
Dominant Participation
This reflects whether professional activity is present or absent, not direction alone.
📐 Auction Direction
Defines how the auction is currently resolving:
Auction Up
Auction Down
Balanced Auction
This is derived from price progression and effort alignment.
🔥 Effort (Effort vs Result)
Displays the relative strength of the current effort, normalized over recent waves:
Visual effort bar
Strength percentage (0–100)
Effort classification:
Low Effort
Increasing Effort
Strong Effort
Effort Exhaustion
This is the core Wyckoff concept: effort must produce result.
🌐 Session Control
Shows which trading session is controlling the auction:
Asia – Accumulation Phase
London – Development Phase
US RTH – Decision Phase
The dominant session is visually emphasized, while others are intentionally de-emphasized.
🔎 Market State & Trade Permission
Clearly separates structure from permission:
Structure (Neutral, Developing, Trending, Climactic Extension)
Permission
Trade Permitted
No Trade Zone
When Effort Exhaustion is detected, the HUD explicitly signals No Trade Zone.
🔹 2) WEIS WAVE RENKO — PANEL 2 (Lower Pane)
📍 Location: Dedicated lower pane below the price chart
🎯 Purpose: Detailed, continuous visualization of effort, strength, and climax
Panel 2 answers:
“How is effort evolving, and is the auction maturing or exhausting?”
What Panel 2 shows:
📊 Effort Wave (Weis-like)
Histogram of accumulated effort per directional wave
Green: Auction Up effort
Red: Auction Down effort
This reveals where real participation is building.
📈 Strength Line (0–100)
Normalized strength of the current effort wave
Same calculation used by the HUD
Enables precise comparison of effort over time
⚠️ Climax / Effort Exhaustion Marker
Triggered when effort is both strong and mature
Highlights Climactic Extension / Exhaustion
Serves as a warning, not an entry signal
🔗 HOW TO USE BOTH TOGETHER (IMPORTANT)
These indicators are designed to be used simultaneously:
Panel 2 reveals
→ how effort is building, peaking, or exhausting
HUD translates that information into
→ market state and trade permission
Typical workflow:
Panel 2 identifies rising effort or climax
HUD confirms:
Participation quality
Auction direction
Session control
Whether trading is permitted or restricted
⚠️ IMPORTANT NOTES
These tools do not generate buy or sell signals
They are contextual and structural
Best used with:
Wyckoff schematics
Auction-based execution
Market profile / volume profile
Discretionary trade management
🎯 SUMMARY
Institutional, non-lagging framework
Effort vs Result at the core
Clear separation between:
Context
Structure
Permission
Designed for professional discretionary traders

Weis Wave Renko Institutional HUD (Wyckoff/Auction) v6Weis Wave Renko • Institutional HUD + Panel 2
Wyckoff / Auction Market Framework
This project consists of TWO COMPLEMENTARY INDICATORS, designed to be used together as a complete visual framework for reading Effort vs Result, Auction Direction, and Session Control, based on Wyckoff methodology and Auction Market Theory.
These tools are not trade signal generators.
They are context and decision-support instruments, built for discretionary traders who want to understand who is active, where effort is occurring, and when the auction is reaching maturity or exhaustion.
🔹 1) WEIS WAVE RENKO — INSTITUTIONAL HUD (Overlay)
📍 Location: Plotted directly on the price chart
🎯 Purpose: Fast, high-level institutional context and trade permission
The HUD answers:
“What is the current state of the auction, and is trading permitted?”
What the HUD shows:
🧠 Market Participation
Measures how much participation is present in the market:
Low Participation
Weak Participation
Active Participation
Dominant Participation
This reflects whether professional activity is present or absent, not direction alone.
📐 Auction Direction
Defines how the auction is currently resolving:
Auction Up
Auction Down
Balanced Auction
This is derived from price progression and effort alignment.
🔥 Effort (Effort vs Result)
Displays the relative strength of the current effort, normalized over recent waves:
Visual effort bar
Strength percentage (0–100)
Effort classification:
Low Effort
Increasing Effort
Strong Effort
Effort Exhaustion
This is the core Wyckoff concept: effort must produce result.
🌐 Session Control
Shows which trading session is controlling the auction:
Asia – Accumulation Phase
London – Development Phase
US RTH – Decision Phase
The dominant session is visually emphasized, while others are intentionally de-emphasized.
🔎 Market State & Trade Permission
Clearly separates structure from permission:
Structure (Neutral, Developing, Trending, Climactic Extension)
Permission
Trade Permitted
No Trade Zone
When Effort Exhaustion is detected, the HUD explicitly signals No Trade Zone.
🔹 2) WEIS WAVE RENKO — PANEL 2 (Lower Pane)
📍 Location: Dedicated lower pane below the price chart
🎯 Purpose: Detailed, continuous visualization of effort, strength, and climax
Panel 2 answers:
“How is effort evolving, and is the auction maturing or exhausting?”
What Panel 2 shows:
📊 Effort Wave (Weis-like)
Histogram of accumulated effort per directional wave
Green: Auction Up effort
Red: Auction Down effort
This reveals where real participation is building.
📈 Strength Line (0–100)
Normalized strength of the current effort wave
Same calculation used by the HUD
Enables precise comparison of effort over time
⚠️ Climax / Effort Exhaustion Marker
Triggered when effort is both strong and mature
Highlights Climactic Extension / Exhaustion
Serves as a warning, not an entry signal
🔗 HOW TO USE BOTH TOGETHER (IMPORTANT)
These indicators are designed to be used simultaneously:
Panel 2 reveals
→ how effort is building, peaking, or exhausting
HUD translates that information into
→ market state and trade permission
Typical workflow:
Panel 2 identifies rising effort or climax
HUD confirms:
Participation quality
Auction direction
Session control
Whether trading is permitted or restricted
⚠️ IMPORTANT NOTES
These tools do not generate buy or sell signals
They are contextual and structural
Best used with:
Wyckoff schematics
Auction-based execution
Market profile / volume profile
Discretionary trade management
🎯 SUMMARY
Institutional, non-lagging framework
Effort vs Result at the core
Clear separation between:
Context
Structure
Permission
Designed for professional discretionary traders

Last Available Bar InfoLibrary "Last_Available_Bar_Info"
getLastBarTimeStamp()
getAvailableBars()
This simple library is built with an aim of getting the last available bar information for the chart. This returns a constant value that doesn't change on bar change.
For backtesting with accurate results on non standard charts, it will be helpful. (Especially if you are using non standard charts like Renko Chart).
Methods
getLastBarTimeStamp()
: Returns Timestamp of the last available bar (Constant)
getAvailableBars()
:Returns Number of Available Bars on the chart (Constant)
Example
import paragjyoti2012/Last_Available_Bar_Info/v1 as LastBarInfo
last_bar_timestamp=LastBarInfo.getLastBarTimeStamp()
no_of_bars=LastBarInfo.getAvailableBars()
If you are using Renko Charts, for backtesting, it's necesary to filter out the historical bars that are not of this timeframe.
In Renko charts, once the available bars of the current timeframe (based on your Tradingview active plan) are exhausted,
previous bars are filled in with historical bars of higher timeframe. Which is detrimental for backtesting, and it leads to unrealistic results.
To get the actual number of bars available of that timeframe, you should use this security function to get the timestamp for the last (real) bar available.
tf=timeframe.period
real_available_bars = request.security(syminfo.ticker, tf , LastBarInfo.getAvailableBars() , lookahead = barmerge.lookahead_off)
last_available_bar_timestamp = request.security(syminfo.ticker, tf , LastBarInfo.getLastBarTimeStamp() , lookahead = barmerge.lookahead_off)
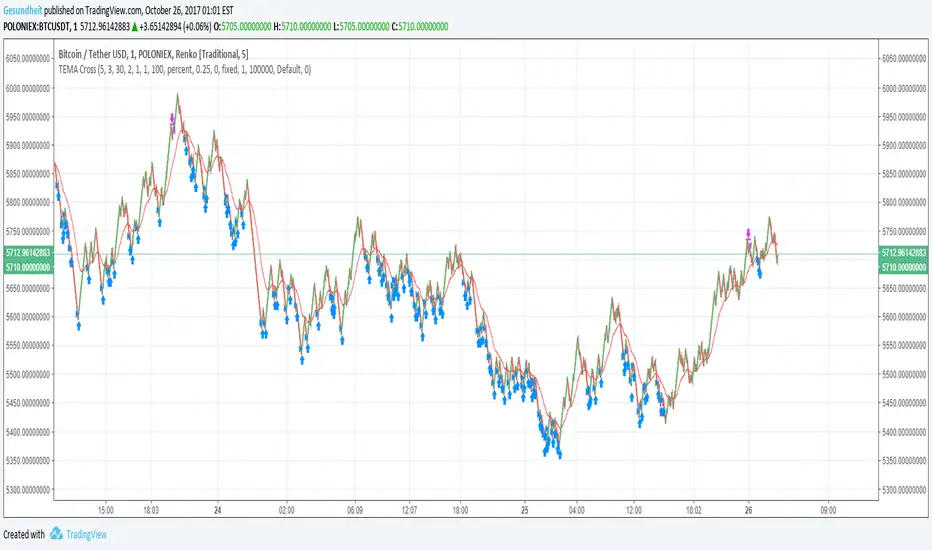
TEMA Cross with Renko BoxesThis is a pretty simple microprofit strategy with a couple twists:
Renko boxes plot fixed price changes over variable amounts of time, rather than plotting varying price changes over fixed amounts of time like conventional candlesticks. This makes price trends much simpler to identify, and that's what we ultimately care about.
Triple exponential moving average is a moving average that has considerably less lag compared to a regular EMA.
Buying and selling is simple, buy when TEMA crosses above a short-term SMA, and sell when TEMA crosses below the short-term SMA. The use of Renko candles makes these crosses more reliable, and TEMA gives us more optimal entries and exits.
We also avoid buying if the price is above a longer-term smoothed moving average. This is an attempt to avoid bags but it means we might miss a few trades right after a pump.
Also included are
avg_protection -- if > 0 we only buy if it will reduce our average bought price
gain_protection -- if >0 only sell once we have met our min_gain
I prefer to use a fixed price increment (traditional Renko) rather than ATR. I start with an increment roughly 0.1% of the current price level and see how the chart looks. It's better if the chart has a lot of big zig-zags. Larger price increments will be less noisy and more reliable, and is more suited for longer-term swing trading.
This strat needs to be used with tiny tiny order sizes and can definitely be improved upon. It does not maximize gains on very rapid pumps.
It basically accumulates a long position with many small buys over and over when the price is below average, until there is an opportunity to sell for a profit. In a pump there is not a lot of time to re-accumulate a position after the first sell.
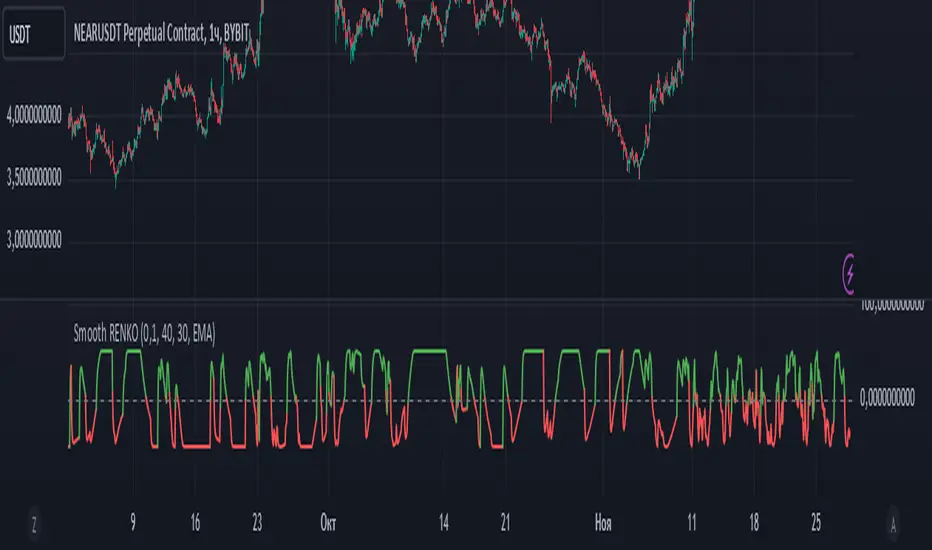
Smoothed Renko OscillatorSMOOTHED RENKO OSCILLATOR
Technical indicator combining Renko charting with oscillator mechanics for price momentum analysis. Brick size determines sensitivity of price movement detection, with adjustable smoothing for noise reduction.
Parameters include brick size (default 10), smoothing period (5), oscillator period (14), and smoothing type selection (EMA/SMA/WMA). Values above zero indicate bullish momentum, below zero bearish momentum, with ±40-50 marking potential reversal zones. Zero-line crossovers suggest trend changes.
Larger brick settings reduce noise but delay signals, while smaller bricks increase sensitivity. EMA smoothing provides faster response, while SMA/WMA offer more stable readings. The indicator supports trend confirmation, momentum measurement, divergence analysis, and entry/exit timing.
Best used in conjunction with price action and additional indicators for comprehensive market analysis. Particularly effective in trending markets for momentum confirmation and potential reversal identification.
[JL] 3-Color Renko High-Low AlertI am playing Renko and made this script.
- Ignore ATR mode because it will repaint. Instead setting the boxsize and SL index by wathching ATR Labels
- pipmode is because I always trading forex. Normally I use pips. If you are trading others just set it to false.
- Set up box size and SL index based on ATR Labels
Lancelot vstop intraday trending strategyDear all,
Free strategy again.
I found using 3 volatility stop with different settings could be very helpful when trading an intraday trending market.
With the ATR setting or 5, 10, 15, we can weed out many false break.
Vstop setting is OHLC4.
On the other hand, this strategy also utilize Renko as part of the strategy, so you could say this strategy is mainly an intraday break out trend following strategy.
Works well on BTCUSD XBTUSD, as well as other major liquid alt Pairs.
And lastly,
Save Hong Kong, the revolution of our times.

Lancelot RR StrategyDear all,
Free strategy again.
This strategy consists of 2 indicators I think works well with each other as a trend following strategy.
The 2 indicators are Renko chart and Relative Vigor Index.
This is a long-only breakout strategy that aims to capture the majority of the trend.
Works well on BTCUSD XBTUSD, as well as other major liquid Pair.
Please acknowledge my effort by like and follow.
And lastly,
Save Hong Kong, the revolution of our times.
