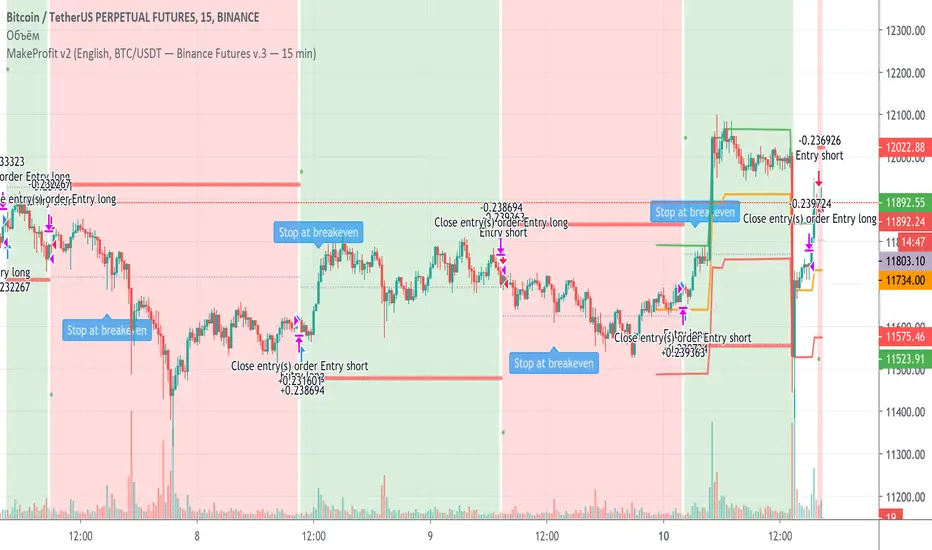
MakeProfit v2The Make Profit Club team has developed a new generation indicator that allows you to choose certain strategies calculated by us at a distance and simply enter a position based on our signals with our algorithms
Each partner who is trying to make money on the stock exchange shall from part of trust not only to us but to your head before you start earning.
We added the most popular strategies for Bitcoin and altcoins to the indicator, but we also didn't forget about currencies like EUR/USD and EUR/USD/RUB.
The indicator additionally works with scalpel levels, which you can buy back (as well as trade in the specified scalpel corridor).
Not only scalping strategies are included, but also trend trading. Let's say that the 45-minute strategy on bitcoin gave almost 700% of the profit for 45 weeks (1-4 hours and 1 day are also available).
For the most unintelligent, we have added entry levels, exit levels, levels where you can enter a trade if you do not have time for the signal, and many other features that you will not find anywhere else.
We will constantly add new strategies and improve our own.
You can get test access by contacting me.
Команда Make Profit Club разработала индикатор нового поколения, позволяющий выбрать определенные стратегии, просчитанные нами на дистанции и просто входить в позицию по нашим сигналам с нашими алгоритмами
Каждый партнер, который пытается заработать на бирже должен от части довериться не только нам, но и своей голове, прежде чем начать зарабатывать.
В индикатор мы добавили самые ходовые стратегии для Bitcoin и altcoins, но и не забыли про валюты по типу EUR/USD and EUR/USD/RUB.
Индикатор дополнительно работает со скальповыми уровнями, по которым вы сможете докупаться (а также торговать в указанном скальповом коридоре).
Включены не только скальповые стратегии, но и торговля по тренду. Допустим, стратегия по 45 минут на биткоине дала почти 700% прибыли за 45 недель (доступны еще и 1-4 часа, и 1 день).
Для самых несообразительных мы добавили уровни входа, уровни выхода, уровни, где можно зайти в сделку, если не успели по сигналу и еще очень много других функций, которых вы нигде не найдете.
Обратившись ко мне, вы можете получить тестовый доступ.
חפש סקריפטים עבור "scalping"
Fibonacci + RSI - StrategyStrategy: Fibonacci + RSI:
- Intraday trading strategy (Scalping).
Time Frames Tested with best Results:
30 Minutes.
5 Minutes.
15 Minutes.
1 Minute
Indicators Used:
RSI (30 / 70)
Fibonacci (1 - 0.784)
How it Works:
Once the Price Hits the 1 or -1 Fibonacci Level and bounces a little bit, It checks the RSI if Over Bought or Over Sold According to 30 - 70.
If both conditions are satisfied, it triggers a Long or Short Positions.
Further Notes:
- I have put a Stop-loss with a 2% just for further upgrades.
- Not advised to use in High Volatility Markets.
- No Repaint was observed during a 2-Weeks Tests.
If you have any suggestions or modifications please contact to add.
If you have observed any bad behavior please contact to fix.
Trade wisely.

OHO Trading Nifty50 15 Min 07.05.2020 IndicatorStudies Used:
We have used different type of moving averages, average true ranges, pivot points and relative strength indicator in this indicator.
Usage:
It can be used for scalping and intra-day trading. It works best on Nifty 15 Minutes time frame.
It provides easy to visualize multiple information:
1) It gives the correct Entry on Time.
2) Fake trends are shown on purple color of trend line.
3) Target levels.
4) It gives proper Exit on time. or Exit at the time of closing.
5) Trailing as per trend line.
How to read OHO Indicator?
Trend line color:
Red = Sell side trailing
Green = Buy side trailing
Purple = No trade zone or Trend Changing Time
Recommendations:
Trade is recommended to be closed when price is below UpTrend line (in case of buy side trade) or it is above DownTrend line (in case of sell side trade)
What time frame should I use?
15 Minutes is best time-frame, But you can check different time-frames in Strategy Testing section or as per your requirements.
Disclaimer:
Past performance is not the guarantee of future performance.
Best Indicator for range bound and volatile sessions.
For any type of queries kindly send us personal message.

BTC 5 min + ATRThis STUDY is optimized for bitcoin ( BTCPERP on deribit)
It catch fast trades going with the trend, so it should work in trends like in consolidation.
This strategy is based on S/R mixed with parabolic SAR , the point is to catch a movement when it's starting and confirmed.
It's optimized for 5 min timeframe, you might try it on other other tf but change the SL/TP too.
You should used it for few minutes scalp, fast enter and exit, on 5 min TF.
UPDATE ! This time it usenormal candle
The new idea is to filter trades by ATR, and by this way to NOT trade consolidation.
Have fun :)
Rules:
- Use small position, max leverage x5
- Place TP between 70$
- Place SL at 50$
- Entre in position by limit, you get paid for it
Enjoy, test it and make some money :)
No repaint.

KundaliniThe Kundalini is a technical indicator. Based on algorithm calculations, this indicator extrapolates the previous price for the next bar. Plus addition Multi time frame ATR volatility Reading environment for higher conditions
Here is how Dominator is calculated:
1. The study estimates the price projected for the next bar. The estimated price is based on the algorithm method.
2. The study extrapolates this value to find a projected price change for the next bar.
The resulting extrapolated value is shown as a histogram on a lower subgraph. By default, sections of the histogram where the extrapolated value is increasing are shown in green; sections corresponding to the decreasing value are shown in red.
Note: Value projection is purely mathematical as all calculations are based on algorithm averaging of previous values.
Overlay True
The strategy includes 3 different adjustable levels for the ladder , plus automatic adjustable stop loss and takes profit calculated from your average entry price after each ladder adds.
Adjustable BAcktest Window.
1 long signals
3 ladder long add signals
1 short signals
3 ladder short add signals
1 dynamic stop calculated from your average entry price
1 dynamic take profit calculated from your average entry price
Please Private Msg me if you like more info about the script Full pdf available or if you need access to it
thx for your time and support
BT Profit Sniper 3.0BT Profit Sniper 3.0 is a completely new strategy built from the ground up as a successor to previous 1.0 and 2.0 versions of Profit Sniper.
Offering up huge improvements, including multiple position triggers, derived from Bollinger Bands and Chande Momentum as well as our own bespoke stochastic ribbons that provide trend pivots . Another big decision was to remove the MACD from the indicator package, as invariably users preferred using the built-in MACD .
So how does it work?
3.0 operates off two timeframes in parallel, your Trend Timeframe (Higher Timeframe concerned with identifying market up & down trends), and your Trade Timeframe (Lower Timeframe to actually backtest Longs & Shorts in).
Within each timeframe, you can tailor your preference for waiting for either Stochastic Ribbon cross only, or Ribbon Cross followed by Chande Confirmation for that additional market structure confidence.
You also have the option to trade with trend so the indicator will automatically flag & alert only Shorts in a Short trend, and Longs in a Long Trend.
User parameters allow traders to add trailing stop, toggle between percentage and USD value, providing higher accuracy in the forecast rate.
If you would like access, please send me a PM.

eha Moving Averages StrategyMoving Average based strategies are very popular ones among both long-term investors and short-term traders as they can be tailored to any time frame. One of the main moving average strategies are crossovers. The very simple type is a price crossover , which is when the price crosses above or below a moving average to signal a potential change in trend.
Another strategy is to apply two moving averages to a chart: one longer (or slow) and one shorter (or fast). When the shorter-term MA crosses above the longer-term MA, it's a buy signal, as it indicates that the trend is shifting up (also known as “ Golden Cross ”). Meanwhile, when the shorter-term MA crosses below the longer-term MA, it's a sell signal, as it indicates that the trend is shifting down (which is also known as “ Dead/Death Cross ”).
This is a study to find a suitable trading strategy for 4-6 hour time frames. As you can see the performance is currently very poor. It has just generated almost 90 trades in a very long period from January 2017 to the time of publishing the study for the first time.
Moving averages work quite well in strong trending conditions but poorly in choppy or ranging conditions. Adjusting the time frame can correct this problem temporarily, although, at some point, these issues are likely to occur regardless of the time frame chosen for the moving average(s).
I am working on this basic strategy to make its performance better and I will update the post in the future. So keep in touch by following the post.
Why have I republished my study?
It sounds like TradingView stores and indexes scripts based on the title of the post rather than the actual title of the scripts and if one chose general terms as the title of the post, the TradingView script search engine may be unable to find it. So I decided to repost the strategy with a more searchable and unique prefix of " eha ".
Please provide me with your precious feedback.

FTSMA - Trend is your frendThis my new solid strategy: if you belive that "TREND IS YOUR FRIEND" this is for you!
I have tested with many pairs and at many timeframes and have profit with just minor changes in settings.
I suggest to use it for intraday trading .
VERY IMPORTANT NOTE: this is a trend following strategy, so the target is to stay in the trade as much as possible. If your trading style is more focused on scalping and/or pullbaks, this strategy is not for you.
This strategy uses moving averages applied to Fourier waves for forecasting trend direction.
How strategy works:
- Buy when fast MA is above mid MA and price is above slow MA, which acts as a trend indicator.
- Sell when fast MA is below mid MA and price is below slow MA, which acts as a trend indicator.
Strategy uses a lot of pyramiding orders because when you are in a flat market phase it will close 1 or 2 orders with a loss, but when a big trend starts, it will have profit in a lot of orders.
So, if you analize carefully the strategy results, you will note that "Percent Profitable" is very low (30% in this case) because strategy opened a lot of orders also in flat markets with small losses, BUT "Avg # bars in winning trades" is very high and overall Profit is very high: when a big trend starts, orders are kept open for long time generating big profits.
Thanks to all pinescripters mentioned in the code for their snippets.
I have also a study with alerts. Next improvement (only to whom is interested to this script and follows me): study with alerts on multiple tickers all at one. Leave a comment if you want to have access to study.
HOW TO USE STRATEGY AND STUDY TOGHETER:
1- Add to chart the strategy first, so your workspace will be as clean as possible.
2- Open the Strategy Tester tab at footer of the page.
3- Modify settings to get best results (Profit, Profit Factor, Drawdown).
4- Add study with alerts to your chart with same setting of strategy.
I WILL PROVIDE A DETAILED QUICK INSTALLATION GUIDE WITH THE STUDY!
Please use comment section for any feedback or contact me if you need support.

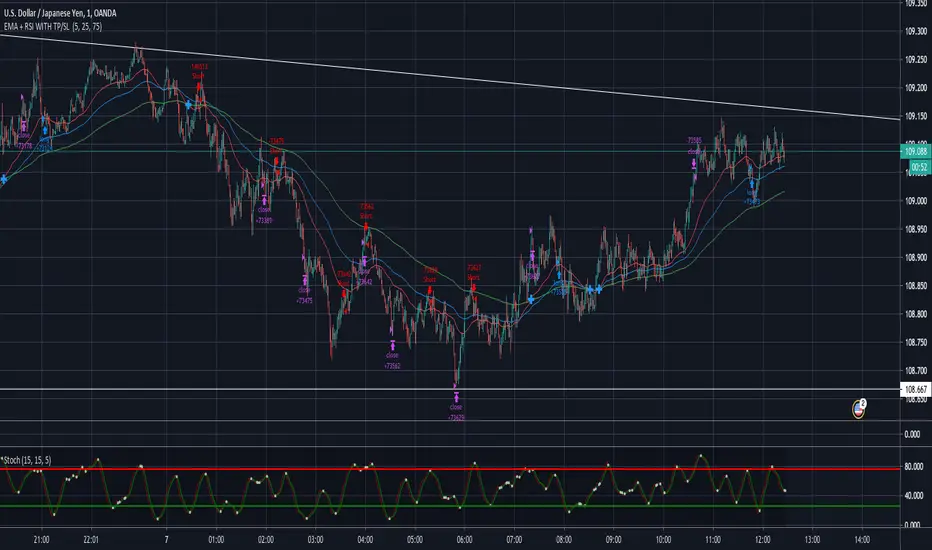
EMA + RSI WITH TP/SL 1 Minute scalping strategy
EMA 50 & EMA 200 dictate direction of entry
EMA 50 above EMA 200 = Long
EMA 50 below EMA 200 = Short
If Long and RSI crossover 25 = Long entry
If Short and RSI crossunder 75 = Short entry
Each trade is currently 1:1.3 risk to reward ratio.
15 pip TP
12 PIP SL
Any suggestions on further improvements /variations are more then welcome.
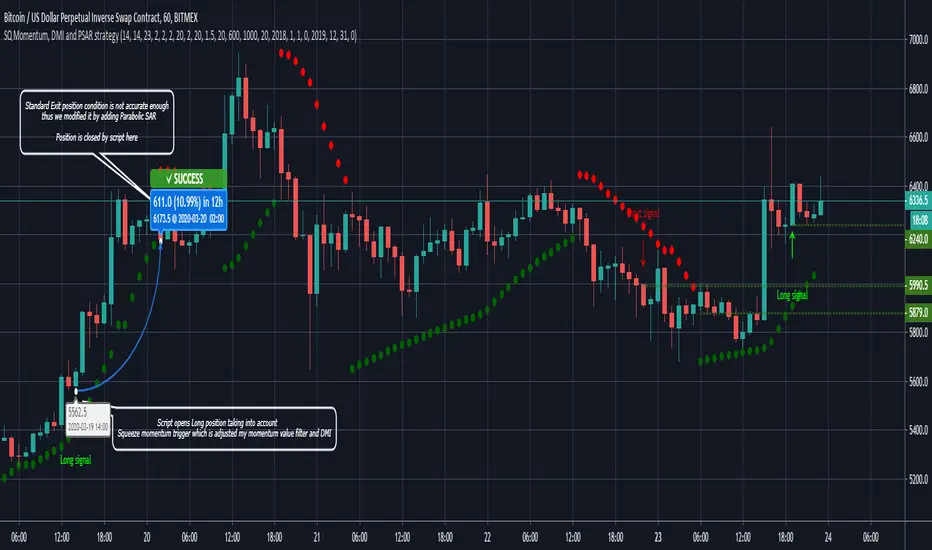
Sqeeze Momentum, DMI and Parabolic SAR strategyThe script combines Sqeeze Momentum, Directional Movement Index (DMI) and Parabolic SAR indicators in long and short scalping strategies
When conditions of long or short position from all mentioned indicators are met script opens position. Once trend changes it closes position and fixes profit
Advantages:
1. Deal start condition includes the folowing filters and requirements:
- Momentum value is adjusted using a relative proportion of volume at each timeframe scale to exclude a chance of opening position at a low impulse stage
- Squeeze momentum trigger condition is automatically checked before a position is opened
- +DI , -DI and ADX values are taken into account to confirm the trend direction
- Position size is taken into account to ensure there will not be opened any excess deals or alerts
2. Exit deal condition was modified using Parabolic SAR indicator. Hence, it is ensured positions will not be closed in a middle of a trend
3. Study is modified into strategy allowing you to use it directly through the trading panel
If you want to obtain access to the strategy please send us a personal message
FRAMA - Supertrend strategyFRAMA Strategy
I found this strategy on internet, in a well-known forex forum.
I have translated the two indicators mentioned in that strategy (originally in mq4) in pine script.
Thanks to Fractured and Shizaru for the FRAMA snippets, to mejialucas for Supertrend snippet, to JayRogers for trade management snippet and to Trost for backtesting snippet.
I also added some code to have FRAME with a deiiferent timeframe
Indicators set-up:
FRAMA period 24 (it was originally 25 but it's better to use an even number)
FRAMA timefarme lower then chart timeframe (e.g. daily chart and weekly FRAMA)
Supertrend indicator as it is.
Of course, it is better to adapt above setting to traded instrument.
Long/Buy rules:
1 - Enter at crossover between FRAMA and its signal
2 - Option to filter entries based on supertrend signal
3 - Exit when Supertrend change direction;
4 - Exit long when short signal occurs;
Short/Sell rules:
1 - Enter at crossunder between FRAMA and its signal
2 - Option to filter entries based on supertrend signal
3 - Exit when Supertrend change direction;
4 - Exit short when long signal occurs;
VERY IMPORTANT NOTE: this is a trend following strategy, so the target is to stay in the trade as much as possible (drawdown my be high). If your trading style is more focused on scalping and/or pullbaks, this strategy is not for you.
Credits to who developed this startegy (google it).
Thanks to all pinescripters mentined in the code for their snippets.
I have also a study with alerts.
Please use comment section for any feedback or contact me if you need support.

DMT Autobot StrategyDMT its a Modified homemade Trend Reversal Indicator base on Volatility & Average true range
You have to have a defined trading plan and you also have to believe it. For this, it is necessary to have coordination and harmony between the conscious and subconscious part of the individual, That is why it is so difficult for most retail traders to be profitable
ĐΜŦ is designed to identify spots in the market that offer some of the most suitable buy and sell scalping trading opportunities plus swing trading over runs.
ĐΜŦ is comprised of three inputs, which are helping to identify the volatility of a security. To determine the level of volatility there are three ranges included in the equation
Input 1 - Current Day's Range
Input 2 - How High has the security risen from the previous day's close
Input 3 - How low has the security dropped from the previous day's close
One of the greatest challenges for new traders is avoiding drawdowns on their account. Drawdowns are what kills a trader's ability to consistently earn over the long haul and creates enormous emotional pain and turmoil.
Drawdowns are a result of two factors:
(1) over-leverage and
(2) extremely volatile stocks. One could argue that if you get to number 1 right, the volatility is irrelevant; however, these two elements are not always mutually exclusive.
HOW TO USE
Buy and sell signals for entry
and 1 take profit levels
1 adjustable stop loss level for each direction.
easy to set up with Autobot service and alert system trading

Ichimoku+P&F+Stoch+NoRange+HL+crossupThis is a highly advance trading strategy for high frequency trading on Bitmex, Binance Futures, ByBit and others. I'm using variations of this script to manage $500K institutional account! Forward tested results available for 1.5 years. This script uses combination of Ichimoku cloud on multi-timeframe. Uses Stochastic RSI indicator on multi-timeframe. Uses Point and Figure analysis. Used EMA crossup for longs
Currently looking for Beta Testers.
Instructions:
1. Each coin is unique so needs a lot of time to fine tune the parameters.
2. This parameters tuned only for Longs (inquire for Shorts)
3. This is only tuned for BTC but I have tuned parameters for all coins (inquire for help)
Settings:
1. Chart timeframe: 3
2. P&F timeframe: 1
3. Ichimoku timeframe: 15
5. Stochastic timeframe: 15
Current exchange integration: Bitmex, Binance Futures, Bybit... More will be added soon.

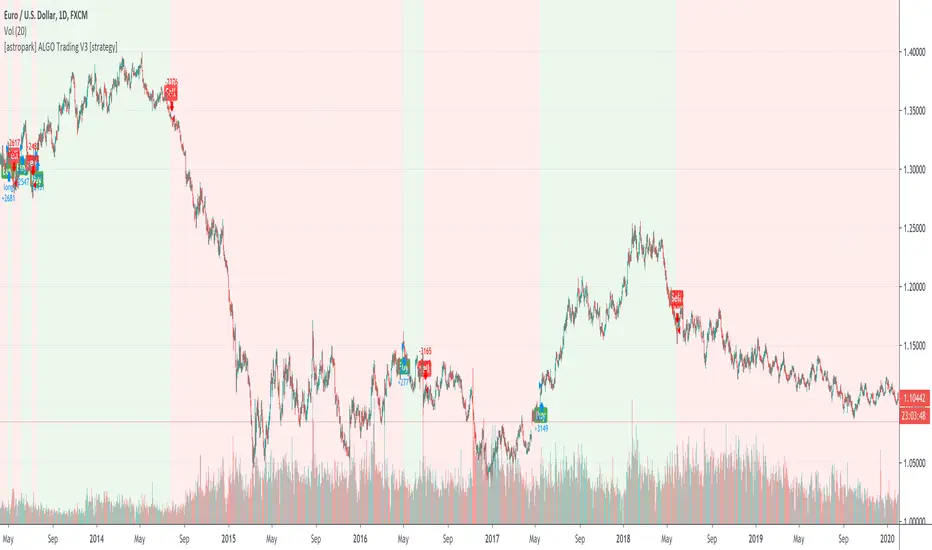
[astropark] ALGO Trading V3 [strategy]Dear Followers,
today another awesome Swing and Scalping Trading Strategy indicator, runnable on a bot , which works great on many timeframes (from 1h and above is suggested), just write me in order to help you find correct settings).
It must be said that this strategy works even better on 1m Renko chart!
If you are a scalper or you are a swing trader, you will love suggested entries for fast and long-lasting profit.
Keep in mind that a proper trailing stop strategy and risk management and money management strategies are very important (DM me if you need any clarification on these points).
This is not an evolution of "ALGO Trading V1" or "ALGO Trading V2" , but a twin sister of them.
For your reference, here it is the "ALGO Trading V1" indicator
and here the "ALGO Trading V2"
This strategy has the following options:
enable/disable signals on chart
enable/disable bars and background coloring based on trend
enable/disable a "filter noise" option , which try to reduce overtrading (you can easily check it on backtesting)
enable/disable a Take Profit / Stop Loss option (you can easily check it on backtesting too)
enable/disable a secret SmartOption which may improve profit on your chart (again, check it on you chart if it helps or not)
This strategy only trigger 1 buy or 1 sell. If you enable Take Profit / Stop Loss option, consider that many TP can be triggered before trend reversal, so take partial profit on every TP an eventually buy/sell back lower/higher to maximize your profit.
In order to get notified when a signal is triggered, you need to use the "alarms" version of this indicator (just search for astropark's "ALGO Trading V3" indicator and choose the one with "alarms" suffix).
Strategy results are calculated on the time window from 1995 to now, so on more than 15 years, using 1000$ as initial capital and working at 1x leverage (so no leverage at all! If you like to use leverage, be sure to use a safe option, like 3x or 5x at most in order to have liquidation price very far).
This is not the "Holy Grail", so use a proper risk management strategy.
This script will let you backtest how the indicator will perform on any chart and timeframe you may like to test and/or trade. Of course results will be very different depending on the chart and timeframe you will open. I tested a lot of charts and always you can find a combination that keep this strategy in profit on swing trading style (and this means that if you can have a daily look at the chart you can always manage to maximize your profit on each trade!)
This is a premium indicator , so send me a private message in order to get access to this script.
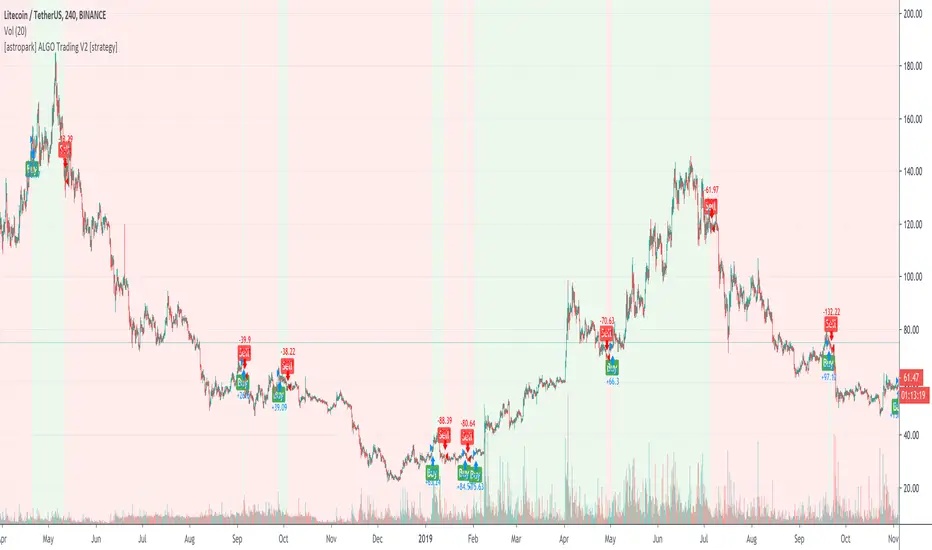
[astropark] ALGO Trading V2 [strategy]Dear Followers,
today another awesome Swing and Scalping Trading Strategy indicator, runnable on a bot , which works great on many timeframes (ones between 1h and 1D are suggested, but just write me in order to help you find correct settings).
It must be said that this strategy works even better on 1m Renko chart!
If you are a scalper or you are a swing trader, you will love suggested entries for fast and long-lasting profit.
Keep in mind that a proper trailing stop strategy and risk management and money management strategies are very important (DM me if you need any clarification on these points).
This is not an evolution of "ALGO Trading V1" or "ALGO Trading V3" , but a twin sister of them. Search them on TradingView to know them better.
Here you can find ALGO Trading V1
This strategy has the following options:
enable/disable signals on chart
enable/disable bars and background coloring based on trend
enable/disable a "filter noise" option , which try to reduce overtrading (you can easily check it on backtesting)
enable/disable a Take Profit / Stop Loss option (you can easily check it on backtesting too)
enable/disable a secret SmartOption which may improve profit on your chart (again, check it on you chart if it helps or not)
This strategy only trigger 1 buy or 1 sell. If you enable Take Profit / Stop Loss option, consider that many TP can be triggered before trend reversal, so take partial profit on every TP an eventually buy/sell back lower/higher to maximize your profit.
In order to get notified when a signal is triggered, you need to use the "alarms" version of this indicator (just search for astropark's "ALGO Trading V2" indicator and choose the one with "alarms" suffix).
Strategy results are calculated on the time window from January 2019 to now, so on more than 1 year, using 1000$ as initial capital and working at 1x leverage (so no leverage at all! If you like to use leverage, be sure to use a safe option, like 3x or 5x at most in order to have liquidation price very far).
This is not the "Holy Grail", so use a proper risk management strategy.
This script will let you backtest how the indicator will perform on any chart and timeframe you may like to test and/or trade. Of course results will be very different depending on the chart and timeframe you will open. I tested a lot of charts and always you can find a combination that keep this strategy in profit on swing trading style (and this means that if you can have a daily look at the chart you can always manage to maximize your profit on each trade!)
This is a premium indicator , so send me a private message in order to get access to this script.
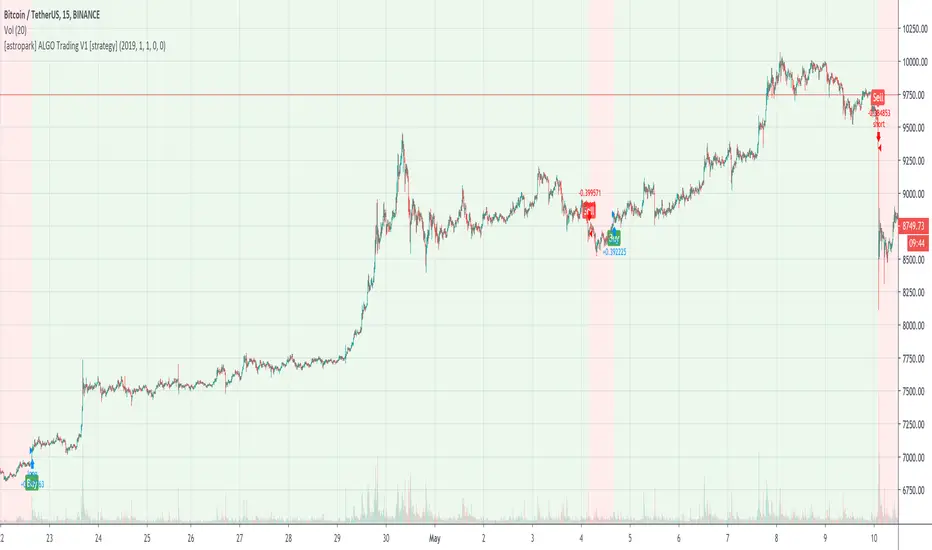
[astropark] ALGO Trading V1 [strategy]Dear Followers,
today another awesome Swing and Scalping Trading Strategy indicator, runnable on a bot , which works great on Low Timeframes (1h is suggested) but also on even lower ones (till 15m) and on higher ones (no further than 1D), just write me in order to help you find correct settings).
It must be said that this strategy works even better on 1m Renko chart!
If you are a scalper or you are a swing trader, you will love suggested entries for fast and long-lasting profit.
Keep in mind that a proper trailing stop strategy and risk management and money management strategies are very important (DM me if you need any clarification on these points).
This is not an evolution of "ALGO Trading V2" or "ALGO Trading V3" , but a twin sister of them. Search them on TradingView to know them better.
This strategy has the following options:
enable/disable signals on chart
enable/disable bars and background coloring based on trend
enable/disable a "filter noise" option, which try to reduce overtrading (you can easily check it on backtesting)
enable/disable a Take Profit / Stop Loss option (you can easily check it on backtesting too)
enable/disable a secret SmartOption which may improve profit on your chart (again, check it on you chart if it helps or not)
This strategy only trigger 1 buy or 1 sell. If you enable Take Profit / Stop Loss option, consider that many TP can be triggered before trend reversal, so take partial profit on every TP an eventually buy/sell back lower/higher to maximize your profit.
In order to get notified when a signal is triggered, you need to use the "alarms" version of this indicator (just search for astropark's "ALGO Trading V1" indicator and choose the one with "alarms" suffix).
Strategy results are calculated on the time window from January 2019 to now, so on more than 1 year, using 1000$ as initial capital and working at 1x leverage (so no leverage at all! If you like to use leverage, be sure to use a safe option, like 3x or 5x at most in order to have liquidation price very far).
This is not the "Holy Grail", so use a proper risk management strategy.
This script will let you backtest how the indicator will perform on any chart and timeframe you may like to test and/or trade. Of course results will be very different depending on the chart and timeframe you will open. I tested a lot of charts and always you can find a combination that keep this strategy in profit on swing trading style (and this means that if you can have a daily look at the chart you can always manage to maximize your profit on each trade!)
This is a premium indicator , so send me a private message in order to get access to this script.
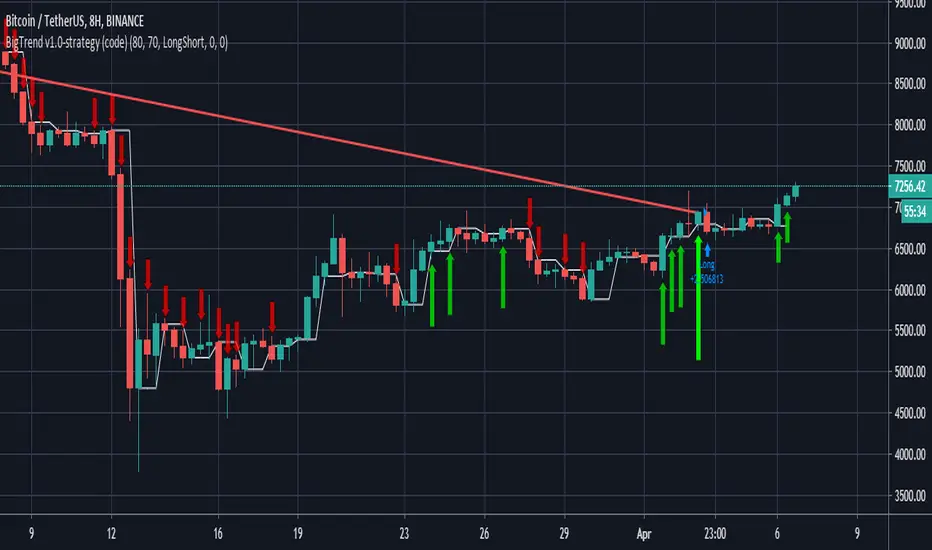
Long/ Short with Big Trend v1.0-strategyHello traders,
This script using multi MA and EMA , MACD , RSI ... for vote BUY or SELL.
If 80% signal vote for BUY, signal Long will been active
or 80% signal vote for SELL, signal Short will been active
Recommend using this script for Trend trader, not using for Scalping trader or Swing trader!
Best backtest in:
- BTC/USDT H8, D1
- LTC/USDT: D1
- ETH/USDT: H8
- BCH/USDT: H2, H4
- LINK/USDT: H8
...
With other symbols and time frame, you can do it yourself.
We are recommend using with min time frame H2 for all symbol or using H8 only.
Setting for backtest:
- Signal %: set percent for active signal. Recommend set 80 for big time frame or 90-95 for small time frame.
- Trade type:
+ LongShort (default): trade Long and Short if you trade with margin account.
+ LongOnly: if you trade with spot account, select Long only for backtest.
+ ShortOnly: if you trade with margin account and like short only.
- Take profit %: close order if profit > this value. Set to 0 for disable this function.
- Stop loss %: close order if profit < this value. Set to 0 for disable this function.
N.White_ScalpM15TestThis test version of the strategy is designed for scalping on the timeframe M15. It includes drawing support and resistance lines, a bollinger band.

N.White_ScalpM5TESTThis test version of the strategy is designed for scalping on the timeframe M5. It includes drawing support and resistance lines, a bollinger band.

RSI+MA_Scalping_StrategyOANDA:USDJPY
This strategy is based on Larry Connors' 2-period RSI strategy. I applied this for scalping(5Minutes) in the forex market based on his strategy.
Best use for YEN Crosses (High liquidity) trading such as USD/JPY and EUR/JPY.
Notes:
1. This strategy doesn't work well if volatility is low.
2. Don't go against Long-term trends. This strategy has practically no stop loss during rapid trends, so if going against trends can be devastating.(Especially GBP/JPY)
3. Don't martingale trading with this strategy. Based on my research, At first glance, it seems to work, but lose in the long run.

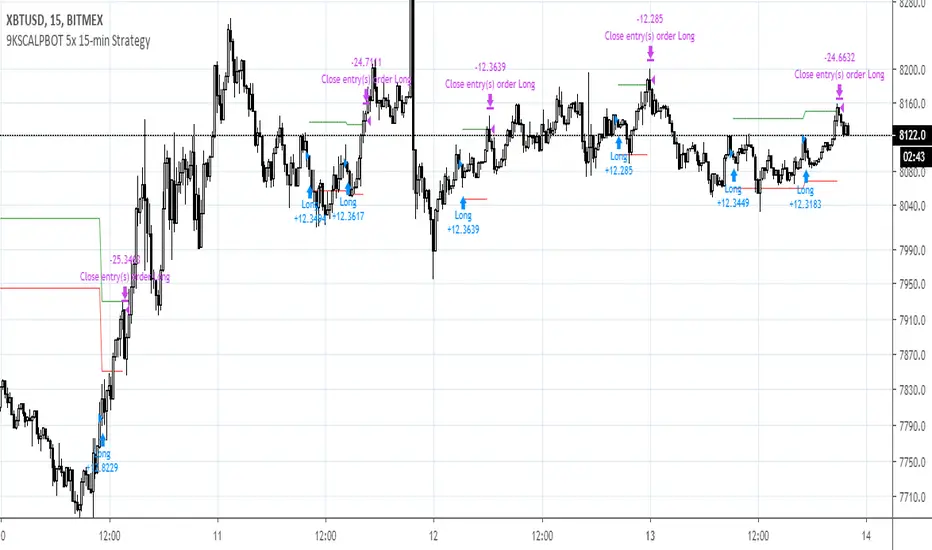
9KSCALPBOT 5x 15-min StrategyThis scalp bot uses low leverage to scalp small but high certainty movements on the 15-minute timeframe. Its amazing proprietary feature addresses the common problem of accumulated losses due to excessive stop-lossing -- this is done by assessing macro trends on higher timeframes when underwater, and then riding the position out until profitable again. You will get an average of about 1 entry and 1 exit per day.
The core logic uses a modified combination of CCI and Schaff Trend oscillators and a proprietary pattern recognition mechanic. Leverage should be kept low (5X or less) as the algorithm could temporarily go significantly underwater as well as pyramid (stack) same direction entries up to five times before closing. Any leverage higher than 5X significantly increases risk of liquidation. This bot has been consistently backtested for 10 months with about 75-85% win rate, 100%+ 3-month profitability, very low ~5% drawdown, all after factoring typical BitMex fees (0.06% after counting affiliate self-referral).
As with any automated strategy, it does not account for black swan events or disruptions in server connectivity (e.g., BitMex overload errors).
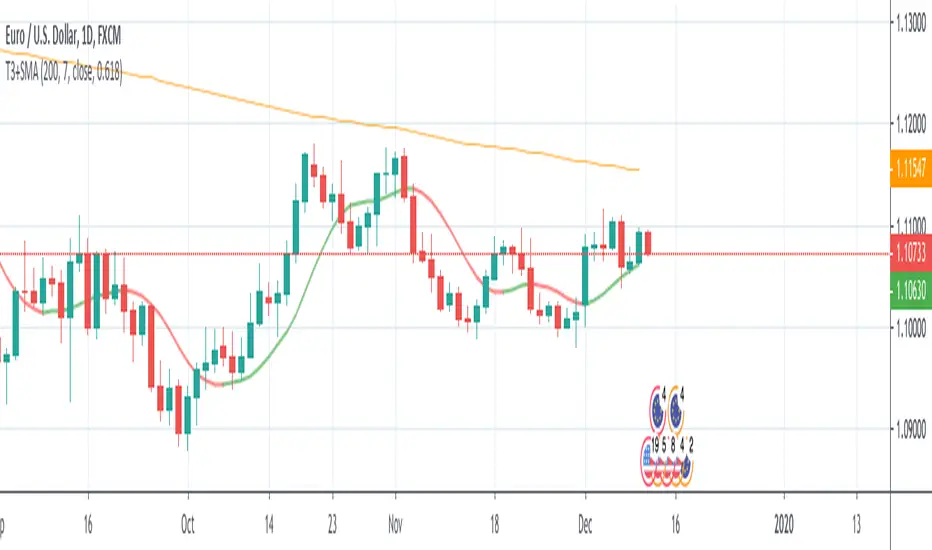
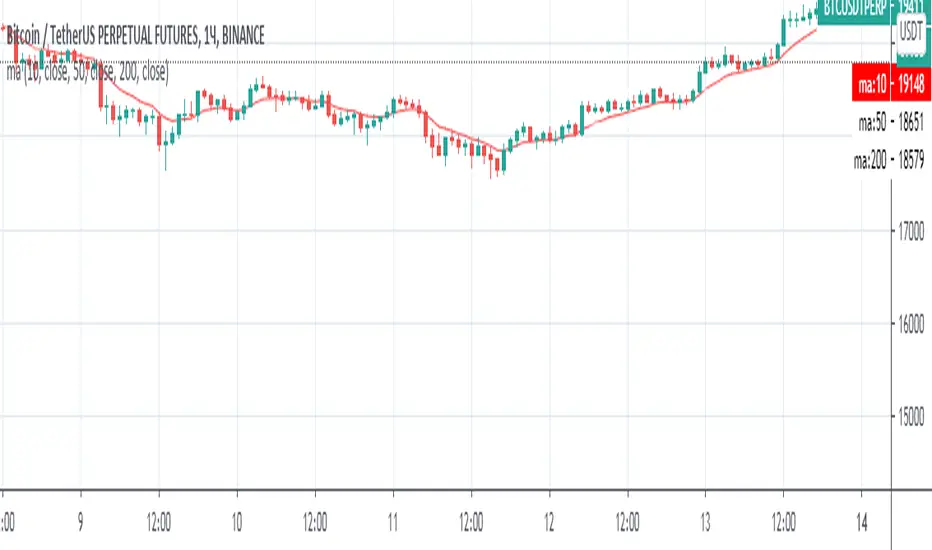
T3+SMA This source code is subject to the terms of the Mozilla Public License 2.0 at mozilla.org
© 03.freeman
This strategy is based only on T3 moving average, but uses sma 200 as filter for enter long or short.
The default settings considers a daily timeframe.
The strategy is very simple: long if T3 increase, short if T3 decrease.
Note that if you set volume factor to 0 you will have an exponential moving average, while if you set to 1 you'll get a DEMA.