Igor Sessions Average Candle RangeCalculated Average Candle Range for Igor Sessions. Resets average at these time UTC: 00:00, 06:00, 12:00, 20:00.
חפש סקריפטים עבור "session"

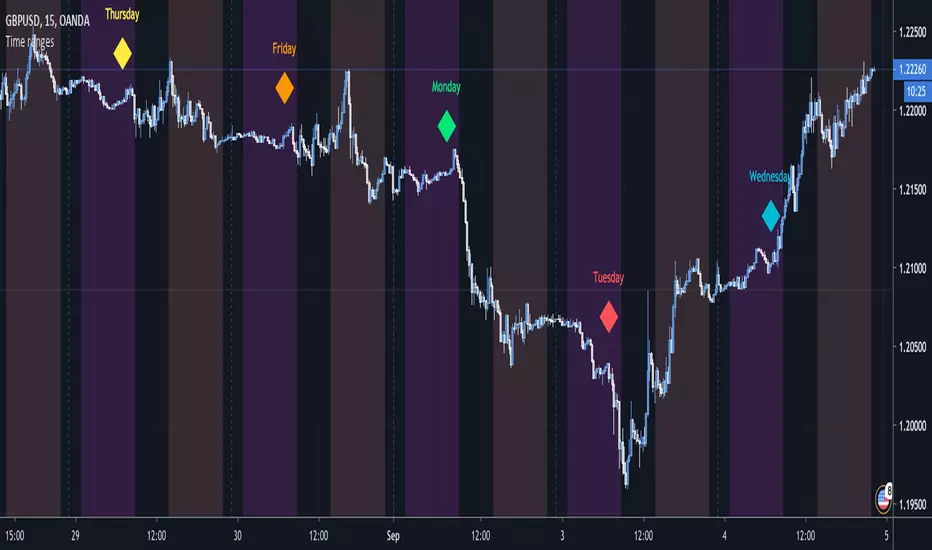
Time rangesThis script visualizes the different time sessions during the day.
The time ranges are set to the default Frankfurt, London, NY, Sydney and Tokyo, but can be
freely modified and turned off (I personally use to display only Tokyo and NY).
If you are a day trader, e.g. you trade with the Market Makers, this tool is a "must have".
It also displays the day of the week, which can be set off as well.
vitelot/yanez/Vts Sept 2019
PS I chose this script to belong to the "volatility" category since it can be used to highlight the Asian session,
and there was no suitable category available.

Intraday Context Authority (Liquidity & Time Filter)📌 Intraday Context Authority – Liquidity & Time Filter
Most intraday losses do not come from bad indicators —
they come from bad context.
This indicator is a Tier-1 context engine designed to sit above your existing indicators and help answer one critical question:
Is this a good place and time to trust intraday signals?
🔍 What this indicator does
This tool does NOT generate buy or sell signals.
Instead, it evaluates:
Liquidity structure (range interaction, stop-hunts)
Time structure (session phase, compression duration)
And outputs one of three context states:
ALLOW – Normal trading conditions
RESTRICT – Elevated risk, caution advised
HIGH RISK – Avoid trusting signals
🧠 Why use it
Intraday markets are driven by:
Liquidity collection before direction
Time-dependent behavior
False breakouts late in sessions
This indicator helps:
Avoid chasing late moves
Identify stop-hunt environments
Filter false breakouts
Reduce low-quality trades
⚙️ How to use it
Apply this indicator before momentum, trend, or volume tools
Use it as a filter, not a trigger
Best suited for intraday timeframes
🚫 What this indicator is NOT
Not a strategy
Not a signal generator
Not a replacement for risk management

UK Dual-Session HighlighterOverview
This indicator is a specialized volatility-window tool designed for traders operating in UK Time (Europe/London). It specifically isolates the two highest-probability trading windows for the Nasdaq (NQ) and other US/European indices, while intentionally leaving the "Lunch Lull" period unhighlighted to help traders avoid low-liquidity "chop."
The Dual-Session Strategy
The script highlights two distinct phases of the trading day:
London Morning (09:15 – 12:00): Captures the core European institutional flow and the establishment of the morning trend.
The US Active Window (13:30 – 17:15): Covers the critical 13:30 US Economic Data releases, the 14:30 New York Open, and the high-volume London-NY Overlap.
Key Features for 2026
Timezone Locked: Hard-coded to Europe/London. You do not need to adjust your chart settings; the indicator stays accurate regardless of your local time.
Automatic DST Handling: Fully compatible with 2026 Daylight Saving transitions (GMT/BST). It automatically adjusts when the UK clocks change in March and October.
The "Lunch Lull" Filter: By leaving the 12:00–13:30 window blank, the indicator provides a visual "stop" signal during the period when London traders are at lunch and US pre-market volume is typically at its lowest.
Fully Customizable: Toggle sessions on/off and adjust colors, transparency, and specific start/end times via the Inputs menu.

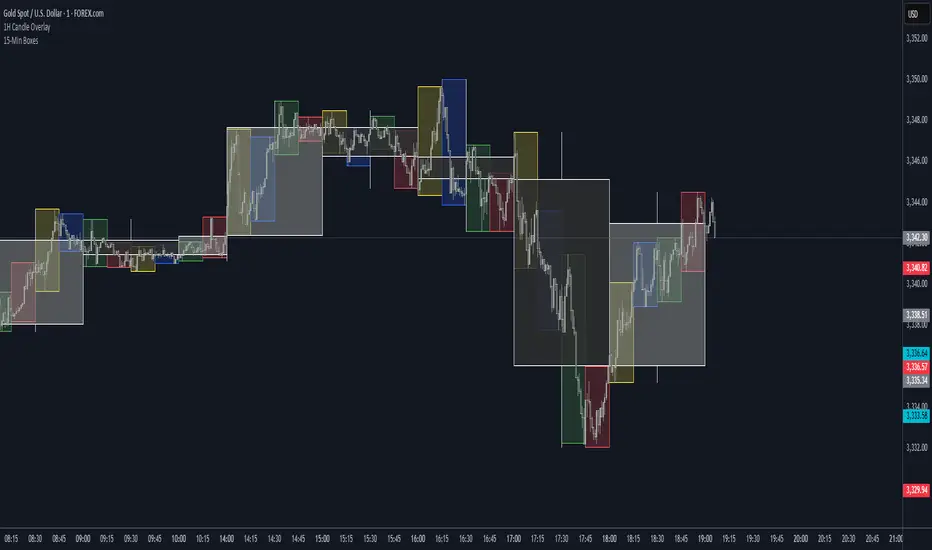
15 Zaman Kutusu ve 10 Zaman Acilisi15 Range Boxes & 10 Open Lines
This indicator is a comprehensive technical analysis tool designed to track specific time intervals (Sessions, Killzones) and critical opening prices on your chart.
Key Features:
15 Custom Range Boxes: Individual settings for color, time, and labels.
10 Open Price Lines: Track daily, weekly, or session opens.
Smart History Limit: "Son X Kutuyu Goster" feature preventing lag and flickering.
Pips Display: Automatically calculates and displays the range width in pips.
Minimalist Mode: Hides details when "Cok Kucuk" label size is selected.
Language: Fully Turkish menu settings.
Note: Inspired by Nephew Sam's concept, coded from scratch with performance optimizations and additional features.
DISCLAIMER This indicator is for educational purposes only. It does not constitute financial advice or trading signals. Use at your own risk.

Night Session Background V1.0This script can achieve the following functions:
Select a specified time period, such as the U.S. trading session, and mark this period on the background of the candlestick chart.
The purpose of doing this:
It allows you to more intuitively observe the candlestick patterns during specific time periods, such as the U.S. trading session.
OTT Volatility [RunRox]📊 OTT Volatility is an indicator developed by the RunRox team to pinpoint the most optimal time to trade across different markets.
OTT stands for Optimal Trade Time Volatility and is designed primarily for markets without a fixed trading session, such as cryptocurrencies that trade 24/7. At the same time, it works equally well on any other market.
🔶 The concept is straightforward. The indicator takes a specified number of historical periods (Samples) and statistically evaluates which hours of the day or which days show the highest volatility for the selected asset.
As a result, it highlights time windows with elevated volatility where traders can focus on searching for trade setups and building positions.
🔶 As the core volatility metric, the indicator uses ATR (Average True Range) to measure intraday volatility. Then it calculates the average ATR value over the last N Samples, creating a statistically stable estimate of typical volatility for the selected asset.
🔶 Statistically, during these highlighted periods the market shows higher-than-average volatility.
This means that in these time windows price is more likely to be subject to stronger moves and potential manipulation, making them attractive for active trade execution and position management.
⚠️ However, historical behavior does not guarantee future results.
These periods should be treated only as zones where volatility has a higher probability of being above normal, not as a promise of movement.
As shown in the screenshot above, the indicator also projects potential future volatility based on historical data. This helps you better plan your trading hours and align your activity with periods where volatility is statistically expected to be higher or lower.
🔶 Current Volatility – as shown in the screenshot above, you can also monitor the real-time volatility of the market without any statistical averaging.
On top of that, you can overlay the current volatility on top of the statistical volatility levels, which makes it easy to see whether the market is now trading in a high- or low-volatility regime relative to its usual behavior.
4 display modes – you can choose any visualization style that fits your trading workflow:
Absolute – displays the raw volatility values.
Relative – shows volatility relative to its typical levels.
Average Centered – centers volatility around its average value.
Trim Low Value – filters out low-volatility noise and highlights only more significant moves.
This indicator helps you define the most effective trading hours on any market by relying on historical volatility statistics.
Use it to quickly see when your market tends to be more active and to structure your trading sessions around those periods.
✅ We hope this tool becomes a useful part of your trading toolkit and helps you improve the quality of your decisions and timing.

Heiken Ashi Buy/Sell Signals for EUR/USD European SessionUSING Heiken Ashi DURING SESSIONS EUR & USD Buy/Sell Signals for EUR/USD DURING European Session

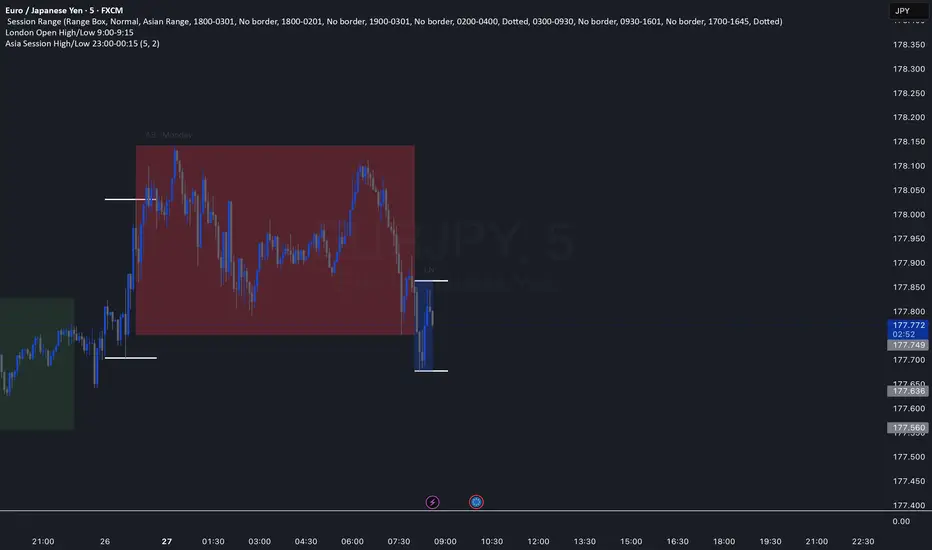
Asia Session High/Low 23:00-00:15This indicator shows highs and lows 1 hour before Asia session and the first 15min of Asia session.
NY Session Range Box with Labeled Time MarkersShows opening time ny session by timing with lines to inform traders to avoid 11:30am to 1:30pm for choppy sessions and mark early and power hour .

Forex Session HighlighterSet the session start and stop time for one single session. Allows a trader to easily see their preferred trading times at a glance. Especially helpful during bar replay.

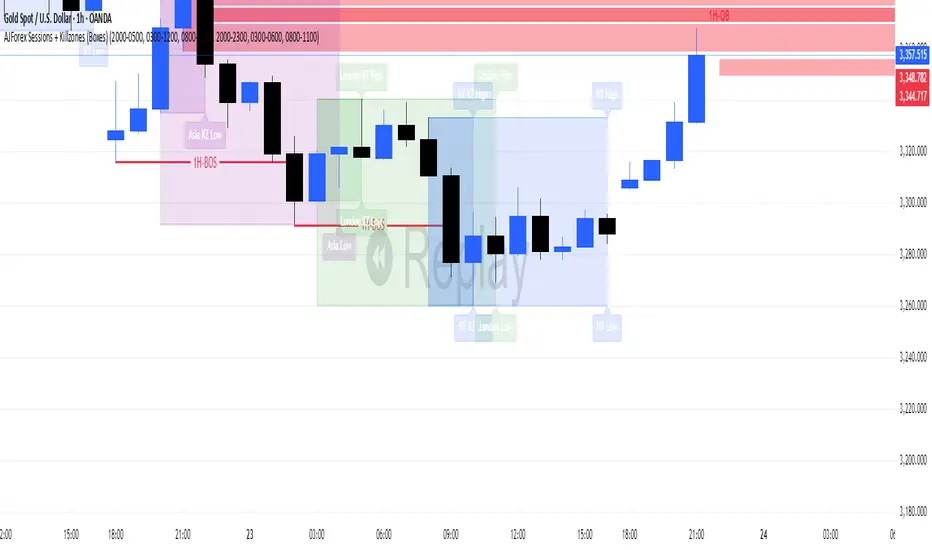
AJForex Sessions + Killzones (Boxes)use timeline UTC -4 AJForex Sessions + Killzones (Boxes)AJForex Sessions + Killzones (Boxes)AJForex Sessions + Killzones (Boxes)AJForex Sessions + Killzones (Boxes)AJForex Sessions + Killzones (Boxes)AJForex Sessions + Killzones (Boxes)AJForex Sessions + Killzones (Boxes)AJForex Sessions + Killzones (Boxes)AJForex Sessions + Killzones (Boxes)
Traderei Sessions v.1This Indicator shows the daily open, the last 24h daily highs & lows and the last highs & lows of the asia session.
you can increase the lenght of the line manually !
[COG] Advanced School Run StrategyAdvanced School Run Strategy (ASRS) – Explanation
Overview: The Advanced School Run Strategy (ASRS) is an intraday trading approach designed to identify breakout opportunities based on specific time and price patterns. This script applies the concepts of the Advanced School Run Strategy as outlined in Tom Hougaard's research, adapted to work seamlessly on TradingView charts. It leverages 5-minute candlestick data to set actionable breakout levels and provides traders with visual cues and alerts to make informed decisions.
Features:
Dynamic Breakout Levels: Automatically calculates high and low levels based on the market's behavior during the initial trading minutes.
Custom Visualization: Highlights breakout zones with customizable colors and transparency, providing clear visual feedback for bullish and bearish breakouts.
Configurable Alerts: Includes alert conditions for both bullish and bearish breakouts, ensuring traders never miss a trading opportunity.
Reset Logic: Resets breakout levels daily at the market open to ensure accurate signal generation for each session.
How It Works:
The script identifies key levels (high and low) after a configurable number of minutes from the market open (default: 25 minutes).
If the price breaks above the high level or below the low level, a corresponding breakout is detected.
The script draws breakout zones on the chart and triggers alerts based on the breakout direction.
All levels and signals reset at the start of each new trading session, maintaining relevance to current market conditions.
Customization Options:
Line and box colors for bullish and bearish breakouts.
Transparency levels for breakout visualizations.
Alert settings to receive notifications for detected breakouts.
Acknowledgment: This script is inspired by Tom Hougaard's Advanced School Run Strategy. The methodology has been translated into Pine Script for TradingView users, adhering to TradingView’s policies and community guidelines. This script does not redistribute proprietary content from the original research but implements the principles for educational and analytical purposes.

ICT Times [joshu]This TradingView indicator provides a comprehensive view of ICT killzones, Silver Bullet times, and ICT Macros, enhancing your trading experience.
In those time windows price either seeks liquidity or imbalances and you often find the most energetic price moves and turning points.
Features:
Automatic Adaptation: The ICT killzones intelligently adapt to the specific chart you are using. For Forex charts, it follows the ICT Forex times:
Asia: 2000-0000
London: 0200-0500
New York: 0700-1000
London Close: 1000-1200
For other charts, it uses the following session times:
Asia: 2000-0000
London: 0200-0500
New York AM: 0830-1100
New York PM: 1330-1600
Silver Bullet Times:
0300-0400
1000-1100
1400-1500
How to Use:
Simply apply the indicator to your chart, and the session boxes and Silver Bullet times will be plotted automatically.

3GBH - ICT NY SessionThis indicator is meant to help those using ICT's methodology.
This script simply highlights the NY session with green and red zones.
The red zone can help to indicate periods you do not want to trade, for example, NY lunch session.
Timings and colors and customizable with an easy user interface.

Daily Profile (Nephew_Sam_)From getting several requests to combine many of my indicators into one, this indicator plots everything you need for a Daily Profile.
1. Session = Current session + Daily dividers + day of the week
2. Open Lines = Plot the open of the day, midnight, week and month
3. Asian Range = Plots the asian range with an option for midpoint and extending lines
4. Previous OHLC = Plot the previous day/week/month OHLC
EVERY line/label/color/size/style is fully customizable in this indicator.
Important to adjust your timezone to get the correct data


Intraday MAs for Regular/Extended SessionThis indicator will allow you to show multiple EMA/SMAs for different timeframes on your chart. In addition, it can show you indicators calculated from regular and extended sessions, independently of the session type you have selected for your chart.

Custom Session TimeZonesThis indicators show background colours to identify world timezones
You can setup five custom zones.
You can also define time interval to show/hide
Can be used to know from what time of the world they are traders awake or
to search correlations between big moves and timezones hours.
Thanks to:
www.tradingcode.net
01/06/2018

Securities day session - Opening-Range- Jayy Opening Range (OR) for regular daytime session eg NYSE 0 930hrs to 1600 hrs.
This is not for Forex sessions which is addressed in a separate script.
This script fixes two issues:
syntax error when code compiles
flaky plotting of the opening range and targets that required page reloading
Additions:
In this code there are more more opening range time period choices at the bottom of the format dialogue box
Opening Range Targets:
Opening Range Targets as per Leaf_West
Targets are set at 127% , 162%, 200 %, 262 %, 362%, 423%, 685%, 1109% and 1794% and this can be traded intraday using methods described at charts-by-leaf.com I also have some Leaf West PDFs that describe how the targets are set and how they are traded. There are others that use opening range.
See the notes in the script for more detail.
My first opening range script originated from work done by Chris Moody. This script has changed significantly but there are small remnants of Chris Moody's script lurking within.
This script is available to all.
Cheers Jayy
