Worldwide Sessions and Open Range BreakoutThis script shows when the various normal market hours for each of the major worldwide markets (Asia, New York, and London). It also draws a line on the opening range for each of these market sessions. The opening range defaults to the first 15 minutes of the session, but this can be customized.
This script does automatically handle the session times regardless of your time zone or what time frame you are on. No need to set anything! This probably can't handle non-normal trading days, such as partial days.
This script is made for futures, but would likely work for other markets, like Forex.
חפש סקריפטים עבור "session"

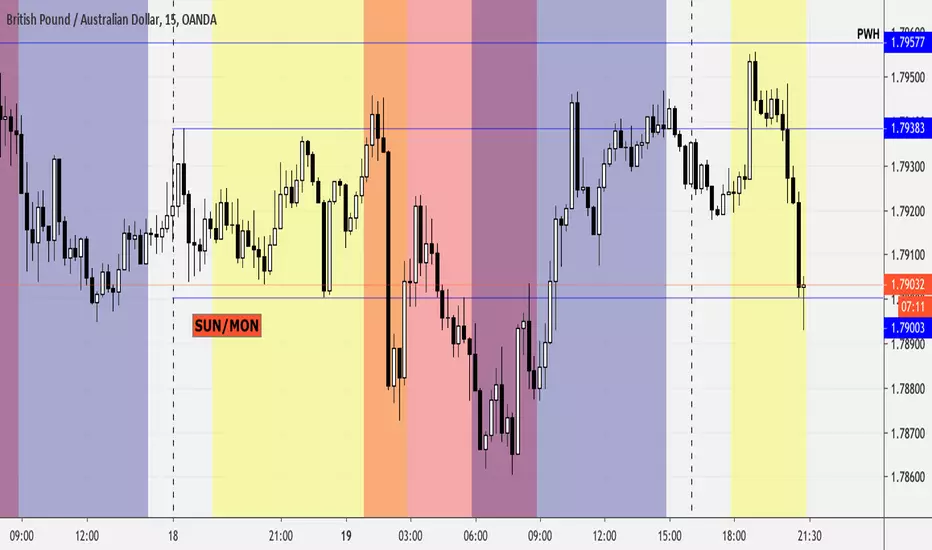
London/NY Sessions + SMC Levels📜 Indicator Description: London/NY Sessions + SMC Levels
Overview: This indicator highlights the key trading sessions — London, New York, NY Lunch, and Asian Range — providing structured visual guides based on Smart Money Concepts (SMC) and ICT principles.
It dynamically plots:
Session Backgrounds and Boxes for London, NY, Lunch, and Asian sessions
Reference Levels for the High, Low, and Close from today, previous day, or weekly data
Midnight Open line for ICT-style power of three setups
Real-time alerts for session starts, session closes, and important price level crossings
Features:
🕰️ Session Visualization:
Toggle London, NY, Lunch, and Asian session ranges individually, with customizable colors and transparent backgrounds.
🔔 Built-in Alerts:
Alerts for:
Price crossing the previous day's high/low
Price crossing the Midnight Open
Start and end of major sessions (London, NY, Lunch, Asian)
🟩 Reference Levels:
Plot selectable session reference levels:
Today’s intraday High/Low/Close
Previous Day’s High/Low/Close
This Week’s or Previous Week’s levels for broader context.
🌙 Midnight Open:
Track the Midnight New York Open as a reference point for daily bias shifts.
🎯 Customizable Settings:
Choose your session time zones (UTC, New York, London, etc.)
Customize all border colors, background colors, and session hours.
Use Cases:
Identify killzones and optimal trade entry windows for Smart Money Concepts (SMC) and ICT strategies.
Monitor liquidity pool sweeps and session transitions.
Confirm or refine your intraday or swing trading setups by referencing session highs/lows.
Recommended For:
ICT traders
Smart Money Concepts (SMC) practitioners
Forex, indices, crypto, and futures traders focusing on session-based volatility patterns
Anyone wanting a clean, professional session mapping tool
📈
Designed to help you trade with session precision and Smart Money accuracy.
Integrates seamlessly into any ICT, Wyckoff, or Liquidity-based trading approach.

NYSE Session for 24/7 marketsThis script is used for analyzing the correlation between 24/7 markets with regards to the price action during NYSE session. Defaults to showing daily session open/high/low but there is the option to show the weekly session data.
Forex Sessions (Asian, London, New York)This script lines up the different sessions for New York, Asian, and London. It also have overlap between the sessions and the colors have been adjusted to make it easier to read.
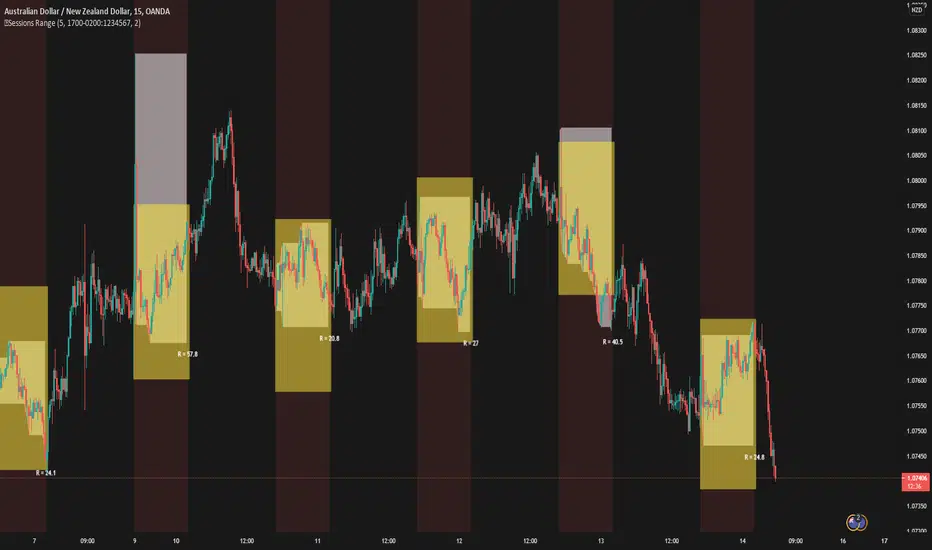
5 Sessions RangeThis script averages the range of the previous 5 sessions and displays it on the chart
The sessions are adjustable
Custom Colored Session (Pre, Open, Close, Post, Outside)Another script enabling coloring of sessions. Variables for all session timings and colors are exposed. Backgrounds and/or dividers can be enabled. If you only want dividers, just uncheck all of the background sections.
Note: Due to the way weekends are handled on some exchanges, displaying the divider on Friday is not possible.
Note: Displaying backgrounds or dividers in the future does not seem to be possible. I would gladly add this if I can figure it out.

Apex Edge - London Open Session# Apex Edge - London Open Session Trading System
## Overview
The London Open Session indicator captures institutional price action during the first hour of the London forex session (8:00-9:00 AM GMT) and identifies high-probability breakout and retest opportunities. This system tracks the session's high/low range and generates precise entry signals when price breaks or retests these key institutional levels.
## Core Strategy
**Session Tracking**: Automatically identifies and marks the London Open session boundaries, creating a trading zone from the first hour's price range.
**Dual Entry Logic**:
- **Breakout Entries**: Triggers when price closes beyond the session high/low and continues in that direction
- **Retest Entries**: Activates when price returns to test the broken level as new support/resistance
**Performance Analytics**: Built-in win rate tracking displays real-time performance statistics over user-defined lookback periods, enabling data-driven optimization for each currency pair.
## Key Features
### Automated Zone Detection
- Precise London session timing with timezone offset controls
- Visual session boundaries with customizable colours
- Automatic high/low range calculation and display
### Smart Entry System
- Breakout confirmation requiring candle close beyond zone
- Retest detection with configurable pip distance tolerance
- Separate risk/reward ratios for breakout vs retest entries
- Visual entry arrows with clear trade direction labels
### Performance HUD
- Real-time win rate calculation over customizable periods (7-365 days)
- Total trades tracking with win/loss breakdown
- Average risk-reward ratio display
- Color-coded performance metrics (green >70%, yellow >50%, red <50%)
### PineConnector Integration
- Direct MT4/MT5 execution via PineConnector alerts
- Proper forex pip calculations for all currency pairs
- Customizable risk percentage per trade
- Symbol override capability for broker compatibility
- Automatic SL/TP level calculation in pips
## Critical Usage Requirements
### Pair-Specific Optimization
Each currency pair requires individual optimization due to varying volatility characteristics, institutional participation levels, and typical price ranges during London hours. The performance HUD is essential for identifying optimal settings before live trading.
**Recommended Testing Process**:
1. Apply indicator to desired currency pair and timeframe
2. Experiment with session timing - while 8:00-9:00 AM GMT is standard, some pairs may show improved performance with alternative hourly windows (e.g., 7:00-8:00 AM or 9:00-10:00 AM)
3. Adjust Stop Loss distances, Risk/Reward ratios, and Retest distances
4. Monitor win rate over 30+ day periods using the performance HUD
5. Only proceed with live alerts once consistent 60%+ win rates are achieved
6. Create separate optimized chart setups for each profitable pair/timeframe combination
### Timeframe Specifications
This indicator is specifically designed and tested for:
- **1-minute charts**: Optimal for capturing immediate institutional reactions
- **5-minute charts**: Balanced approach between noise reduction and opportunity frequency
Higher timeframes generally produce inferior results due to increased noise and reduced institutional edge during the London session window.
## Settings Configuration
### Session Timing
- **London Open/Close Hours**: Adjust for your chart's timezone
- **Rectangle End Time**: Set to 4:30 PM to stop signals before NY session close
- **Timezone Offset**: Ensure accurate London session capture
### Entry Parameters
- **Retest Distance**: 3-8 pips depending on pair volatility
- **Stop Loss Pips**: Separate settings for breakouts (10-15 pips) and retests (8-12 pips)
- **Risk/Reward Ratios**: Independent ratios for different entry types
### PineConnector Setup
- **License ID**: Your PineConnector license key
- **Symbol Override**: MT4/MT5 symbol names if different from TradingView
- **Risk Percentage**: Position size as percentage of account balance
- **Prefix/Comment**: Organize trades in terminal
## Manual Trading Limitations
Without PineConnector automation, traders face significant practical challenges:
**Settings Management**: Each currency pair requires different optimized parameters. Switching between charts means manually adjusting multiple settings each time, creating potential for errors and missed opportunities.
**Timing Sensitivity**: London Open signals can occur rapidly during high-volatility periods. Manual execution may result in slippage or missed entries.
**Multi-Pair Monitoring**: Tracking 4-11 currency pairs simultaneously while manually adjusting settings for each switch becomes impractical for most traders.
**Parameter Consistency**: Risk of using suboptimal settings when quickly switching between pairs, potentially compromising the careful optimization work.
## Recommended Workflow
1. **Historical Testing**: Use win rate HUD to identify profitable pairs and optimal parameters
2. **Demo Automation**: Test PineConnector alerts on demo accounts with optimized settings
3. **Live Implementation**: Deploy alerts only on proven profitable pair/timeframe combinations
4. **Ongoing Monitoring**: Regular review of performance metrics to maintain edge
## Risk Disclaimer
This indicator provides analysis tools and automation capabilities but does not guarantee profitable trading outcomes. Past performance does not predict future results. Users should thoroughly backtest and demo trade before risking live capital. The London session strategy works best during specific market conditions and may underperform during low volatility or unusual market environments.
## Support Requirements
Successful implementation requires:
- Basic understanding of London session market dynamics
- PineConnector subscription for automation features
- Patience for proper optimization process
- Realistic expectations about win rates and drawdown periods
This system is designed for serious traders willing to invest time in proper optimization and risk management rather than plug-and-play solutions.

Ultra SessionsThe "Ultra Sessions" indicator is designed to enhance your trading strategy by clearly marking key market sessions and their associated "kill zones" directly on your chart. This powerful tool supports multiple time zones and provides customizable alerts for session opens, closes, and critical kill zones, ensuring you never miss important market movements.
Customizable Time Zones: Align the indicator with your local time by selecting from a wide range of global time zones.
Market Session Tracking: Visually track the New York, London, and Tokyo trading sessions with distinct color-coded markers.
Kill Zones: Highlight the high-volatility periods within each session to focus on key trading opportunities.
Alert System: Receive real-time alerts for session openings, closings, and kill zones, so you stay informed without constantly monitoring the chart.
Flexible Positioning: Choose the positioning of session markers to fit your chart layout, whether at the top or bottom.
Ideal for traders who want to optimize their entry and exit points by focusing on the most active and volatile times in the market, the indicator is a must-have for any serious trading setup.

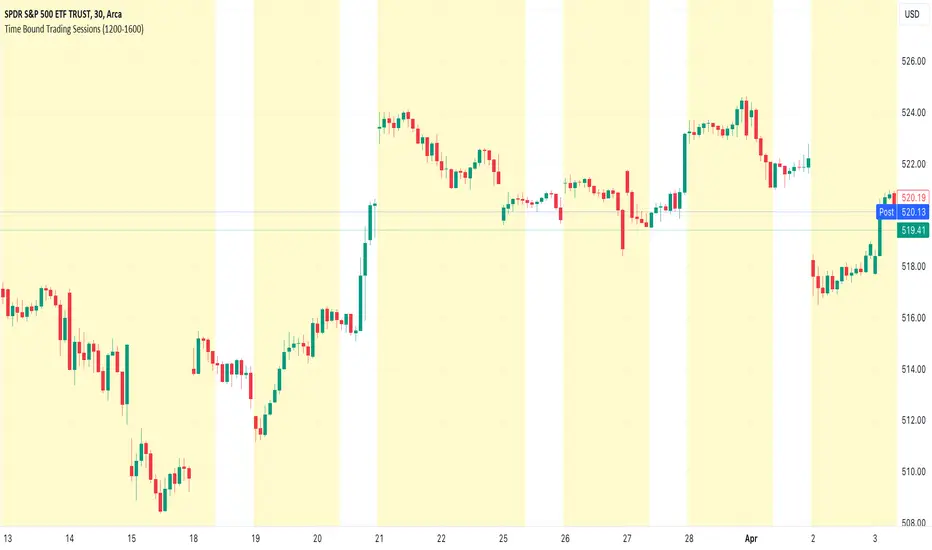
Time Bound Trading SessionsTime Bound Trading Sessions allows to add time bound conditions to your trading sessions given a date range , a time range and/or days of the week .
This indicator can be very handy if you want to control your trading sessions along those three time boundaries, applying them together and/or separately.
Feel free to reuse this code in your own strategy, and leverage the inSession condition as needed.
Features
+ It allows for date range start and/or end to be set.
+ It allows for session time range to be set.
+ It allows for days of the week to be set.
+ It applies chart background color if we are not within the given time bound session parameters.
+ It includes turn on/off functionality.
Settings
Date Range
+ {Start} checkbox: turns on/off start date
+ {Start} date/time
+ {End} checkbox: turns on/off end date
+ {End} date/time
Time Range
+ {Session} checkbox: turns on/off session time range
+ {Session} time range
Days
+ {M} checkbox: turns on/off Mondays
+ {T} checkbox: turns on/off Tuesdays
+ {W} checkbox: turns on/off Wednesdays
+ {T} checkbox: turns on/off Thursdays
+ {F} checkbox: turns on/off Fridays
+ {S} checkbox: turns on/off Saturdays
+ {S} checkbox: turns on/off Sundays
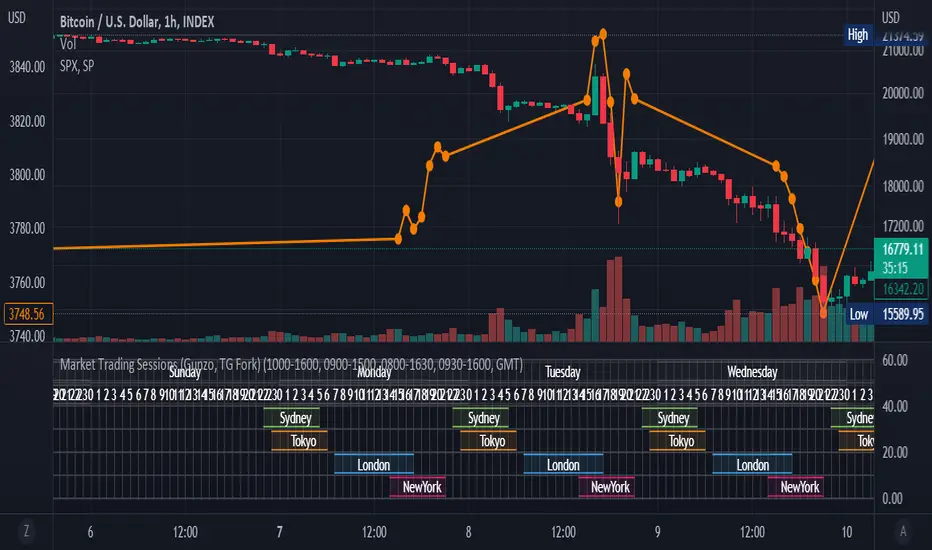
Market Trading Sessions (TG Fork)Visualize trading sessions opening hours of several international exchanges on a grid. Contrary to other indicators, this one automatically aligns the session with the current chart's timezone.
This is helpful for bar replay or manual backtesting, to spot patterns of correlations (this can also be used in conjunction with correlation indicators, see my other indicators).
Original indicator by Gunzo, if you like this indicator, please show the original author some love:
This indicator is also inspired by the following indicators:
ZenAndTheArtOfTrading with
UnknownUnicorn468659 with
This fork implements the following features:
Converted to PineScript v5.
Adapted default color palette to dark mode, as is the default in TradingView now.
Fix drawing issues, now the design shows as it was originally meant to be.
Fixed mistiming issue that made some sessions display with a delay compared to the real session, especially the first session was bar at the start of the session was not displayed.
Inputted the accurate timings for each session, instead of the default 0800-1600 in the original indicator.
Essentially, you can just add this indicator and it should work out of the box. If not, please let me know, and I'll try to fix it!
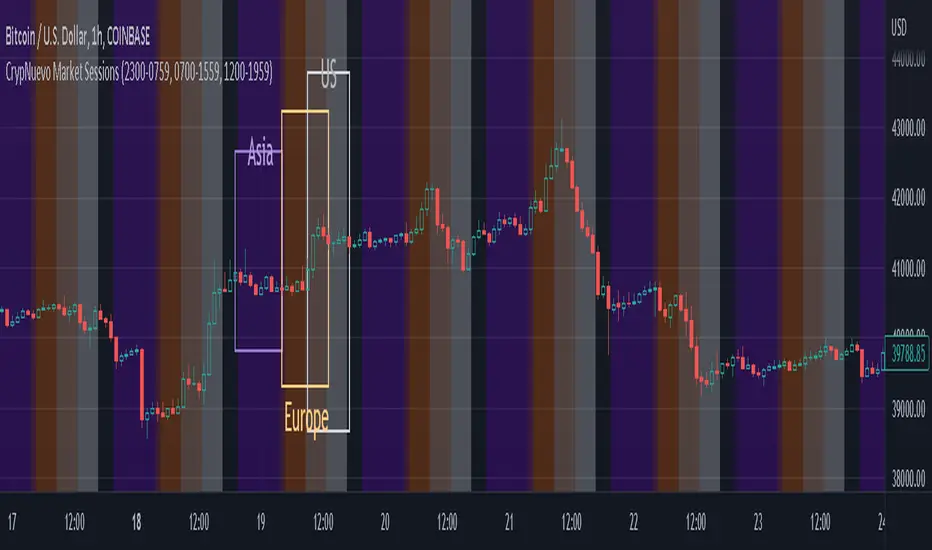
CrypNuevo Market SessionsExperimental script showing a different background color per market session. The session hours and colors can be customized. Note that the session hours can overlap.
Based on a thread by CrypNuevo on Twitter.
Futures Exchange Sessions 2.0Description
Successor to Futures Exchange Sessions indicator. Completely rebuilt code from the ground up. Every feature has been redesigned and refactored to be the most beneficial while allowing for complete configuration by the user.
This indicator displays Futures Sessions as live boxes that expand dynamically as price moves over the time interval. These boxes make liquidity levels extremely easy to spot and visualize. It helps the user identify market structure and develop their own bias of price action. Everything about the Session boxes can be configured. Box color, border color, border style, and border width are all individually controllable. Each Future Session can be turned on or off at any time. Also, each box has their own text label (Asian Session, London Session, New York Session) and this text can be moved around the box, change color, and change size.
Previous days highs and lows (major liquidity levels) are always important to the futures trader. This indicator now allows the user to individually display the three previous days highs and low levels as lines with optional label. Each line can be independently toggled on or off and like always, every conceivable customization option is available to the user. And the labels can be moved to the right (via the Input Settings) to allow unobstructed views of candles.
The midnight EST open and 8:30 AM EST open horizontal lines (developed by the Inner Circle Trader) are returning in this indicator. But the biggest improvement is that the lines stop at the current bar or the last bar of the trading day. Additionally, the time lines are displayed on previous days so the user can easily see how the candles reacted to these important times of the day.
The Session boxes and the horizontal time lines now can be set to only display a certain number of day back. If the user wants just to see Session boxes for the previous day only, they can do that. If the user wants to see the last 15 days of boxes or lines it is very easy to increase the days back in the settings. Currently, the max days back is 80 calendar days.
Additional Images
Easily visualize and understand price action across time
Everything is customizable so the user can easily match this indicator to their color preferences
Special Notes
To turn off box session text set opacity to 0%
Boxes and horizontal time lines only display when timeframe is <= 30 minute

Background to highlight cash/session range [Futures]A simple script which allows the user to highlight the background of a certain session. At the moment there is only one session available, I will work on multiple highlights for numerous sessions at a later date.

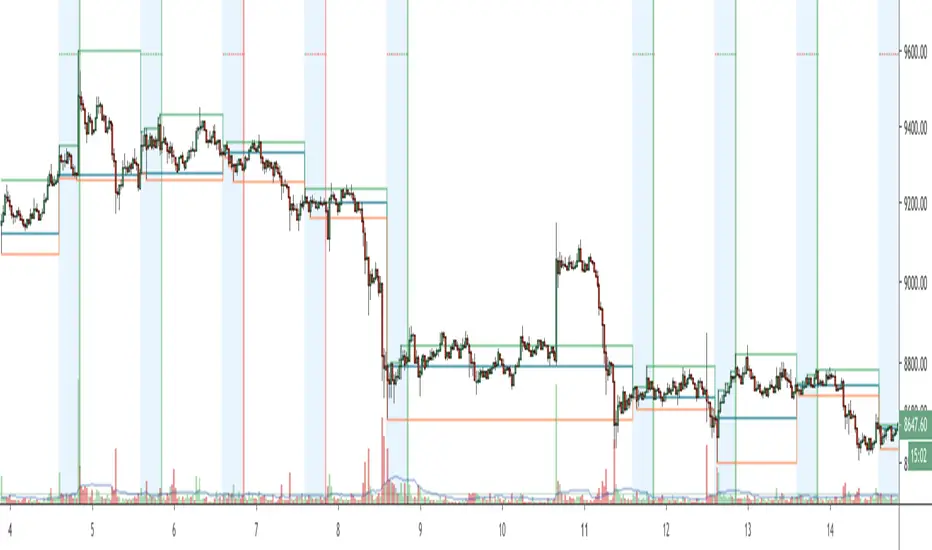
Session LinesSession Lines is an intraday indicator that marks global trading sessions and their key levels. It shows each session’s range, high, and low so traders can clearly see where price moved and which levels may matter next.
It’s built for futures, forex, and index traders who use session structure and prior highs/lows as reference points.
Draws a box around each session’s price range
Fully customizable session names, times, timezones, and colors
Supports up to three sessions (commonly Tokyo, London, and New York)
Session Information (Optional)
Session range displayed in ticks
Average price for the session
Session name label inside the box
Session Open & Close
Optional dashed lines marking session open and close
Useful for tracking acceptance and rejection during the session
Session High & Low Levels
Live High / Low Tracking
Tracks the session high and low as price develops
Lines update in real time during the session
Extended High / Low Lines
After a session ends, its high and low can be extended forward
Extension length is adjustable in days
Helps identify common reaction and liquidity levels
High / Low Labels
Optional labels for each session’s high and low
Can be shown live or only after the session finishes
Adjustable text size and horizontal offset
Intended Use
Marking Asia, London, and New York ranges
Watching reactions to prior session highs and lows
Using session ranges as context for breakouts or reversals
Keeping key intraday levels on the chart without manual drawing

G Trade SessionsWe built this indicator because we was tired of guessing when major markets open and close. It draws simple boxes around each trading session so you can instantly see where the action is.
What it does:
Shows you the four key sessions — Asia, Frankfurt, London, and New York — as transparent boxes right on your chart. Each box marks the high and low of that session, which is super useful for spotting support/resistance levels.
Why I like it:
No clutter — boxes are subtle and don't get in the way
Labels switch from black to white automatically depending on your chart theme (dark or light)
Sessions don't overlap, so the chart stays clean
You can turn off any session you don't care about
Hope you find it useful!

Simple Trading SessionsThis indicator highlights the major global trading sessions (Tokyo, London, and New York) directly on your chart with clean background shading.
Tokyo Session (default 00:00–09:00 exchange time)
London Session (default 07:00–16:00 exchange time)
New York Session (default 12:30–21:00 exchange time)
Each session is displayed as a different shaded block, making it easy to:
Spot when the market is most active.
Identify overlapping periods (e.g., London–New York overlap).
Backtest strategies that depend on session timing.
⚙️ How to Use
Add the indicator to any intraday chart.
Adjust session times in the settings panel to match your broker or preferred timezone.
Use the shading to guide your trading around regional liquidity zones.
✅ Notes
By default, session times follow the chart’s exchange timezone.
You can change the inputs to match your own session definitions.
Very lightweight and designed for traders who want a simple, uncluttered session map without extra calculations.

[TTM] ICT Sessions & Ranges🌟 Overview 🌟
The ICT Sessions & Ranges Indicator helps traders identify key intraday price levels by marking custom session highs/lows and opening ranges.
It helps traders spot potential liquidity grabs, reversals, and breakout zones by tracking price behavior around these key areas
🌟 Session Highs & Lows – Liquidity Zones 🌟
Session highs and lows often attract price due to stop orders resting above or below them. These levels are frequently targeted during high-volatility moves.
🔹 Asia Session
- Usually ranges in low volatility.
- Highs/lows often get swept during early London.
- Price may raid these levels, then reverse.
🔹 London Session
- First major volatility of the day.
- Highs/lows often tested or swept in New York.
- Commonly forms the day’s true high or low.
🌟 Opening Range Concepts 🌟
The Opening Range is the first 15, 30, or 60 minutes of a session (e.g., New York).
The high (ORH) and low (ORL) define the market’s initial balance and key reaction levels.
🔹 Breakout Trade
- Price breaks ORH/ORL with momentum.
- Signals directional intent.
- Traders enter on the breakout, with stops inside the range.
🔹 Liquidity Raid
- Price briefly breaks ORH/ORL to trigger stops.
- Reverses after the sweep.
- Look for structure shift and entry near FVG or OB.
🌟 Customizable Settings 🌟
The indicator includes 3 configurable ranges , each with:
Start & End Time – Set any custom time window.
Display Type – Choose Box (highlight range) or Lines (mark high/low).
Color Settings – Set custom colors for boxes and lines.
🌟 Default Settings 🌟
Range 1 : 19:00–00:00 (Asia Session)
Range 2 : 01:45–05:15 (London Session)
Range 3 : 09:30–10:00 (NY Opening Range – 30m)

Market Session Times by MadDogMoneyMarket Sessions is a simple indicator allowing you to quickly see the 3 Major Trading Session Open and Close times
Three major Sessions - Asia, UK & NY are included.
(The Australian & Asian markets are so close on time, they have been joined for brevity.)
The Open & Close times for each Session is displayed in the Settings in UTC and can be edited depending on the time of year or market you are following.
By setting the Session indicators partially transparent (as is by default), you can quickly see which Market Sessions, and for how long, they overlap.
Additionally, the Indicator can be hidden for different timeframes.
- 1 HR is the upper limit of visibility
- Visibility on the 1HR, 15min and 5min and below can be toggled on an off to fit your requirements.

[MiV] Trading SessionHello, everyone!
Today I want to present my new script, which I hope will help not only me!
I'm sure that many people, like me, went through such a stage as "building their strategy". This is when you sit and test on the history how you would enter or exit a trade.
Recently I was doing the same thing and realized that my "tests" involve night time, when in reality I would be asleep and not trading! So I decided to create an indicator that would display my "working hours" so that the backtest I conduct would be as realistic as possible.
Also this indicator is able to display sessions of major exchanges and forex working hours, so it will be useful not only for cryptocurrency lovers.
In addition, we don't always trade every day and, for example, I don't trade on Sunday. That's why we added a feature that "turns off" the day and does not highlight it in color if you're not planning to trade on that day.
And finally, I added a notification of the beginning and end of the trading session. A small thing, but it may also be a useful feature for those who like to sit at the chart!
I will be glad to receive any comments and suggestions!
-----
Всем привет!
Хочу сегодня представить свой новый скрипт, который, надеюсь, поможет не только мне!
Уверен, что многие, как и я, проходили такой этап как "постройка своей стратегии". Это когда ты сидишь и тестируешь на истории то как бы ты входил или выходил из сделки.
Вот недавно я ровно также занимался этим и осознал, что мои "тесты" затрагивают и ночное время, когда в реальности я бы спал и не торговал! Поэтому я решил создать индикатор, который будет отображать мои "рабочие часы", чтобы бектест, который я провожу, был максимально реалистичным.
Также данный индикатор умеет отображать сессии крупных бирж и время работы форекса, так что полезным он будет не только для любителей криптовалюты.
Кроме того, мы же не всегда торгуем каждый день и например я не торгую в воскресенье. Поэтому добавлен функционал, который "выключает" день и не подсвечивает его цветом, если ты в этот день не планируешь торговать.
Ну и в заключении, добавил уведомление о начале и завершении торговой сессии. Мелочь, а тоже может быть полезной фичей для тех кто любит засесть за графиком!
Буду рад любым замечаниям и предложениям!

Exchange sessionsThe Exchange sessions indicator allows you to show world trading sessions on the chart, taking into account working hours in the corresponding time zone .
>> For traders:
The settings set the working hours of the exchange, and the indicator itself automatically binds it to the time zone of the selected exchange location - this allows you not to get confused about the correctness of the entered time ranges for any type of chart - stock, futures, index, forex or crypto. By default, the valid working hours are set and no further configuration is required.
In addition, you can select those zones that you want to highlight (using the marker to the left of the session name), and you can also highlight the beginning of each trading session - the start marker.
>> For encoders:
In the code, you can see how to set the session time and bind its control to the time zone from the IANA time zone database.
Also, in the code you will find a way to align the description of input parameters using Unicode Spaces.
I hope that my script will benefit the community and provide a quality result in my work!
All profit!
=========================================================================================
Индикатор Exchange sessions позволяет показать на графике мировые торговые сесси с учётом рабочего времени в соответствующм часовом поясе .
>> Для трейдеров:
В настройках выставляется рабочее время биржи, а индикатор сам автоматически привязывает его к часовому поясу выбранной локации биржи - это позволяет не путаться в корректности введённых временных диапазонов при любом типе графика - stock, futures, index, forex или crypto. По умолчанию задано действующее рабочее время и дополнительная настройка не требуется.
Кроме этого - можно выбирать те зоны, которые нужно подсветить (с помощью маркера слева от названия сессии), а также можно выделить начало каждой торговой сессии - маркер start.
>> Для кодеров:
В коде Вы можете посмотреть как задавать время сессии и привязать его контроль к временной зоне из базы данных часовых поясов IANA.
Также, в коде Вы найдёте способ выравнивания описания входных параметров с помощью Unicode Spaces.
Я надеюсь, что мой скрипт принесёт пользу сообществу и предоставит качественный результат в своей работе!
Всем профита!

Hancock - RSI [Session]This is an improvement of my RSI Volume indicator.
I have made a session based RSI indicator which helps to aid the decision making upon session opens and gives a good indication of trend during. It also has various fixes for bugs found in the above indicator.
It has multiple settings to configure:
Use session: This toggles the RSI to be session based mode.
Session - Time: The session hours for the RSI .
Session - Days of Week: This is the days for the session based RSI to use.
Session - Mode: The RSI is reset when a new session starts. This mode adjusts how the initial value of the RSI is calculated:
OC: RSI uses the absolute open - close * volume value.
TR: RSI uses the true range * volume value.
VOL: RSI uses the volume value.
TF - Resolution: This is the lower time frame to be used in calculating the wick adjusted buy and sell volume used in the calculation of Volume weighted RSI . A lower time frame produces more accurate buy and sell volumes.
Use Volume: Enabling this produces a Volume weighted RSI . Disabled produces a normal RSI .
Use Wicks: Enabling this adjusts the calculation for buy and sell volume by taking wicks into account.
RSI - Length: This is the length to be used for the RSI . If session based this is the maximum value the RSI length can be - length can be shorter to not include previous session data.
RSI - Overbought: This is the "overbought" level for the RSI .
RSI - Oversold: This is the "oversold" level for the RSI .
RSI - Threshold: This is the threshold used to indicate trend change colours on the RSI .
Happy Trading
Hancock

Global Session AlertsSee liquidity shifts before they happen. Session & market structure alerts, plotted X minutes early.
Global Session Alerts: Multi-Time-zone (Configurable Lead)
Clean, intraday session and structure alerts plotted directly on your chart: X minutes before the event, fully configurable.
This indicator draws vertical dotted lines + labels for key market sessions, rhythm shifts, and close mechanics, helping you anticipate liquidity and volatility before it hits.
Sessions
Asian Open / Close
London Open / Close
NY Open / Close
Rhythm / Structure
10:00am Reversal / Trend
Wall Street Lunch
PM Session
Power Hour
Close Mechanics
Pre-Close
HOOD Effect
Closing Cross
Features
Configurable lead time (minutes before event)
Editable event times + label text
Vertical or horizontal labels
Adjustable label size & offset
Per-group color + opacity
IANA timezone support (DST-aware)
Optional TradingView alerts
Intraday-only, non-repainting
Automatic cleanup (count-based & time-based)
Designed for SPX / ES / NQ / 0DTE scalpers who care about when the market moves, not just where.

Session Dominance Profile [Pointalgo]Session Dominance Profile is a visual volume-distribution tool that shows which global trading session (Asia, London, or New York) dominates price activity across different price levels within a defined historical range.
The indicator builds a horizontal volume profile using candle close prices and volume, then classifies each price level by the session that contributed the highest volume.
How It Works :
The script analyzes a configurable lookback period
Price range is divided into multiple horizontal bins
Volume is accumulated per price level
Each bin is split into three session buckets:
Asia Session (Yellow)
London Session (Blue)
New York Session (Red)
The session with the highest volume at that price level determines the color
This results in a Session-based Dominance Profile, helping traders visually identify:
Where major sessions were most active
Session-specific acceptance or rejection zones
Potential intraday and swing reaction areas
Practical Use Cases :
Identify price levels dominated by a specific session
Understand session rotation and participation
Combine with:
Market structure
Support & resistance
VWAP or moving averages
Useful for intraday, scalping, and swing trading
Inputs Explained:
Lookback – Number of historical bars used to build the profile
Resolution – Number of price bins (higher = more detail)
Fixed Width (Bars) – Maximum horizontal width of the profile
Offset (Bars) – Distance of the profile from the current bar
Profile Direction – Left-to-Right or Right-to-Left rendering
Session Time Reference:
All sessions are calculated using UTC time.
Important Notes:
This indicator is visual and analytical only
It does not generate buy or sell signals
No repainting: the profile is calculated on the last bar only
Designed for educational and research purposes
Disclaimer:
This script does not provide financial advice.
Trading involves risk, and past volume behavior does not guarantee future results.
Always confirm signals using additional analysis and proper risk management.
