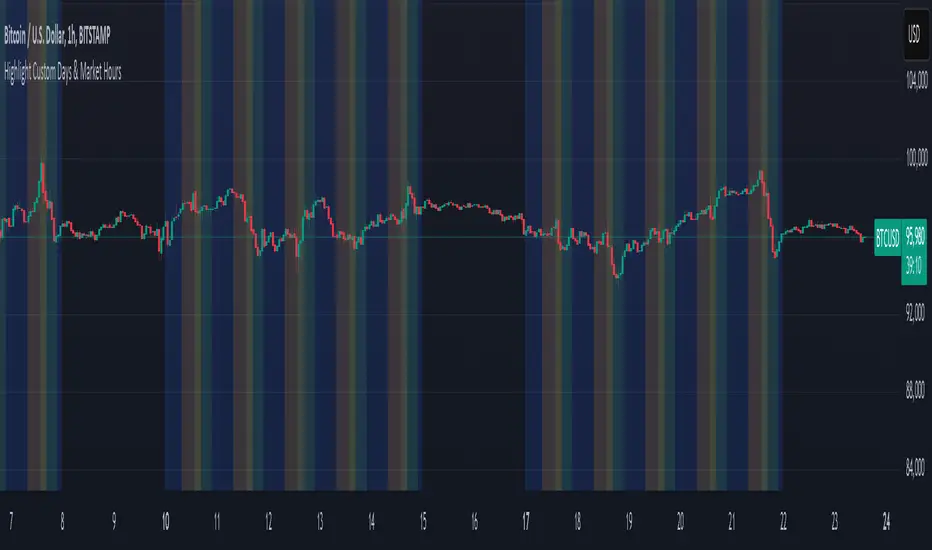
Bardhi's ICT Killzone & PivotsThis indicator is a complete ICT-style session and liquidity toolkit designed for precision trading. It automatically marks the most important trading windows (“Killzones”) and provides powerful tools for tracking price action around them.
Key Features:
Killzones: Automatically plots Asia, London, and New York (AM, Lunch, PM) sessions with customizable colors, transparency, and labels.
Session Highs, Lows & Midpoints: Dynamic lines for killzone highs/lows, optional midpoints, and alerts when levels are broken.
Range Statistics: Displays the real-time range of each session plus rolling averages in a customizable table.
Day / Week / Month Levels: Plots opens, highs, lows, and separators for higher-timeframe reference points with optional alerts.
Custom Opening Prices: Define up to 8 custom open lines (e.g., True Day Open, 06:00, 10:00) with cutoff times.
Vertical Timestamp Lines: Highlight important intraday times such as news events or personal strategy triggers.
Day-of-Week Labels: Clean labels for each day, with the option to hide weekends.
Full Customization: Adjustable label sizes, colors, line styles, transparency, and drawing limits.
Why Use It?
This tool combines killzone sessions, pivots, higher-timeframe opens/highs/lows, and range statistics into one clean, automated package. It saves time drawing manually, keeps charts organized, and helps traders apply ICT concepts consistently.
חפש סקריפטים עבור "sessions"
Krish.Tradess - FX market masterit will help you to identify market sessions and identify overlapping sessions in market. You can mark your trading
Advanced Volume Profile Pro Delta + POC + VAH/VAL# Advanced Volume Profile Pro - Delta + POC + VAH/VAL Analysis System
## WHAT THIS SCRIPT DOES
This script creates a comprehensive volume profile analysis system that combines traditional volume-at-price distribution with delta volume calculations, Point of Control (POC) identification, and Value Area (VAH/VAL) analysis. Unlike standard volume indicators that show only total volume over time, this script analyzes volume distribution across price levels and estimates buying vs selling pressure using multiple calculation methods to provide deeper market structure insights.
## WHY THIS COMBINATION IS ORIGINAL AND USEFUL
**The Problem Solved:** Traditional volume indicators show when volume occurs but not where price finds acceptance or rejection. Standalone volume profiles lack directional bias information, while basic delta calculations don't provide structural context. Traders need to understand both volume distribution AND directional sentiment at key price levels.
**The Solution:** This script implements an integrated approach that:
- Maps volume distribution across price levels using configurable row density
- Estimates delta (buying vs selling pressure) using three different methodologies
- Identifies Point of Control (highest volume price level) for key support/resistance
- Calculates Value Area boundaries where 70% of volume traded
- Provides real-time alerts for key level interactions and volume imbalances
**Unique Features:**
1. **Developing POC Visualization**: Real-time tracking of Point of Control migration throughout the session via blue dotted trail, revealing institutional accumulation/distribution patterns before they complete
2. **Multi-Method Delta Calculation**: Price Action-based, Bid/Ask estimation, and Cumulative methods for different market conditions
3. **Adaptive Timeframe System**: Auto-adjusts calculation parameters based on chart timeframe for optimal performance
4. **Flexible Profile Types**: N Bars Back (precise control), Days Back (calendar-based), and Session-based analysis modes
5. **Advanced Imbalance Detection**: Identifies and highlights significant buying/selling imbalances with configurable thresholds
6. **Comprehensive Alert System**: Monitors POC touches, Value Area entry/exit, and major volume imbalances
## HOW THE SCRIPT WORKS TECHNICALLY
### Core Volume Profile Methodology:
**1. Price Level Distribution:**
- Divides price range into user-defined rows (10-50 configurable)
- Calculates row height: `(Highest Price - Lowest Price) / Number of Rows`
- Distributes each bar's volume across price levels it touched proportionally
**2. Delta Volume Calculation Methods:**
**Price Action Method:**
```
Price Range = High - Low
Buy Pressure = (Close - Low) / Price Range
Sell Pressure = (High - Close) / Price Range
Buy Volume = Total Volume × Buy Pressure
Sell Volume = Total Volume × Sell Pressure
Delta = Buy Volume - Sell Volume
```
**Bid/Ask Estimation Method:**
```
Average Price = (High + Low + Close) / 3
Buy Volume = Close > Average ? Volume × 0.6 : Volume × 0.4
Sell Volume = Total Volume - Buy Volume
```
**Cumulative Method:**
```
Buy Volume = Close > Open ? Volume : Volume × 0.3
Sell Volume = Close ≤ Open ? Volume : Volume × 0.3
```
**3. Point of Control (POC) Identification:**
- Scans all price levels to find maximum volume concentration
- POC represents the price level with highest trading activity
- Acts as significant support/resistance level
- **Developing POC Feature**: Tracks POC evolution in real-time via blue dotted trail, showing how institutional interest migrates throughout the session. Upward POC migration indicates accumulation patterns, downward migration suggests distribution, providing early trend signals before price confirmation.
**4. Value Area Calculation:**
- Starts from POC and expands up/down to encompass 70% of total volume
- VAH (Value Area High): Upper boundary of value area
- VAL (Value Area Low): Lower boundary of value area
- Expansion algorithm prioritizes direction with higher volume
**5. Adaptive Range Selection:**
Based on profile type and timeframe optimization:
- **N Bars Back**: Fixed lookback period with performance optimization (20-500 bars)
- **Days Back**: Calendar-based analysis with automatic timeframe adjustment (1-365 days)
- **Session**: Current trading session or custom session times
### Performance Optimization Features:
- **Sampling Algorithm**: Reduces calculation load on large datasets while maintaining accuracy
- **Memory Management**: Clears previous drawings to prevent performance degradation
- **Safety Constraints**: Prevents excessive memory usage with configurable limits
## HOW TO USE THIS SCRIPT
### Initial Setup:
1. **Profile Configuration**: Select profile type based on trading style:
- N Bars Back: Precise control over data range
- Days Back: Intuitive calendar-based analysis
- Session: Real-time session development
2. **Row Density**: Set number of rows (30 default) - more rows = higher resolution, slower performance
3. **Delta Method**: Choose calculation method based on market type:
- Price Action: Best for trending markets
- Bid/Ask Estimate: Good for ranging markets
- Cumulative: Smoothed approach for volatile markets
4. **Visual Settings**: Configure colors, position (left/right), and display options
### Reading the Profile:
**Volume Bars:**
- **Length**: Represents relative volume at that price level
- **Color**: Green = net buying pressure, Red = net selling pressure
- **Intensity**: Darker colors indicate volume imbalances above threshold
**Key Levels:**
- **POC (Blue Line)**: Highest volume price - major support/resistance
- **VAH (Purple Dashed)**: Value Area High - upper boundary of fair value
- **VAL (Orange Dashed)**: Value Area Low - lower boundary of fair value
- **Value Area Fill**: Shaded region showing main trading range
**Developing POC Trail:**
- **Blue Dotted Lines**: Show real-time POC evolution throughout the session
- **Migration Patterns**: Upward trail indicates bullish accumulation, downward trail suggests bearish distribution
- **Early Signals**: POC movement often precedes price movement, providing advance warning of institutional activity
- **Institutional Footprints**: Reveals where smart money concentrated volume before final POC establishment
### Trading Applications:
**Support/Resistance Analysis:**
- POC acts as magnetic price level - expect reactions
- VAH/VAL provide intermediate support/resistance levels
- Profile edges show areas of low volume acceptance
**Developing POC Analysis:**
- **Upward Migration**: POC moving higher = institutional accumulation, bullish bias
- **Downward Migration**: POC moving lower = institutional distribution, bearish bias
- **Stable POC**: Tight clustering = balanced market, range-bound conditions
- **Early Trend Detection**: POC direction change often precedes price breakouts
**Entry Strategies:**
- Buy at VAL with POC as target (in uptrends)
- Sell at VAH with POC as target (in downtrends)
- Breakout plays above/below profile extremes
**Volume Imbalance Trading:**
- Strong buying imbalance (>60% threshold) suggests continued upward pressure
- Strong selling imbalance suggests continued downward pressure
- Imbalances near key levels provide high-probability setups
**Multi-Timeframe Context:**
- Use higher timeframe profiles for major levels
- Lower timeframe profiles for precise entries
- Session profiles for intraday trading structure
## SCRIPT SETTINGS EXPLANATION
### Volume Profile Settings:
- **Profile Type**: Determines data range for calculation
- N Bars Back: Exact number of bars (20-500 range)
- Days Back: Calendar days with timeframe adaptation (1-365 days)
- Session: Trading session-based (intraday focus)
- **Number of Rows**: Profile resolution (10-50 range)
- **Profile Width**: Visual width as chart percentage (10-50%)
- **Value Area %**: Volume percentage for VA calculation (50-90%, 70% standard)
- **Auto-Adjust**: Automatically optimizes for different timeframes
### Delta Volume Settings:
- **Show Delta Volume**: Enable/disable delta calculations
- **Delta Calculation Method**: Choose methodology based on market conditions
- **Highlight Imbalances**: Visual emphasis for significant volume imbalances
- **Imbalance Threshold**: Percentage for imbalance detection (50-90%)
### Session Settings:
- **Session Type**: Daily, Weekly, Monthly, or Custom periods
- **Custom Session Time**: Define specific trading hours
- **Previous Sessions**: Number of historical sessions to display
### Days Back Settings:
- **Lookback Days**: Number of calendar days to analyze (1-365)
- **Automatic Calculation**: Script automatically converts days to bars based on timeframe:
- Intraday: Accounts for 6.5 trading hours per day
- Daily: 1 bar per day
- Weekly/Monthly: Proportional adjustment
### N Bars Back Settings:
- **Lookback Bars**: Exact number of bars to analyze (20-500)
- **Precise Control**: Best for systematic analysis and backtesting
### Visual Customization:
- **Colors**: Bullish (green), Bearish (red), and level colors
- **Profile Position**: Left or Right side of chart
- **Profile Offset**: Distance from current price action
- **Labels**: Show/hide level labels and values
- **Smooth Profile Bars**: Enhanced visual appearance
### Alert Configuration:
- **POC Touch**: Alerts when price interacts with Point of Control
- **VA Entry/Exit**: Alerts for Value Area boundary interactions
- **Major Imbalance**: Alerts for significant volume imbalances
## VISUAL FEATURES
### Profile Display:
- **Horizontal Bars**: Volume distribution across price levels
- **Color Coding**: Delta-based coloring for directional bias
- **Smooth Rendering**: Optional smoothing for cleaner appearance
- **Transparency**: Configurable opacity for chart readability
### Level Lines:
- **POC**: Solid blue line with optional label
- **VAH/VAL**: Dashed colored lines with value displays
- **Extension**: Lines extend across relevant time periods
- **Value Area Fill**: Optional shaded region between VAH/VAL
### Information Table:
- **Current Values**: Real-time POC, VAH, VAL prices
- **VA Range**: Value Area width calculation
- **Positioning**: Multiple table positions available
- **Text Sizing**: Adjustable for different screen sizes
## IMPORTANT USAGE NOTES
**Realistic Expectations:**
- Volume profile analysis provides structural context, not trading signals
- Delta calculations are estimations based on price action, not actual order flow
- Past volume distribution does not guarantee future price behavior
- Combine with other analysis methods for comprehensive market view
**Best Practices:**
- Use appropriate profile types for your trading style:
- Day Trading: Session or Days Back (1-5 days)
- Swing Trading: Days Back (10-30 days) or N Bars Back
- Position Trading: Days Back (60-180 days)
- Consider market context (trending vs ranging conditions)
- Verify key levels with additional technical analysis
- Monitor profile development for changing market structure
**Performance Considerations:**
- Higher row counts increase calculation complexity
- Large lookback periods may affect chart performance
- Auto-adjust feature optimizes for most use cases
- Consider using session profiles for intraday efficiency
**Limitations:**
- Delta calculations are estimations, not actual transaction data
- Profile accuracy depends on available price/volume history
- Effectiveness varies across different instruments and market conditions
- Requires understanding of volume profile concepts for optimal use
**Data Requirements:**
- Requires volume data for accurate calculations
- Works best on liquid instruments with consistent volume
- May be less effective on very low volume or exotic instruments
This script serves as a comprehensive volume analysis tool for traders who need detailed market structure information with integrated directional bias analysis and real-time POC development tracking for informed trading decisions.
Session Shading (Asia, London, NY)This indicator highlights the three major trading sessions — Asia, London, and New York — on your chart in any time zone. Each session is shaded a different color, with optional labels marking when each begins. It’s designed to help traders quickly see when global market centers are active, identify overlaps between sessions, and align entries or exits with periods of higher liquidity and volatility.
Session Shading (Asia, London, NY) — ESTThis indicator highlights the three major trading sessions — Asia, London, and New York — on your chart in Eastern Time. Each session is shaded a different color, with optional labels marking when each begins. It’s designed to help traders quickly see when global market centers are active, identify overlaps between sessions, and align entries or exits with periods of higher liquidity and volatility.
Session Shading (Asia, London, NY) — PSTThis indicator highlights the three major trading sessions — Asia, London, and New York — on your chart in Pacific Time. Each session is shaded a different color, with optional labels marking when each begins. It’s designed to help traders quickly see when global market centers are active, identify overlaps between sessions, and align entries or exits with periods of higher liquidity and volatility.
Period Highlighter ProPeriod Highlighter Pro is a versatile Pine Script indicator designed to visually highlight specific time periods on your TradingView charts, making it easier to analyze seasonal patterns, trading sessions, or specific weekdays. With customizable settings for months, weekdays, or intraday time ranges, this tool adapts to your trading strategy, allowing you to focus on key periods with precision.
Features
Flexible Highlight Modes: Choose from three modes to highlight:
Month Range: Highlight specific months or a range (e.g., March to June) for seasonal analysis.
Weekday Range: Highlight specific weekdays (e.g., Mondays or Monday to Wednesday) for weekly pattern analysis.
Time Range: Highlight daily time windows (e.g., 15:30–22:00) for intraday session analysis, restricted to weekdays.
Customizable Timezone: Set any IANA timezone (e.g., America/New_York, Europe/London) or UTC offset to align highlights with your preferred market hours.
Historical Range Control: Define how far back to apply highlights with options for years (Month Range), weeks (Weekday Range), or days (Time Range).
Visual Customization: Choose your highlight color to match your chart style.
User-Friendly Inputs: Intuitive dropdowns and tooltips guide you through configuring each mode, ensuring only relevant settings are adjusted.
How It Works
Select a highlight mode and configure the corresponding settings:
Month Range: Pick a start month and an optional end month (or "Disabled" for a single month) and set the number of years back.
Weekday Range: Choose a start weekday and an optional end weekday (or "Disabled" for a single day) and set the number of weeks back.
Time Range: Specify a start and end time (24-hour format) and the number of weekdays back. The indicator then applies a semi-transparent background color to chart bars that meet your criteria, making it easy to spot relevant periods.
Use Cases
Seasonal Traders: Highlight specific months to analyze recurring market patterns.
Day Traders: Focus on active trading sessions (e.g., New York open) with precise time range highlighting.
Weekly Pattern Analysts: Isolate specific weekdays to study price behavior.
Global Traders: Adjust for any timezone to align with your market of interest.
Why Use Period Highlighter Pro?
This indicator simplifies time-based analysis by providing a clear visual overlay for your chosen periods. Whether you're studying historical trends or focusing on specific trading hours, Period Highlighter Pro offers the flexibility and precision to enhance your chart analysis.
Licensed under the Mozilla Public License 2.0.
Ultimate Global Trading Hours📊 Global Markets Pro - Summary
What it does:
Shows real-time trading hours for 11 major stock markets worldwide
Displays countdown timers for when each market opens/closes
Includes Forex sessions and US extended hours (pre-market/after-hours)
Features advanced market sentiment analysis with Fear/Greed indicators
Key Features:
✅ Chronological market order (Sydney → Tokyo → London → NYSE, etc.)
✅ Customisable times for each market in HH:MM format
✅ Multi-factor sentiment (VIX, Bonds vs Stocks, Weekly trends, Volume)
✅ Clean interface with emoji indicators and colour coding
✅ Your timezone display with GMT+/- options
Perfect for:
Day traders tracking global market sessions
Swing traders gauging market sentiment
Anyone wanting to know when major markets are active
Result: One comprehensive dashboard showing when to trade and market mood across all time zones!
Time Range Marker By BCB ElevateThe Time Range Marker is a simple yet powerful visual tool for traders who want to focus on specific time intervals within the trading day. This indicator highlights a custom time range on your chart using a background color, helping you visually isolate key trading sessions or event windows such as:
Market open/close hours
News release periods
High-volatility trading zones
Personal strategy testing windows
⚙️ Key Features:
Customizable start and end time (hour & minute)
Works across all intraday timeframes
Adjustable highlight color to match your chart theme
Built using Pine Script v5 for speed and flexibility
🔧 Settings:
Start Hour / Minute – Set the beginning of the time range (in 24-hour format)
End Hour / Minute – Define when the range ends
Highlight Color – Choose the background color for better visibility
🕒 Timezone Note:
The indicator uses UTC time by default to ensure accuracy across markets. If your broker uses a different timezone (like EST, IST, etc.), the script can be adjusted to reflect your local market hours.
✅ How to Use the Time Range Marker Indicator
This indicator is used to visually highlight a specific time window each trading day, such as:
Market open or close sessions (e.g., NYSE, London, Tokyo)
High-impact news release periods
Custom time slots for strategy testing or scalping
🛠️ Installation Steps
Open TradingView and go to any chart.
Click on Pine Editor at the bottom of the screen.
Copy and paste the full Pine Script (shared above) into the editor.
Click the “Add to Chart” ▶️ button.
The indicator will appear on the chart with a highlighted background during the time range you set.
⚙️ How to Customize the Time Range
After adding the indicator:
Click the gear icon ⚙️ next to the indicator’s name on the chart.
Adjust the following settings:
Start Hour / Start Minute: The beginning of your time range (in 24-hour format).
End Hour / End Minute: When the highlight should stop.
Highlight Color: Pick a color and transparency for visual clarity.
Click OK to apply changes.
🕒 Timezone Consideration
By default, the indicator uses UTC (Coordinated Universal Time).
To match your broker’s timezone (e.g., EST, IST, etc.), you'll need to adjust the script by changing:
sessStart = timestamp("Etc/UTC", ...)
sessEnd = timestamp("Etc/UTC", ...)
to your correct timezone, like "Asia/Kolkata" for IST or "America/New_York" for EST.
Let me know your broker or local timezone, and I’ll update it for you.
📈 Tips for Traders
Combine this with volume, price action, or breakout indicators to focus your strategy on high-probability time windows.
Use multiple versions of this script if you want to highlight more than one time range in a day.
Time Frame Color ClassifierTime Frame Colour Classifier
A professional Pine Script indicator that provides instant visual identification of trading sessions through intelligent colour-coded backgrounds.
Key Features
📅 Daily Session Colours
- Monday: Green | Tuesday: Blue | Wednesday: Yellow | Thursday: Red | Friday: Purple
📊 Weekly Classification
- Week 1-5 : Colour-coded by week of the month using the same colour scheme
## How It Works
Intraday Charts (1min-4H) : Shows daily colours - every candle on Monday displays green background, Tuesday shows blue, etc.
Daily/Weekly Charts : Switches to weekly colours - all days in Week 1 show green, Week 2 shows blue, etc.
Professional Applications
✅ Multi-Timeframe Analysis : Seamlessly switch between timeframes whilst maintaining visual context
✅ Session Recognition : Instantly identify which trading day you're analysing
✅ Pattern Analysis : Spot recurring patterns on specific days of the week
✅ Strategy Development : Incorporate temporal factors into trading strategies
✅ Performance Attribution : Correlate results with specific trading sessions
Customisation Options
- Toggle daily/weekly colours on/off
- Fully customisable colour schemes
- Adjustable background transparency
- Optional day labels
Technical Details
- Pine Script v5for optimal performance
- Automatic timeframe detection - no manual configuration required
- Minimal resource usage - won't slow down your charts
- Works on all chart types and timeframes
Perfect For
- Day traders switching between multiple timeframes
- Swing traders analysing weekly patterns
- Algorithmic strategy development
- Multi-timeframe market analysis
- Trading education and research
---
Developed by @wyckoffnawaf
Transform your chart analysis with visual timeframe clarity
Navy Seal Trading - EdgarTrader📌 Navy Seal Trading – Asia, London, and NY Sessions
This indicator clearly displays the ranges of the Asia, London, and New York sessions, featuring:
✅ Full range visualization for each session
✅ Asia session high, low, and midline, with extended projection lines for precise reaction analysis
✅ Clean, minimalistic, and professional colors to keep your chart focused
🔷 Designed for the Navy Seal Trading community, focused on precision, discipline, and professional execution in the markets.
Use it to:
✔️ Mark liquidity zones
✔️ Identify Asia manipulation ranges
✔️ Prepare executions in London and NY with clear context
💡 Remember: Clarity in your zones gives you the confidence and discipline to execute like a true Navy Seal Trader.
Session Range ProjectionsSession Range Projections
Purpose & Concept:
Session Range Projections is a comprehensive trading tool that identifies and analyzes price ranges during user-defined time periods. The indicator visualizes high-probability reversal zones and profit targets by projecting Fibonacci levels from custom session ranges, making it ideal for traders who focus on time-based market structure analysis.
Key Features & Calculations:
1. Custom Time Range Analysis
- Define any time period for range calculation - from traditional sessions (Asian, London, NY) to custom periods like opening ranges, hourly ranges, or 4-hour blocks
- Automatically captures the highest and lowest prices within your specified timeframe
- Supports multiple timezone selections for global market analysis
- Flexible enough for intraday scalping ranges or longer-term swing trading setups
2. Premium & Discount Zones
- Automatically divides the range into premium (above 50%) and discount (below 50%) zones
- Visual differentiation helps identify institutional buying and selling areas
- Color-coded boxes clearly mark these critical price zones
3. Optimal Trade Entry (OTE) Zones
- Highlights the 79-89% retracement zone in premium territory
- Highlights the 11-21% retracement zone in discount territory
- These zones represent high-probability reversal areas based on institutional order flow concepts
4. Fibonacci Projections
- Projects 11 customizable Fibonacci extension levels from the range extremes
- Levels extend both above and below the range for symmetrical analysis
- Each level can be individually toggled and color-customized
- Default levels include common retracement ratios: -0.5, -1.0, -2.0, -2.33, -2.5, -3.0, -4.0, -4.5, -6.0, -7.0, -8.0
How to Use:
Set Your Time Range: Input your desired session start and end times (24-hour format)
Select Timezone: Choose the appropriate timezone for your trading session
Customize Display: Toggle various visual elements based on your preferences
Monitor Price Action: Watch for reactions at projected levels and OTE zones
Set Alerts: Configure sweep alerts for when price breaks above/below range extremes
Input Parameters Explained:
Time Range Settings
Range Start/End Hour & Minute: Define your analysis period
Time Zone: Ensure accurate session timing across different markets
Visual Settings
Range Box: Toggle the premium/discount zone visualization
Horizontal Lines: Customize high/low line appearance
Internal Range Levels: Show/hide equilibrium and OTE zones
Labels: Configure text display for key levels
Fibonacci Projections: Enable/disable extension levels
Display Settings
Historical Ranges: Show up to 10 previous session ranges
Alert Type: Choose between high sweep, low sweep, or both
Trading Applications:
Session-Based Trading: Analyze specific market sessions (Asian, London, New York, opening ranges, hourly ranges)
Reversal Trading: Identify high-probability reversal zones at OTE levels
Breakout/Reversal Trading: Monitor range breaks/reversals with built-in sweep alerts
Risk Management: Use Fibonacci projections as profit targets or rejection areas
Multi-Timeframe Analysis: Apply to any timeframe for various trading styles
Important Notes:
This indicator is for educational purposes only and should not be considered financial advice
Past performance does not guarantee future results
Always use proper risk management when trading
The indicator automatically manages historical data to maintain chart performance
4-EMA Signals + MTF Analysis4-EMA Signals + MTF Analysis Indicator: User Guide
This indicator is designed for active traders; from scalpers / intra-day traders to swing-traders who simply want an easy to understand, simple, but yet comprehensive and easy-to-understand indicator with a quick overview of initial market momentum and overall market direction to assist the trader in their initial trading.
The main feature of this indicator is that It overlays four exponential moving averages (EMAs), and provides a dashboard of real-time trend signals for both buy and sell (long/short) scenarios.
Settings Overview
MA Period Setup
Custom: Set your own EMA periods.
Conservative, Aggressive, Fibonacci: Quickly apply preset EMA period combinations for different trading styles.
EMA Periods (Custom Setup)
Fast EMA: Shortest EMA, reacts quickly to price (default 7).
Medium-Short EMA: Intermediate speed (default 25).
Medium-Long EMA: Slower, filters out more noise (default 70).
Slow EMA: Longest-term trend (default 200).
(These settings can be adjusted to suit your individual needs)
Main Indicator Features
Four EMAs : Plotted in distinct colors (green, yellow, orange, red) for quick trend recognition - this can be altered in colour to your personal preferences.
Buy/Sell Signals : Triangles appear below/above bars when EMA crossovers occur, optionally filtered by volume - the volume filter when applied greatly reduces the influx of signals, only giving high-quality signals!
Trading Sessions + Backgrounds : A trading session feature has been added: (London, New York, Asia, Sydney) with the choice of a background to indicate each global trading session.
Volume Overlay : Volume bars and a blue volume moving average line for context.
Dashboard Table (Top Right):
Market Direction: Shows the overall EMA alignment (bullish, bearish, weak, consolidating).
The initial trend on the 5m, 15m, 1H, and 4H time-frame to give a quick snapshot of overall trend direction.
How to Use
Trend Identification :
-- Use the EMA alignment and dashboard table to quickly see if the market is bullish, bearish, or consolidating.
EMA Set-up
-- Adjust the EMA settings to your specific requirements, the signals will alter depending on the volatility of the instrument your trading.
Signal Confirmation :
-- ''Buy'' signals simply appear when the faster EMAs cross above slower EMAs in and ''Sell'' signals simply appear when they cross below.
Volume Context :
--Use the volume moving average and the optional volume filter to avoid signals during low-activity periods.
No Repainting :
-- All signals and dashboard readings are calculated using only confirmed, closed bars. What you see in real time is exactly what will appear in your back-test — no repainting or look-ahead bias.
Alerts / Notifications
Now for the fun part:
1. Enable Buy/Sell Signal Alerts: Get notifications when buy or sell signals occur.
2. For Alerts to function correctly, set the ''condition'' to the indicator itself.
3. Select ''EMA Bearish Cross'' or ''EMA Bullish Cross'' depending whether you want alerts for either buy/sell signals - Or one can simply set alerts for both scenarios.
4. For ''Interval'' set to ''Same as chart'' - So, the time-frame which you'd like to trade on.
5. For ''Trigger'' set to ''Once Per Bar Close''.
6. Save.
7. Wait for a signal to occur!
NOTE: Before placing a trade, it's often best to also assess the market conditions at that time also - and not rely solely on the signals, the signals are to assist, and it's often occurred a signal has shown, but a pull-back occurs, and a FVG in discount holds -- it's this FVG holding, accompanied by volume, that's the real entry, possibly.
Tip: For the cleanest results, use the indicator during the most active sessions and always check multi-time-frame trend alignment before entering trades. Good Luck! :)
ICT Directional FVG Indicator (Buffered SL)This is the first indicator I have ever made, and I am very new to Pine Script. I’ve tried my best to create this as a strategy, but I’m still learning, so please be kind and constructive with your feedback!
ICT Directional FVG Indicator (Buffered SL)
This indicator is designed for traders who follow ICT (Inner Circle Trader) concepts, focusing on Fair Value Gaps (FVGs), liquidity sweeps, and session-based trading. It automatically detects bullish and bearish FVGs, highlights them on the chart, and identifies liquidity sweep events. The indicator features three customizable Kill Zones (London, New York, and Asia sessions), each with independent toggles and color-coded backgrounds for clear visual separation.
Key features:
Fair Value Gap Detection: Highlights bullish and bearish FVGs in real time.
Liquidity Sweep Alerts: Marks potential liquidity sweep events for both highs and lows.
Session Kill Zones: Toggle each Kill Zone (London, New York, Asia) independently; background color changes only in enabled zones.
Trade Signal Visualization: Plots entry, stop loss, and take profit levels based on FVG and sweep logic, with a user-defined stop loss buffer.
Customizable Display: Easily enable or disable FVGs, sweeps, trade levels, and each Kill Zone to suit your strategy.
This tool is ideal for ICT-based traders who want a clear, automated view of FVGs, sweeps, and session activity, with full control over which sessions and signals are displayed.
Supply/Demand Zones + Engulfment-based ExecutionSupply/Demand Zones + Engulfment-Based Execution
Strategy Overview
This strategy combines institutional trading concepts—supply/demand zones and engulfing candle patterns—to generate high-probability long and short trade setups. The system uses aggregated price action to identify potential reversal zones and confirms entries with engulfing candle patterns, ensuring trades are only taken when market structure shows commitment in the direction of the trade.
Core Concepts
• Supply & Demand Zones: These are automatically detected by analyzing aggregated bullish and bearish candle structures over user-defined intervals. Supply zones are formed after bearish continuation patterns; demand zones appear after bullish continuation patterns.
• Engulfing Entries: Once price enters a zone, the strategy waits for a bullish engulfing pattern (in a demand zone) or a bearish engulfing pattern (in a supply zone) before executing a trade. This adds confirmation and reduces false signals.
• Risk Management: Stop-loss is placed at the low (for long trades) or high (for short trades) of the engulfed candle. Take-profit can be calculated using a fixed R-multiple (risk-to-reward ratio) or a user-defined target price.
Key Features
Fully customizable aggregation factor for zone detection
Visual zone boxes, entry/SL/TP boxes, and engulfing pattern labels
Optional removal of mitigated zones for cleaner charting
Configurable trade mode (Long only, Short only, or Both)
Support for trading sessions and date filtering
Alerts for price entering supply or demand zones
How to Use
Select Aggregation Factor: Choose how many candles to group together for identifying key zones (e.g., 4x timeframe).
Enable Zones: Turn on supply and/or demand zones as needed.
Set Execution Parameters:
– Choose R-multiple (e.g., 2:1 risk-reward)
– Or use a fixed take-profit price
Define Trade Time Window:
– Set the date and time ranges to restrict execution
– Use Start Hour and End Hour to limit trades to specific sessions (e.g., London/New York)
Run on Desired Timeframe: Typically used on 15m–4H charts, depending on your strategy and the asset’s volatility.
Ideal For
• Traders using Smart Money Concepts (SMC)
• Those who value high-confluence entries
• Intraday to swing traders looking for structure-based automation
⚠️ Important Notes
• The strategy requires engulfing confirmation within the zone to enter a position.
• This script does not repaint and executes trades on a bar close basis.
• Backtest results may vary based on session filters and aggregation factor.
© Attribution
This strategy was developed by The_Forex_Steward and is licensed under the Mozilla Public License 2.0.
You are free to use, modify, and distribute it under the terms of that license.
X OROverview
Designed to plot hourly opening ranges (ORs) on an intraday chart. It primarily serves as a trading tool for assessing market direction and potential trading opportunities by analyzing price action relative to key OHLC (Open, High, Low, Close) levels within each hourly range.
The code provided is for each hour sessions from 2:00 AM to 3:00 PM for a complete session-based framework. In addition there is the RTH open range
Purpose
The core purpose of this indicator is to:
✅ Define each hourly range (based on the session’s opening bar) by recording the high and low of that range.
✅ Extend this range into the following bars for visual reference — serving as dynamic support and resistance zones.
✅ Monitor price action relative to each hourly OR, helping traders evaluate market direction and structure trades using concepts like:
Breakouts above/below the OR high/low.
Rejections or consolidations within the OR.
Continuation or reversal signals tied to each OR.
Key Features
The script marks the first bar of the session as the OR session start.
During this bar, it initializes:
Opening price
Session high
Session low
These levels form the initial range.
🔹 Dynamic Range Tracking
Throughout the one-minute OR session:
The highest and lowest prices are updated in real time, capturing intra-hour volatility.
A visual background box is drawn to highlight the OR range on the chart.
🔹 Range Extension
The script defines an extended session period after the initial OR (e.g., 2:00 AM-2:45 AM for the 2:00 AM session).
During this extension period:
The box persists on the chart, providing a contextual zone that traders can use as a dynamic support/resistance area.
🔹 Visual Representation
Transparent colored boxes highlight each session’s OR visually on the chart.
These boxes help traders easily identify whether price is trading:
Inside the OR
Breaking above the high (potential bullish continuation)
Breaking below the low (potential bearish continuation)
Application in Trading
🔍 Trading the Opening Range Breakout
Traders often use the OR high and low as breakout triggers. For example:
A price break above the OR high may signal bullish momentum.
A break below the OR low may signal bearish momentum.
⚖️ Support and Resistance
Even if breakouts fail, the OR can act as a pivot zone — offering areas for:
Stop placements
Target levels
Entry confirmations for fade trades or mean reversion strategies.
🕒 Session Awareness
By defining each hour’s OR individually (from 2:00 AM to 3:00 PM), traders can:
Analyze price behavior within each session.
Recognize when liquidity or volatility increases (e.g. around overlapping sessions like London open or New York open).
Summary
This Pine Script indicator provides a powerful framework for visualizing and trading hourly opening ranges. It enhances intraday analysis by:
Structuring price action within hourly boxes.
Highlighting key price levels relative to OHLC concepts.
Helping traders make more informed decisions by assessing price behavior around these critical ranges.
Aftershock by Session [SAKANE]■ Background & Motivation
In 24/7 markets like crypto, not all participants react simultaneously to major events.
Instead, reactions unfold across different regional trading sessions — Asia (APAC), Europe (EU), and the United States (US) — each with its own tempo and sentiment.
This indicator is designed to visualize which session drives the market after a key event — capturing the "aftershock" effect that ripples through time zones.
■ Key Features
Tracks price return (open → close) for each session: APAC / EU / US
Cumulative session returns are calculated and visualized
Smoothing options: SMA, EMA, or Ehlers SuperSmoother
Optimized for daily charts to highlight structural momentum shifts
Toggle visibility of each session independently
■ Why “Aftershock”?
Take April 2, 2025 — the day of the “Trump Tariff Opening.”
That policy announcement triggered a market-wide response. But:
Which session reacted first?
Which session truly moved the market?
This indicator is named “Aftershock” because it helps you see the ripple effect of such events — when and where momentum followed.
■ How to Use
Search for “Aftershock by Session ” on TradingView
Add it to your chart (use Daily timeframe)
Customize sessions and smoothing options via settings
You can also bookmark it for quick access.
■ Insights & Use Cases
Detect which session initiated or led market moves after news events
Understand geo-temporal dynamics — did the move start in Asia, Europe, or the US?
For example, on April 2, 2025, the day Trump’s tariff pivot was announced:
You can instantly see which session took the lead —
the APAC session hesitated, while the US session drove the trend.
This insight becomes visually obvious with the cumulative lines.
■ Unique Value
Unlike typical indicators based on raw price action,
Aftershock analyzes market movement through a session-based structural lens.
It captures where capital actually moved — and when.
A tool not just for technical analysis, but for event-driven, macro-aware market reading.
■ Final Thoughts
To truly understand market mechanics, we must look beyond candles and trends.
Aftershock by Session breaks down the 24-hour cycle into meaningful regional flows,
allowing you to track the true drivers behind price momentum.
Whether you're trading, researching, or tracking macro catalysts,
this tool helps answer the key question:
“Who moved the market — and when?”
LANZ Strategy 4.0🔷 LANZ Strategy 4.0 — Trend Impulse Detection with Risk Management
LANZ Strategy 4.0 is a multi-indicator trend strategy designed for short to medium-term trading on any asset or timeframe. It combines Parabolic SAR, Supertrend, ADX, and time zone highlighting to detect and confirm trend impulses, while managing entries with dynamic Stop Loss (SL) and Take Profit (TP) levels.
🧠 Core Components:
Parabolic SAR: Identifies short-term trend reversals.
Supertrend: Highlights trend continuation zones.
ADX Filter: Ensures trend strength by filtering entries when ADX exceeds a defined threshold.
Impulse Detection Logic: Detects and confirms movement impulses with a counter, only generating trade signals on confirmed sequences.
Risk Management: Calculates dynamic SL/TP with a default risk-reward ratio of 1:2, minimum SL of 4 pts, and maximum of 12 pts.
📊 Visual Features:
Trend lines from Supertrend and SAR.
Colored background zones for different sessions (Asia, NY).
Labels and lines for entry, SL, and TP.
Movement number labels help visualize impulse progression.
Alerts when a new impulse is confirmed.
⚙️ How It Works:
The strategy waits for a confirmed impulse (i.e., change in SAR + Supertrend + ADX filter).
Once a valid impulse is confirmed:
A trade signal (BUY/SELL) is shown.
SL and TP levels are calculated and drawn.
The script monitors live price to determine if SL or TP is hit.
Impulse counter advances to label movement progression.
🔔 Alerts:
You will receive an alert each time a new valid impulse is confirmed, indicating a potential trading opportunity.
📝 Notes:
Script is intended for discretionary or assisted trading, not automated execution.
Works best during active sessions with visible trend direction.
You can adjust ATR period, multiplier, SL padding, and impulse thresholds.
Credits:
Developed by LANZ combines established technical indicators and original impulse-count logic.
ETH to RTH Gap DetectorETH to RTH Gap Detector
What It Does
This indicator identifies and tracks custom-defined gaps that form between Extended Trading Hours (ETH) and Regular Trading Hours (RTH). Unlike traditional gap definitions, this indicator uses a specialized approach - defining up gaps as the space between previous session close high to current session initial balance low, and down gaps as the space from previous session close low to current session initial balance high. Each detected gap is monitored until it's touched by price.
Key Features
Detects custom-defined ETH-RTH gaps based on previous session close and current session initial balance
Automatically identifies both up gaps and down gaps
Visualizes gaps with color-coded boxes that extend until touched
Tracks when gaps are filled (when price touches the gap area)
Offers multiple display options for filled gaps (color change, border only, pattern, or delete)
Provides comprehensive statistics including total gaps, up/down ratio, and touched gap percentage
Includes customizable alert system for real-time gap filling notifications
Features toggle options for dashboard visibility and weekend sessions
Uses time-based box coordinates to avoid common TradingView drawing limitations
How To Use It
Configure Session Times : Set your preferred RTH hours and timezone (default 9:30-16:00 America/New York)
Set Initial Balance Period : Adjust the initial balance period (default 30 minutes) for gap detection sensitivity
Monitor Gap Formation : The indicator automatically detects gaps between the previous session close and current session IB
Watch For Gap Fills : Gaps change appearance or disappear when price touches them, based on your selected style
Check Statistics : View the dashboard to see total gaps, directional distribution, and touched percentage
Set Alerts : Enable alerts to receive notifications when gaps are filled
Settings Guide
RTH Settings : Configure the start/end times and timezone for Regular Trading Hours
Initial Balance Period : Controls how many minutes after market open to calculate the initial balance (1-240 minutes)
Display Settings : Toggle gap boxes, extension behavior, and dashboard visibility
Filled Box Style : Choose how filled gaps appear - Filled (color change), Border Only, Pattern, or Delete
Color Settings : Customize colors for up gaps, down gaps, and filled gaps
Alert Settings : Control when and how alerts are triggered for gap fills
Weekend Session Toggle : Option to include or exclude weekend trading sessions
Technical Details
The indicator uses time-based coordinates (xloc.bar_time) to prevent "bar index too far" errors
Gap boxes are intelligently limited to avoid TradingView's 500-bar drawing limitation
Box creation and fill detection use proper range intersection logic for accuracy
Session detection is handled using TradingView's session string format for reliability
Initial balance detection is precisely calculated based on time difference
Statistics calculations exclude zero-division scenarios for stability
This indicator works best on futures markets with extended and regular trading hours, especially indices (ES, NQ, RTY) and commodities. Performs well on timeframes from 1-minute to 1-hour.
What Makes It Different
Most gap indicators focus on traditional open-to-previous-close gaps, but this tool offers a specialized definition more relevant to ETH/RTH transitions. By using the initial balance period to define gap edges, it captures meaningful price discrepancies that often provide trading opportunities. The indicator combines sophisticated gap detection logic with clean visualization and comprehensive tracking statistics. The customizable fill styles and integrated alert system make it practical for both chart analysis and active trading scenarios.
ICT Macro Zone Boxes w/ Individual H/L Tracking v3.1ICT Macro Zones (Grey Box Version
This indicator dynamically highlights key intraday time-based macro sessions using a clean, minimalistic grey box overlay, helping traders align with institutional trading cycles. Inspired by ICT (Inner Circle Trader) concepts, it tracks real-time highs and lows for each session and optionally extends the zone box after the session ends — making it a precision tool for intraday setups, order flow analysis, and macro-level liquidity sweeps.
### 🔍 **What It Does**
- Plots **six predefined macro sessions** used in Smart Money Concepts:
- AM Macro (09:50–10:10)
- London Close (10:50–11:10)
- Lunch Macro (11:30–13:30)
- PM Macro (14:50–15:10)
- London SB (03:00–04:00)
- PM SB (15:00–16:00)
- Each zone:
- **Tracks high and low dynamically** throughout the session.
- **Draws a consistent grey shaded box** to visualize price boundaries.
- **Displays a label** at the first bar of the session (optional).
- **Optionally extends** the box to the right after the session closes.
### 🧠 **How It Works**
- Uses Pine Script arrays to define each session’s time window, label, and color.
- Detects session entry using `time()` within a New York timezone context.
- High/Low values are updated per bar inside the session window.
- Once a session ends, the box is optionally closed and fixed in place.
- All visual zones use a standardized grey tone for clarity and consistency across charts.
### 🛠️ **Settings**
- **Shade Zone High→Low:** Enable/disable the grey macro box.
- **Extend Box After Session:** Keep the zone visible after it ends.
- **Show Entry Label:** Display a label at the start of each session.
### 🎯 **Why This Script is Unique**
Unlike basic session markers or colored backgrounds, this tool:
- Focuses on **macro moments of liquidity and reversal**, not just open/close times.
- Uses **per-session logic** to individually track price behavior inside key time windows.
- Supports **real-time high/low tracking and clean zone drawing**, ideal for Smart Money and ICT-style strategies.
Perfect — based on your list, here's a **bundle-style description** that not only explains the function of each script but also shows how they **work together** in a Smart Money/ICT workflow. This kind of cross-script explanation is exactly what TradingView wants to see to justify closed-source mashups or interdependent tools.
---
📚 ICT SMC Toolkit — Script Integration Guide
This set of advanced Smart Money Concept (SMC) tools is designed for traders who follow ICT-based methodologies, combining liquidity theory, time-based precision, and engineered confluences for high-probability trades. Each indicator is optimized to work both independently and synergistically, forming a comprehensive trading framework.
---
First FVG Custom Time Range
**Purpose:**
Plots the **first Fair Value Gap (FVG)** that appears within a defined session (e.g., NY Kill Zone, Custom range). Includes optional retest alerts.
**Best Used With:**
- Use with **ICT Macro Zones (Grey Box Version)** to isolate FVGs during high-probability times like AM Macro or PM SB.
- Combine with **Liquidity Levels** to assess whether FVGs form near swing points or liquidity voids.
---
ICT SMC Liquidity Grabs and OB s
**Purpose:**
Detects **liquidity grabs** (stop hunts above/below swing highs/lows) and **bullish/bearish order blocks**. Includes optional Fibonacci OTE levels for sniper entries.
**Best Used With:**
- Use with **ICT Turtle Soup (Reversal)** for confirmation after a liquidity grab.
- Combine with **Macro Zones** to catch order blocks forming inside timed macro windows.
- Match with **Smart Swing Levels** to confirm structure breaks before entry.
ICT SMC Liquidity Levels (Smart Swing Lows)
**Purpose:**
Automatically marks swing highs/lows based on user-defined lookbacks. Tracks whether those levels have been breached or respected.
**Best Used With:**
- Combine with **Turtle Soup** to detect if a swing level was swept, then reversed.
- Use with **Liquidity Grabs** to confirm a grab occurred at a meaningful structural point.
- Align with **Macro Zones** to understand when liquidity events occur within macro session timing.
ICT Turtle Soup (Liquidity Reversal)
**Purpose:**
Implements the classic ICT Turtle Soup model. Looks for swing failure and quick reversals after a liquidity sweep — ideal for catching traps.
Best Used With:
- Confirm with **Liquidity Grabs + OBs** to identify institutional activity at the reversal point.
- Use **Liquidity Levels** to ensure the reversal is happening at valid previous swing highs/lows.
- Amplify probability when pattern appears during **Macro Zones** or near the **First FVG**.
ICT Turtle Soup Ultimate V2
**Purpose:**
An enhanced, multi-layer version of the Turtle Soup setup that includes built-in liquidity checks, OTE levels, structure validation, and customizable visual output.
**Best Used With:**
- Use as an **entry signal generator** when other indicators (e.g., OBs, liquidity grabs) are aligned.
- Pair with **Macro Zones** for high-precision timing.
- Combine with **First FVG** to anticipate price rebalancing before explosive moves.
---
## 🧠 Workflow Example:
1. **Start with Macro Zones** to focus only on institutional trading windows.
2. Look for **Liquidity Grabs or Swing Sweeps** around key highs/lows.
3. Check for a **Turtle Soup Reversal** or **Order Block Reaction** near that level.
4. Confirm confluence with a **Fair Value Gap**.
5. Execute using the **OTE level** from the Liquidity Grabs + OB script.
---
Let me know which script you want to publish first — I’ll tailor its **individual TradingView description** and flag its ideal **“Best Used With” partners** to help users see the value in your ecosystem.
Market Session Boxes with Volume Delta [algo_aakash]This script highlights four key forex trading sessions — Tokyo, London, New York, and Sydney — by drawing color-coded boxes directly on the chart. For each session, it shows:
High and low of the session
Total volume traded
Volume delta (bullish vs bearish pressure)
Optional extension of session highs/lows into future candles
Cleanly labeled time range and stats
Users can:
Select which sessions to display
Customize session times (in UTC+0)
Choose colors per session
Toggle session labels and extension lines
Use Case: Designed to help intraday and short-term traders visualize market rhythm, liquidity zones, and session-based volatility. The volume delta metric adds an extra layer of sentiment analysis.
This tool works best on intraday timeframes like 15m, 30m, or 1H.
Disclaimer:
This indicator is for educational and visual analysis purposes. It does not constitute trading advice or guarantee results. Always conduct your own analysis before making trading decisions.
Custom Time Range Boxes + Fibs + ExtensionThis script draws two customizable time-range boxes per day, helping traders visualize key market sessions or activity windows. Each box is defined by start and end times that can be adjusted in the settings. You can also choose a custom color and extend the visual width of the box independently from the actual session time. Within each box, the indicator plots three Fibonacci levels: 0.3, 0.5, and 0.7. These levels are useful for identifying potential support, resistance, or retracement zones inside the session range. The script supports two separate time blocks, allowing you to track sessions like the New York Open and Power Hour simultaneously. All lines and boxes are drawn using bar_index for precision and control. The levels and box colors match for visual consistency. Perfect for intraday traders who want to track price behavior around key times. Clean, minimal, and performance-friendly — this tool adds clarity to your session-based strategy.
Bull Bear Pivot by RawstocksThe "Bull Bear Pivot" indicator is a custom Pine Script (v5) tool designed for TradingView to assist traders in identifying key price levels and pivot points on intraday charts (up to 1-hour timeframes). It combines time-based open price markers, pivot high/low detection, and candlestick visualization to provide a comprehensive view of potential support, resistance, and trend reversal levels. Below is a detailed description of the indicator’s functionality, features, and intended use.
Indicator Overview:
The "Bull Bear Pivot" indicator is tailored for intraday trading, focusing on specific times of the day to mark significant price levels (open prices) and detect pivot points. It plots horizontal lines at the open prices of user-defined sessions, identifies pivot highs and lows on the current chart timeframe, and overlays custom candlesticks to highlight price action. The indicator is designed to work on timeframes of 1 hour or less (e.g., 1-minute, 3-minute, 5-minute, 15-minute, 30-minute, 60-minute) and includes a warning mechanism for invalid timeframes.
Key Features:
Time-Based Open Price Markers:
The indicator allows users to define up to five time-based sessions (e.g., 4:00 AM, 8:30 AM, 9:30 AM, 10:00 AM, and a custom time) to capture the open price at the start of each session.
For each session, it plots a horizontal line at the 1-minute open price, extending from the session start to the market close at 4:00 PM EST.
Each line is accompanied by a label positioned 5 bars to the right of the market close (4:00 PM EST), with the text right-aligned and vertically centered on the line.
Users can enable/disable each marker, customize the session time, label text, line color, and text color via the indicator’s settings.
Pivot Highs and Lows:
The indicator calculates pivot highs and lows on the current chart timeframe using the ta.pivothigh and ta.pivotlow functions.
Pivot highs are marked with green triangles above the bars, and pivot lows are marked with red triangles below the bars.
The pivot period (lookback/lookforward) is user-configurable, allowing flexibility in detecting short-term or longer-term reversals.
Custom Candlesticks:
The indicator overlays custom candlesticks on the chart, colored green for bullish candles (close > open) and red for bearish candles (close < open).
This feature helps visualize price action alongside the open price markers and pivot points.
Timeframe Restriction:
The indicator is designed to work on timeframes of 1 hour or less. If the chart timeframe exceeds 1 hour (e.g., 4-hour, daily), a warning label ("Timeframe > 1H\nIndicator Disabled") is displayed, and no elements are plotted.
Customizable Appearance:
Users can customize the appearance of the open price marker lines, including the line style (solid, dashed, dotted) and line width.
Labels for the open price markers have no background (transparent) and use customizable text colors.


