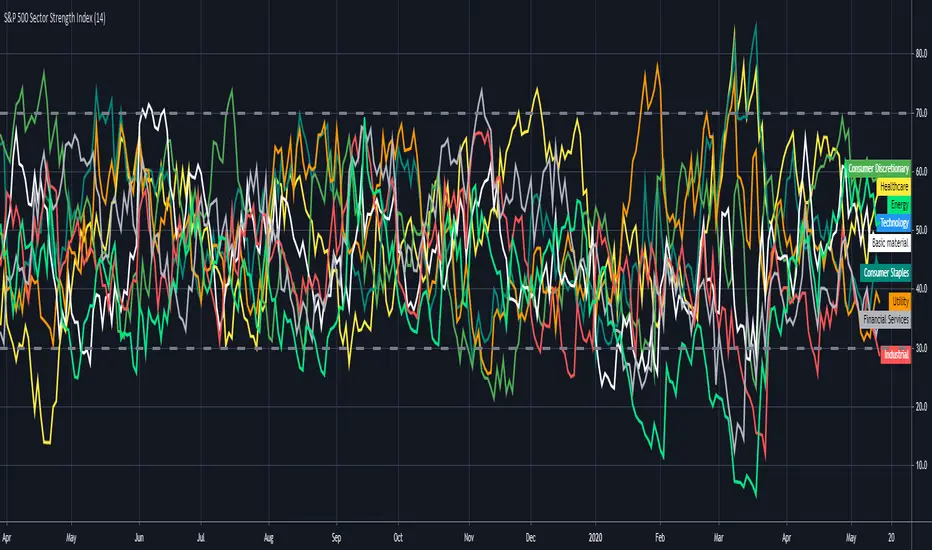
S&P 500 Sector Strength IndexHi traders , this is lonelygrass again 😄, and I am going to show what you don't often see out there and share it with you.
This indicator is called "s&p 500 sector strength index"😎 , which allows you to distinguish strengths and weaknesses between different sectors in s&p500, and to create meaningful trading frameworks around it.
Similar to the RSI indicator , it also has overbought and oversold levels , you can clearly figure out the degree of crowd behaviors in various sectors' stocks .
For me 🤣, I will use it to "BUY LOW⬇️ , SELL HIGH⬆️". When a sector is oversold at the moment, I will try to buy those stocks when I find price actions and chart patterns in comply with the analysis by this indicator , the opposite for shortselling.
Also, for sake of being more user-friendly 👍, I added a function which enables you to only select the sector(s) you want to look at in order to make it less messy.
If you can't help to know what I will share with you coming up, then FOLLOW my account 😙 . Also , your likes and shares are really important 🎊. I will get more motivated to bring you new thing every day!!! ✍
חפש סקריפטים עבור "spy"
OasisTrading OHL Levels This indicator is free to all Oasis Trading Group members.
Open, High, and Low levels for D, W, M, 90D, 12M.
Labels and Alerts coming soon.
For Access or Questions: Private message us. Thank you.

Wick SniperThis indicator is free to all Oasis Trading Group members.
The Wick Sniper was created to catch volatile moves that are extended from the mean. It uses an advanced ATR formula to follow price like a band, with an upper deviation and a lower deviation. I have also added a 1 candle offset so that the moves are not in "hindsight". Feel free to experiment with the inputs to find what is best for your asset.
For Access or Questions: Private message us. Thank you.

MACD and RSI divergence by SANDWICHIdentifies hidden price areas of RSI and MACD divergence in the market. Use for major currency pairs, I find it works best on SPY or SPX500 though.

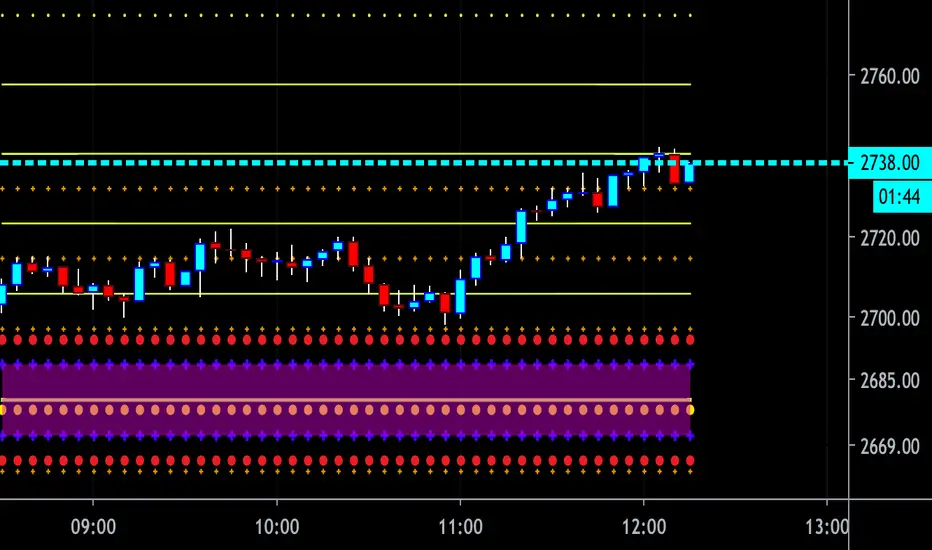
CBG Key Numbers v6Here is my opening range, key numbers indicator. It takes the Opening Range (5 minutes by default) and then plots the opening range and up to 7 extensions of that range above and below.
It's amazing how the OR is stamped up on the rest of the day's price movements.
2 strategies (at least) are to play the OR range breakout and to fade when price hits an extreme range.
You have total control over how you set up the various lines and colors.
If you start overlaying the trading day with the OR and it's extensions, you will see amazing patterns become clear. For example, the pump and reverse. This is where price pumps right out of the opening and then reverses later in the morning.
I have the opening price set to big circles as this is one of the most important reference points during the day.
Important: For some reason, the 9:30 am time Opening acts differently for equities and futures . For equities, you can set the time values to 0930. But for futures , to capture the Open at 9:30, you have to set the time values to start at 0830. I haven't been able to find a better solution but setting the times manually works. Make sure to set all the time values on the Options screen.
There is one more setting of interest. It is called IB Target Amount. This is a number above and below the opening range that I have observed price to hit whenever there's a breakout. This will allow you to predict a price target on breakouts. For SPY , I have found that price usually breaks out to at least 50 cents. On ES futures , it's 6 dollars. This can help you lock in 10% and 20% when trading options and is a great tool. That's why I have it so prominent in red. You will also see price return to this level during the day and act as support or resistance.
Please disregard the red and green shaded rectangles. They are my own support and resistance zones and TV wouldn't let me hide them from the picture. :-)
I mostly use this on a 5 minute chart but any timeframe will work.
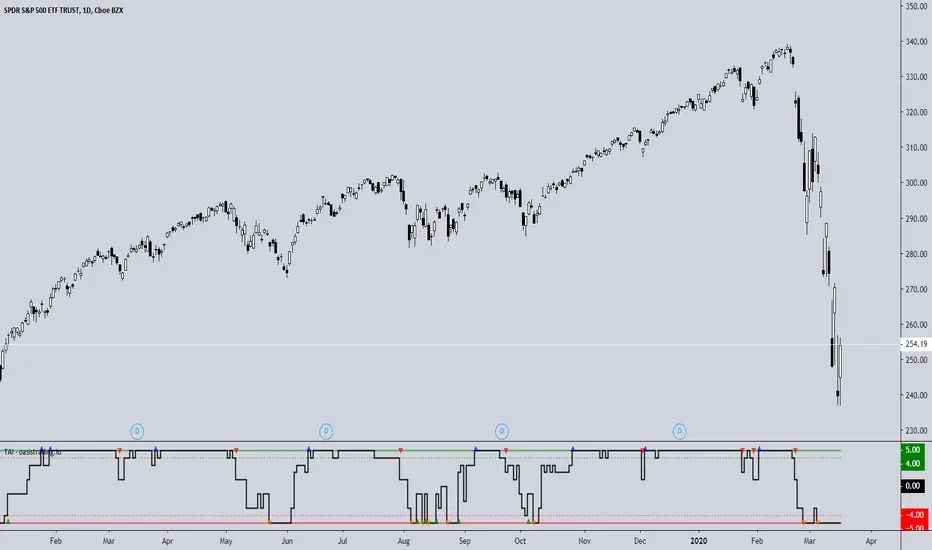
TAI - Trend Agreement IndexThe TAI is an experimental indicator we created to begin working on a automated trading algorithm. It takes five signals from our indicators and gives a +1 or -1 for each signal depending on if the signal is bullish or bearish.
This indicator should not be used for direct signals, but for confluence in trend. Long periods of flatness at 5 or -5 will indicate a very strong trend in that direction.
The TAI gives 4 different arrows depending on what the trend is doing.
Blue = Uptrend
Red = Uptrend Lost
Orange = Downtrend
Green = Downtrend Lost
This is a free add-on indicator for traders with access to the DBT MoMo and the Oasis Trading Suite and Bundle Package.
For Access or Questions: Private message us. Thank you.
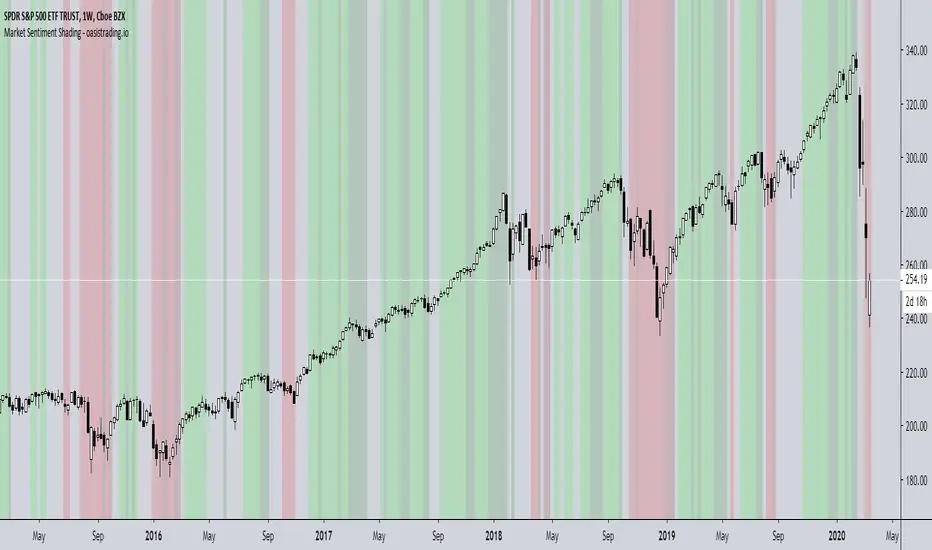
Market Sentiment ShadingThe Market Sentiment Shading Indicator shades the background of the asset based on signals from the DBT MoMo and Oasis Trading Suite. This indicator was designed to make it very obvious which direction the trend is moving and to keep the trader focused on following trend.
There are four different shades:
Dark Green = Bull
Light Green = Strong Bull
Dark Red = Bear
Light Red = Strong Bear
This is a free add-on indicator to traders with access to the DBT MoMo and Oasis Trading Suite and Bundle Package.
For Access or Questions: Private message us. Thank you.
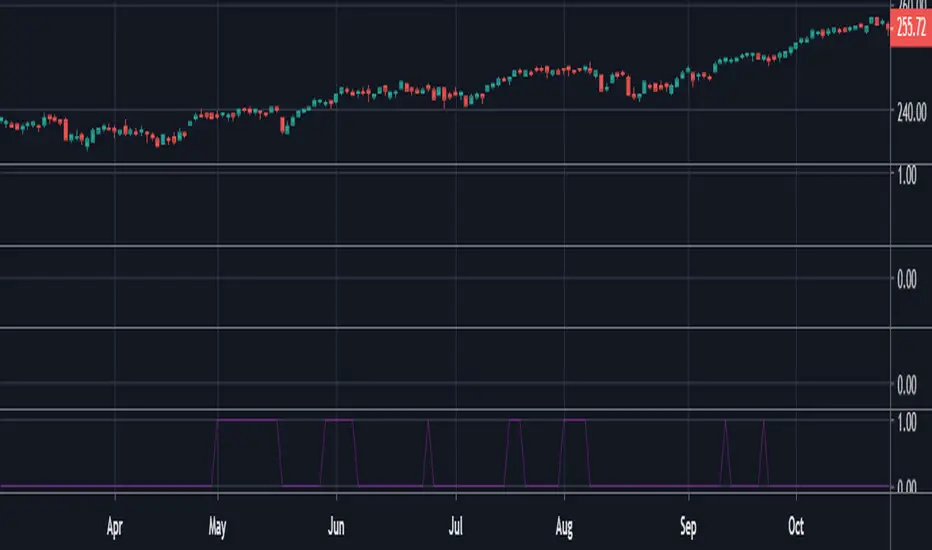
Trading Range Indicator - TRISimple script made to identify trading ranges in any timeframe
The oscillator bounces between 1 and 0. 1 means that the current asset is in a trading range and 0 meaning it is not.
The determination of a trading range is determined by the following:
ATR(14)40 and RSI<60
ADX<25
Due to all 3 having to be fulfilled in order for the oscillator to show there is a trading range, this causes a problem where 2 of the conditions are fulfilled and therefore still shows 0 on the oscillator, however, the asset could very well be in a trading range.
So what in the world do you use this for if there is such a significant margin of error?
Since all 3 conditions need to be fulfilled in order for it to be considered a trading range, this gives a very strong indicator of said trading ranges. So if a person is looking at individual stock tickers or the SPY index ticker, then when the oscillator reads a 1, it could be ideal to open an Iron Condor on said ticker. This means that this indicator is not well suiting for traditional long and short stock positions, but rather it is made for options traders who by using an Iron Condor can make money of a range-bound market.
Trend-Following Combo-SuperTrend, EMA, Aroon, DMI, Laguerre RSIThis is a trend-following indicator which condenses two SuperTrend indicators -- one based on analysis over a shorter period of time (1.5, 7), and one based on analysis over a longer period of time (1.65, 100) -- into a single indicator which appears on your chart only when both the shorter- and longer-term analysis indicates a "SuperTrend" in the same direction.
Additionally, potential trade entry indicators are displayed in the form of up and down arrows when (by default) three of the following five indicators suggest that the market is trending in the same direction as both the shorter- and longer-term SuperTrend indicators:
EMA Crossover (8, 15)
Aroon Indicator (8)
Aroon Oscillator (8)
Directional Movement Index (DI +/-) (8)
Laguerre RSI (13)
You may update the parameters of any of the indicators to match your own preferences.
Additionally, you may also adjust the "Threshold" of indicators that must be in agreement with the SuperTrend to show a potential trade entry arrow. Bear in mind that if you set the Indicator Threshold too low, you will see more frequent trade entry arrows, many of which will not be profitable if taken. Similarly, set this value too high, and you will see fewer trade entry arrows that may not appear until after most of the "juice" in the trend has evaporated. Ideal values for the threshold seem to be between 2-4, depending on the symbol you are trading.
The following image shows all of the indicators referenced above on a 5-minute chart of the SPY during a single trading day:
And, here is the same period of time showing only the Trend-Following Combo indicator with default settings:
This indicator would not have been possible save for work contributed by the following:
SuperTrend by Rajandran R
Aroon w/ crossovers highlighted by seiglerj
Aroon Oscillator by jcrewolinsky
Directional Movement Index by TradingView
Laguerre RSI (Self Adjusting Alpha with Fractals Energy) by everget

Macroeconomic Artificial Neural Networks
This script was created by training 20 selected macroeconomic data to construct artificial neural networks on the S&P 500 index.
No technical analysis data were used.
The average error rate is 0.01.
In this respect, there is a strong relationship between the index and macroeconomic data.
Although it affects the whole world,I personally recommend using it under the following conditions: S&P 500 and related ETFs in 1W time-frame (TF = 1W SPX500USD, SP1!, SPY, SPX etc. )
Macroeconomic Parameters
Effective Federal Funds Rate (FEDFUNDS)
Initial Claims (ICSA)
Civilian Unemployment Rate (UNRATE)
10 Year Treasury Constant Maturity Rate (DGS10)
Gross Domestic Product , 1 Decimal (GDP)
Trade Weighted US Dollar Index : Major Currencies (DTWEXM)
Consumer Price Index For All Urban Consumers (CPIAUCSL)
M1 Money Stock (M1)
M2 Money Stock (M2)
2 - Year Treasury Constant Maturity Rate (DGS2)
30 Year Treasury Constant Maturity Rate (DGS30)
Industrial Production Index (INDPRO)
5-Year Treasury Constant Maturity Rate (FRED : DGS5)
Light Weight Vehicle Sales: Autos and Light Trucks (ALTSALES)
Civilian Employment Population Ratio (EMRATIO)
Capacity Utilization (TOTAL INDUSTRY) (TCU)
Average (Mean) Duration Of Unemployment (UEMPMEAN)
Manufacturing Employment Index (MAN_EMPL)
Manufacturers' New Orders (NEWORDER)
ISM Manufacturing Index (MAN : PMI)
Artificial Neural Network (ANN) Training Details :
Learning cycles: 16231
AutoSave cycles: 100
Grid
Input columns: 19
Output columns: 1
Excluded columns: 0
Training example rows: 998
Validating example rows: 0
Querying example rows: 0
Excluded example rows: 0
Duplicated example rows: 0
Network
Input nodes connected: 19
Hidden layer 1 nodes: 2
Hidden layer 2 nodes: 0
Hidden layer 3 nodes: 0
Output nodes: 1
Controls
Learning rate: 0.1000
Momentum: 0.8000 (Optimized)
Target error: 0.0100
Training error: 0.010000
NOTE : Alerts added . The red histogram represents the bear market and the green histogram represents the bull market.
Bars subject to region changes are shown as background colors. (Teal = Bull , Maroon = Bear Market )
I hope it will be useful in your studies and analysis, regards.

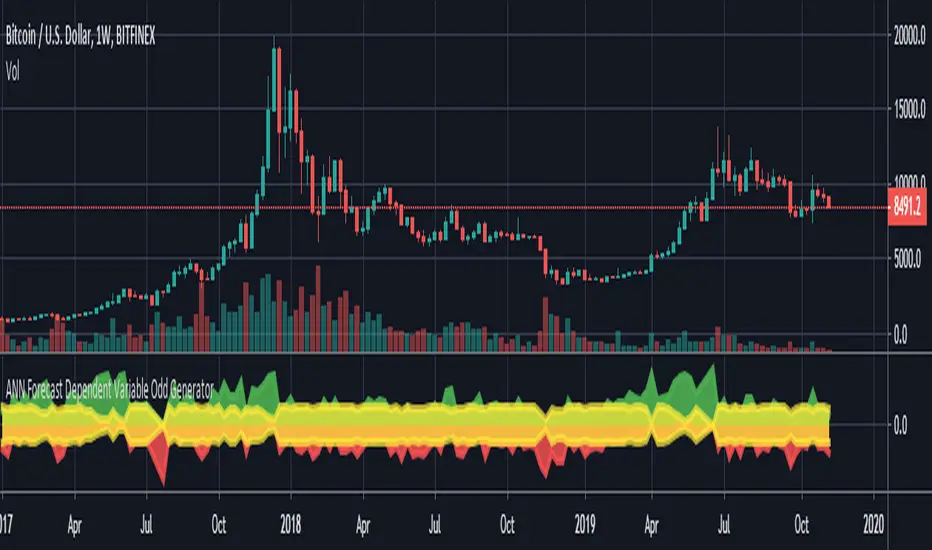
ANN Forecast Dependent Variable Odd GeneratorHello , this script is the ANN Forecast version of my "Dependent Variable Odd Generator " script.
I went to simplify a bit because the deep learning calculations are too much for this command.
The latest instruments included:
WTI : West Texas Intermediate (WTICOUSD , USOIL , CL1! ) Average error : 0.007593
BRENT : Brent Crude Oil ( BCOUSD , UKOIL , BB1! ) Average error : 0.006591
GOLD : XAUUSD , GOLD , GC1! Average error : 0.012767
SP500 : S&P 500 Index ( SPX500USD , SP1! ) Average error : 0.011650
EURUSD : Eurodollar ( EURUSD , 6E1! , FCEU1!) Average error : 0.005500
ETHUSD : Ethereum ( ETHUSD , ETHUSDT ) Average error : 0.009378
BTCUSD : Bitcoin ( BTCUSD , BTCUSDT , XBTUSD , BTC1! ) Average error : 0.01050
GBPUSD : British Pound ( GBPUSD , 6B1! , GBP1!) Average error : 0.009999
USDJPY : US Dollar / Japanese Yen ( USDJPY , FCUY1!) Average error : 0.009198
USDCHF : US Dollar / Swiss Franc ( USDCHF , FCUF1! ) Average error : 0.009999
USDCAD : Us Dollar / Canadian Dollar ( USDCAD ) Average error : 0.012162
VIX : S & P 500 Volatility Index (VX1! , VIX ) Average error : 0.009999
ES : S&P 500 E-Mini Futures ( ES1! ) Average error : 0.010709
SSE : Shangai Stock Exchange Composite (Index ) ( 000001 ) Average error : 0.011287
XRPUSD : Ripple (XRPUSD , XRPUSDT ) Average error : 0.009803
Simply select the required instrument from the tradingview analysis screen, then add this command and select the same instrument from the settings section.
The codes are not open-source because they contain forecast algorithm codes a little that I will use commercially in the future.
However, I will never remove this script, and you can use it for free unlimitedly.
For more information about my artificial neural network forecast series:
For more information about my dependent variable odd generator :
For more information about simple artificial neural networks :
(detailed information about ANN )
(25 in 1 version )
I hope it helps in your analysis. Regards , Noldo .
NOTE : In the first pass bar of the definite positive and negative zone, alerts are added for both conditions.
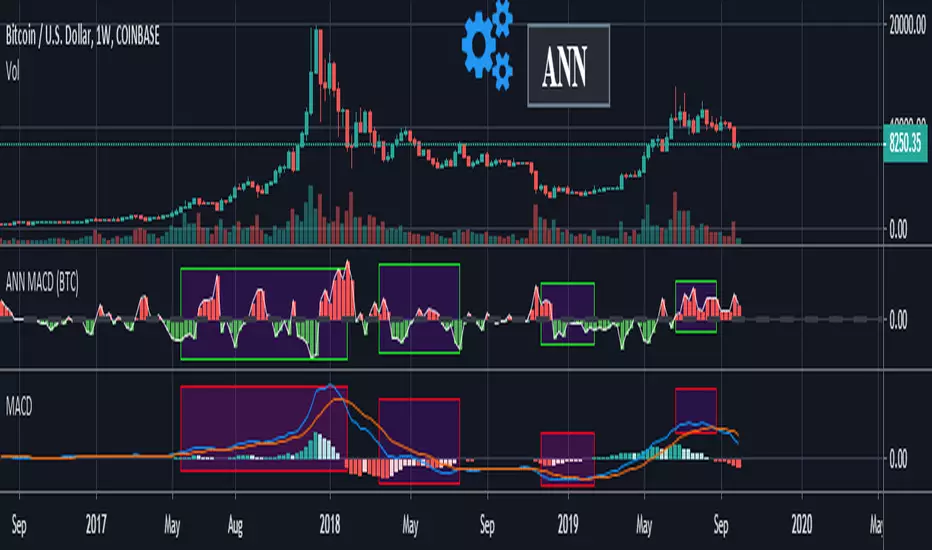
ANN MACD (BTC)
Logic is correct.
But I prefer to say experimental because the sample set is narrow. (300 columns)
Let's start:
6 inputs : Volume Change , Bollinger Low Band chg. , Bollinger Mid Band chg., Bollinger Up Band chg. , RSI change , MACD histogram change.
1 output : Future bar change (Historical)
Training timeframe : 15 mins (Analysis TF > 4 hours (My opinion))
Learning cycles : 337
Training error: 0.009999
Input columns: 6
Output columns: 1
Excluded columns: 0
Grid
Training example rows: 301
Validating example rows: 0
Querying example rows: 0
Excluded example rows: 0
Duplicated example rows: 0
Network
Input nodes connected: 6
Hidden layer 1 nodes: 8
Hidden layer 2 nodes: 0
Hidden layer 3 nodes: 0
Output nodes: 1
Learning rate : 0.6 Momentum : 0.8
More info :
EDIT : This code is open source under the MIT License. If you have any improvements or corrections to suggest, please send me a pull request via the github repository github.com
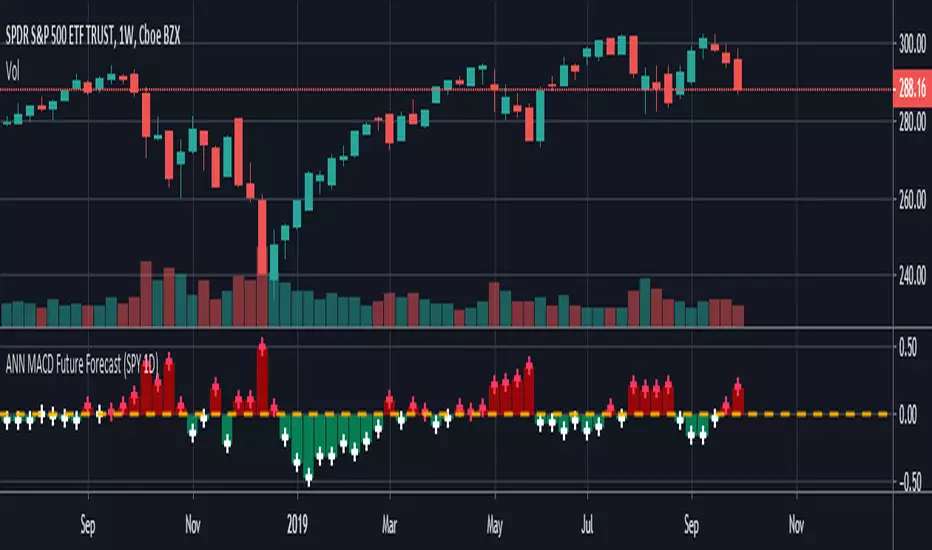
ANN MACD Future Forecast (SPY 1D) NOTE : Deep learning was conducted in a narrow sample set for testing purposes. So this script is Experimental .
This system is based on the following article and is inspired by an external program:
hackernoon.com
None of the artificial neural networks in Tradingview work and are not based on completely correct logic. Unlike others in this system:
IMPORTANT NOTE: If the tangent activation function is used, the input data must also have tangent values (compared to the previous values of 1 bar).
Inputs were prepared according to this judgment.
1. The tangent function which is the activation function is written correctly. (The tangent function in the article: ActivationFunctionTanh (v) => (1 - exp (-2 * v)) / (1 + exp (-2 * v)))
2. Missing bias parts in the formulas were added.
3. The output function is taken from the next day (historical), so that the next bar can be predicted, which is the truth.
4.The forecast value of the next bar is subtracted from the current bar change and the market direction is determined.
5.When the future forecast and the current close are added together, the resulting data is called seed.
The seed carries data both from the present and from yesterday and from the future.
6.And this seed was subjected to the MACD method.
Thus, due to exponential averages, more importance will be given to recent developments and
The acceleration situations will show us the direction.
However, a short position should be taken for crossover and a long position for crossunder .
Because the predicted values work in reverse.Even though we use the same period (9,12,26) it is much faster!
7. There is no future code that can cause Repaint.
However, the color after closing should be checked.
The system is completely correct.
However, a very narrow sample was selected.
100 data: Tangent diffs ; volume change, bollinger bands values changes (Upband , Midband , Lowband) and LazyBear's Squeeze Momentum Indicator (SQZMOM_LB) change and the next bar data (historical) price change were put into the deep learning test.
IMPORTANT NOTE : The larger the sample set and the more effective dependent variables, the higher the hit rate of the deep learning test!
EDIT : This code is open source under the MIT License. If you have any improvements or corrections to suggest, please send me a pull request via the github repository github.com
Stay tuned. Best regards!
Auto Squeeze Breakout BarsThe Auto Squeeze Breakout Bars find bars that are breaking out of a low volatility environment into a high volatility environment.
The Squeeze shading is signaled when the volatility of the asset is very low. Then the Squeeze Breakout Bars are signaled when the asset is breaking out of this low volatility structure.
Warning bars will be signaled when it is approaching a breakout, but the conditions are not fully met at that very time.
The Auto Squeeze Breakout Bar indicator also has a built in stop loss mechanic that can be set to your preferred limit.
Stop losses are highly recommended when using the breakout bars because of possible head fakes. They are rare, but can occur depending on the asset you are trading.
For Access or Questions: Private message us. Thank you.

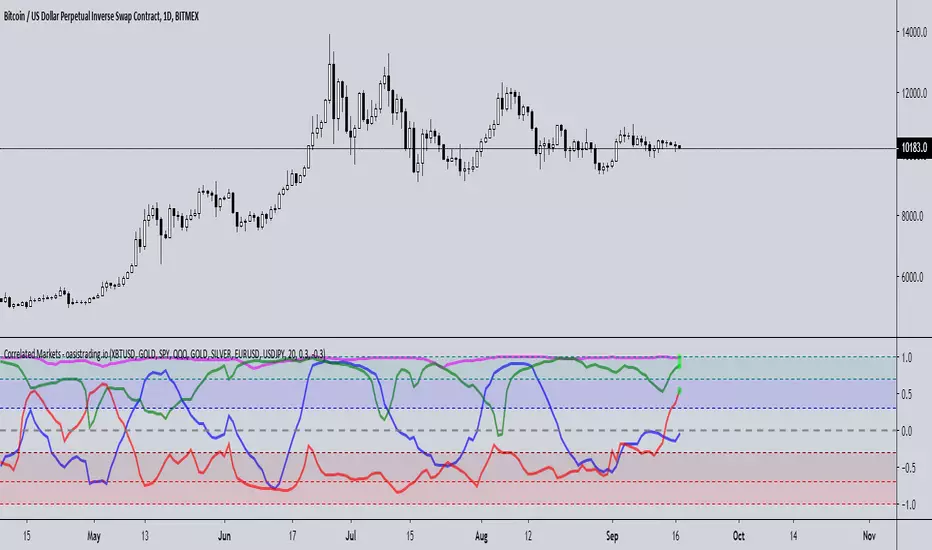
Correlated MarketsThis indicator is free to all Oasis Trading Group members.
This indicator reads correlations between two symbols of your choice, and displays 4 correlations at the same time.
The upper and lower thresholds are user-definable, alerts and visual indications are given when the line crosses the level.
This indicator uses a correlation coefficient which ranges between -1.0 and +1.0.
A correlation of +1.0 implies a perfect correlation while -1.0 implies the two pairs are in complete opposition.
This is useful not only in Forex trading but also for managing or diversifying your portfolio or for finding patterns,
for example when two Forex pairs move independently or an altcoin splits from BTC .
A circle on the +1 line will display for a positive correlation (or whatever you set the threshold to and vice versa for the -1 line.
Alerts are also available for each correlation pair.
For Access or Questions: Private message us. Thank you.
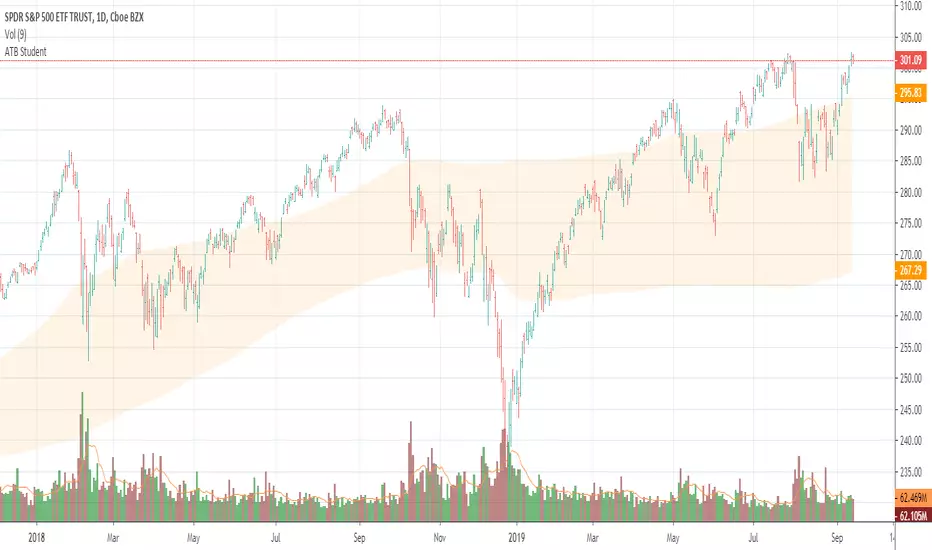
Apex Transformation Band StudentApex Transformation Band Student Version
Gauge the mean range of price on an annual/yearly basis of the market.
Determine if price is in an uptrend (above the zone), neutral (inside the zone) or downtrend (below the zone).
Works on 'Daily' time frame only.
Works only for SPY , QQQ , DIA , IWM , GLD , SLV , TLT and BTCUSD
Keep it simple.
AutoClimate█ OVERVIEW:
AutoClimate is a trading tool designed to help you identify the ideal market environment for trading - whether you should go long, short or simply avoid trading. AutoClimate simplifies market analysis and helps you make informed trading decisions.
█ CONCEPTS:
AutoClimate helps you assess the current market environment and plan your trades accordingly
The tool is named AutoClimate because it identifies the prevailing market conditions - the "climate" - to help you make better trading decisions
AutoClimate adapts to your desired trade duration, whether it be for position, swing or intraday trades, based on the time interval selected
█ WITH MORE DETAIL:
AutoClimate is a tool used in trading to analyze market conditions and make informed decisions. It provides information about three key aspects: direction, sustainability, and volatility. The direction component focuses on the current climate and helps determine whether it is an up or down climate. The sustainability component measures how long a particular climate is expected to last based on statistical analysis. The volatility component assesses the distance between the current price and an average trading price.
By using AutoClimate, traders can gain valuable insights into market behavior and make more informed trading decisions. The tool takes into account statistical probabilities and provides objective data rather than relying on personal beliefs or external factors. This can be useful for all sort of trading styles, as it helps traders with their directional decisions based on the expected duration of a climate. Traders can consider the direction, sustainability, and volatility components to assess the overall market conditions and adjust their strategies accordingly.
Understanding the sustainability stats allows traders to gauge the expected duration of a climate. For example, if the sustainability stat suggests that up-climates tend to last eight bars, it provides a statistical probability for traders to consider when planning their trades or exiting them. Similarly, if the sustainability stat for down-climates indicates a duration of seven bars, traders can make decisions based on the likelihood of a sustained downward movement.
The value of AutoClimate lies in its ability to provide objective and quantifiable information about market conditions. It helps traders make more informed and data-driven decisions, reducing reliance on subjective interpretations or external influences.
█ BEHIND THE SCENES:
AutoClimate employs a systematic approach to comprehensively evaluate the prevailing market conditions. By closely examining the intricate dynamics of price action, AutoClimate discerns the presence of a distinct directional component and further quantifies the nature of these movements to ascertain whether the market is exhibiting impulsive trends or corrective patterns. During the initial phase of analysis, AutoClimate places considerable emphasis on determining the stability of the prevailing trend, aiming to identify the existence of a robust and consistent trajectory.
AutoClimate employs a scientific methodology to comprehend the robustness and trajectory of a trend. By utilizing exponential moving averages and scrutinizing price range extensions, AutoClimate endeavors to discern whether the market is experiencing an upward or downward shift and the intensity of such movements, thereby distinguishing between impulsive and corrective phases.
The examination of upper range measurements enables AutoClimate to gauge the potency of upward price movements. Remarkably elevated values in this context signify the presence of considerable positive momentum, emanating from heightened buying pressure within the market.
Similarly, the assessment of lower range measurements permits AutoClimate to assess the strength of downward price movements. Elevated values in this aspect indicate the existence of substantial negative momentum, stemming from intensified selling pressure within the market.
Convergence of data derived from moving averages and price range extensions plays a pivotal role in AutoClimate's analysis. When information from these diverse sources aligns harmoniously, it substantiates the confirmation of a trend, lending greater confidence to the assessment.
However, the scope of AutoClimate extends far beyond this assessment. It diligently accumulates an extensive array of data, which is then meticulously processed through a sophisticated statistical model, facilitating a deeper understanding of the market's inherent characteristics. Two key dimensions, namely "climate duration" and "max. distance" are rigorously analyzed and quantified within this statistical framework. The climate duration metric endeavors to encapsulate the projected lifespan of a specific market condition, shedding light on the anticipated longevity of prevailing trends or patterns. Conversely, the max. distance metric gauges the extent to which prices deviate from established benchmarks, enabling users of AutoClimate to gauge the likelihood of an ongoing market condition persisting or undergoing transformation.
The benchmarks are set to 1 Standard Deviation for Climate Duration and 2 Standard Deviations for Max. Distance.
By harnessing these intricate statistical models, AutoClimate empowers its users with a rigorous and scientific approach to evaluate the durability and potential stability of a given market condition.
█ FEATURES:
User-friendly interface that simplifies market analysis
Clear, intuitive indicator that provide a visual representation of the market environment
Customizable settings to adapt to your trading style and preferences
Compatible with various markets and timeframes
Regular updates and enhancements to ensure the tool remains effective and relevant
█ HOW TO USE:
Follow the author’s instructions to request access to this invite-only script or follow the links in the vendor’s signature field that appears under this description
Add AutoClimate to your TradingView chart by clicking on Indicators > Invite-only scripts > AutoClimate
Select the market and timeframe you want to analyze and make sure you have adjusted the calibration settings to your liking
Begin assessing the current market environment (climate)
Plan your trades based on the market conditions identified by AutoClimate and the rules of your trading plan
We strongly recommend you to read the HOW-TO idea on " HOW-TO Determine If It Is Time To Buy Or Sell With AutoClimate " which is linked below as a related idea
█ LIMITATIONS:
AutoClimate should not be used as the sole basis for trading decisions
The tool is not infallible and should be used in conjunction with other market analysis tools, especially when it comes to defining entry and exit prices, for which we prefer AutoUFOs
Thank you for considering AutoClimate as your ultimate market environment indicator. We hope it enhances your trading experience and leads to greater success in your trades
═════════════════════════════════════════════════════════════════════════
Disclaimer: Trading involves risk and each investor/trader must determine if it is a suitable investment. Past performance is not indicative of future results. You accept responsibility for your actions and agree not to hold the author/developer liable for any outcomes.
No Service Guarantee: The author/developer makes no guarantee that the TradingView indicators and services will be uninterrupted, timely, secure, accurate, or error-free. The market data may be delayed, inaccurate, or contain errors, and the developer is not liable for any issues that arise.
Calibration: The user is responsible for calibrating the indicator as different parameters can produce different results. The author/developer is not responsible for any outcomes resulting from the user's calibration.
Testimonials: Testimonials are subjective and not independently verified.

Bar RatioBar Ratio is an indicator tool that provides real-time likelihood of the current bar closing up or down (green or red).
Technical status, volatility and time are key elements in this indicator.
From the open of a bar, a ratio of 50% is assumed before changes from factors are considered.
The factors that change the likelihood of a bar closing up or down and their relative weight are listed below.
Micro-Trend observed over the last 20 bars - up to 2.5%
Macro-Trend observed over the last 70 bars - up to 2.5%
Current bar price against beginning of Micro-Trend - up to 2.5%
Combination of significant change above average volatility and move against direction of Micro-Trend - up to 2.5%
Combination of significant change above average volatility and move against direction of Macro-Trend - up to 2.5%
Previous bar direction up to 10 consecutive bars - up to 3.75%
Current status of bar (higher or lower) - up to 3.75%
Significance of change against average volatility - up to 5%
Time until bar close - up to 25%
Total: 100%
If all factors are synchronised, the likelihood of the bar closing up or down can be indicated at a probability of 100%.
While the practical ability for this to be used for trading is limited, the tool can be useful for choosing when it is safe to open a trade.
Time is a key element as the likelihood of the bar remaining at current status by the close of the bar is constantly increasing.
The accuracy of this tool is incredible and should be noted as it's primary trait.
You can find and use this indicator on any time-stamp or security such as Cryptocurrency, Forex, Stocks or Indices.
The Bar Ratio can be located by searching in your public indicator library at the top of your chart and adding it to your screen.

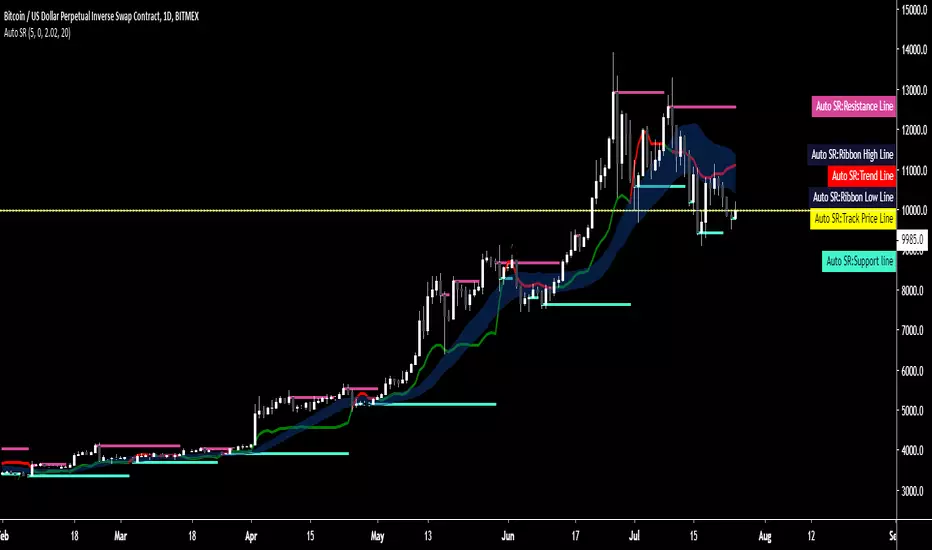
Auto SR - Automatic Support & ResistanceAuto SR is an indicator for TradingView™ which automatically searches and prints key support and resistance levels.
Its strength lies within its ability to provide visualization in real-time to aid in your trading.
It's a versatile indicator suitable for both short or long time frames and has a precision of 8 decimal points, therefore making it suitable for any market type.
A trend line shows a shift in major trends while a ribbon shows you shifts in smaller trends and indications are given for break and re-entry of both support and resistance levels.
All conditions are coupled with their own alerts, giving you the option to integrate it into your trading system or receive alerts on-the-fly.
Tried, true and tested for over one year, Auto SR has already become a trusted staple of those who've experienced it.
As a standalone system or an addition to your existing strategy, Auto SR has what it takes to elevate your trading to the next level.
Key Features:
- Automatic charting of support and resistance lines charted in real-time, no repainting.
- Major and minor trend detection
- Full alerts for support and resistance forming, price exiting or re-entering lines, trend shifts and more.
DBT MoMo v.4DBT MOMO
Introduction: The MoMo is a TradingView indicator designed to evaluate momentum and give the user signals according to momentum shifts, strength, extensions, traps, and divergence. It’s an all in one oscillator that will make reading price action near term and long term much easier.
Part One: Strength
The MoMo consist of two major parts. A 3-candle back formula and a 24-candle back formula. The 3-candle back is called the Price Line (the histogram on the MoMo). The 24-candle back is called the Trend Line (the line on the MoMo). Both lines are placed into a range from 20 to -20. It can go higher than 20 or lower than -20, but this is extremely rare and short lived.
A positive number indicates a bullish bias, a negative number indicates a bearish bias. When the Price or Trend line are ascending while below 0 this indicates that the bearish momentum is weakening. When the Price or Trend line are descending while above 0 this indicates that the bullish momentum is weakening.
In a strong trend the Trend Line will likely flatten out around 15 or -15. While the Trend Line is flat the Price Line will likely shift rapidly, this can lead to bull and bear traps, we will discuss this in the Trap section.
A rare, but powerful signal from the MoMo is when the Price and Trend Lines “pinch” and begin to move in the same direction. If this is happening the trader should be looking to follow the direction of these lines.
Part Two: Extensions
When both Price and Trend Lines are above 10 or below -10 this will begin to signal an extension.
Purple: Indicates the bears are extended to the downside and a pullback or trend reversal upward is likely.
Gold: Indicates the bulls are extended to the upside and a pullback or trend reversal downward is likely.
When only the Trend Line is above 10 the MoMo will shade the upper range red. This indicates the Trend is becoming bullish or entering an extension. If the Trend Line cannot maintain above 10 for long and breaks below 10 this indicates it’s an extension and trend will most likely continue downward.
When only the Trend Line is below -10 the MoMo will shade the upper range green. This indicates the Trend is becoming bearish or entering an extension. If the Trend Line cannot maintain below -10 for long and breaks above -10 this indicates it’s an extension and trend will most likely continue upward.
When the green or purple shading have turned off take the lowest point, this is considered a support level or a local bottom.
When the red or gold shading have turned off take the highest point, this is considered a resistance level or a local top.
The trader can preemptively trade the purple or gold warnings but be warned these warnings can go on for a long time if the trend is very strong. It is the same mentality of an overbought or oversold RSI, except the MoMo extensions have a much higher strike rate.
To avoid preemptively trading these extensions the trader should wait for confirmation on the Price Line and on price action. The Price Line (histogram) should be moving upward during a purple extension to begin showing a bottom. The Price Line (histogram) should be moving downward during the gold extension to begin showing a top.
Part Three: Traps
The relation between the Price Line and Trend Line can create trading signals for bull and bear traps. When the Trend Line is flattened out around 15 or -15, indicating a strong trend is in place, and the Price Line is rapidly moving towards the midline this may indicate a trap is forming.
When the Trend Line is flat around 15 and the Price Line begins moving towards 0, if the Price Line reaches 0 or close to 0 and the Trend Line is still flat, a trap has begone. Once the Price Line shifts from decreasing (red) to increasing (green) the trap is playing out. Therefore, the trader should look to exit short positions or enter long positions.
When the Trend Line is flat around -15 and the Price Line begins moving towards 0, if the Price Line reaches 0 or close to 0 and the Trend Line is still flat, a trap has begone. Once the Price Line shifts from increasing (green) to decreasing (red) the trap is playing out. Therefore, the trader should look to exit long positions or enter short positions.
Part Four: Divergences
The MoMo is exceptional at finding divergences with the Price Line and occasionally the Trend Line.
To find a divergence with the MoMo the trader must look for when the histogram is not following price action completely.
Bullish Divergence: Price makes a lower low, MoMo makes a higher low.
Bearish Divergence: Price makes a higher high, MoMo makes a lower high.
Hidden Bull Divergence: Price makes a higher low, MoMo makes a lower low.
Hidden Bear Divergence: Price makes a lower high, MoMo makes a higher high.
For Access or Questions: Private message us. Thank you.

Oasis Trading Suite LiteOasis Trading Suite Lite
Introduction: The Oasis Trading Suite is a TradingView indicator designed to make following trend and finding key pivot points very easy. It provides the trader with advanced trend coloring for candles, pivot points both high and low, and a trail that will follow price and give signals when a “buy the dip” or “sell the rally” opportunity is presented. This is a Lite version that only showcases the candle coloring.
Part One: Candle Coloring
The Oasis Trading Suite colors candles based on a trending bullish or bearish bias; this will override the default red/green coloring of candles which is based on closes.
Bullish Candles will be denoted with a green color by default.
Bearish Candles will be denoted with a red color by default.
Neutral Candles will be denoted with a gray candle by default. These are candles that do not have a trending bias.
For Access or Questions: Private message us. Thank you.
For the Full Version go here.

Oasis Trading SuiteOasis Trading Suite
Introduction: The Oasis Trading Suite is a TradingView indicator designed to make following trend and finding key pivot points very easy. It provides the trader with advanced trend coloring for candles, pivot points both high and low, and a trail that will follow price and give signals when a “buy the dip” or “sell the rally” opportunity is presented.
Part One: Candle Coloring
The Oasis Trading Suite colors candles based on a trending bullish or bearish bias; this will override the default red/green coloring of candles which is based on closes.
Bullish Candles will be denoted with a green color by default.
Bearish Candles will be denoted with a red color by default.
Neutral Candles will be denoted with a gray candle by default. These are candles that do not have a trending bias.
Part Two: Pivots
In addition to the normal red/green/gray candles there are also blue and orange candles. These candles are pivot bars.
Blue bars denote Bottom Pivots
Orange bars denote Top Pivots
These pivots are not exactly support and resistance, but more of a zone of influence. They can act as support and resistance, swing zones, and breakout points. These are not standard pivots, they do not repaint, they form live and once closed will not move candles.
Part Three: Trail
Finally, the Oasis Trading Suite gives the trader a trailing line that will turn green or red depending on trend. If price falls to the trail and the low (for green trail) is the only thing below the trail it will give a “buy the dip” signal. If the high (for red trail) is the only thing above the trail it will give a “sell the rally” signal. This trail is slightly lagging, so when trend is shifting there will sometimes be false signals at the final shifting point. I am experimenting with removing as many as possible using the “Strict Mode” found in the input settings for the Oasis Trading Suite.
Buy the Dip will be denoted by a Blue Arrow
Sell the Rally will be denoted by an Orange Arrow
For Access or Questions: Private message us. Thank you.

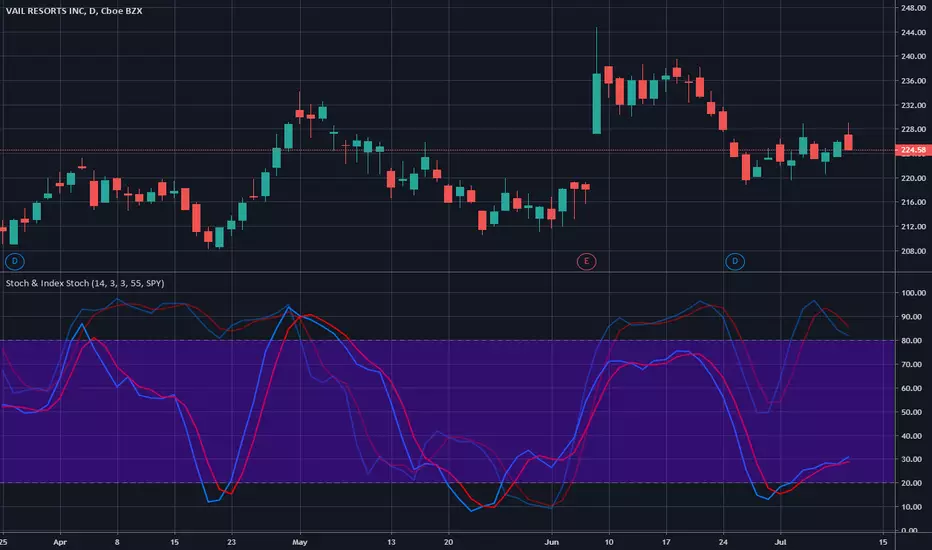
Stochastic & Index StochasticUsing this indicator you will be able to use the standard stochastic of a stock ticker as well as the stochastic of a stock market index simultaneously and without changing charts - both stochastics combined in only one indicator.
The stock market index stochastic can be changed in the indicator settings and is displayed with higher transparency. The degree of transparency and default color settings can also be adjusted.
For special analysis purposes, it is possible to display only the stochastic of the selected stock ticker or only the stochastic of the selected stock market index.
If you would like to test or use this indicator please drop me a line and send a request for it.