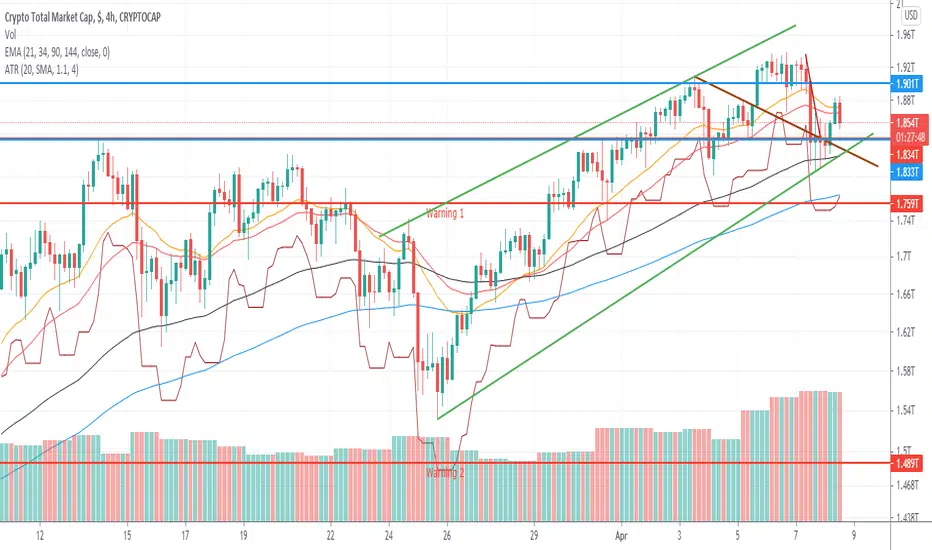
ATR Trailing Stop Loss IndicatorI rely on this script for both my live trading and my backtesting process. I couldn’t live without it. It’s extremely simple – all it does is calculate your trailing stop price.
How It Works
The first number in blue is the current ATR (pips). The second number in green is your trailing stop loss price for Long trades, and the third number in red is your trailing stop loss price for Short trades.
For short trades, the stop loss price is calculated by adding the current ATR value to the highest-high of the given lookback period.
For long trades, the stop loss price is calculated by subtracting the current ATR value from the lowest-low of the given lookback period.
Settings
ATR Length:
ATR period (how many candles to include in the calculation).
Use Structure?
If set to true, the script will use swing lows and highs in its calculation. If set to false, the script will ignore swing lows and highs and give you the distance of the ATR from the current candle close instead.
How Far To Look Back For High/Lows:
Candle lookback period for swing high/lows.
ATR X ?:
This controls your ATR multiplier. For example, if you want to use a 2x ATR stop, set this to 2.
Chart Companion:
Here is the chart companion script for this indicator:
Source Code:
Go to zenandtheartoftrading.com for the source code – it’s free!
חפש סקריפטים עבור "stop loss"
Trailing Stop Loss MTFMultiple Time Frame Version of Trailing Stop Loss Indicator
TRAILING STOP LOSS INDICATOR is a helpful tool for traders to help one of the greatest problems that they face: where to sell?
by using trailing stop loss you can easily decide and see possible downward movements and understand if you are in a safe zone.
Using Trailing Stop Loss is just simple:
Go short/ Sell when price crosses down the indicator,
Stay on long position if prices are above the indicator.
The indicator is calculated from previous Lows and doesn't the value won't change until prices makes higher lows.
TURKISH EXPLANATION:
İz Süren Stop Loss İndikatörü
Adım 1- bu günün düşük fiyatından geriye doğru, daha düşük fiyatlı bir günle karşılaşıncaya kadar yatay bir çizgi çizin
bu sizin birinci countback’ iniz olacak.
Adım 2- bu yeni düşük günün düşük fiyatından geriye doğru tekrar bir başka düşük güne gelene kadar yatay bir çizgi
çekin. Bu sizin ikinci countback’ iniz olacak.
Adım 3- bu ikinci düşük günün düşüğünden ileri bu günkü tarihe kadar yatay bir çizgi çekin bu sizin talimat
verdiğinizde stop-loss noktanız oluyor.
Kural 1- asla aşağıya doğru stop koymayın. Eğer yeni stop-loss noktanız öncekinden daha düşükse onu atıyorsunuz.
Bu kural asla bozulmamalı.
Kural 2- countback çizginiz üzerindeki aynı düşük fiyata denk gelen günleri yok sayın. İkinci contback çizginizi çekmek
için ilkinden daha düşük bir nokta bulmalısınız. Eğer aynı düşük fiyata sahip bir çubuğa denk gelirseniz daha düşüğünü
buluncaya kadar devam edin. Gerçekten hepsi bu kadar. Bu kuralları uygulayarak stop-loss noktamızı her yeni günün
datası eklendikçe uzatabiliriz.
drive.google.com

Trailing Stop Loss Indicator by KıvanÇ fr3762TRAILING STOP LOSS INDICATOR is a helpful tool for traders to help one of the greatest problems that they face: where to sell?
by using trailing stop loss you can easily decide and see possible downward movements and understand if you are in a safe zone.
Using Trailing Stop Loss is just simple:
Go short/ Sell when price crosses down the indicator,
Stay on long position if prices are above the indicator.
The indicator is calculated from previous Lows and doesn't the value won't change until prices makes higher lows.
TURKISH EXPLANATION:
İz Süren Stop Loss İndikatörü
Adım 1- bu günün düşük fiyatından geriye doğru, daha düşük fiyatlı bir günle karşılaşıncaya kadar yatay bir çizgi çizin
bu sizin birinci countback’ iniz olacak.
Adım 2- bu yeni düşük günün düşük fiyatından geriye doğru tekrar bir başka düşük güne gelene kadar yatay bir çizgi
çekin. Bu sizin ikinci countback’ iniz olacak.
Adım 3- bu ikinci düşük günün düşüğünden ileri bu günkü tarihe kadar yatay bir çizgi çekin bu sizin talimat
verdiğinizde stop-loss noktanız oluyor.
Kural 1- asla aşağıya doğru stop koymayın. Eğer yeni stop-loss noktanız öncekinden daha düşükse onu atıyorsunuz.
Bu kural asla bozulmamalı.
Kural 2- countback çizginiz üzerindeki aynı düşük fiyata denk gelen günleri yok sayın. İkinci contback çizginizi çekmek
için ilkinden daha düşük bir nokta bulmalısınız. Eğer aynı düşük fiyata sahip bir çubuğa denk gelirseniz daha düşüğünü
buluncaya kadar devam edin. Gerçekten hepsi bu kadar. Bu kuralları uygulayarak stop-loss noktamızı her yeni günün
datası eklendikçe uzatabiliriz.
drive.google.com
Average True Range Stop Loss Finder [MasterYodi]This indicator utilizes the Average True Range (ATR) to help traders identify optimal stop-loss levels that reduce the risk of premature exits caused by market volatility or tight stop placements. The default multiplier is set to 1.5, providing a balanced stop-loss buffer. For more conservative setups, a multiplier of 2 is recommended; for tighter risk management, use 1.
ATR values and corresponding stop-loss levels are displayed in a table at the bottom of the chart.
Use the high-based (red) level for short positions
Use the low-based (teal) level for long positions

Risk Management - Stop Loss Distance (Pips)This indicator helps traders estimate an optimal Stop Loss distance in pips based on market volatility (ATR) and a chosen risk percentage.
It does not generate buy or sell signals — it is purely a risk management visualization tool designed for educational and analytical use.
🔧 How it works
Calculates the current ATR (Average True Range) to measure market volatility.
Multiplies ATR by a user-defined factor to suggest a realistic stop-loss distance.
Displays this distance in pips, helping you understand how wide or tight your SL should be.
Optionally draws reference lines above and below the current price to visualize potential SL placement for long and short positions.
⚙️ Inputs
Account Balance (USD): Used for risk visualization.
Risk per Trade (%): Defines the percentage of account balance at risk.
ATR Period: Number of bars used to calculate volatility.
ATR Multiplier for SL: Adjusts how far the SL should be from the entry based on volatility.
Show SL Lines: Toggle visual stop-loss reference lines on or off.
📈 Display
The indicator shows:
Account balance and risk percentage.
Current ATR value.
Suggested stop-loss distance in pips.
Optional SL lines (for visualization only).
⚠️ Disclaimer
This script is for educational and analytical purposes only.
It does not provide financial advice or trade recommendations.
Use it at your own discretion and always manage risk responsibly.

Trend Score with Dynamic Stop Loss HTF
How the Trend Score System Works
This indicator uses a Trend Score (TS) to measure price momentum over time. It tracks whether price is breaking higher or lower, then sums these moves into a cumulative score to define trend direction.
⸻
1. Trend Score (+1 / -1 Mechanism)
On each new bar:
• +1 point: if the current bar breaks the previous bar’s high.
• −1 point: if the current bar breaks the previous bar’s low.
• If both happen in the same bar, they cancel each other out.
• If neither happens, the score does not change.
This creates a simple running measure of bullish vs bearish pressure.
⸻
2. Cumulative Trend Score
The Trend Score is cumulative, meaning each new +1 or -1 is added to the total score, building a continuous count.
• Rising scores = buyers are consistently pushing price to higher highs.
• Falling scores = sellers are consistently pushing price to lower lows.
This smooths out noise and helps identify persistent momentum rather than single-bar spikes.
⸻
3. Trend Flip Trigger (default = 3)
A trend flip occurs when the cumulative Trend Score changes by 3 points (default setting) in the opposite direction of the current trend.
• Bullish Flip:
• Cumulative TS rises 3 points from its most recent low pivot.
• Marks a potential start of a new uptrend.
• A bullish stop-loss (SL) is set at the most recent swing low.
• Bearish Flip:
• Cumulative TS falls 3 points from its most recent high pivot.
• Marks a potential start of a new downtrend.
• A bearish SL is set at the most recent swing high.
Example:
• TS is at -2, then climbs to +1.
• That’s a +3 change, triggering a bullish flip.
⸻
4. Visual Summary
• Green background: Active bullish trend.
• Red background: Active bearish trend.
• ▲ Triangle Up: A bullish flip occurred this bar.
• Stop Loss Line: Shows the structural low used for risk management.
⸻
Why This Matters
The Trend Score measures trend pressure simply and objectively:
• +1 / -1 mechanics track real price behavior (breakouts of highs and lows).
• Cumulative changes of 3 points act like a momentum filter, ignoring small reversals.
• This helps you see true regime shifts on higher timeframes, which is especially useful for swing trades and investing decisions.
⸻
Key Takeaways
• Only flips after meaningful swings: prevents overreacting to single-bar noise.
• SL shows invalidation point: helps you know where a trend thesis fails.
• Works best on Daily or Weekly charts: for smoother, more reliable signals. Using Trend Score for Long-Term Investing
This indicator is designed to support decision-making for higher timeframe investing, such as swing trades, multi-month positions, or even multi-year holds.
It helps you:
• Identify major bullish regimes.
• Decide when to add to winning positions (DCA up).
• Know when to pause buying or consider trimming during weak periods.
• Stay disciplined while holding long-term winners.
Important Note:
These are suggestions for context. Always combine them with your own analysis, portfolio allocation rules, and risk tolerance.
⸻
1. Start With the Higher Timeframe
• Use Weekly charts for a broad investing view.
• Use Daily charts only for fine-tuning entry points or deciding when to add.
• A Bullish Flip on Weekly suggests the market may be entering a major uptrend.
• If Weekly is bullish and Daily also turns bullish, it’s extra confirmation of strength.
⸻
2. Building a Position with DCA
Goal: Grow your position gradually during strong bullish regimes while staying aware of risk.
A. Initial Buy
• Start with a small initial allocation when a Bullish Flip appears on Weekly or Daily.
• This is just a starter position to get exposure while the new trend develops.
B. Adding Through Strength (DCA Up)
• Consider adding during pullbacks, as long as price stays above the active SL line.
• Each add should be smaller or equal to your first buy.
• Spread out adds over time or price levels, instead of going all-in at once.
C. Pause Buying When:
• Price approaches or touches the SL level (trend invalidation).
• A Bearish Flip appears on Weekly or Daily — this signals potential weakness.
• Your total position size reaches your maximum allocation limit for that asset.
⸻
3. Holding Winners
When a position grows in profit:
• Stay in the trend as long as the Weekly regime remains bullish.
• The indicator’s green background acts as a reminder to hold, not panic sell.
• Use the SL bubble to monitor where the trend could potentially break.
• Avoid selling just because of small pullbacks — focus on big-picture trend health.
⸻
4. Taking Partial Profits
While this tool is designed to help hold long-term winners, there may be times to lighten risk:
• After large, rapid moves far above the SL, consider trimming a small portion of your position.
• When MFE (Maximum Favorable Excursion) in the table reaches unusually high levels, it may signal overextension.
• If the Weekly chart turns Neutral or Bearish, you can gradually reduce exposure while waiting for the next Bullish Flip.
⸻
5. Using the Stop Loss Line for Awareness
The Dynamic SL line represents a structural level that, if broken, may suggest the bullish trend is weakening.
How to think about it:
• Above SL: Market remains structurally healthy — continue holding or adding gradually.
• Close to SL: Pause adds. Be cautious and consider tightening your risk.
• Below SL: Treat this as a potential signal to reassess your position, especially if the break is confirmed on Weekly.
The SL is not a hard stop — it’s a visual guide to help you manage expectations.
⸻
6. Example Use Case
Imagine you are investing in a growth stock:
• Weekly Bullish Flip: You open a small starter position.
• Price pulls back slightly but stays above SL: You add a second, smaller tranche.
• Trend continues up for months: You hold and stop adding once your desired allocation is reached.
• Price doubles: You trim 10–20% to lock some profits, but continue holding the majority.
• Price later dips below SL: You slow down, reassess, and decide whether to reduce exposure.
This keeps you:
• Participating in major uptrends.
• Avoiding overcommitment during weak phases.
• Making adjustments gradually, not emotionally.
⸻
7. Suggested Workflow
1. Check Weekly chart → is it Bullish?
2. If yes, review Daily chart to fine-tune entry or adds.
3. Build exposure gradually while Weekly remains bullish.
4. Watch SL bubbles as awareness points for risk management.
5. Use partial trims during big rallies, but avoid exiting entirely too soon.
6. Reassess if Weekly turns Neutral or Bearish.
⸻
Key Takeaways
• Use this as a compass, not a command system.
• Weekly flips = big picture direction.
• Daily flips = timing and precision.
• Add gradually (DCA) while above SL, pause near SL, reassess below SL.
• Hold winners as long as Weekly remains bullish.

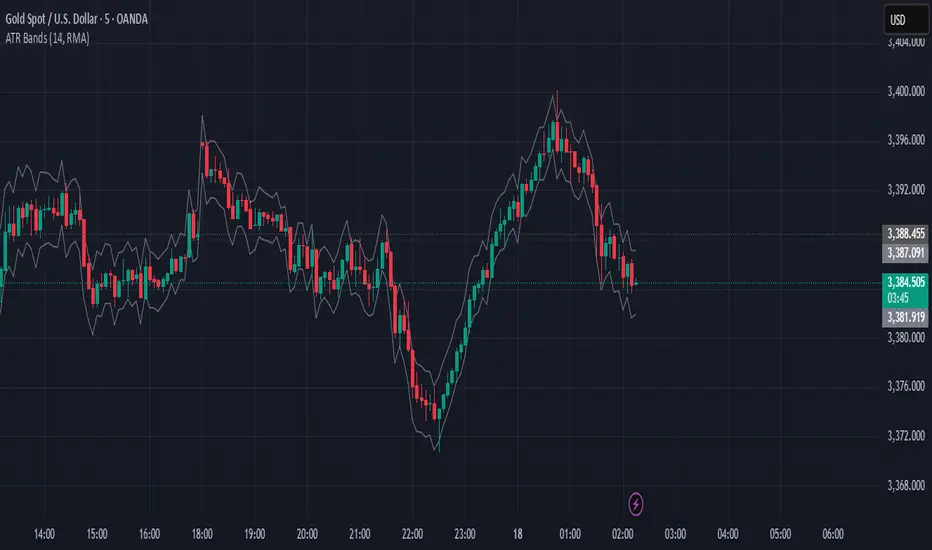
ATR Stop Loss BandsATR Stop Loss Bands Indicator
Overview
The ATR Stop Loss Bands indicator creates dynamic support and resistance levels based on the Average True Range (ATR), providing traders with volatility-adjusted price bands that can be used for stop loss placement and trend analysis.
How It Works
This indicator calculates two bands around the current closing price using the ATR value:
Upper Band: Close price + ATR value
Lower Band: Close price - ATR value
The bands automatically adjust to market volatility, expanding during volatile periods and contracting during calmer market conditions.
Key Features
Customizable ATR Period: Default 14-period length (adjustable from 1 to any desired value)
Multiple Smoothing Options: Choose from RMA (default), SMA, EMA, or WMA for ATR calculation
Dynamic Volatility Adjustment: Bands automatically adapt to current market volatility
Clean Visual Design: Gray bands that don't clutter your chart
Trading Applications
Stop Loss Placement: Use the bands as dynamic stop loss levels - long positions might use the lower band as a stop, while short positions could use the upper band
Volatility Assessment: Wide bands indicate high volatility periods, narrow bands suggest low volatility
Breakout Identification: Price movements beyond the bands may signal potential breakouts or trend changes
Support/Resistance Levels: The bands can act as dynamic support and resistance zones
Settings
Length: ATR calculation period (default: 14)
Smoothing: Method for ATR smoothing (RMA, SMA, EMA, or WMA)
Best Practices
Use in conjunction with other technical analysis tools for confirmation
Consider the overall trend direction when interpreting band breaks
Adjust the length parameter based on your trading timeframe and strategy
Remember that ATR bands are reactive, not predictive - they respond to price movements rather than forecasting them
This indicator is particularly useful for traders who want to incorporate market volatility into their risk management and entry/exit decisions.
ATR Stop-Loss & TargetsATR and Supertrend-based SL/TP & Trailing System
This indicator combines Average True Range (ATR) and Supertrend logic to help traders define precise stop-loss, first target, and trailing stop-loss (TSL) levels.
⚙️ Key Features:
📏 ATR-based Stop-Loss & Target Lines:
Uses ATR (default period: 5) based on the previous day's candle for more stable risk management.
Traders can choose the price source: Close, Open, or enter a manual price.
SL and first target are calculated using multipliers:
Multiplier 1 = Stop Loss
Multiplier 2 = First Target
📉 Supertrend for Trailing Stop:
Built-in Supertrend logic for trailing stop-loss management.
Uses ATR(10) with a multiplier of 2.1, based on HL2.
Supertrend can be toggled ON/OFF from the settings.

ATR Stop Loss Zones [ziksfx]The indicator is a dynamic tool that helps traders identify potential stop-loss levels in trending markets. It calculates the Average True Range (ATR) and uses it to create upper and lower boxes around the closing price. These boxes visually represent potential stop-loss zones for long and short positions.
Originality and Usefulness:
This indicator stands out for its unique ability to dynamically adjust stop-loss zones based on market volatility using the ATR approach. This provides traders with a flexible and adaptable risk management tool that adapts to changing market conditions. By visually representing potential stop-loss levels, taking into account the inherent uncertainty of market movements, the indicator empowers traders to make informed decisions about placing stop loses ONLY in trend markets. This allows them to maximize profit potential while minimizing potential downside risk.
Functionality:
Calculates the ATR based on the closing price.
Creates upper and lower of box by adding and subtracting the ATR multiplied by a predefined multiplier (1.5) to the closing price, then generates dynamic boxes based on the upper and lower ATR values.
Indicator allows traders to choose to display boxes for long, short, or both positions simultaneously.
Enables customization of box colors to suit individual preferences and trading styles.
Can be used as a dynamic trailing stop-loss mechanism.
Long box: Enable or disable the display of box for long positions.
Short box: Enable or disable the display of box for short positions.
Color Long Box: Set the color of the box for long positions.
Color Short Box: Set the color of the box for short positions.
Disclaimer:
This information is for educational purposes only and should not be considered financial advice. Remember that trading involves risk, and you could lose money. Always do your own research and consult with a financial professional before making any investment decisions.

Take profit and Stop Loss ATR HL [Tcs] | ALGOThis indicator helps traders set stop loss and take profit levels based on either ATR or High-Low range.
The indicator calculates stop loss and take profit levels for both long and short positions, based on the user's input of ATR length, ATR smoothing method, and multiplier levels for each level. It’s possible to set 3 levels of take profit, for both long and short trades.
The indicator also includes the option to show or hide levels, bands, and labels for the calculated stop loss and take profit levels.
Additionally, the indicator has a function to calculate the user's risk based on their account balance, risk percentage, and broker fees.
Overall, this indicator can be helpful for traders who use stop loss and take profit levels in their trading strategies and want a visual representation of those levels on their charts.
Please note that this indicator is for educational purposes only and should not be used for trading without further testing and analysis.

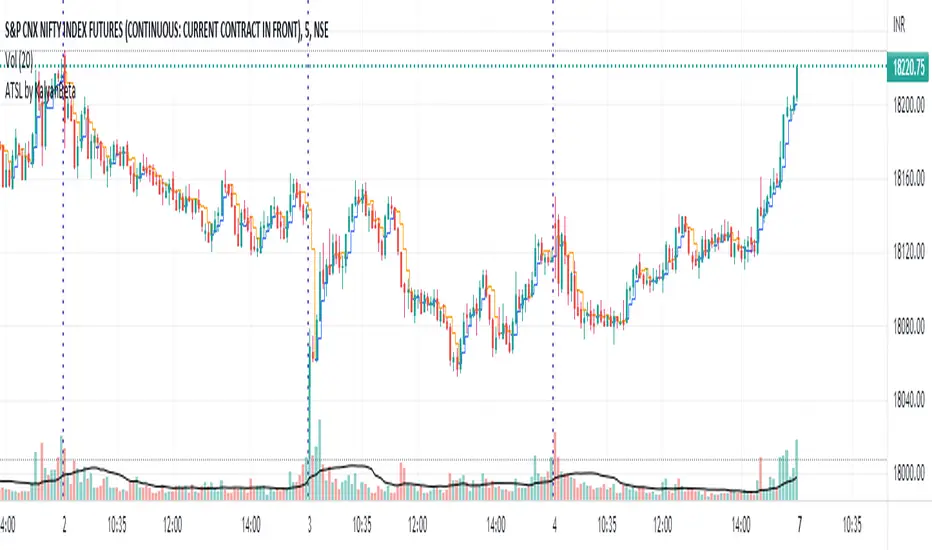
Anti-trap Trailing Stop Loss by KalyanBetaAnti-trap Trailing Stop Loss by KalyanBeta or ATSL
ATSL changes color when there it identifies price manipulation/ SL Hunting / Traps by Smart Money.
Change in color may be an exit signal for your trade in current direction.
This is a very simple indicator which can be used to predict Traps or Stop-loss hunting.
This can help in Trailing Stop-loss and in Exit decisions along with your own strategy.
ATSL may be used in all timeframes.
Please back-test it along with your strategy and then use it for Trailing the Stop-loss without getting trapped by operators and stop-loss hunters.
All the best.
Do post your feedback in comments below. Thank you.
Average True Range with stop loss and take profit finderBased on the official original average true volatility (ATR), two functions have been extended.
Users can see the suggested stop loss and take profit parameters when entering a long or short order with each K-line.
Part of the settings:
Length: The preset is 14 K lines, which can help you grab the suggested stop loss point.
Long-short single profit-loss ratio: After entering the value of the profit-loss ratio (floating point) you want, it will automatically convert and calculate the past take-profit point.
The five values displayed on the chart are from left to right: ATR, Short Stop Loss, Long Stop Loss, Short Take Profit, and Long Take Profit.
Rob Hoffman's 50/80/90/Price Trailing Stop LossA trailing stop loss method by Rob Hoffman.
Set your entry, TP, and SL.
Once price is 50% of its way to the TP, set your stop loss at the gray line.
Once price is 80% of its way to the TP, set your stop loss at the light gray line.
Once price is 90% of its way to the TP set your stop loss at the white line.

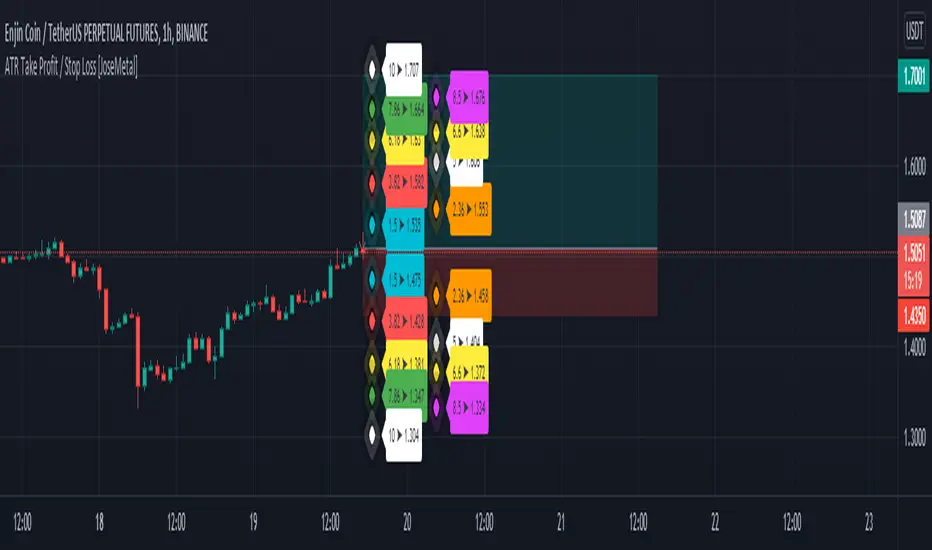
ATR Take Profit / Stop Loss [JoseMetal]============
ENGLISH
============
- Description:
This indicator is based on ATR to print current ATR multiple values for Take Profits or Stop Loss levels, it's real time, so you can use the replay feature to test it or calculate these levels anytime on any candle.
Therefore, levels are calculated by multiplying the ATR by the level multiplier.
- Visual:
Both a "diamond" and label with the ATR multiplier and price value are printed for each level.
Each level has a color for both, diamond and label to make it easier to read.
The levels are split in 2 columns for better visualization.
- Usage and recommendations:
Fibonacci's levels are used for default, but you can customize them as you like.
I usually take 3.82 level (red by default) as stop loss, and I take profit every 2 levels depending on the timeframe, is good to let a small part run until break even or ATR 10 (last level).
- Customization:
Custom ATR period, 10 is default.
Each level has custom multiplier and level.
Customizable offset for diamonds and labels.
Custom precision for prices (because it greatly depends on the asset you're working with).
============
ESPAÑOL
============
- Descripción:
Este indicador se basa en el ATR para mostrar múltiples niveles de Take Profits o Stop Loss, es en tiempo real, por lo que se puede utilizar la función de repetición para probarlo o calcular estos niveles en cualquier momento y en cualquier vela.
Por lo tanto, los niveles se calculan multiplicando el ATR por el multiplicador del nivel.
- Visual:
Tanto un "diamante" como una etiqueta con el multiplicador ATR y el valor del precio se imprimen para cada nivel.
Cada nivel tiene un color tanto para el diamante como para la etiqueta para facilitar su lectura.
Los niveles están divididos en 2 columnas para una mejor visualización.
- Uso y recomendaciones:
Se usan los niveles de Fibonacci defecto, pero puedes personalizarlos como quieras.
Yo suelo usar el nivel 3.82 (rojo por defecto) como stop loss, y tomo beneficios cada 2 niveles dependiendo de la temporalidad, es bueno dejar correr una pequeña parte hasta el break even o ATR 10 (último nivel).
- Personalización:
Periodo ATR personalizable, 10 es el predeterminado.
Cada nivel tiene multiplicador y nivel personalizables.
Desplazamiento (offset) personalizable para los diamantes y las etiquetas.
Precisión para decimales personalizada (porque depende mucho del activo con el que se trabaje).
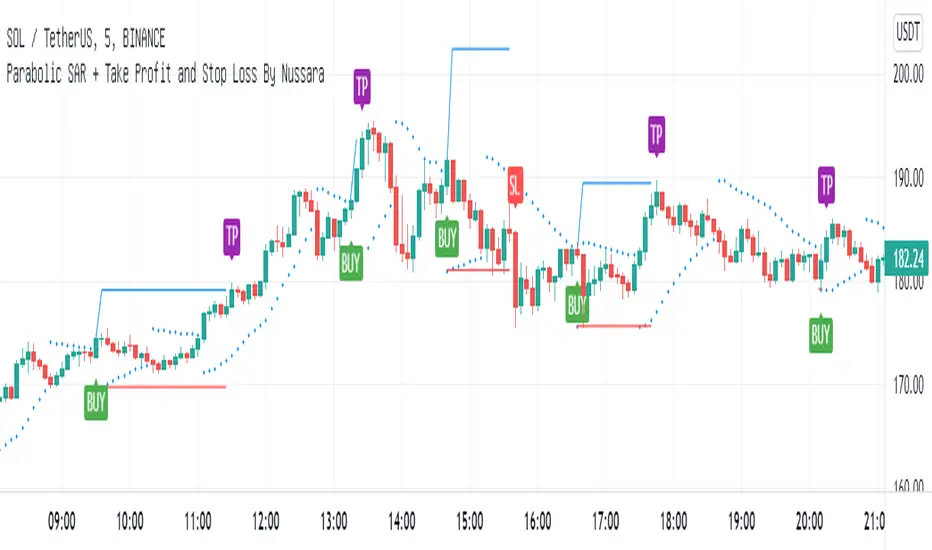
Parabolic SAR + Take Profit and Stop Loss By NussaraThis strategy uses Parabolic SAR. The Parabolic SAR is a technical indicator developed by J. Welles Wilder to determine the direction that an asset is moving. The indicator is also referred to as a stop and reverse system, which is abbreviated as SAR. It aims to identify potential reversals in the price movement of traded assets.
This indicator has a function to take profit and stop loss level.
Stop loss level = First reverse point of uptrend
Take profit level = Entry price + (Entry price-Stop loss level)
User can set a parabolic SARS and a profit point but I fixed stop loss level at first reversals point of uptrend. I also put alert for Buy, Sell, Stop Loss in this indicator.
This indicator is just a tool for technical analysis. It shouldn't be used as the only indication of trade because it causes you to lose your money. You should use other indicators to analyze together.
ATR For Stop Loss (Overlay)This script is an enhancement of ATR Indicator.
It is used to determine the stop loss position by using the ATR indicator, in conjunction with the low of the candle.
Formula = Stop Loss = Lowest(Lowest Length) - (ATR Multiplier * ATR (Smoothing, Length))
However, the user needs to manually identify the swing low for a better stop loss placement.
Parameter Information :
- Length : Period to calculate the average true range.
- Smoothing : The method used for averaging.
- ATR Multiplier : Multiplier factor to determine the Stop Loss from the lowest reference point. (1 ATR Multiplier means the stop loss would be = Low - ATR)
- Lowest Length : A total number of candle to determine the lowest reference point. (1 means only using the latest candle's low as a lowest reference point)
Have fun and good luck!
ATR Stop Loss IndicatorIt’s very simple – all it does is calculate your stop loss with trailing stop price.
How It Works
Blue is the current ATR (pips).
Green is your trailing stop-loss price for Long
Red is your trailing stop-loss price for Short .
Settings
ATR Length:
Your ATR Length
Multiplier:
ATR multiplier.
For example, if you want to use a 2x ATR stop, set to 2.
Entrate, take profit e stop loss, target 1
Questo script vuole essere un aiuto nell'impostare le operazioni a mercato giorno per giorno.
A seconda della posizione che si vuole scegliere (long o short) guardando il grafico si può essere aiutati dall'indicatore Entrare.
Le linee trasparenti verdi e arancioni sono entrate:
long: la mia entrata a mercato sarà al prezzo della riga arancione trasparente, il mio stop loss alla riga rossa, il mio tp 1 alla riga bianca superiore e il tp 2 alla riga verde.
short: la mia entrata a mercato sarà al prezzo della riga verde trasparente, il mio stop loss alla riga verde, il mio tp 1 alla riga bianca inferiore e il tp 2 alla riga rossa.
Questa semplice strategia è basata su altri due script di mia creazione che trovate a questi indirizzi:
This script is made for help people with their entry day per dar.
Depending on the position yuo decided (long or short) and whatcing the chart you can be helped by this script "Entrate".
Transparent Green and Orange line are entry points:
long: the entry point will be the transparent orange line, stop loss at red line, tp1 at upper white line and tp 2 at green line.
short: the entry point will be the transparent green line, stop loss at green line, tp1 at lower white line and tp2 at red line.
This simple strategy is based on other 2 script made by me, and you can find at these links:
Buona fortuna e Good Luck!

Trailing Stop LossTrailing stop loss indicator to determine when to exit a position.
Multiple trailing stop loss calculation techniques are implemented:
ATR: Determines stop loss using a gap from recent highest value, that gap is defined by the ATR value and a multiplier
MA: Just a simple moving average used as a stop-loss
Percentage: Uses a percentage of the price
The script also implements alerting to be notified when the stop loss price is reached.

ATR Entries & Stop Loss [Jigga]This is a simple script that displays multiples of ATR and shows you where the potential zones for longing and shorting are. The majority of people use ATR as a stop loss, so we can use it for our advantage and get in when they are stopped out. There is also a possibility to add a stop loss, so a trader can lose little when he is wrong and maximize profit when he is right. It works the best in ranging markets.
Do not forget to always use a proper stop loss and risk management.
Here you can see it in action:
BTC - BitMex - Range bound market

ATR Stop Loss Finder (Strict Breakout Mode)Title: ATR Stop Loss Finder (Strict Breakout Mode)
Description:
Volatility-Based Risk Management: Generates dynamic trailing stop-loss lines for both Long (Lower Line) and Short (Upper Line) positions based on ATR volatility.
Strict Breakout Detection: Features a unique "Strict Breakout" logic that highlights trend acceleration. It visually marks whenever the Long SL breaks a historical high or the Short SL breaks a historical low over a user-defined lookback period (e.g., 50 bars).
Visual Signals: Automatically plots Red Circles for bullish SL breakouts (New Highs) and Blue Circles for bearish SL breakdowns (New Lows), making strong momentum shifts easy to spot.
Real-Time Dashboard: Includes an informative table displaying current ATR and SL price levels for quick reference.

Accurate ATR Stop Loss Distance — Risk Management ToolAccurate ATR Stop Loss Distance — Risk Management Tool
This indicator calculates an accurate Stop Loss distance in pips using the Average True Range (ATR) multiplied by a user-defined multiplier.
It automatically detects the correct pip size based on the instrument type (Forex, Crypto, Stocks, Indices, Futures), adjusting for 2-, 3-, 4-, or 5-digit quotes — ensuring professional-grade precision that matches institutional ATR-based risk systems.
📊 Features:
Uses ATR × Multiplier to determine precise SL distance in pips.
Automatically adjusts pip value depending on the asset type (handles 5-digit Forex brokers).
Clean and minimal design — displays only one info box in the top-right corner.
Fully customizable text and background colors.
Includes alert condition for automated SL updates.
⚙️ How to use:
Set your preferred ATR period and multiplier.
The indicator instantly displays your Stop Loss distance in pips at the top-right of the chart.
Combine with your entry strategy to calculate lot size or risk per trade.
💡 Ideal for traders who want consistent, objective SL distances derived from volatility rather than arbitrary points or emotions.
Note: Educational and informational tool only. Does not execute trades or give financial advice.

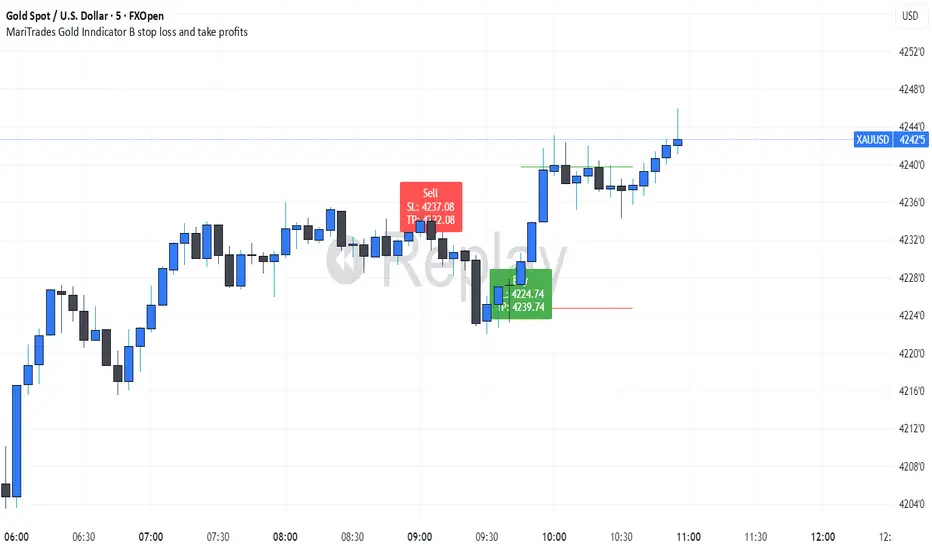
MariTrades Gold Indicator B-Stop loss and Take profitsThe MariTrades Gold Indicator B is an original Trading View script designed to help traders visualize entry points, stop loss (SL), take profit (TP), and key structure levels on gold charts. This publication fully complies with Trading View’s public script rules, including originality, English description, chart clarity, and Pine Script v5 usage.
Key Features:
Break of Structure (BOS) Detection:
Detects trend reversals by identifying when price closes above/below the previous swing high/low.
BOS signals are marked on the chart for both buy and sell opportunities.
Fibonacci Retracement Levels:
Automatically plots retracements from the last swing high to swing low.
(NOT LABELLED)
Entry signals are confirmed when price retraces to these levels after BOS.
Automatic SL and TP Visualization:
Stop loss and take profit levels are drawn directly on the chart.
Default values: SL = 5 pips, TP = 10 pips (customizable via inputs).
Entry Signals:
Buy: Price breaks structure (BOS) and retraces to Fibonacci level → label and lines drawn.
Sell: Price breaks structure (BOS) and retraces to Fibonacci level → label and lines drawn.
Clean, readable chart overlay:
Previous signals are automatically removed to avoid clutter.
SL lines in red, TP lines in green, entry labels clearly displayed.