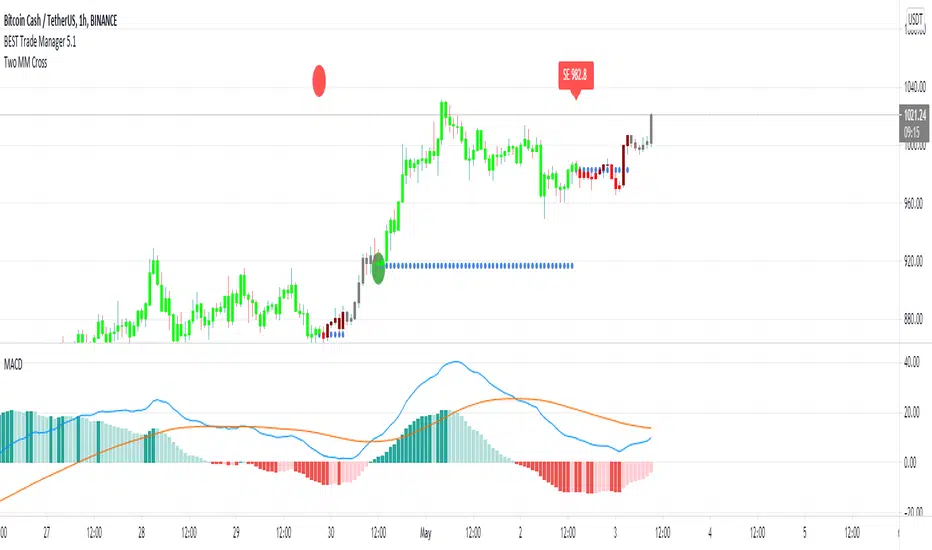
BEST Trade ManagerHello traders
The BEST Trade Manager got upgraded with many more features
I. 💎 SCRIPTS ACCESS 💎
1. Available only with one-time payment on my website.
2. My website URL is in this script signature at the very bottom (you'll have to scroll down a bit and going past the long description) and in my profile status available here: Daveatt
3. Many video tutorials explaining clearly how all our indicators work are available on your website > guides section.
4. You may also contact me directly for more information
II. 🔎 What is the BEST Trade Manager?🔎
2.1 Concept
The BEST Trade Manager is compatible with any indicator.
Once connected, it adds another layer of good stuff with real-time user custom defined stop loss (8 available options), take profits (4 possible options) + alerts compatible for trading automation.
2.2 How hard is it to update your indicator?
We'll send to our customers, a comprehensive and easy tutorial, to make any indicator compatible.
I guarantee you, it should take no more than 2 minutes per indicator. We made it easy, fun, and awesome. #bolder #statement
III. The amazing benefits of our Plug&Play system
I hope you're ready to be impressed. Because, what I'm about to introduce, is my best-seller feature - and available across many of my indicators.
The BEST Trade manager can be connected to any external indicator
Let's assume you want to connect your RSI divergence to your Trade Manager.
I mentioned an RSI divergence but you may connect any oscillator ( MACD, On balance volume, stochastic RSI, True Strenght index, and many more..) or non-oscillator (divergence, trendline break, higher highs/lower lows, candlesticks pattern, price action, harmonic patterns, ...) indicators.
THE SKY IS (or more likely your imagination) is the limit :)
We go in-depth on our website why the Plug&Play is an untapped opportunity for many traders out there - URL available on my profile status and signature
IV. 🧰 Features 🧰
Candles can be colored to highlight the trend direction better [/b[
4.1 Stop-Loss Management
For what's following, let's assume that 2 is the stop-loss value you inserted in the indicator, and the Algorithm Builder gives a BUY signal.
This is NOT a recommendation at all, only an example to explain how this feature works.
- %Trailing: The Stop-Loss starts 2% away from the entry price - and will move up (because we're on a BUY trade as per our example) every time your trade will gain 2% profit
- Pips Trailing: Same as above but using a distance in pips/USD value
- Percentage: The Stop-Loss stays static 2% away from the entry price. There is no trailing here
- TP Trailing
- Supertrend: embedded supertrend use as a trailing stop
- Fixed: Set the Stop-Loss at a fixed position (value should be in currency/units)
- ATR multiple: Set the Stop-loss at a multiple of ATR
- External connector: Let's say your indicator already contains embedded stop-loss levels, you can add them in the Trade Manager
4.2 Take Profits Management
You can manage up to 3 take profit levels defined as a percentage or price value or ATR multiple.
The expected input is in percentage value (for instance, setting the % target of TP1 to 2% will set the TP1 level 2% away from the entry price
4.3 Built-in Risk-to-Reward Panel with real-time analytics
The good stuff doesn't stop here.
You'll notice that this sometimes green (when in a LONG), sometimes red (when in a SHORT) panel at the right of your chart.
- Entry Price: the price when the Algorithm Builder will give a signal.
- The Trade PnL in percentage.
- Entry Stop Loss: Distance (in currency/units) between the selected stop-loss algorithm (percent, trailing, TP trailing, etc.) and the entry price.
- Entry TP1/TP2/TP3: Distance (in currency/units) between the entry price and the first take profit
- Risk/Reward TP1/TP2/TP3: Using the Stop-loss distance at entry, and Take Profit 1/2/3 at the entry to compute the risk-to-reward ratio.
- Max drawdown and Max opportunity (value and percentage): respectively the maximum loss and maximum win per trade
For more details, please check the guides section of my website. Links are in my signature and profile status.
V. 🔔 Alerts 🔔
We enabled the alerts on the:
1. Stop-Loss hit
2. Take Profit 1/2/3 hit
3. custom hard exits based on either MACD/RSI divergence/MM cross
5.2. 🤖 Compatible with trading bots? 🤖
Should be compatible with all third-parties out there capturing alerts and forwarding them to the brokers.
We enabled TradingConnector alert templates so far and we'll add the ProfitView ones shortly
If you have any doubts or questions, please hit me up directly or ask in the comments section of this script.
Kind regards,
Dave
חפש סקריפטים עבור "supertrend"
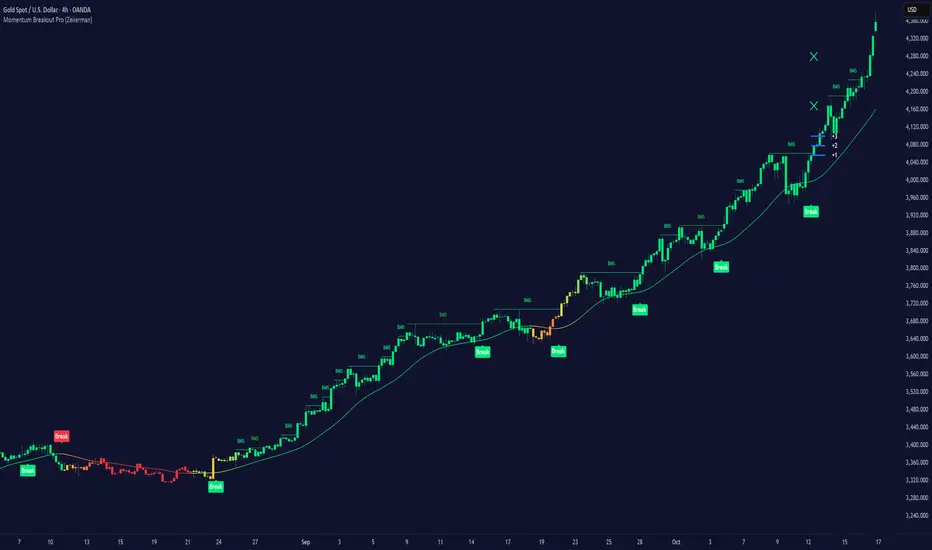
Momentum Breakout Pro (Zeiierman)█ Overview
Momentum Breakout Pro (Zeiierman) is a breakout-focused quantitative system engineered to identify only the strongest momentum expansions in the market. Instead of reacting to price movement, it reconstructs a refined momentum signal, evaluates its strength and persistence, and validates each breakout against the broader market context. Only when momentum pressure aligns with structural direction, trend state, candle behavior, and spacing requirements will a breakout be considered qualified.
The result is a clean and context-aware signal flow that removes noise and highlights only the breakouts with the highest probability of continuation. Traders receive precise Break signals at qualified points, adaptive trend lines, candle-based trend visualization, structure levels, and volatility-driven confirmation markers. Internally, the system operates as a layered confirmation model designed to enforce directional consensus and filter out the shallow or unreliable moves that typically weaken breakout strategies.
In short, Momentum Breakout Pro offers a refined breakout selection system that focuses on quality over quantity, designed for traders who want clean and well-supported breakout signals backed by structured technical logic.
⚪ Why This One Is Unique
Momentum Breakout Pro’s uniqueness comes from its multi-layered confirmation process. The internal momentum reconstruction ensures that only sustained directional pressure is considered meaningful. Optional filters such as Dynamic Trend, SuperTrend, Average Trend, VWAP, and Market Structure provide an adjustable decision stack, allowing traders to decide how strict or flexible the validation should be. Breakouts are released only when the enabled components agree.
█ Main Features
⚪ Breakout Signals
The Breakout Signals are the core feature of the indicator. They help traders identify high probability breakouts that are more likely to follow through. With built-in confirmation levels, it becomes much easier to judge whether a breakout is strong or likely to fail. Combined with the suggested take profit points, traders can quickly find confirmed breakout opportunities with realistic first profit targets.
⚪ Breakout Filters
The indicator includes multiple filters that align each breakout with the current trend, structure, and momentum. This is essential for identifying only the strongest and most reliable breakout setups.
⚪ Dynamic Trend
The Dynamic Trend is a volatility-aware long-term trend filter. It removes noise and adapts to sharp volatility swings, staying focused on the true underlying trend direction. This helps traders avoid false signals and remain aligned with the broader market drift.
⚪ Moving Average
A standard moving average with a user-defined length. Simple, effective, and easy to understand. It acts as a clean trend filter for both beginners and advanced traders.
⚪ Super Trend
A Super Trend filter that restricts breakout signals to appear only in the direction of the active SuperTrend. This adds an additional layer of directional confirmation.
⚪ VWAP
VWAP (Volume Weighted Average Price) is a powerful anchor, especially on lower timeframes. It serves as a dynamic support or resistance level and a highly reliable trend filter.
⚪ Candle Coloring
The candle coloring engine tracks how long the price has moved in one direction and translates that persistence into a graded bull, mid, or bear color spectrum. This helps traders quickly understand trend strength, confirm momentum, and allow the market enough space to move before a larger breakout occurs.
⚪ Momentum
The momentum filter identifies bursts of momentum and highlights the strongest correlations between price and movement strength. It filters out weak breakouts that are not backed by real momentum, improving accuracy significantly.
⚪ Market Structure
Trading with the current market structure is crucial. This filter ensures that breakout signals appear only when they align with the existing structure, helping traders stay on the right side of the market.
█ How to Use
⚪ Breakouts
Use this tool to identify high-quality breakouts. To increase accuracy, combine the breakout signals with the trend, structure, and momentum filters. When these elements align, the probability of a successful breakout increases significantly.
⚪ Confirmation Levels
The indicator includes three confirmation levels that adapt based on current market volatility.
These levels help you judge the strength of the breakout:
When the three levels are tight and close to the price, it indicates strong conditions. Price is more likely to break through all levels quickly and confirm the breakout.
When the levels are spread out and far from the price, the breakout becomes weaker. Price must travel too far to confirm the move, which lowers the probability of a clean follow-through.
What you want to see is a breakout where all three confirmation levels are penetrated within the next few candles. That is the ideal scenario, indicating a confirmed breakout with a higher chance of continuation in that direction.
⚪ Take Profit Strategy
The indicator includes built-in take profit levels, which act as your first two targets after a confirmed breakout:
Once Take Profit 1 is hit, move your stop loss to break even.
When Take Profit 2 is hit, move your stop loss to the first take profit level.
From there, allow the position to run until the candle coloring shifts, signaling that momentum may be slowing or reversing.
This approach helps you secure profits early, reduce risk, and stay in the trade for larger moves when the trend is strong.
█ Setting Realistic Expectations: Win-Rate and Risk–Reward
Research on breakout systems, trend-following strategies, and directional volatility all show the same behavioral pattern. Win rates tend to be moderate, while risk and reward are positively skewed. Most breakout attempts are tested quickly by the market and may result in small losses or breakeven trades. The real edge comes from the smaller group of breakouts that expand into multi-stage moves and generate significantly larger gains. This is a well-established characteristic of momentum-driven price dynamics.
Momentum Breakout Pro is designed to work within this framework. It is not built to win on every signal, but to highlight conditions that historically align with stronger follow-through. The tool provides structure levels, confirmation lines, and initial target markers to help traders measure extension and manage risk objectively. Actual results will vary depending on the filters enabled, the markets traded, and how stops and exits are managed. However, the overall expectation remains consistent with established breakout research: frequent smaller outcomes combined with fewer but more impactful winners.
█ How It Works
⚪ Breakout System
The breakout system detects emerging directional expansions by transforming price movement into a stabilized signal curve. It evaluates localized impulse strength, directional bias, and short-term acceleration to determine when the price is exerting statistically meaningful pressure in one direction. When this pressure breaches the system’s internal thresholds, a breakout candidate is registered.
Calculation: Price is processed through a multi-stage smoothing pipeline to construct a normalized signal curve. The script analyzes the curve’s gradient and micro-momentum characteristics within a compact evaluation window. A breakout event is triggered when these combined directional metrics exceed the system’s momentum-pressure threshold.
⚪ Momentum Confirmation
To prevent weak or premature breakouts, the system verifies that momentum behavior aligns with the directional expansion. This ensures that only breakouts supported by sustained impulse strength are considered.
Calculation: The script evaluates the strength, stability, and directional consistency of momentum over the developing move. Instead of reacting to isolated shifts, it assesses whether momentum maintains a coherent and persistent trajectory that reinforces the breakout direction. A breakout is confirmed only when momentum structure and directional pressure are synchronized.
⚪ Confirmation Levels
Once a breakout is detected, three confirmation levels indicate how far the price must travel to confirm the breakout's strength.
Calculation: The levels are spaced using a volatility-adjusted distance formula. A breakout is considered strong when the price clears all three levels within a short time window.
⚪ Targets
Targets provide simple reference points for early take profits and risk management.
Calculation: The distance to a nearby structural or volatility-based reference is measured, then projected outward as proportional 1R / 2R style levels.
-----------------
Disclaimer
The content provided in my scripts, indicators, ideas, algorithms, and systems is for educational and informational purposes only. It does not constitute financial advice, investment recommendations, or a solicitation to buy or sell any financial instruments. I will not accept liability for any loss or damage, including without limitation any loss of profit, which may arise directly or indirectly from the use of or reliance on such information.
All investments involve risk, and the past performance of a security, industry, sector, market, financial product, trading strategy, backtest, or individual's trading does not guarantee future results or returns. Investors are fully responsible for any investment decisions they make. Such decisions should be based solely on an evaluation of their financial circumstances, investment objectives, risk tolerance, and liquidity needs.
SuperTwinSuperTwin Indicator
About
SuperTwin is an advanced fusion of the SuperTrend and Twin Range Filter indicators, developed by Kıvanç Özbilgiç. This innovative indicator aims to combine the strengths of two popular technical analysis tools to provide more accurate and reliable trading signals.
Usage Advantages
Noise Filtering: Minimizes false signals with the Twin Range Filter.
Trend Confirmation: Confirms the primary trend direction with SuperTrend.
Early Signals: Provides earlier and more reliable signals through the combination of the two indicators.
Visual Clarity: The color-coded system makes it easy to track the trend direction.
Alert System: Instant signal notifications with automatic alarms.
Stocks
Forex Markets
Futures Markets
Cryptocurrency Markets
You can use it on all timeframes (minute, hourly, daily, weekly).
SuperTwin stands out as an ideal tool for traders by filtering out market noise while capturing genuine trend reversals.
////////////////////////////////////////////////////////////////////////////////

Triple Threat v1.15This is a work in progress that uses machine learning to improve supertrend. When price breaks supertrend line, it will turn orange signaling a potential reversal. It then confirms or fails on the next candle which would trigger a trade and the corresponding indicator visuals. It also dynamically changes settings for different timeframes to remain accurate. The number in the flag is the predicted move size from 1-10 from machine learning analyses, with low numbers being more likely a retracement and higher numbers being explosive potential moves.

POSITION SIZER v8.0 🎯 PROFESSIONAL RISK MANAGEMENT TOOL
Automatically calculates the optimal position size for trading with SuperTrend.
Compatible with Forex, Stocks, Futures, and Cryptocurrencies.
✅ KEY FEATURES:
💰 Automatic SuperTrend — Detects market direction (LONG/SHORT)
📊 Precise Calculations — Shows position size, SL, TP and potential profit
🚨 Visual Alerts — Warns if you use excessive leverage
🔄 Multi-Market — Works on any instrument
⚡ Optimized — No errors, no crashes
🎓 HOW TO USE:
1 — Configure your Total Capital and Risk % (0.5-1% recommended)
2 — The indicator automatically detects your market type
3 — Panel shows exactly what to trade (size, entry, SL, TP)
4 — You execute manually on your broker
⚠️ IMPORTANT:
• This indicator does NOT place orders automatically
• It is a PLANNING tool
• ALWAYS test on demo account first
📋 VERSION 8.0 — IMPROVEMENTS:
✅ Corrected calculations (accurate P&L)
✅ Improved speed (no freezing)
✅ Automatic symbol change detection
✅ Smart alerts (🚨 emoji for high risk)
✅ Precise tick rounding
💡 RECOMMENDED SETTINGS:
Forex: Risk 0.5-1%, Method: Structural Min
Acciones: Risk 1-2%, Method: ATR
Futures: Risk 0.5-1%, Method: Structural Min
Crypto: Risk 1-2%, Method: ATR
If you have questions, leave a comment. I respond regularly.
⭐ If this indicator helps your trading, boost it and share it.

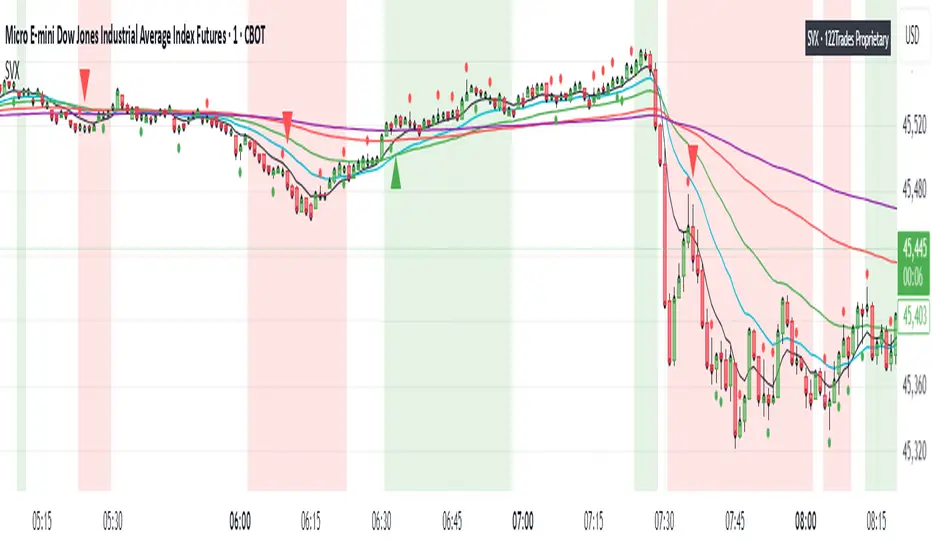
SVX (Sentiment Velocity Index) EMA & Slope StructureThe SVX Momentum Framework is designed as a momentum and slope visualization tool. Designed to identify momentum shifts and pre-move conditions within price action.
What it draws:
- Plots five EMAs (8, 20, 40, 100, 200) To visualize short/medium trend structure. You can pick which ones to see.
- Calculates an EMA-based slope (rate of change) from actual closing-price movement and colors a neutral/positive/negative background for context. This is not ATR or Supertrend.
- Shows optional triangle context markers on bars that meet wick/body conditions that often precede momentum transitions (off by default / user-controlled).
- Shows Reference close (optional): Use when you need to verify price relative to standard closes for easier zone and level marking.
How the components work together:
- The EMA stack provides directional alignment (compression/expansion and relative order of 8/20/40/100/200).
- The slope quantifies whether recent movement is neutral, building (Green), or fading (Red); the background simply reflects that state.
- The triangle context markers flag a bar-shape condition (wick/body relationship) that can precede changes in behavior.
- The reference close is a visual aid for clarity when users compare candle closes and trading zones or levels .
How to read it:
- Structure: Look for EMA ordering (at least 8/20/100 recommended) and spacing to understand the underlying bias and compression/expansion.
- Slope state: Neutral (no bias, white), positive (building, green), or negative (fading, red). Use it as context, not as entries/exits.
- Context markers (optional): Treat them as visual highlights.
- Reference close (optional): Use when you need to verify price relative to candle close for easier zone and level marking.
How to use it (general guidance):
- Read structure first (EMA order/spread), then consider the slope state to understand whether conditions are neutral or possibly momentum-driven in the indicated direction.
- Combine with your own entry rules and/or engulfing candle patterns for timing, risk, and apply your preferred management.
What’s original here:
- The slope visualization is derived from actual closing-price movement, not Supertrend or ATR overlays.
- The wick/body context markers focus on bars that often precede transitions, presented as optional visuals.
- The reference close overlay is included purely to aid interpretation when comparing views to the native close and for more clear zone and level marking.
Access & intent:
- Educational visualization of structure and slope, providing a framework traders can build upon.
- The author does not provide financial advice. Use at your own discretion.
Disclaimer
This script is provided for educational and informational purposes only. It does not constitute financial advice, investment recommendations, or a solicitation to trade. Past performance is not indicative of future results. The author assumes no responsibility for losses incurred from the use of this tool. TradingView, Inc. has no liability related to this script or its use.
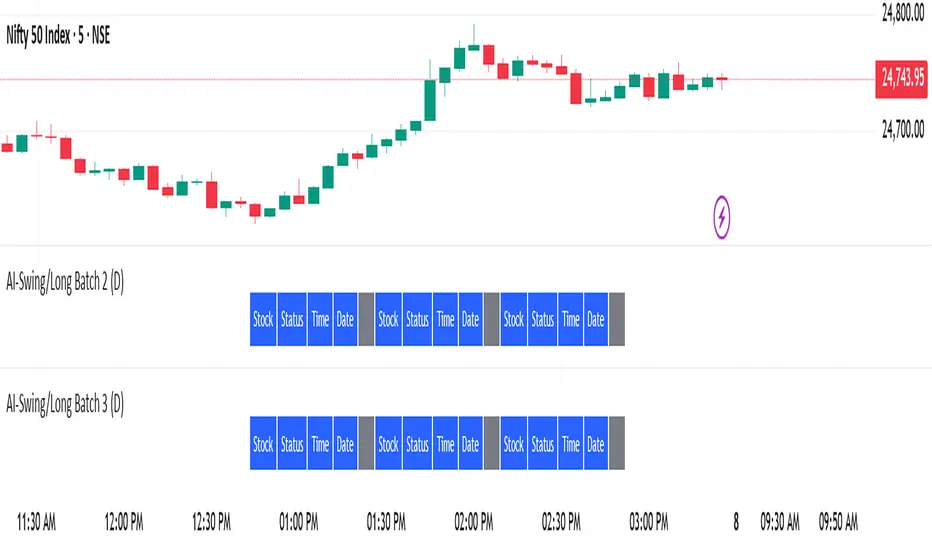
AI-Swing/Long Batch 21. Introduction
The Supertrend Plus strategy is an advanced technical indicator built on the widely popular Supertrend. It has been designed for traders who want to capture price action across multiple timeframes 1D TO 3M

AI-Swing/Long Batch 31. Introduction
The Supertrend Plus strategy is an advanced technical indicator built on the widely popular Supertrend. It has been designed for traders who want to capture price action across multiple timeframes 1D TO 3M
AI-Swing/Long Batch 41. Introduction
The Supertrend Plus strategy is an advanced technical indicator built on the widely popular Supertrend. It has been designed for traders who want to capture price action across multiple timeframes 1D TO 3M

AI-Swing/Long Batch 51. Introduction
The Supertrend Plus strategy is an advanced technical indicator built on the widely popular Supertrend. It has been designed for traders who want to capture price action across multiple timeframes 1D TO 3M

AI-INTRADAY-NIFTY50_21. Introduction
The Supertrend Plus strategy is an advanced technical indicator built on the widely popular Supertrend. It has been designed for traders who want to capture price action across multiple timeframes 1D TO 3M

AI-INTRADAY-NIFTY50_11. Introduction
The Supertrend Plus strategy is an advanced technical indicator built on the widely popular Supertrend. It has been designed for traders who want to capture price action across multiple timeframes 1D TO 3M
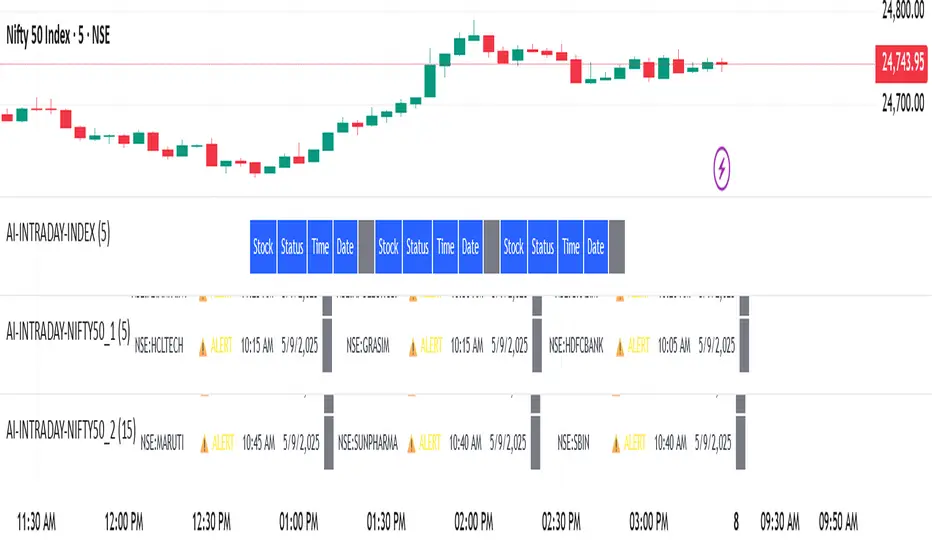
AI-INTRADAY-INDEX1. Introduction
The Supertrend Plus strategy is an advanced technical indicator built on the widely popular Supertrend. It has been designed for traders who want to capture price action across multiple timeframes 1D TO 3M

AI-Swing/Long Batch 11. Introduction
The Supertrend Plus strategy is an advanced technical indicator built on the widely popular Supertrend. It has been designed for traders who want to capture price action across multiple timeframes 1D TO 3M

Ayman Entry Signal – Ultimate PRO (Scalping Gold Settings)1. Overview
This indicator is a professional gold scalping tool built for TradingView using Pine Script v6.
It combines multiple price action and technical filters to generate high-probability Buy/Sell signals with built-in trade management features (TP1, TP2, SL, Break Even, Partial Close, Stats tracking).
It is optimized for XAUUSD but can be applied to other assets with proper setting adjustments.
2. Key Features
Multi-Condition Trade Signals – EMA trend, Break of Structure, Order Blocks, FVG, Liquidity Sweeps, Pin Bars, Higher Timeframe confirmation, Trend Cloud, SMA Cross, and ADX.
Full Trade Management – Auto-calculates lot size, SL, TP1, TP2, Break Even, Partial Close.
Dynamic Chart Drawing – Entry lines, SL/TP lines, trade boxes, and real-time PnL.
Statistics Panel – Tracks wins, losses, breakeven trades, and total PnL over selected dates.
Customizable Filters – All filters can be turned ON/OFF to match your strategy.
3. Main Inputs & Settings
Account Settings
Capital ($) – Total trading capital.
Risk Percentage (%) – Risk per trade.
TP to SL Ratio – Risk-to-reward ratio.
Value Per Point ($) – Value per pip/point for lot size calculation.
SL Buffer – Extra points added to SL to avoid stop hunts.
Take Profit Settings
TP1 % of Full Target – Fraction of TP1 compared to TP2.
Move SL to Entry after TP1? – Activates Break Even after TP1.
Break Even Buffer – Extra points when moving SL to BE.
Take Partial Close at TP1 – Option to close half at TP1.
Signal Filters
ATR Period – For SL/TP calculation buffer.
EMA Trend – Uses EMA 9/21 crossover for trend.
Break of Structure (BoS) – Requires structure break confirmation.
Order Block (OB) – Validates trades within OB zones.
Fair Value Gap (FVG) – Confirms trades inside FVGs.
Liquidity Sweep – Checks if liquidity zones are swept.
Pin Bar Confirmation – Uses candlestick patterns for extra confirmation.
Pin Bar Body Ratio – Controls strictness of Pin Bar filter.
Higher Timeframe Filters (HTF)
HTF EMA Confirmation – Confirms lower timeframe trades with higher timeframe trend.
HTF BoS – Confirms with higher timeframe structure break.
HTF Timeframe – Selects higher timeframe.
Advanced Filters
SuperTrend Filter – Confirms trades based on SuperTrend.
ADX Filter – Filters out low volatility periods.
SMA Cross Filter – Uses SMA 8/9 cross as filter.
Trend Cloud Filter – Uses EMA 50/200 as a cloud trend filter.
4. How It Works
Buy Signal Conditions
EMA 9 > EMA 21 (trend bullish)
Optional filters (BoS, OB, FVG, Liquidity Sweep, Pin Bar, HTF confirmations, ADX, SMA Cross, Trend Cloud) must pass if enabled.
When all active filters pass → Buy signal triggers.
Sell Signal Conditions
EMA 9 < EMA 21 (trend bearish)
Same filtering process but for bearish conditions.
When all active filters pass → Sell signal triggers.
5. Trade Execution & Management
When a signal triggers:
Lot size is auto-calculated based on risk % and SL distance.
SL is placed beyond recent swing high/low + ATR buffer.
TP1 and TP2 are calculated from the SL using the reward-to-risk ratio.
Break Even: If enabled, SL moves to entry price after TP1 is hit.
Partial Close: If enabled, half of the position closes at TP1.
Trade Exit: Full exit at TP2, SL hit, or partial close at TP1.
6. Chart Display
Entry Line – Shows entry price.
SL Line – Red dashed line at stop loss level.
TP1 Line – Lime dashed line for TP1.
TP2 Line – Green dashed line for TP2.
PnL Labels – Displays real-time profit/loss in $.
Trade Box – Visual area showing trade range.
Pin Bar Shapes – Optional, marks Pin Bars.
7. Statistics Panel
Stats Header – Shows “Stats”.
Total Trades
Wins
Losses
Breakeven Trades
Total PnL
Can be reset or filtered by date.
8. How to Use
Load the Indicator in TradingView.
Select Gold (XAUUSD) on your preferred scalping timeframe (1m, 5m, 15m).
Adjust settings:
Use default gold scalping settings for quick start.
Enable/disable filters according to your style.
Wait for a Buy/Sell alert.
Confirm visually that all desired conditions align.
Place trade with calculated lot size, SL, and TP levels shown on chart.
Let trade run – the indicator manages Break Even & Partial Close if enabled.
9. Recommended Timeframes
Scalping: 1m, 5m, 15m
Day Trading: 15m, 30m, 1H
Swing: 4H, Daily (adjust settings accordingly)

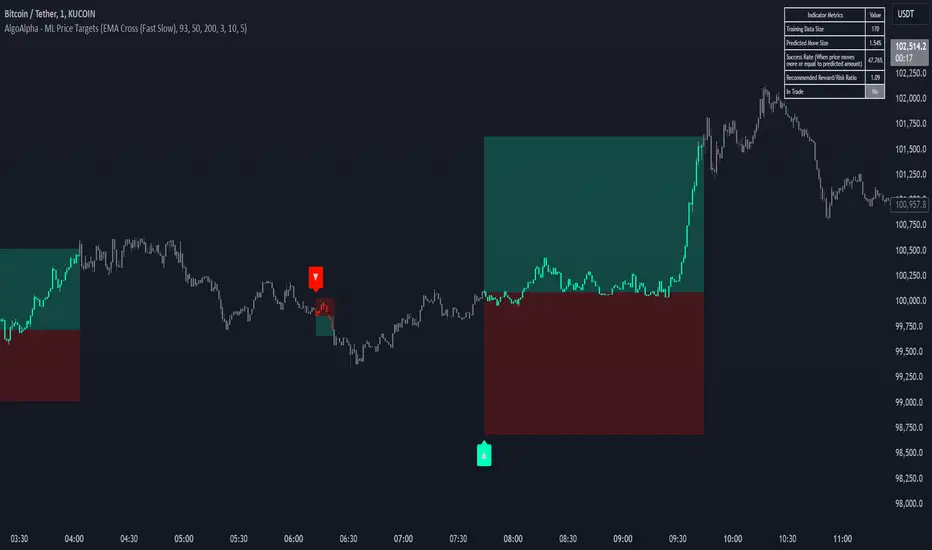
Machine Learning Price Target Prediction Signals [AlgoAlpha]Introducing the Machine Learning Price Target Predictions, a cutting-edge trading tool that leverages kernel regression to provide accurate price targets and enhance your trading strategy. This indicator combines trend-based signals with advanced machine learning techniques, offering predictive insights into potential price movements. Perfect for traders looking to make data-driven decisions with confidence.
What is Kernel Regression and How It Works
Kernel regression is a non-parametric machine learning technique that estimates the relationship between variables by weighting data points based on their similarity to a given input. The similarity is determined using a kernel function, such as the Gaussian (RBF) kernel, which assigns higher weights to closer data points and progressively lower weights to farther ones. This allows the model to make smooth and adaptive predictions, balancing recent data and historical trends.
Key Features
🎯 Predictive Price Targets : Uses kernel regression to estimate the magnitude of price movements.
📈 Dynamic Trend Analysis : Multiple trend detection methods, including EMA crossovers, Hull Moving Average, and SuperTrend.
🔧 Customizable Settings : Adjust bandwidth for kernel regression and tweak trend indicator parameters to suit your strategy.
📊 Visual Trade Levels : Displays take-profit and stop-loss levels directly on the chart with customizable colors.
📋 Performance Metrics : Real-time win rate, recommended risk-reward ratio, and training data size displayed in an on-chart table.
🔔 Alerts : Get notified for new trends, take-profit hits, and stop-loss triggers.
How to Use
🛠 Add the Indicator : Add it to your favorites and apply it to your chart. Configure the trend detection method (SuperTrend, HMA, or EMA crossover) and other parameters based on your preferences.
📊 Analyze Predictions : Observe the predicted move size, recommended risk-reward ratio, and trend direction. Use the displayed levels for trade planning.
🔔 Set Alerts : Enable alerts for trend signals, take-profit hits, or stop-loss triggers to stay informed without constant monitoring.
How It Works
The indicator calculates features such as price volatility, relative strength, and trend signals, which are stored during training periods. When a trend change is detected, the kernel regression model predicts the likely price move based on these features. Predictions are smoothed using the specified bandwidth to avoid overfitting while ensuring timely responses to feature changes. Visualized take-profit and stop-loss levels help traders optimize risk management. Real-time metrics like win rate and recommended risk-reward ratios provide actionable insights for decision-making.
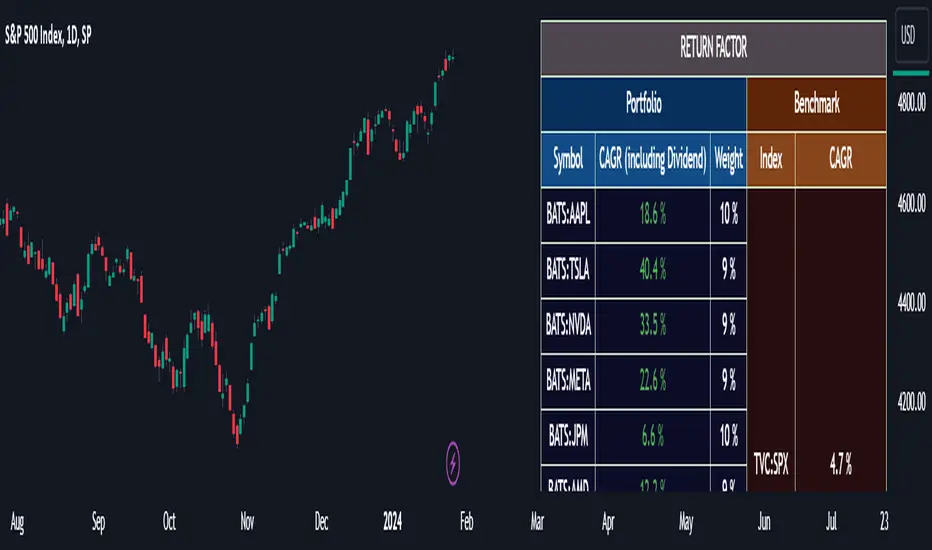
Portfolio Management [TrendX_]Portfolio Management is a powerful tool that helps you create and manage your own portfolio of stocks, based on your risk and return preferences.
*** Note: You should select the appropriate index for each stock as the benchmark to compare your portfolio’s performance.
*** Note: You should apply the indicator to the same chart as the benchmark, so that it can capture the historical trends of all the 10 stocks in your portfolio.
USAGE
Analyze your portfolio’s return factor, which shows the compound annual growth rate (CAGR) of each stock and the portfolio as a whole, as well as the weight of each stock in the portfolio.
The Weighting approach contains 2 options, Equal and Growth-based method:
Customize your portfolio by selecting up to 10 stocks from a wide range of markets and sectors:
Compare your portfolio’s performance with a benchmark of your choice, which is the S&P500 by default setting.
Evaluate your portfolio’s risk factor, which includes the capital asset pricing model (CAPM), the portfolio beta, and the Sharpe ratio of both the portfolio and the benchmark:
- CAPM is a model that calculates the expected return of the portfolio based on its risk and the risk-free rate of return.
- Portfolio beta is a measure of how sensitive the portfolio is to the movements of the benchmark. A beta of 1 means the portfolio moves in sync with the benchmark, a beta of less than 1 means the portfolio is less volatile than the benchmark, and a beta of more than 1 means the portfolio is more volatile than the benchmark.
- Sharpe ratio measures how much excess return the portfolio generates per unit of risk. It is calculated by subtracting the risk-free rate of return from the portfolio’s return, and dividing by the portfolio’s standard deviation. A higher Sharpe ratio means the portfolio has a better risk-adjusted return. A Sharpe ratio of more than 1 is considered good, a Sharpe ratio of more than 2 is considered very good, and a Sharpe ratio of more than 3 is considered excellent .
Adjust your portfolio’s rebalancing strategy, which determines when and how to change the weight of each stock in the portfolio to optimize your return and risk objectives. The tool also suggests a default hedging-stock asset, which is the US dollar interpreted through the dollar index (DXY):
- The dollar index is a measure of the value of the US dollar relative to a basket of other major currencies. It is often used as a proxy for the global economic sentiment and the demand for safe-haven assets. A rising dollar index means the US dollar is strengthening, which may indicate a bearish outlook for the stock market. A falling dollar index means the US dollar is weakening, which may indicate a bullish outlook for the stock market.
- The rebalancing strategy suggest increasing the weight of the hedging-stock asset when the dollar index is under positive supertrend condition, and decreasing the weight of the hedging-stock asset when the dollar index is in the downward supertrend. This way, you can hedge against the adverse effects of the stock market fluctuations on your portfolio, simply you can just cash out at the suggested hedging weight.
CONCLUSION
Investors can gain a deeper insight into their portfolio’s performance, risk, and potential, and make informed decisions to achieve their financial goals with confidence and ease.
DISCLAIMER
The results achieved in the past are not all reliable sources of what will happen in the future. There are many factors and uncertainties that can affect the outcome of any endeavor, and no one can guarantee or predict with certainty what will occur.
Therefore, you should always exercise caution and judgment when making decisions based on past performance.
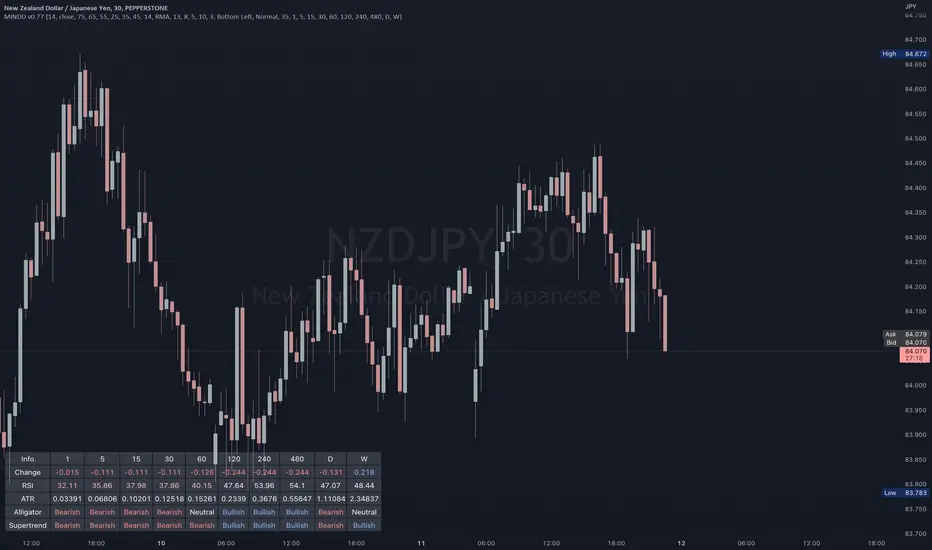
Multi IND Dashboard [Skiploss]Multi IND Dashboard is dashboard combine with price change, RSI, ATR, Alligator and Supertrend. With a maximum of 10 timeframes, I think it's going to make your life easier. In looking at the momentum of each chart.
How it work??
Change :
It is the distance from the close price of previous candlestick and shows the movement value of the candlestick in that timeframe.
RSI :
Default setting are 14 and source close
Value >= 75 : Fill text color maximum overbought
Value >= 65 : Fill text color medium overbought
Value >= 55 : Fill text color minimum overbought
Value >= 45 : Fill text color minimum overbought
Value >= 35 : Fill text color medium overbought
Value >= 25 : Fill text color maximum overbought
ATR :
Default setting are 14 length and RMA smoothing, It like the average swing of the candlesticks.
Alligator :
Default setting are 13, 8 and 5
Bullish status is value lips > teeth and teeth > jaw
Bearish status is value lips < teeth and teeth < jaw
Neutral status status is value lips > teeth and teeth < jaw or lips < teeth and teeth > jaw
Supertrend :
Default setting are 8 and 3.0
Bullish status is uptrend
Bearish status is downtrend
Ultimate Custom MTF ScreenerThis indicator will allow you to make your custom TradingView MTF screener without coding. Add it to the chart, select up to 10 instruments, 4 timeframes, and 4 indicators, and the screener will do the rest for you. The indicator will form a lovely table with all values and highlighted signals.
The screener is highly customizable, and you can choose its position on the chart, sorting, order of the columns, and colors for the tables. You can easily change parameters for all supported indicators and their signals.
Currently, there are 21 different custom indicators available. Current list of indicators:
Average Directional Index (ADX) - displaying the value of ADX and checking if it's higher than the threshold
Average True Range (ATR) - showing the value of ATR
Awesome Oscillator (AO) - displaying the value of AO and highlighting positive/negative values.
Bollinger Bands (BB) - showing if the price is above/below/in the channel.
Breakout Pivots - Displaying when the price is below/above the most recent pivot low/high.
Commodity Channel Index (CCI) - shows the last CCI value and highlights overbought/oversold values.
Directional Movement Index (DMI) - Up/Down signal (+DI above or below -DI)
Donchian Channel (DC) - showing if the price is above/below/in the channel.
Heikin Ashi Count (HAC) - What is the current Heikin Ashi candle color and for how long was this color?
Historical Volatility (HV) - Current value of Historical Volatility
Keltner Channel (KC) -showing if the price is above/below/in the channel.
Moving Average Convergence Divergence (MACD) - Up/Down signal (MACD above / below signal)
Moving Average Crossover (MA Cross) - Displaying MA crosses signals (SMA, EMA, WMA, HMA, VWMA, SMMA, DEMA, VWAP supported)
Moving Average Distance (MA DIST) - Displaying distance to the MA (SMA, EMA, WMA, HMA, VWMA, SMMA, DEMA, VWAP supported)
Parabolic Stop and Reverse (PSAR) - Up or Down
Relative Strength Index (RSI) - Displaying the last RSI value and highlighting overbought/oversold values.
Stochastic (STOCH) - Displaying the last Stochastic value and highlighting overbought/oversold values.
Stochastic RSI (STOCH RSI) - Displaying the last Stochastic RSI value and highlighting overbought/oversold values.
SuperTrend - Current state of the SuperTrend.
Trailing Stop-Loss (TSL) - Up or Down
True Strength Index (TSI) - Displaying the last TSI value and highlighting overbought/oversold values.
We're already working on adding a few more supported indicators. If you have any ideas about the indicators you want to see in our screener, contact us, and we'll consider them.
Disclaimer
Please remember that past performance may not be indicative of future results.
Due to various factors, including changing market conditions, the strategy may no longer perform as well as in historical backtesting.
This post and the script don’t provide any financial advice.

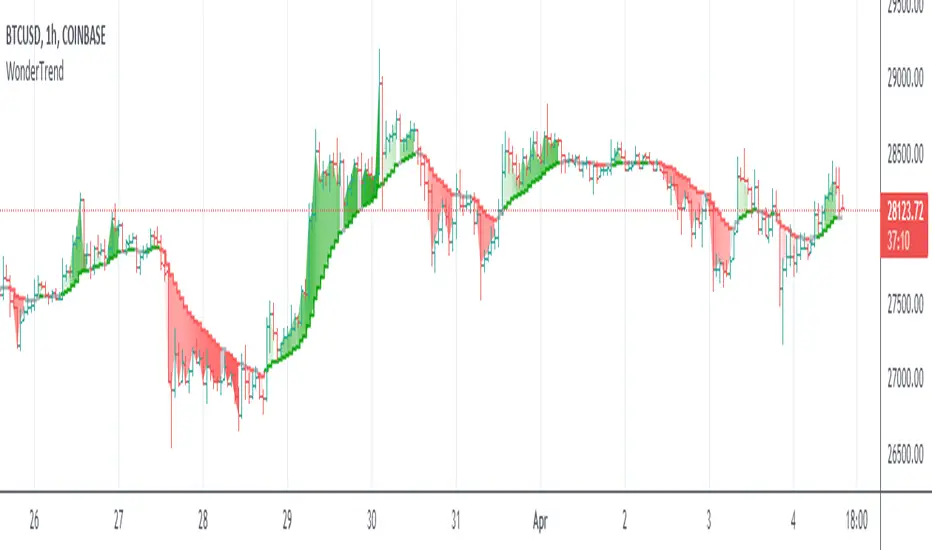
WonderTrend IndicatorDetermining trends and reversals are the keys to trading, yet very difficult. Parabolic SAR is hard to trade during choppy price action. SuperTrend is a bit late in determining changes of trend and not great and exit signals.
So WonderTrend is a bit of both, a more stubborn PSAR, also a faster SuperTrend. The green is up, red is down, and yellow is caution helps traders read the chart patterns to enter and exit.
Enjoy!
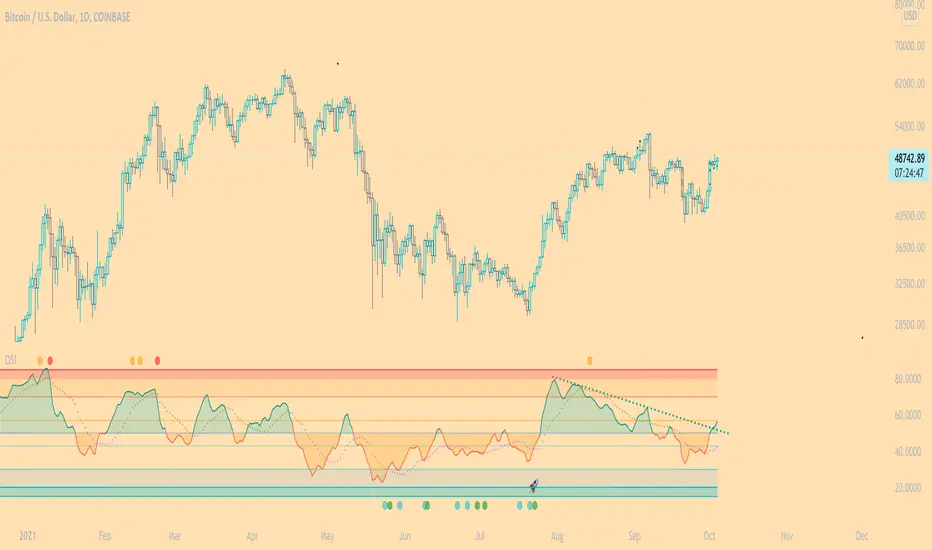
DSI - Dynamic Strength Index The DSI is a volume weighted momentum indicator similar but superior to the traditional RSI.
The DSI algorithm takes values for RSI, MFI, OBV and stochastics, then gives them each a different weighting depending on their historic reliability in different market conditions, and then averages out the values.
This results in a very reliable, noise-free momentum indicator, especially reliable on high timeframes.
Further features include:
Auto Trendlines - Up-downtrend lines to show support, resistance and breakouts
Supertrend- A momentum (ATR based) version of the Supertrend.
Divergences - Bullish and bearish momentum divergences, with confirmation signals.
General Rules:
Bullish above 50
Bearish below 50
Enjoy!
MM
RinganTrend 0.4This is from SuperTrend.
But I changed manything. so now i call it ringanTrend.
now v0.4
buy at green arrow. (end of black line)
sell at red arrow. (end of blue line)
but be carefull. it may take your money.
look at the chart. left side it take trader's money often.(but small)
also i published v0.3 before
so you can use 0.3 and 0.4 at the same time.
you can change 4 value.
v0.3 setting is 4, 13, 8, 5
0.4's default setting is for shooter(maybe)
2, 4, 1, 1
you trade often in 0.4 default setting than v0.3
and i fixed small bug.
I am not sure i will make v0.5
cause ...i guess i cannot make better than this.
SuperTrend is so nice idea already!! especially for alt-coin
you can see difference.
in korean
빨간화살표에서 파세요 (파란선이 끝나는 점)
녹색화살표에서 사세요 (검은선이 끝나는 점)

MA SMART Angle
### 📊 WHAT IS MA SMART ANGLE?
**MA SMART Angle** is an advanced momentum and trend detection indicator that analyzes the angles (slopes) of multiple moving averages to generate clear, non-repainting BUY and SELL signals.
**Original Concept Credit:** This indicator builds upon the "MA Angles" concept originally created by **JD** (also known as Duyck). The core angle calculation methodology and Jurik Moving Average (JMA) implementation by **Everget** are preserved from the original open-source work. The angle calculation formula was contributed by **KyJ**. This enhanced version is published with respect to the open-source nature of the original indicator.
Original indicator reference: "ma angles - JD" by Duyck
---
## 🎯 ORIGINALITY & VALUE PROPOSITION
### **What Makes This Different from the Original:**
While the original "MA Angles" by **JD** provided excellent angle visualization, it lacked actionable entry signals. **MA SMART Angle** addresses this by adding:
**1. Clear Entry/Exit Signals**
- Explicit BUY/SELL arrows based on angle crossovers, momentum confirmation, and MA alignment
- No guessing when to enter trades - the indicator tells you exactly when conditions align
**2. Non-Repainting Logic**
- All signals use confirmed historical data (shifted by 2 bars minimum)
- Critical for backtesting reliability and live trading confidence
- Original indicator could repaint signals on current bar
**3. Dual Signal System**
- **Simple Mode:** More frequent signals based on angle crossovers + momentum (for active traders)
- **Strict Mode:** Requires full multi-MA alignment + momentum confirmation (for conservative traders)
- Adaptable to different trading styles and risk tolerances
**4. Smart Signal Filtering**
- **Anti-spam cooldown:** Prevents duplicate signals within configurable bar count
- **No-trade zone detection:** Filters out low-conviction sideways markets automatically
- **Multi-timeframe MA alignment:** Ensures all moving averages agree on direction before signaling
**5. Enhanced Visualization**
- Large, clear BUY/SELL arrows with descriptive labels
- Color-coded backgrounds for market states (trending vs. ranging)
- Momentum histogram showing acceleration/deceleration in real-time
- Live status table displaying trend strength, angle value, momentum, and MA alignment
**6. Professional Alert System**
- Four distinct alert conditions: BUY Signal, SELL Signal, Strong BUY, Strong SELL
- Enables automated trade notifications and strategy integration
**7. Modified MA Periods**
- Original used EMA(27), EMA(83), EMA(278)
- Enhanced version uses faster EMA(3), EMA(8), EMA(13) for more responsive signals
- Better suited for modern volatile markets and shorter timeframes
---
## 📐 HOW IT WORKS - TECHNICAL EXPLANATION
### **Core Methodology:**
The indicator calculates angles (slopes) for five key moving averages:
- **JMA (Jurik Moving Average)** - Smooth, lag-reduced trend line (original implementation by **Everget**)
- **JMA Fast** - Responsive momentum indicator with higher power parameter
- **MA27 (EMA 3)** - Primary fast-moving average for signal generation
- **MA83 (EMA 8)** - Medium-term trend confirmation
- **MA278 (EMA 13)** - Slower trend filter
### **Angle Calculation Formula (by KyJ):**
```
angle = arctan((MA - MA ) / ATR(14)) × (180 / π)
```
**Why ATR normalization?**
- Makes angles comparable across different instruments (forex, stocks, crypto)
- Makes angles comparable across different timeframes
- Accounts for volatility - a 10-point move in different assets has different significance
**Angle Interpretation:**
- **> 15°** = Strong trend (momentum accelerating)
- **0° to 15°** = Weak trend (momentum present but moderate)
- **-2° to +2°** = No-trade zone (sideways/choppy market)
- **< -15°** = Strong downtrend
### **Signal Generation Logic:**
#### **BUY Signal Conditions:**
1. MA27 angle crosses above 0° (upward momentum initiates)
2. All three EMAs (3, 8, 13) pointing upward (trend alignment confirmed)
3. Momentum is positive for 2+ bars (acceleration, not deceleration)
4. Angle exceeds minimum threshold (not in no-trade zone)
5. Cooldown period passed (prevents signal spam)
#### **SELL Signal Conditions:**
1. MA27 angle crosses below 0° (downward momentum initiates)
2. All three EMAs pointing downward (downtrend alignment)
3. Momentum is negative for 2+ bars
4. Angle below negative threshold (not in no-trade zone)
5. Cooldown period passed
#### **Strong BUY+ / SELL+ Signals:**
Additional entry opportunities when JMA Fast crosses JMA Slow while maintaining strong directional angle - indicates momentum acceleration within established trend.
---
## 🔧 HOW TO USE
### **Recommended Settings by Trading Style:**
**Scalpers / Day Traders:**
- Signal Type: **Simple**
- Minimum Angle: **3-5°**
- Cooldown Bars: **3-5 bars**
- Timeframes: 1m, 5m, 15m
**Swing Traders:**
- Signal Type: **Strict**
- Minimum Angle: **7-10°**
- Cooldown Bars: **8-12 bars**
- Timeframes: 1H, 4H, Daily
**Position Traders:**
- Signal Type: **Strict**
- Minimum Angle: **10-15°**
- Cooldown Bars: **15-20 bars**
- Timeframes: Daily, Weekly
### **Parameter Descriptions:**
**1. Source** (default: OHLC4)
- Price data used for MA calculations
- OHLC4 provides smoothest angles
- Close is more responsive but noisier
**2. Threshold for No-Trade Zones** (default: 2°)
- Angles below this are considered sideways/ranging
- Increase for stricter filtering of choppy markets
- Decrease to allow signals in quieter trending periods
**3. Signal Type** (Simple vs. Strict)
- **Simple:** Angle crossover OR (trend + momentum)
- **Strict:** Angle crossover AND all MAs aligned AND momentum confirmed
- Start with Simple, switch to Strict if too many false signals
**4. Minimum Angle for Signal** (default: 5°)
- Only generate signals when angle exceeds this threshold
- Higher values = stronger trends required
- Lower values = more sensitive to momentum changes
**5. Cooldown Bars** (default: 5)
- Minimum bars between consecutive signals
- Prevents spam during volatile chop
- Scale with your timeframe (higher TF = more bars)
**6. Color Bars** (default: true)
- Colors chart bars based on signal state
- Green = bullish conditions, Red = bearish conditions
- Can disable if you prefer clean price bars
**7. Background Colors**
- **Yellow background** = No-trade zone (low angle, ranging market)
- **Green flash** = BUY signal generated
- **Red flash** = SELL signal generated
- All customizable or can be disabled
---
## 📊 INTERPRETING THE INDICATOR
### **Visual Elements:**
**Main Chart Window:**
- **Thick Lime/Fuchsia Line** = MA27 angle (primary signal line)
- **Medium Green/Red Line** = MA83 angle (trend confirmation)
- **Thin Green/Red Line** = MA278 angle (slow trend filter)
- **Aqua/Orange Line** = JMA Fast (momentum detector)
- **Green/Red Area** = JMA slope (overall trend context)
- **Blue/Purple Histogram** = Momentum (angle acceleration/deceleration)
**Signal Arrows:**
- **Large Green ▲ "BUY"** = Primary buy signal (all conditions met)
- **Small Green ▲ "BUY+"** = Strong momentum buy (JMA fast cross)
- **Large Red ▼ "SELL"** = Primary sell signal (all conditions met)
- **Small Red ▼ "SELL+"** = Strong momentum sell (JMA fast cross)
**Status Table (Top Right):**
- **Angle:** Current MA27 angle in degrees
- **Trend:** Classification (STRONG UP/DOWN, UP/DOWN, FLAT)
- **Momentum:** Acceleration state (ACCEL UP/DN, Up/Down)
- **MAs:** Alignment status (ALL UP/DOWN, Mixed)
- **Zone:** Trading zone status (ACTIVE vs. NO TRADE)
- **Last:** Bars since last signal
### **Trading Strategies:**
**Strategy 1: Pure Signal Following**
- Enter LONG on BUY signal
- Exit on SELL signal
- Use stop-loss at recent swing low/high
- Works best on trending instruments
**Strategy 2: Confirmation with Price Action**
- Wait for BUY signal + bullish candlestick pattern
- Wait for SELL signal + bearish candlestick pattern
- Increases win rate by filtering premature signals
- Recommended for beginners
**Strategy 3: Momentum Acceleration**
- Use BUY+/SELL+ signals for adding to positions
- Only take these in direction of primary signal
- Scalp quick moves during momentum spikes
- For experienced traders
**Strategy 4: Mean Reversion in No-Trade Zones**
- When status shows "NO TRADE", fade extremes
- Wait for angle to exit no-trade zone for reversal
- Contrarian approach for range-bound markets
- Requires tight stops
---
## ⚠️ LIMITATIONS & DISCLAIMERS
**What This Indicator DOES:**
✅ Measures momentum direction and strength via angle analysis
✅ Generates signals when multiple conditions align
✅ Filters out low-conviction sideways markets
✅ Provides visual clarity on trend state
**What This Indicator DOES NOT:**
❌ Predict future price movements with certainty
❌ Guarantee profitable trades (no indicator can)
❌ Work equally well on all instruments/timeframes
❌ Replace proper risk management and position sizing
**Known Limitations:**
- **Lagging Nature:** Like all moving averages, signals occur after momentum begins
- **Whipsaw Risk:** Can generate false signals in volatile, directionless markets
- **Optimization Required:** Parameters need adjustment for different assets
- **Not a Complete System:** Should be combined with risk management, position sizing, and other analysis
**Best Performance Conditions:**
- Strong trending markets (crypto bull runs, stock breakouts)
- Liquid instruments (major forex pairs, large-cap stocks)
- Appropriate timeframe selection (match to trading style)
- Used alongside support/resistance and volume analysis
---
## 🔔 ALERT SETUP
The indicator includes four alert conditions:
**1. BUY SIGNAL**
- Message: "MA SMART Angle: BUY SIGNAL! Angle crossed up with momentum"
- Use for: Primary long entries
**2. SELL SIGNAL**
- Message: "MA SMART Angle: SELL SIGNAL! Angle crossed down with momentum"
- Use for: Primary short entries or long exits
**3. Strong BUY**
- Message: "MA SMART Angle: Strong BUY momentum - JMA fast crossed up"
- Use for: Adding to longs or aggressive entries
**4. Strong SELL**
- Message: "MA SMART Angle: Strong SELL momentum - JMA fast crossed down"
- Use for: Adding to shorts or aggressive exits
**Setting Up Alerts:**
1. Right-click indicator → "Add Alert on MA SMART Angle"
2. Select desired condition from dropdown
3. Choose notification method (popup, email, webhook)
4. Set alert expiration (typically "Once Per Bar Close")
---
## 📚 EDUCATIONAL VALUE
This indicator serves as an excellent learning tool for understanding:
**1. Angle-Based Momentum Analysis**
- Traditional indicators show MA crossovers
- This shows the *rate of change* (velocity) of MAs
- Teaches traders to think in terms of momentum acceleration
**2. Multi-Timeframe Confirmation**
- Shows how fast, medium, and slow MAs interact
- Demonstrates importance of trend alignment
- Helps develop patience for high-probability setups
**3. Signal Quality vs. Quantity Tradeoff**
- Simple mode = more signals, more noise
- Strict mode = fewer signals, higher quality
- Teaches discretionary filtering skills
**4. Market State Recognition**
- Visual distinction between trending and ranging markets
- Helps traders avoid trading choppy conditions
- Develops "market context" awareness
---
## 🔄 DIFFERENCES FROM OTHER MA INDICATORS
**vs. Traditional MA Crossovers:**
- Measures momentum (angle) rather than just price crossing MA
- Provides earlier signals as angles change before price crosses
- Filters better for sideways markets using no-trade zones
**vs. MACD:**
- Uses multiple MAs instead of just two
- ATR normalization makes it universal across instruments
- Visual angle representation more intuitive than histogram
**vs. Supertrend:**
- Not based on ATR bands but on MA slope analysis
- Provides graduated strength indication (not just binary trend)
- Less prone to whipsaw in low volatility
**vs. Original "MA Angles" by JD:**
- Adds explicit entry/exit signals (original had none)
- Implements no-repaint logic for reliability
- Includes signal filtering and quality controls
- Provides dual signal systems (Simple/Strict)
- Enhanced visualization and status monitoring
- Uses faster MA periods (3/8/13 vs 27/83/278) for modern markets
---
## 📖 CODE STRUCTURE (for Pine Script learners)
This indicator demonstrates:
**Advanced Pine Script Techniques:**
- Custom function implementation (JMA, angle calculation)
- Var declarations for stateful tracking
- Table creation for HUD display
- Multi-condition signal logic
- Alert system integration
- Proper use of historical references for no-repaint
**Code Organization:**
- Modular function definitions (JMA, angle)
- Clear separation of concerns (inputs, calculations, plotting, alerts)
- Extensive commenting for maintainability
- Best practices for Pine Script v5
**Learning Resources:**
- Study the JMA function to understand adaptive smoothing
- Examine angle calculation for ATR normalization technique
- Review signal logic for multi-condition confirmation patterns
- Analyze anti-spam filtering for state management
The code is open-source - feel free to study, modify, and improve upon it!
---
## 🙏 CREDITS & ATTRIBUTION
**Original Concepts:**
- **"ma angles - JD" by JD (Duyck)** - Core angle calculation methodology and indicator concept
Original open-source indicator on TradingView Community Scripts
- **JMA (Jurik Moving Average) implementation by Everget** - Smooth, low-lag moving average function
Acknowledged in original JD indicator code
- **Angle Calculation formula by KyJ** - Mathematical formula for converting MA slope to degrees using ATR normalization
Acknowledged in original JD indicator code comments
**Enhancements in This Version:**
- Signal generation logic - Original implementation for this indicator
- No-repaint confirmation system - Original implementation
- Dual signal modes (Simple/Strict) - Original implementation
- Visual enhancements and status table - Original implementation
- Alert system and signal filtering - Original implementation
- Modified MA periods (3/8/13 instead of 27/83/278) - Optimization for modern markets
**Open Source Philosophy:**
This indicator follows the open-source spirit of TradingView and the Pine Script community. The original "ma angles - JD" by JD (Duyck) was published as open-source, enabling this enhanced version. Similarly, this code is published as open-source to allow further community improvements.
---
## ⚡ QUICK START GUIDE
**For New Users:**
1. Add indicator to chart
2. Start with default settings (Simple mode)
3. Wait for BUY signal (green arrow)
4. Observe how price behaves after signal
5. Check status table to understand market state
6. Adjust parameters based on your instrument/timeframe
**For Experienced Traders:**
1. Switch to Strict mode for higher quality signals
2. Increase cooldown bars to reduce frequency
3. Raise minimum angle threshold for stronger trends
4. Combine with your existing strategy for confirmation
5. Set up alerts for desired signal types
6. Backtest on your preferred instruments
---
## 🎓 RECOMMENDED COMBINATIONS
**Works Well With:**
- **Volume Analysis:** Confirm signals with volume spikes
- **Support/Resistance:** Take signals near key levels
- **RSI/Stochastic:** Avoid overbought/oversold extremes
- **ATR:** Size positions based on volatility
- **Price Action:** Wait for candlestick confirmation
**Complementary Indicators:**
- Order Flow / Footprint (for institutional confirmation)
- Volume Profile (for identifying value areas)
- VWAP (for intraday mean reversion reference)
- Fibonacci Retracements (for target setting)
---
## 📈 PERFORMANCE EXPECTATIONS
**Realistic Win Rates:**
- Simple Mode: 45-55% (higher frequency, moderate accuracy)
- Strict Mode: 55-65% (lower frequency, higher accuracy)
- Combined with price action: 60-70%
**Best Asset Classes:**
1. **Cryptocurrencies** (strong trends, clear signals)
2. **Forex Major Pairs** (smooth price action, good angles)
3. **Large-Cap Stocks** (trending behavior, liquid)
4. **Index Futures** (trending instruments)
**Challenging Conditions:**
- Low volatility consolidation periods
- News-driven erratic movements
- Thin/illiquid instruments
- Counter-trending markets
---
## 🛡️ RISK DISCLAIMER
**IMPORTANT LEGAL NOTICE:**
This indicator is for **educational and informational purposes only**. It is **NOT financial advice** and does not constitute a recommendation to buy or sell any financial instrument.
**Trading Risks:**
- Trading carries substantial risk of loss
- Past performance does not guarantee future results
- No indicator can predict market movements with certainty
- You can lose more than your initial investment (especially with leverage)
**User Responsibilities:**
- Conduct your own research and due diligence
- Understand the instruments you trade
- Never risk more than you can afford to lose
- Use proper position sizing and risk management
- Consider consulting a licensed financial advisor
**Indicator Limitations:**
- Signals are based on historical data only
- No guarantee of accuracy or profitability
- Parameters must be optimized for your specific use case
- Results vary significantly by market conditions
By using this indicator, you acknowledge and accept all trading risks. The author is not responsible for any financial losses incurred through use of this indicator.
---
## 📧 SUPPORT & FEEDBACK
**Found a bug?** Please report it in the comments with:
- Chart symbol and timeframe
- Parameter settings used
- Description of unexpected behavior
- Screenshot if possible
**Have suggestions?** Share your ideas for improvements!
**Enjoying the indicator?** Leave a like and follow for updates!
