MPF EMA Cross Strategy (8~13~21) by Market Pip FactoryThis script is for a complete strategy to win maximum profit on trades whilst keeping losses at a minimum, using sound risk management at no greater than 1.5%
The 3x EMA Strategy uses the following parameters for trade activation and closure.
1/ Daily Time Frame for trend confirmation
2/ 4 Hourly Time Frame for trend confirmation
3/ 1 Hourly Time Frame for trend confirmation AND trade execution
4/ 3x EMAs (Exponential Moving Averages)
* EMA#1 = 8 EMA (Red Color)
* EMA#2 = 13 EMA (Blue Color)
* EMA#3 = 21 EMA (Orange Color)
5/ Fanning of all 3x EMAs and CrossOver/CrossUnder for Trend Confirmation
6/ Price Action touching an 8 EMA for trade activation
7/ Price Action touching a 21 EMA for trade cancellation BEFORE activation
* For LONG trades: 8 EMA would be ABOVE 21 EMA
* For SHORT trades: 8 EMA would be BELOW 21 EMA
* For trade Cancellation, price action would touch the 21 EMA before trade is activated
* For trade Entry, price action would touch 8 EMA
Once trigger parameter is identified, entry is found by:
a) Price action touches 8 EMA (Candle must Close for confirmed Trade preparation)
b) Trade preparation can be cancelled before trade is activated if price action touches 21 EMA
c) Trailing Stop Loss can be used (optional) by counting back 5 candles from current candle
CLOSURE of a Trade is identified by:
e) 8 EMA crossing the 21 EMA, then close trade, no matter LONG or SHORT
f) Trail Stop Loss
IMPORTANT:
g) No more than ONE activated trade per EMA crossover
h) No more than ONE active trade per pair
NOTE: This strategy is to be used in conjunction with Cipher Twister (my other indicator) to reduce trades on
sideways price action and market trends for super high win ratio.
NOTE: Enabling of LONGs and SHORTs Via Cipher Twister is done by using the previous
green or red dot made. Additionally, when the trend changes, so do the dot's validity based
on being above or below the 0 centerline.
----------------------------
Strategy and Bot Logic
----------------------------
.....::: FOR SHORT TRADES ONLY :::.....
The Robot must use the following logic to enable and activate the SHORT trades:
Parameters:
$(crossunder)=8EMA,21EMA=Bearish $(crossover)=8EMA,21EMA=Bullish $entry=SELL STOP ORDER (Short)
$EMA#1 = 8 EMA (Red Color) $EMA#2 = 13 EMA (Blue Color) $EMA#3 = 21 EMA (Orange Color)
Strategy Logic:
1/ Check Daily Time Frame for trend confirmation if:
(look back up to 50 candles - find last cross of EMAs)
$(chart)=daily and trend=$(crossunder) then goto 2/ *Means: crossunder = ema21 > ema8
$(chart)=daily and trend=$(crossover) then stop (No trades) *Means: crossover = ema8 > ema21
NOTE: This function is switchable. 0=off and 1=on(active). Default = 1 (on)
2/ Check 4 Hourly Time Frame for trend confirmation if:
(look back up to 50 candles - find last cross of EMAs)
$(chart)=4H and trend=$(crossunder) then goto 3/ *Means: crossunder = ema21 > ema8
$(chart)=4H and trend=$(crossover) then stop (No trades) *Means: crossover = ema8 > ema21
NOTE: This function is switchable. 0=off and 1=on(active). Default = 1 (on)
3/ 1 Hourly Time Frame for trend confirmation AND trade execution if:
(look back up to 50 candles - find last cross of EMAs)
$(chart)=1H and trend=$(crossunder) then goto 4/ *Means: crossunder = ema21 > ema8
$(chart)=1H and trend=$(crossover) then stop (No trades) *Means: crossover = ema8 > ema21
4/ Trade preparation:
* if Next (subsequent) candle touches 8EMA, then set STOP LOSS and ENTRY
* $stoploss=3 pips ABOVE current candle HIGH
* $entry=3 pips BELOW current candle LOW
5/ Trade waiting (ONLY BEFORE entry is hit and trade activated):
* if price action touches 21 EMA then cancel trade and goto 1/
Note: Once trade is active this function does not apply !
6/ Trade Activation:
* if price activates/hits ENTRY price, then bot activates trade SHORTs market
7/ Optional Trailing stop:
* if active, then trailing stop 3 pips ABOVE previous HIGH of previous 5th candle
or * Move Stop Loss to Break Even after $X number of pips
NOTE: This means count back and apply accordingly to the 5th previous candle from current candle.
NOTE: This function is switchable. 0=off and 1=on(active). Default = 0 (off)
8/ Trade Close ~ Take Profit:
* Only TP when
$(chart)=1H and trend=$(crossover) then close trade ~ Or obviously if Stop Loss is hit if 7/ is activated.
----------END FOR SHORT TRADES LOGIC----------
.....::: FOR LONG TRADES ONLY :::.....
The Robot must use the following logic to enable and activate the LONG trades:
Parameters:
$(crossunder)=8EMA,21EMA=Bearish $(crossover)=8EMA,21EMA=Bullish $entry=BUY STOP ORDER (Long)
$EMA#1 = 8 EMA (Red Color) $EMA#2 = 13 EMA (Blue Color) $EMA#3 = 21 EMA (Orange Color)
Strategy Logic:
1/ Check Daily Time Frame for trend confirmation if:
(look back up to 50 candles - find last cross of EMAs)
$(chart)=daily and trend=$(crossover) then goto 2/ *Means: crossover = ema8 > ema21
$(chart)=daily and trend=$(crossunder) then stop (No trades) *Means: crossunder = ema21 > ema8
NOTE: This function is switchable. 0=off and 1=on(active). Default = 1 (on)
2/ Check 4 Hourly Time Frame for trend confirmation if:
(look back up to 50 candles - find last cross of EMAs)
$(chart)=4H and trend=$(crossover) then goto 3/ *Means: crossover = ema8 > ema21
$(chart)=4H and trend=$(crossunder) then stop (No trades) *Means: crossunder = ema21 > ema8
NOTE: This function is switchable. 0=off and 1=on(active). Default = 1 (on)
3/ 1 Hourly Time Frame for trend confirmation AND trade execution if:
(look back up to 50 candles - find last cross of EMAs)
$(chart)=1H and trend=$(crossover) then goto 4/ *Means: crossover = ema8 > ema21
$(chart)=1H and trend=$(crossunder) then stop (No trades) *Means: crossunder = ema21 > ema8
4/ Trade preparation:
* if Next (subsequent) candle touches 8EMA, then set STOP LOSS and ENTRY
* $stoploss=3 pips BELOW current candle LOW
* $entry=3 pips ABOVE current candle HIGH
5/ Trade waiting (ONLY BEFORE entry is hit and trade activated):
* if price action touches 21 EMA then cancel trade and goto 1/
Note: Once trade is active this function does not apply !
6/ Trade Activation:
* if price activates/hits ENTRY price, then bot activates trade LONGs market
7/ Optional Trailing stop:
* if active, then trailing stop 3 pips BELOW previous LOW of previous 5th candle
or * Move Stop Loss to Break Even after $X number of pips
NOTE: This means count back and apply accordingly to the 5th previous candle from current candle.
NOTE: This function is switchable. 0=off and 1=on(active). Default = 0 (off)
8/ Trade Close ~ Take Profit:
* Only TP when
$(chart)=1H and trend=$(crossunder) then close trade ~ Or obviously if Stop Loss is hit if 7/ is activated.
----------END FOR LONG TRADES LOGIC----------
IMPORTANT:
* If an existing trade is already open for that same pair, & price action touches 8EMA, do NOT open a new trade..
* bot must continuously check if a trade is currently open on the pair that triggers
* New trades are to be only opened if there is no active trade opened on current pair.
* Only 1 trade per pair rule !
* 5 simultaneous open trades (not same pairs) default = 5 but value can be changed accordingly.
* Maximum risk management must not exceed 1.5% on lot size
*** Some features are not yet available autoated, they will be added in due course in subsequent version updates ***
חפש סקריפטים עבור "take profit"

Ranged Volume DCA Strategy - R3c0nTraderUpdate: Republishing this as Public Open-Source script.
Credits:
Thank you "EvoCrypto" for granting me permission to use "Ranged Volume" to create this strategy.
Thank you "junyou0424" for granting me permission to use "DCA Bot with SuperTrend Emulator" which I used for adding bot inputs, calculations, and strategy
What does this do?
This script is mainly used for backtesting a Ranged Volume strategy to see how a 3Commas bot would perform.
I created this script out of necessity and I wanted a way to test a 3Commas DCA bot with a strategy based on “Volume.”
I came across "EvoCrypto’s" "Ranged Volume" study and strategy in TradingView and I liked it. I wanted to configure it so it can be used for DCA bot backtesting. I used parts from "junyou0424’s" "DCA Bot with SuperTrend Emulator" to add the following:
1. The Start Time and End Time
2. Price deviation to open safety orders (%)
3. Target Take Profit (%)
4. Trailing deviation
5. Base Order and Safety Order
6. Safety order volume scale
7. Safety order step scale
8. Max safety orders
In addition to the above, I also added chart indicators for "Take Profit" as well as "Safety Order"
Pre-requisites:
You can use this script without a 3Commas account and see how 3Commas DCA Bot and Ranged Volume strategy would perform vs. a non-DCA strategy. However, I highly recommend signing up for their free account and going through their training. This would give you a base understanding on the settings you will see in this strategy and why you will need to know them.
That said these are the pre-requisites I suggest you have:
1. Base Knowledge of 3Commas DCA bots
2. Base knowledge of settings such as “Max safety trades count”, “safety order volume scale” and “safety order step scale”. If these are alien to you, I suggest you read up on these.
3. Knowledge of setting up a Single-pair 3Commas bot for receiving custom TradingView signal.
4. A paper-bot to test your ideas. (Do not use a real money bot until you have tested it sufficiently with a paper-bot. You alone are responsible for your results!)
5. Add the study I created called "R3c0nTrader’s Ranged Volume Study” which adds a separate chart in its own pane showing the volume spikes. It will also generate the “buy” signals for your bot. NOTE: The study also has the same color scheme as this strategy and having the colors in both the strategy and the study will make things easier to see. If you use EvoCrypto’s Ranged Volume Study instead, just keep in mind that the colors won’t match, and you will have to manually match them.
6. Make your buy signals from your strategy are the same as in your study! To do this, use the same “Volume Range Length” you entered in the STRATEGY and enter that value for the “Volume Range Length” in the STUDY. Also ensure you have the same settings for “Heikin Ashi” (On or Off).
Comparisons of Ranged Volume Strategy vs Ranged Volume DCA Strategy
BTCUSD
Beware of Strategies that claim super high profits. This can easily be done by lowering the initial capital to something unrealistic. If I did that with this strategy and set the initial capital $100 and base order size to $100, I get a net profit of 2,864% which is not realistic.
How to Use
1. On the “Inputs” tab:
a. Set your Start and End Time to backtest against.
b. Set your “Volume Range Length” (number of bars to look back)
c. “Heikin Ashi Colors” – Usually I leave this enabled
d. “Show Bar Colors” – Leave enabled
e. “Show Break-Out” – Leave enabled
f. “Show Range” – Leave enabled
g. Set your other inputs which are those settings you would find in your 3Commas bot that you want to test (e.g., Price deviation to open safety orders, Target Take Profit, Base order, Safety order, etc.).
h. Quick Example for BTCUSD on 2hr chart:
i. Price deviation to open safety orders (%) = 6
ii. Target Take Profit (%) = 14
iii. Trailing deviation = 0
iv. Base order = 100
v. Safety order = 200
vi. Safety order volume scale = 2
vii. Safety order step scale = 1.4
viii. Max safety order = 5
2. On the “Properties” tab, set your initial capital, base currency, etc.
a. Initial capital – Default is 10,000 (Please use realistic values here. The amount here should be able to cover ALL your safety orders if they were triggered. Ideally, you should have funds left over and not use all trade capital.)
b. Base currency – Select your currency
c. Order Size - Not used. Use the “Inputs” tab to change your base order size.
d. Leave “Pyramiding” set to 999. This acts as a ceiling to the “Max safety orders” on the “Inputs” tab. It must always be higher than your “Max safety orders.” For example, if you set your “Max safety orders” to “4” and “Pyramiding” to “4” then it effectively means you have “3” “Max safety orders” and not “4” because it is counting each successive entry including the initial order.
e. “Commission” - Optional
f. “Verify price for limit orders” – Leave at zero. This does not change anything that I can tell.
g. Optional - Enter a value for “Commission”
h. Slippage – Optional. Slippage does not occur in backtesting but does occur in real trading but it can be simulated. Example use case for tracking performance of a real money bot: You enter the start date and time of your bot’s trade into this strategy and you notice some values are a little off due to slippage (average price, take profit, safety orders are not lining up) then you would go back here and increase the slippage until those lines up close enough with your actuals.
i. Margin for long positions – I don’t use this honestly.
j. Margin for short positions – I don’t use this honestly.
k. Recalculate “After order is filled” and “On every tick” – I don’t use this honestly.
3. “Style” tab
a. Ranged Volume Bar Coloring - You must disable bar coloring in any studies you added or this may not work properly
i. Color 0 – Default Yellow; appears when a volume breakout occurs
ii. Color 1 – Default Red; appears when a volume breakdown occurs
iii. Color 2 – Light Blue; appears when Close is higher than the Open
iv. Color 3 – Dark Blue; appears when the Close is lower than the Open
b. Take profit – Default Green; take profit line
c. Safety order – Default Light Blue; safety order line
d. No Safety Orders left – Default Red; when a trade runs out of safety orders, the line turns red and there is no safety orders left underneath to catch any further falling price movements.
e. Avg Position Price – Default Orange; your average position price for any given trade.
f. Take Profit Plot Area – Default Green; creates a highlighted area for your take profit
g. SO Plot Area – Default Light Blue; creates a highlighted area for your safety orders
h. Trades on chart – Show or hide your trades on the chart
i. Signal labels – Show or hide the trade signal labels on the chart
j. Quantity – Show or hide the trade quantity on the chart
Explanation of Chart lines and colors on chart

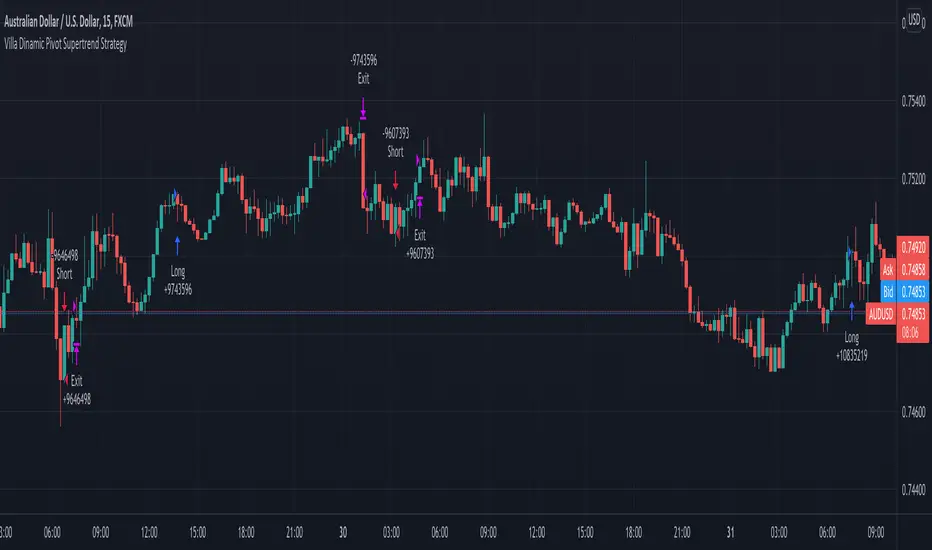
Villa Dinamic Pivot Supertrend StrategyThis strategy works better on AUD/USD in the 15 min timeframe. It uses the Pivot Supertrend to enter trades based on different filters such as:
- Simple EMA filter: that the 3 EMAs should be in order
- DEMA angle: you can choose the DEMA Angle threshold and the look back to check the angle to just trade trades with DEMA at a certain angle
- Simple DEMA filter: just check if close is above or below DEMA
- Take Every Supertrend Signal: this means to take every normal supertrend signal to not just wait for a pivot supertrend signal to enter a trade (specially on long pivot supertrend periods)
- Stop Loss at Supertrend: this means that the stop loss will be at the Normal Supertrend, if false the stop loss will be placed at the ATR level selected.
- 2 Steps Take Profit: this means if you want to close a percentage of position as soon as the normal supertrend crosses the entry price, you can select the % on the "2 Steps TP qty" input
- Stop Loss ATR Multiplier: if Stop Loss at Supertrend is off this will be the stoploss based on the atr
- Take Profit ATR Multiplier: if Stop Loss at Supertrend is off this will be the takeprofit based on the atr (you have to keep in mind that the ratio between this two will make the Risk to reward ratio of the take profit when the Stop Loss at Supertrend)
- Testing: to avoid overfitting, you can select date ranges for backtesting and forwardtesting and select which testing you wanna do
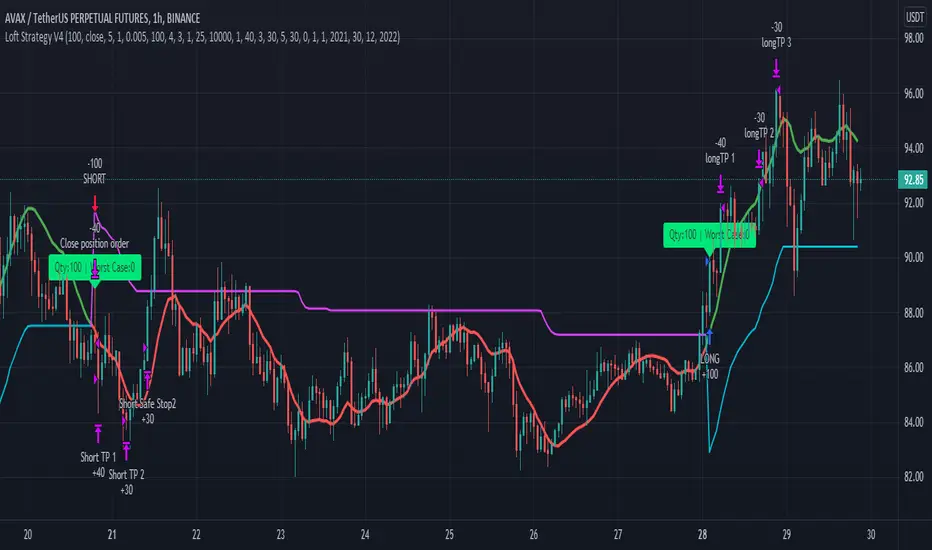
Loft Strategy V4This strategy is an advanced version of the Loft Strategy V1, I shared earlier. (Loft Strategy V1 consists of a kalman filter (by alexgrover ) and a "stop and reverse" line which is following and the kalman filter. If the price goes in the same direction as the position side, the "stop and reverse" line approaches the kalman filter as set on the "Approach Decrease Step" parameter.)
In addition to the previous version, it includes a martingale like deviation and multiple take-profit.
Here it is some parameters definitions of the strategy:
Kalman Filter: The higher this parameter, the faster and more aggressive the filter. Otherwise the filter goes very smoothly
Beginning Approach: First approximation as a percentage of stop-n-reverse line
Final Approach: Minimum approximation of stop-n-reverse line
Approach Decrease Step: If the price moves in the same direction as the strategy, the approach percentage is reduced by this parameter. Otherwise nothing do
Base Order Quantity: Initial capital of position
Max Safe Order Attempt: This parameter determines the maximum number of times the strategy will raise the bet after losing in a row.
Safe Order Deviation: if the last trade is loss, multiply the bet by this parameter (aka. martingale factor)
Profit Deviation: if last trade in loss, multiply the take-profit points
Max Order Quantity: Maximum capital allowed for a position
TP1, TP2, TP3 : Take profit spots in percentage
QT1, QT2, QT3: Amount of take-profit spots
Stop Loss: Maximum stop loss allowed for a trade
Long Entry, Short Entry: Only long side, only short side or both side
Safe Stop After TP2: If the price reaches the TP2 point, move the stop-loss point to the entry price.
Safe Stop After TP1: If the price reaches TP1, move the stop-loss point to the stop-n-reverse line.
PVSRA Volume Price - Some people say "Price Action is King". I say, we cannot know how the MMs (Market Makers) will move price next, period. But price tends to consolidate above key SR when MMs are filling short orders for SM (Smart Money) and long orders for DM (Dumb Money), and price tends to consolidate below key SR when MMs are filling long orders for SM and short orders for DM. The MMs are also "SM", and they tend to do the other SMs "one better"! This means that after the MMs fill the SM/DM orders, they might move price a bit further in an attempt to stop out some of those SM executed orders and sucker in more DM; both giving liquidity for the MMs to add to their own SM side position. Yes, the MMs are bastards. But the point is that could leave price not "nicely" above or below a SR anymore, yet more consolidation can occur.
Volume - Increases in activity denote increase in interest. But, is it long or short interest? Where is price in the bigger picture when this is happening? Is it at relative highs, or lows in the overall price action? And if a high volume bar is for a candle which you can examine by going to lower TF charts, you might see where in the spread of that candle the most volume occurred, high or low! Using volume is about taking note of relative increases in volume and what price is doing at the same time. Are the better volumes favoring the lower or the higher prices, as the MMs waffle price up and down? And do the volumes get particularly notable when the MMs take price above or below key SR?
S&R - Read all about S&R at "Baby Pips.com". What I want you to realize here is that the whole, half and quarter numbered price levels (hereinafter referred to as "Levels") are the most important SR of all in this market! Not because price stops, pauses, proceeds or reverses there, but because it is above or below these levels that important consolidation (MMs filling SM orders) takes place. Once SM long orders are filled, they become interested in placing orders to close them at higher prices, and hence the MMs will be moving price higher, eventually. Once SM short orders are filled, they become interested in placing orders to close them at lower prices, and hence the MMs will be moving price lower, eventually.
PVSRA - If we can spot consolidations above/below key SR, examine the overall price action on various TF charts, and take note of where the notable increases in volume have most recently occurred (did volume favor relative highs or lows), then we can build a consensus about what kind of orders the MMs have most recently been filling; buying to open longs or close shorts, or selling to open shorts or close longs. And we can get a better idea if things will next become bullish or bearish. And once PA confirms our bullish or bearish PVSRA results, by recognizing the importance of Levels we can look beyond current PA in the direction it is going and look to historic PA S&R (consolidation around key Levels) to come up with candidates for where the price might be headed. And bull or bear swings typically run in terms of 100+, 150+, 200+ pips, .....etc. And now you know why.
Okay. Now, if this is your first introduction to PVSRA, and having just read the above, you are likely scratching your head and still confused. That is normal. I will tell you a secret about the market and why you have a right to be confused. The secret is this. The market cannot be defined by mathematics nor by immutable logic. This is why the most advanced mathematicians over a century have never even come close to cracking the market. It cannot be done. Something else, other than math and immutable logic is the fundamental operand in the market. Have you ever watched a child attempt a jigsaw puzzle for the first time? And watched as that child grew and attempted more of them, and more complex ones? What is at work in the market I will elaborate on later, but for now trust me in this. We need to apply ourselves to learning how to do PVSRA just as a child attacks learning how to do jigsaw puzzles. And we must continue doing PVSRA, because in time our mind will "learn" when we have just picked up an important piece of the puzzle, and that we know where it goes! Developing the skill of PVSRA is an art form. We must not allow ourselves to feel badly if we miss clues. PVSRA is an art form that takes time to perfect. Over time our skill will grow and our "read" of the unpredictable market will improve. We must take to ongoing learning and application of PVSRA.
Introduction to How the Market Really Works
Does anybody remember the "lil' Abner" cartoons in the Sunday papers? Let me draw for you a mental picture of how the market really works.....
Imagine Daddy Yokum ferociously racing a buckboard wagon up and down the steep inclines and declines in the rough, rocky mountain road that has sharp turns and a sheer cliff on one side. The wagon wheels are spewing rocks off the side of the cliff! Even Daddy Yokum's shotgun is going off due to the jolting of the buckboard! Daddy Yokum has a demented look on his face, but he is smiling! The horse has a wild look in it's eyes and is frothing at the mouth. There are two passengers being tossed around in the back of the buckboard, terror stricken! Now, let's pan back from this cartoon picture and place the labels needed. On the side of the wagon is the sign "Market Pricing". The demented, smiling Daddy Yokum, is the Market Maker. The passengers being tossed around are the buyers and sellers.
.....Got it? Market prices are not determined by the buyers and sellers. They are determined by the Robber Bank Market Makers (MMs).
MMs are Market Manipulators of Price, and Thieves!
The "market" is the sole creation of the Robber Banks that "make the market". While it serves the world of commerce, they run it to make profits. And they opened the market up to foster prolific currency trading by others for the sole purpose of making more profits. They move prices up and down to "create liquidity" to fill the orders of SM (Smart Money) and DM (Dumb Money), for the commissions they make by filling the orders. When they have some orders above the current price and some below the current price, who do you think determines the sequence of direction and distance the price is going to move so these orders can be filled? And always - since they know how they are going to move price next - they take positions themselves to make additional profits.
They do this by:
1. Manipulating price to sucker into the market DM that is taking the wrong side position.
2. Manipulating price to sucker into the market SM that is taking the right side position, but too soon, and later manipulating price to hit their stops.
They have total control of pricing, and by these actions they effectively "steal" from others the money to fill their own "right side" positions before moving the price to the next area they have decided on for filling orders, and for taking profit on their positions built beforehand. Don't get me wrong. I do not object to the market volatility these thieving Robber Banks create. We need it. But we also need to understand what these people are like, the cloth they are cut from. They are crooks, and we have to be extra careful about trading in the market they operate. On some special days you can see them in their true colors. We should witness it. Take note of it. Speak of it. And remember it!

Volume Based Ichimoku CloudIntroduction
This release focuses primarily on a volume-based Donchian. For some time I was looking for a volume-based Donchian, not finding anything that satisfied me I tried to apply one, and then I applied it to Ichimoku.
I found advantages especially in the lateralization phase, where the integration with the volume filters some false signals.
I have added some features:
- Check the conditions of buy/sell of classic Ichimoku
- Verified reverse buy/sell condition
- Alerts
- Entrance package
- possibility to choose the type of Donchian to use (classic, volume-based)
Settings
There are the classic parameters of Ichimoku, for scalping, I use setting like(6-17-34-17 or 5-14-28-14), the new parameters are:
Donchian Type : Classic / Volume Based
Show Condition : it shows green/red square on the bottom when all the conditions of Ichimoku are satisfied, without the checkmark the inputs or the alarms will not work for this type of signal
Show Reversal : it shows yellow/purple triangle on the bottom when all during short/long state condition of Ichimoku Tenkan cross the Kijun, without the checkmark the inputs or the alarms will not work for this type of signal
Trades Framework
Show Trade Lines : show the lines for Entry Point, TP1, TP2, SL
Per n Bars : For how many bars the sending lines will be drawn
Enter Gap : It's the gap, in percentage, from the last candle low/high. For example, the entry point will be set 0.1% higher than the last high of the candle, in a long situation, or 0.1% lower than the last low of the candle in a short situation.
Take Profit 1 : It's the gap, in percentage, from the entry point. For example, the first take profit will be set 0.5% higher/lower than the entry point.
Take Profit 2 : It's the gap, in percentage, from the entry point. For example, the second take profit will be set 0.5% higher/lower than the entry point.
Stop Loss : It's the gap, in percentage, from the entry point. For example, the stop loss will be set 0.5% higher/lower than the entry point.
How to use
The use will be like that for the classic Ichimoku, the combination with a volatility indicator or the volume analysis will certainly help to reduce false signals and therefore to select only the most profitable signals.
Remember that every statistical indicator is just a tool, it needs to be understood to be used at its best, otherwise, it is just a colored line in a colored graph.

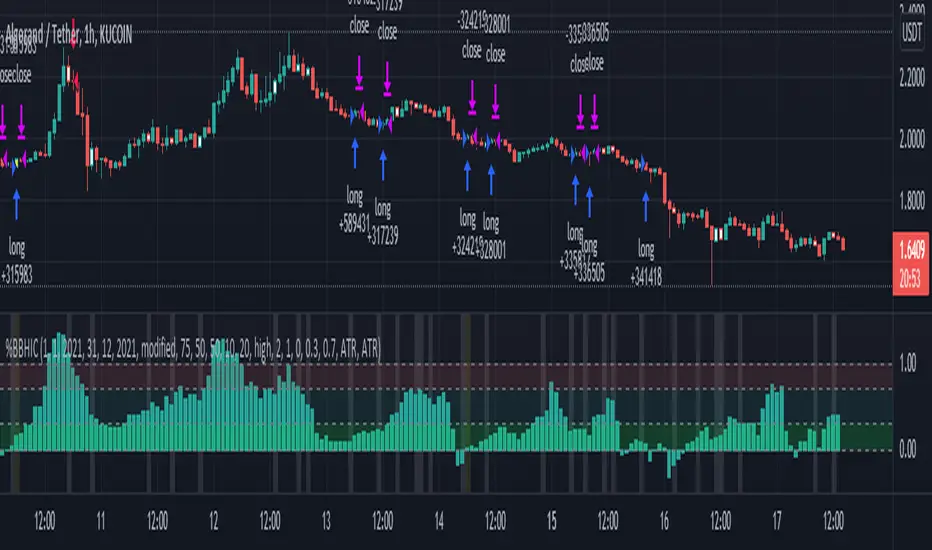
Bollinger Bands %B - Belt Holds & Inner CandlesThis is a simple strategy that uses Bollinger Bands %B represented as a histogram combined with Candle Beltholds and Inside candles for entry signals, and combines this with "buy" and "sell" zones of the %B indicator, to buy and sell based on the zones you set.
How to use:
Long when in the green zone and an inside candle (which is highlighted in white) or a bullish belt hold (which is highlighted in yellow), and sell when inside a red zone and has an inside candle or a bearish belt hold (which is highlighted in purple) or the stop loss or take profit is hit.
Short when in the red zone and an inside candle (which is highlighted in white) or a bearish belt hold (which is highlighted in purple), and sell when inside a green zone and has an inside candle or a bullish belt hold (which is highlighted in yellow) or the stop loss or take profit is hit.
Stop loss / take profit selection:
Choose which performs best for you, ATR based uses the average true range, and % based is based on a set percent of loss or profit.
DI Crossing Daily Straregy HulkTradingSimple strategy based on crossing DI+ and DI- and Average True Range.
Long entry when DI+ crossover DI-
Short entry when DI+ crossunder DI-
Stop Loss and Take Profits based on Average True Range.
Default values are 1*ATR(14) for stop loss and 2*ATR(14) for Take Profit.
Risk reward 1 to 2 ratio.
Recommended default values, but you can change it if you want.
Recommended timeframe - 1D.
Script was tested on BTCUSDT pair and have a 2.4 profit factor.

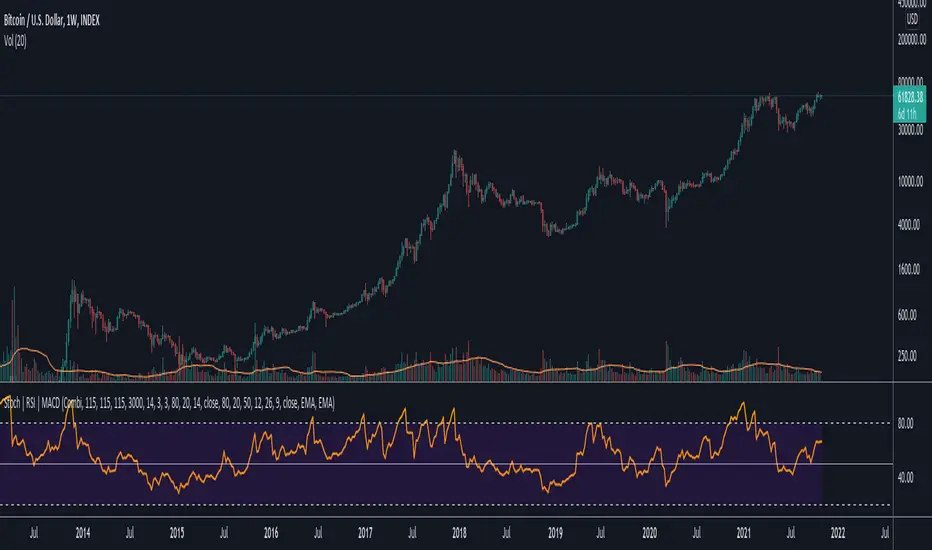
Data Trader Stoch | RSI | MACD Strategy IndicatorImplementation of Data Trader's strategy, described in the youtube video, "Highly Profitable Stochastic + RSI + MACD Trading Strategy (Proven 100x)"
Also see Algovibes' video, "Highly Profitable Stochastic + RSI + MACD Trading Strategy? Testing Data Traders strategy in Python"
Note: Despite the claims, it generates barely, if any, signals, certainly in the crypto markets
If there are any mistakes, give feedback in the comments, and I'll fix
### Strategy Summary ###
# Long Signals #
Stoch K and D are oversold
RSI above midline
MACD above signal line
# Short Signals #
Stoch K and D are overbought
RSI below midline
MACD below signal line
# Stop loss and Take Profit #
Stop loss
Longs: below last swing low
Shorts: above last swing high
Take profit at 1.5x stop loss
Mid to High daily % - MA & ThresholdPurpose of this script is to provide a metric for comparing crypto volatility in terms of the % gain that can be garnished if you buy the midpoint price of the day and sell the high***. I'm specifically using bots that buy non-stop. This metric makes it easy to compare crypto coins while also providing insight on what a take profit % should be if I want to be sure it closes often instead of getting stuck in a position.
Added a few moving averages of (Mid-range to High Daily %). When these lines starts to trend down, it's time to lower the take profit % or move on to the next coin.
Decided to add a threshold so I could easily mark where I think the (Mid-range to High Daily %) is for most days.
Ex. I can mark 10% threshold and can eyeball roughly ~75% of the days in the past month or so were at or above that level. Then I know I have plenty volatility for a bot taking 5% profit. Also if you have plenty of periodic poke-through that month (let's say once a week) you might argue that you can set it to 7% if you're willing to wait about that long. Either way this metric is conservative because it is only the middle of the range to the high, a less conservative version might provide the % gain if you bought the day low and sold the day high.
***Since this calculation only takes the middle of the range and the high of the day into account, red days are volatile against a buyer but to your advantage if you are a seller. BUT if you have plenty of safety buy orders this volatility in price only means your total purchase volume increases and when/if you reach a take profit level you sell more there.
Would like to upgrade and add a separate MA line for green days and a separate MA line for red days to discern if that particular coin has a bias. Also would like to include some statistics on how many candles are above or below threshold for a certain period instead of eyeballing.

SQZ Multiframe StrategyThis is a first attempt to automate what my current strategy when trading is.
It uses 2 timeframes: the one you are currently using to see the chart and an "anchor trend" which is a higher order frame.
Supported timeframes are: 1m, 5m, 15m, 30m, 1H, 4H, 1D, 1W
The Strategy relies on two indicators:
Squeeze Momentum Indicator
CMF
How does it works?
It looks for a moment when the following conditions are met.
For Long:
Positive directionality in SQZM monitor in anchor timeframe
Positive directionality in SQZM monitor in current timeframe
Recent minimum in CMF
For Short:
Negative directionality in SQZM monitor in anchor timeframe
Negative directionality in SQZM monitor in current timeframe
Recent maximum in CMF
After a BUY or SELL order is executed the plot will start showing two lines: A TP line, and a SL line.
The TP and SL move dynamically based on a greedy algorithm based on 3 input parameters.
Min Profit to Start Moving SL (%): Sets an initial target for the trade.
Maximum Possible of SL (%): This is the maximum amount possible for SL. If volatility is not too high, a shorter SL will be chosen based on Kaufman's Stops method
Take profit factor: Is how much portion of the target I am taking as profit once the target is reached
Example for 5% Min profit:
When the first target is reached (+5%), the SL will be updated to 2.5% over the enter price.
When the second target is reached (+10%), the SL will be updated to 5% over the enter price.
Note: The strategy might abandon the position prematurely if a contrary signal is received while the trade is opened, and will change direction.
The Strategy has been backtested mostly for crypto. It might be good for stocks too, but the parameters mentioned might need some adjustments since price moves at a different rate.
Recommended timeframe is 4H for BTC , and 30min/1H for alts.
Comments and ideas are more than welcome!

Strategy Template - V2This is an educational script created to demonstrate few basic building blocks of a trend based strategy and how to achieve different entry and exit types. My initial intention was to create a comprehensive strategy template which covers all the aspects of strategy. But, ended up creating fully fledged strategy based on trend following.
This is an enhancement on Strategy-Template But this script is comparitively more complex. Hence I decided to create new version instead of updating the existing one.
Lets dive deep.
SIMPLE COMPONENTS OF TREND FOLLOWING STRATEGY
TREND BIAS - This defines the direction of trend. Idea is not to trade against the trend direction. If the bias is bullish, look for long opportunities and if bias is bearish, look for short opportunities. Stay out of the market when the bias is neutral.
Often, trend bias is determined based on longer timeframe conditions. Example - 200 Moving Average, Higher timeframe moving averages, Higher timeframe high-lows etc. can be used for determining the trend bias.
In this script, I am using Weekly donchian channels combined with daily donchian channels to define trend bias.
Long Bias - 40 Day donchian channel sits completely in upper portion of 40 Week dochnial channel.
Short Bias - 40 Day donchian channel sits completely in lower portion of 40 Week donchian channel.
ENTRY CONDITION - Entry signals are generated only in the direction of bias. Hence, when in LongBias, we only get Long signals and when in short bias, we only get short signals.
In our case, when in Long Bias - if price hits 40 day high for the first time, this creates our long entry signal. Similarly when in Short Bias , price hitting 40 day low will create signal for going short. Since we do not take trades opposite to trend, no entry conditions are formed when price hits 40 day high in Short Bias or 40 day low in Long Bias.
EXIT CONDITION - Exit conditions are formed when we get signals of trend failure.
In our case, when in long trade, price hitting 40 day low creates exit signal. Similarly when in short trade price hitting 40 day high creates exit signal for short trade.
DIFFERENT TYPES OF ENTRY AND EXIT
In this script, I have tried to demonstrate different entry and exit types.
Entry types
Market - Enter immediately when entry signal is received. That is, in this case when price crossover over high in long bias and crosses under low in short bias
Stop - This method includes estimating at what level new highs are made and creating a stop buy order at that level. This way, we do not miss if the break out is stronger. But, susciptible to fail during fakeouts.
Limit - This method includes executing a limit order to buy at lower price or sell at higher price. In trend following methods, downside of limit order is when there is genuine breakout, these limit orders may not hit and during trend failures the limit orders are likely to hit and go straight to stop.
Stop-Limit - this is same as stop order but will also place a limit condition to avoid buying on overextended breakout or with lots of slippage.
Exit types
Market - whether to keep the existing trade running or whether to close it is determined after close of each bar and exit orders are executed manually upon receiving exit signal.
Stop - We place stop loss orders beforehand when there is a trade in place. This can help in avoiding big movements against trade within bar. But, this may also stop on false signals or fakeouts.
Take profit
Stop - No take profits are configured.
Target - 30% of the positions are closed when take profit levels are hit. Take profit levels are defined by risk reward.
USING THE CODE AS TEMPLATE
As mentioned earlier, I intended to create a fully fledged strategy template. But, ended up creating a fully fledged stratgy. However, you can take some part of this code and use it to start your own strategy. Will explain what all things can be adopted without worrying about the strategy implementation within
Strategy definition : This can be copied as is and just change the title of strategy. This defines some of the commonly used parameters of strategy which can help with close to realistic backtesting results for your coded strategy and comparison with buy and hold.
Generic Strategy Parameters : The parameter which defines controlling alllowed trade direction and trading window are present here. This again can be copied as is and variable inDateRange can be directly used in entry conditions.
Generic Methods : f_getMovingAverage and f_secureSecurity are handy and can be used as is. atr method provideded by pine gives you ATR based on RMA. If you want SMA or any other moving average based ATR, you can use the method f_getCustomAtr
Trade Statements : This section has all types of trading instructions which includes market/stop/limit/stop-limit type of entries and exits and take profit statements. You can adopt the type of entry you are interested in and change when condition to suit your strategy.
Trade conditions and levels : This section is required. But, cannot be copied. All the trade logic goes here which also sets parameters which are used in when of Trade Statements.
Hope this helps.

Gap RiderThis Indicator allows you to make statistics on the performance of any underlying on the days in which an opening gap occurs.
Specifically, the indicator was designed for "0 dte" options trades. In fact, it is possible to find parameters that give a good statistical advantage by opening a spread in the direction of the gap, creating a trade that has a risk-return ratio of 1: 1.
The indicator shows flags on the graph (green in case of gap up, red in case of gap down) and colored boxes (green in case the stock closed in the direction of the gap, red in case the stock closed in the opposite direction to the gap, yellow in the event that the stock closed at a distance that did not allow the spread in options to close in maximum loss or maximum profit, and therefore in breakeven)
The statistics panel, on the other hand, contains all the information necessary to search for parameters that give the trader a good statistical advantage.
In the settings you can filter the days of the week, only gap up or only gap down, ATR thresholds (volatility), points or minimum percentage for which a gap is taken into account, measure of the breakeven (which for options traders should represent the half the width of the spread to open), large gaps filter that takes into consideration only gaps that open out of range compared to the previous session. The Lookback parameter of course is used to set how many bars to take into account for the statistics.
Parameters and recommended strategy:
TODAY 31/08/2021 - Lookback 500 bars (2 years)
UNDERLYING: SPX
FILTERS: only Monday and Wednesday, only gap up, only gap> 0.01%
STRATEGY: exactly at opening, cover an ATM spread in the direction of the gap (example: gap up, I open a long call spread) that has the opening price as a break even, with a risk-return ratio of 1: 1 and leave it open until closing session, or set take profit at 90-95%. It is advisable to take into consideration the SPX statistics but to operate on the ES future so as to be able to open the spread a couple of minutes before the opening of the cash session and prevent the trade from "running away" due to too sudden movements of the opening. .
RESULTS:
124 Trade
70% profitable trades
30% losing trades
Max drawdown 3 trades
So assuming a spread on ES 10 points wide, each trade would gain or lose $ 250, applying the described strategy we would have in two years, investing only $ 250, a profit of $ 12500, with a max drawdown of $ 750. We would therefore have a profit of 5000%, or rather 2500% per year on the invested capital, with a drawdown of a much lower proportion of the profit ($ 750 compared to $ 6250 of annual profit).
The strategy is infinitely scalable by increasing the options contracts used and the impact of the commissions is almost zero.
MONEY MANAGEMENT: Example on a 50K account, with a spread that earns or loses $ 500, in two years it earns $ 25,000, therefore about 12500 per year, with a max drawdown of $ 1500, therefore 25% per year on the ENTIRE ACCOUNT with a maximum drawdown of 3%.
Note: the test was performed without a break even parameter, so the actual result will be more moderate, but of the same explosive nature.
** BUG STILL LOOKING FOR SOLUTION **
only in case the filters are set to take into account ONLY the gap down, the drawdown count in the statistics panel shows an incorrect result "

Maximized Scalping On Trend (by Coinrule)" The trend is your friend. " This is one of the most famous and valuable teachings that experienced traders can give to newbies. There is a reason for that.
No matter your views about where the price moves, what matters is where the price heads to . The market is always right, and ultimately it decides who gets the profit and who has to take a loss.
The purpose of this strategy is to spot when it's the most suitable time to buy an asset profiting from a potential short-term price increase. The strategy tends to open trades frequently, closing them on average in one and a half days.
ENTRY
The buy order is placed on assets that present strong momentum when it's more likely that it is about to increase further in the short term.
To capture momentum on the asset, the rule strategy requires:
the MA50 greater than the MA100
the RSI greater than 50
The rule, then, places the order when
The price crosses above the MA9.
EXIT
This strategy comes with a stop loss and a take profit which adapt dynamically to market conditions.
The trade is closed in profit when the RSI is greater than 70 , as the trend could experience a pull-back.
Alternatively, the trade is closed when the RSI is lower than 30 , being this a sign of weakening of the trend.
Pro tip : The 1-hour time frame has proven to return the best results on average. The strategy can also work well in the 15-min time frame if you want to increase the trades' frequency.
The strategy assumes each order to trade 30% of the available capital and opens a trade at a time. A trading fee of 0.1% is taken into account.

Bollinger Band Width PercentileIntroducing the Bollinger Band Width Percentile
Definitions :
Bollinger Band Width Percentile is derived from the Bollinger Band Width indicator.
It shows the percentage of bars over a specified lookback period that the Bollinger Band Width was less than the current Bollinger Band Width.
Bollinger Band Width is derived from the Bollinger Bands® indicator.
It quantitatively measures the width between the Upper and Lower Bands of the Bollinger Bands.
Bollinger Bands® is a volatility-based indicator.
It consists of three lines which are plotted in relation to a security's price.
The Middle Line is typically a Simple Moving Average.
The Upper and Lower Bands are typically 2 standard deviations above, and below the SMA (Middle Line).
Volatility is a statistical measure of the dispersion of returns for a given security or market index, measured by the standard deviation of logarithmic returns.
The Broad Concept :
Quoting Tradingview specifically for commonly noted limitations of the BBW indicator which I have based this indicator on....
“ Bollinger Bands Width (BBW) outputs a Percentage Difference between the Upper Band and the Lower Band.
This value is used to define the narrowness of the bands.
What needs to be understood however is that a trader cannot simply look at the BBW value and determine if the Band is truly narrow or not.
The significance of an instruments relative narrowness changes depending on the instrument or security in question.
What is considered narrow for one security may not be for another.
What is considered narrow for one security may even change within the scope of the same security depending on the timeframe.
In order to accurately gauge the significance of a narrowing of the bands, a technical analyst will need to research past BBW fluctuations and price performance to increase trading accuracy. ”
Here I present the Bollinger Band Width Percentile as a refinement of the BBW to somewhat overcome the limitations cited above.
Much of the work researching past BBW fluctuations, and making relative comparisons is done naturally by calculating the Bollinger Band Width Percentile.
This calculation also means that it can be read in a similar fashion across assets, greatly simplifying the interpretation of it.
Plotted Components of the Bollinger Band Width Percentile indicator :
Scale High
Mid Line
Scale Low
BBWP plot
Moving Average 1
Moving Average 2
Extreme High Alert
Extreme Low Alert
Bollinger Band Width Percentile Properties:
BBWP Length
The time period to be used in calculating the Moving average which creates the Basis for the BBW component of the BBWP.
Basis Type
The type of moving average to be used as the Basis for the BBW component of the BBWP.
BBWP Lookback
The lookback period to be used in calculating the BBWP itself.
BBWP Plot settings
The BBWP plot settings give a choice between a user defined solid color, and a choice of "Blue Green Red", or "Blue Red" spectrum palettes.
Moving Averages
Has 2 Optional User definable and adjustable moving averages of the BBWP.
Visual Alerts
Optional User adjustable High and low Signal columns.
How to read the BBWP :
A BBWP read of 95 % ... means that the current BBW level is greater than 95% of the lookback period.
A BBWP read of 5 % .... means that the current BBW level is lower than 95% of the lookback period.
Proposed interpretations :
When the BBWP gets above 90 % and particularly when it hits 100% ... this can be a signal that volatility is reaching a maximum and that a macro High or Low is about to be set.
When the BBWP gets below 10 % and particularly when it hits 0% ...... this can be a signal that volatility is reaching a minimum and that there could be a violent range breakout into a trending move.
When the BBWP hits a low level < 5 % and then gets above its moving average ...... this can be an early signal that a consolidation phase is ending and a trending move is beginning.
When the BBWP hits a high level > 95 % and then falls below its moving average ... this can be an early signal that a trending move is ending and a consolidation phase is beginning.
Essential knowledge :
The BBWP was designed with the daily timeframe in mind, but technical analysists may find use for it on other time frames also.
High and Low BBWP readings do not entail any direction bias.
Deeper Concepts :
In finance, “mean reversion” is the assumption that a financial instrument's price will tend to move towards the average price over time.
If we apply that same logic to volatility as represented here by the Bollinger band width percentile, the assumption is that the Bollinger band width percentile will tend to contract from extreme highs, and expand from extreme lows over time corresponding to repeated phases of contraction and expansion of volatility.
It is clear that for most assets there are periods of directional trending behavior followed by periods of “consolidation” ( trading sideways in a range ).
This often ends with a tightening range under reducing volume and volatility ( popularly known as “the squeeze” ).
The squeeze typically ends with a “breakout” from the range characterized by a rapid increase in volume, and volatility when price action again trends directionally, and the cycle repeats.
Typical Use Cases :
The Bollinger Band Width Percentile may be especially useful for Options traders, as it can provide a bias for when Options are relatively expensive, or inexpensive from a Volatility (Vega) perspective.
When the Bollinger Band Width Percentile is relatively high ( 85 percentile or above ) it may be more advantageous to be a net seller of Vega.
When the Bollinger Band Width Percentile is relatively low ( 15 percentile or below ) it may be advantageous to be net long Vega.
Here we examine a number of actionable signals on BTCUSD daily timeframe using the BBWP and a momentum oscillator ( using the TSI here but can equally be used with Bollinger bands, moving averages, or the traders preferred momentum oscillator ).
In this first case we will examine how a spot trader and an options trader could each use a low BBWP read to alert them to a good potential trade setup.
note: using a period of 30 for both the Bollinger bands and the BBWP period ( approximately a month ) and a BBWP lookback of 350 ( approximately a year )
As we see the Bollinger Bands have gradually contracted while price action trended down and the BBWP also fell consistently while below its moving average ( denoting falling volatility ) down to an extremely low level <5% until it broke above its moving average along with a break of range to the upside ( signaling the end of the consolidation at a low level and the beginning of a new trending move to the upside with expanding volatility).
In this next case we will continue to follow the price action presuming that the traders have taken or locked in profit at reasonable take profit levels from the previous trade setup.
Here we see the contraction of the Bollinger bands, and the BBWP alongside price action breaking below the BB Basis giving a warning that the trending move to the upside is likely over.
We then see the BBWP rising and getting above its moving average while price action fails to get above the BB Basis, likewise the TSI fails to get above its signal line and actually crosses below its zeroline.
The trader would normally take this as a signal that the next trending move could be to the downside.
The next trending move turns out to be a dramatic downside move which causes the BBWP to hit 100% signaling that volatility is likely to hit a maximum giving good opportunities for profitable trades to the skilled trader as outlined.
Limitations :
Here we will look at 2 cases where blindly taking BBWP signals could cause the trader to take a failed trade.
In this first example we will look at blindly taking a low volatility options trade
Low Volatility and corresponding low BBWP levels do not automatically mean there has to be expansion immediately, these periods of extreme low volatility can go on for quite some time.
In this second example we will look at blindly taking a high volatility spot short trade
High volatility and corresponding high BBWP levels do not automatically mean there has to be a macro high and contraction of volatility immediately, these periods of extreme high volatility can also go on for quite some time, hence the famous saying "The trend is your friend until the end of the trend" and lesser well known, but equally valid saying "never try to short the top of a parabolic blow off top"
Markets are variable and past performance is no guarantee of future results, this is not financial advice, I am not a financial advisor.
Final thoughts
The BBWP is an improvement over the BBW in my opinion, and is a novel, and useful addition to a Technical Analysts toolkit.
It is not a standalone indicator and is meant to be used in conjunction with other tools for direction bias, and Good Risk Management to base sound trades off.
John Bollinger has suggested using Bolliger bands, and its related indicators with two or three other non-correlated indicators that provide more direct market signals.
He believes it is crucial to use indicators based on different types of data.
Some of his favored technical techniques are moving average divergence/convergence (MACD), on-balance volume and relative strength index (RSI).
Thanks
Massive respect to John Bollinger, long-time technician of the markets, and legendary creator of both the Bollinger Bands® in the 1980´s, and the Bollinger band Width indicator in 2010 which this indicator is based on.
His work continues to inspire, decades after he brought the original Bollinger Bands to the market.
Much respect also to Eric Crown who gave me the fundamental knowledge of Technical Analysis, and Options trading.

CUT MY LOSSESS - Levereged Stop loss + R / R ratio checker Hello traders!
We have heard many times that keep your losses small and allow your profits to grow. But what happens is that we often make the mistake of doing high-margin trades that we cannot afford to lose. The main reason for this problem, in my opinion, is the rush to open a position and not paying attention to how much acceptable loss in each trade is for us? Is our stop loss point compatible with the loss we are willing to accept?
Many of the losses we incur are not due to our erroneous analysis but to the wrong trading strategy, miscalculation of Stop Loss and failure to calculate the Risk/Reward for each trade. At least for most novice traders, these mistakes happen .
This script does not have complicated logic and is designed only as a help for those who are not interested in working with calculators !! I hope that sometimes that we are very excited to buy, looking at this script can give us a serious flip to avoid risk .
This is a basic script that helps us to intuitively check our stop loss in according to our leverage and to guess the approximate risk/reward of our trade. This script assumes that you always trade with half of your total capital. It is also assumed that you routinely use up to ten percent of your capital for each trade. Therefore, the first variable in this script is the amount of tolerable loss in each trade for you, which is set to 25% by default. So if you follow the previous assumptions, each trade will endanger 2.5% of your capital.
Since not all analyzes are ever accurate, we need to enter into positions that have good Risk/Reward ratio, so that even if half of our analysis fails, we will profitable. Therefore, the second variable in this script is the acceptable Risk/Reward ratio for us, which is set to 1:4 by default.
Also, to check the efficiency of the stop-loss with different trading leverage, I add five leverage by default from 1 to 5 as lines on the side of your stop-loss point.
LeV A (Lowest Leverage-WHITE): 1 by default
LeV B (AQUA): 2 by default
LeV C (YELLOW): 3 by default
LeV D (ORANGE): 4 by default
LeV E (Highest Leverage-RED):5 by default
You can change all these leverages and Acceptable margin loss and R/R ratio according to your needs.
You can also hide the leverage lines you are not dealing with through the script settings .
You will also see lines on the side of your target point to check your risk/reward ,so you can approximate your target according to your trading leverage and the risk/reward you accept. you can also hide these R/R lines from the setting.
Important Note: This script is not designed to give you a stop loss point or take profit point.
To find these points, you must use technical analysis methods , and then use this script to check the coordination of these points with your trading strategy.
Using the script is simple, but I will try to explain it with a few examples.

Risk Management: Position Size & Risk RewardHere is a Risk Management Indicator that calculates stop loss and position sizing based on the volatility of the stock. Most traders use a basic 1 or 2% Risk Rule, where they will not risk more than 1 or 2% of their capital on any one trade. I went further and applied four levels of risk: 0.25%, 0.50%, 1% and 2%. How you apply these different levels of risk is what makes this indicator extremely useful. Here are some common ways to apply this script:
• If the stock is extremely volatile and has a better than 50% chance of hitting the stop loss, then risk only 0.25% of your capital on that trade.
• If a stock has low volatility and has less than 20% change of hitting the stop loss, then risk 2% of your capital on that trade.
• Risking anywhere between 0.25% and 2% is purely based on your intuition and assessment of the market.
• If you are on a losing streak and you want to cut back on your position sizing, then lowering the Risk % can help you weather the storm.
• If you are on a winning streak and your entries are experiencing a higher level of success, then gradually increase the Risk % to reap bigger profits.
• If you want to trade outside the noise of the market or take on more noise/risk, you can adjust the ATR Factor.
• … and whatever else you can imagine using it to benefit your trading.
The position size is calculated using the Capital and Risk % fields, which is the percentage of your total trading capital (a.k.a net liquidity or Capital at Risk). If you instead want to calculate the position size based on a specific amount of money, then enter the amount in the Custom Risk Amt input box. Any amount greater than 0 in the Custom Risk Amt field will override the values in the Capital and Risk % fields.
The stop loss is calculated by using the ATR. The default setting is the 14 RMA, but you can change the length and smoothing of the true range moving average to your liking. Selecting a different length and smoothing affects the stop loss and position size, so choose these values very carefully.
The ATR Factor is a multiplier of the ATR. The ATR Factor can be used to adjust the stop loss and move it outside of the market noise. For the more volatile stock, increase the factor to lower the stop loss and reduce the chance of getting stopped out. For stocks with less volatility , you can lower the factor to raise the stop loss and increase position size. Adjusting the ATR Factor can also be useful when you want the stop loss to be at or below key levels of support.
The Market Session is the hours the market is open. The Market Session only affects the Opening Range Breakout (ORB) option, so it’s important to change these values if you’re trading the ORB and you’re outside of Eastern Standard Time or you’re trading in a foreign exchange.
The ORB is a bonus to the script. When enabled, the indicator will only appear in the first green candle of the day (09:30:00 or 09:30 AM EST or the start time specified in Market Session). When using the ORB, the stop loss is based on the spread of the first candle at the Open. The spread is the difference between the High and Low of the green candle. On 1-day or higher timeframes, the indicator will be the spread of the last (or current) candle.
The output of the indicator is a label overlaying the chart:
1. ATR (14 RMA x2) – This indicated that the stop loss is determined by the ATR. The x2 is the ATR Factor. If ORB is selected, then the first line will show SPREAD, instead of ATR.
2. Capital – This is your total capital or capital at risk.
3. Risk X% of Capital – The amount you’re risking on a % of the Capital. If a Custom Risk Amt is entered, then Risk Amount will be shown in place of Capital and Risk % of Capital.
4. Entry – The current price.
5. Stop Loss – The stop loss price.
6. -1R – The stop loss price and the amount that will be lost of the stop loss is hit.
7. – These are the target prices, or levels where you will want to take profit.
This script is primarily meant for people who are new to active trading and who are looking for a sound risk management strategy based on market volatility . This script can also be used by the more experienced trader who is using a similar system, but also wants to see it applied as an indicator on TradingView. I’m looking forward to maintaining this script and making it better in future revisions. If you want to include or change anything you believe will be a good change or feature, then please contact me in TradingView.

Ultimate Strategy TemplateHello Traders
As most of you know, I'm a member of the PineCoders community and I sometimes take freelance pine coding jobs for TradingView users.
Off the top of my head, users often want to:
- convert an indicator into a strategy, so as to get the backtesting statistics from TradingView
- add alerts to their indicator/strategy
- develop a generic strategy template which can be plugged into (almost) any indicator
My gift for the community today is my Ultimate Strategy Template
Step 1: Create your connector
Adapt your indicator with only 2 lines of code and then connect it to this strategy template.
For doing so:
1) Find in your indicator where are the conditions printing the long/buy and short/sell signals.
2) Create an additional plot as below
I'm giving an example with a Two moving averages cross.
Please replicate the same methodology for your indicator wether it's a MACD, ZigZag, Pivots, higher-highs, lower-lows or whatever indicator with clear buy and sell conditions
//@version=4
study(title='Moving Average Cross', shorttitle='Moving Average Cross', overlay=true, precision=6, max_labels_count=500, max_lines_count=500)
type_ma1 = input(title="MA1 type", defval="SMA", options= )
length_ma1 = input(10, title = " MA1 length", type=input.integer)
type_ma2 = input(title="MA2 type", defval="SMA", options= )
length_ma2 = input(100, title = " MA2 length", type=input.integer)
// MA
f_ma(smoothing, src, length) =>
iff(smoothing == "RMA", rma(src, length),
iff(smoothing == "SMA", sma(src, length),
iff(smoothing == "EMA", ema(src, length), src)))
MA1 = f_ma(type_ma1, close, length_ma1)
MA2 = f_ma(type_ma2, close, length_ma2)
// buy and sell conditions
buy = crossover(MA1, MA2)
sell = crossunder(MA1, MA2)
plot(MA1, color=color_ma1, title="Plot MA1", linewidth=3)
plot(MA2, color=color_ma2, title="Plot MA2", linewidth=3)
plotshape(buy, title='LONG SIGNAL', style=shape.circle, location=location.belowbar, color=color_ma1, size=size.normal)
plotshape(sell, title='SHORT SIGNAL', style=shape.circle, location=location.abovebar, color=color_ma2, size=size.normal)
/////////////////////////// SIGNAL FOR STRATEGY /////////////////////////
Signal = buy ? 1 : sell ? -1 : 0
plot(Signal, title="🔌Connector🔌", transp=100)
Basically, I identified my buy, sell conditions in the code and added this at the bottom of my indicator code
Signal = buy ? 1 : sell ? -1 : 0
plot(Signal, title="🔌Connector🔌", transp=100)
Important Notes
🔥 The Strategy Template expects the value to be exactly 1 for the bullish signal , and -1 for the bearish signal
Now you can connect your indicator to the Strategy Template using the method below or that one
Step 2: Connect the connector
1) Add your updated indicator to a TradingView chart
2) Add the Strategy Template as well to the SAME chart
3) Open the Strategy Template settings and in the Data Source field select your 🔌Connector🔌 (which comes from your indicator)
From then, you should start seeing the signals and plenty of other stuff on your chart
🔥 Note that whenever you'll update your indicator values, the strategy statistics and visual on your chart will update in real-time
Settings
- Color Candles : Color the candles based on the trade state (bullish, bearish, neutral)
- Close positions at market at the end of each session : useful for everything but cryptocurrencies
- Session time ranges : Take the signals from a starting time to an ending time
- Close Direction : Choose to close only the longs, shorts, or both
- Date Filter : Take the signals from a starting date to an ending date
- Set the maximum losing streak length with an input
- Set the maximum winning streak length with an input
- Set the maximum consecutive days with a loss
- Set the maximum drawdown (in % of strategy equity)
- Set the maximum intraday loss in percentage
- Limit the number of trades per day
- Limit the number of trades per week
- Stop-loss: None or Percentage or Trailing Stop Percentage or ATR
- Take-Profit: None or Percentage or ATR
- Risk-Reward based on ATR multiple for the Stop-Loss and Take-Profit
This script is open-source so feel free to use it, and optimize it as you want
Alerts
Maybe you didn't know it but alerts are available on strategy scripts.
I added them in this template - that's cool because:
- if you don't know how to code, now you can connect your indicator and get alerts
- you have now a cool template showing you how to create alerts for strategy scripts
Source: www.tradingview.com
I hope you'll like it, use it, optimize it and most importantly....make some optimizations to your indicators thanks to this Strategy template
Special Thanks
Special thanks to @JosKodify as I borrowed a few risk management snippets from his website: kodify.net
Additional features
I thought of plenty of extra filters that I'll add later on this week on this strategy template
Best
Dave

[fareid] Quick Backtest Framework█ OVERVIEW
This Framework allows Pine Coders to quickly code Study() based signal/strategy and validate its viability before proceed to code with more advance/complex customized rules for entry, exit, trailstop, risk management etc..
This is somewhat an upgraded version of my earlier personal template with different strategy used, cleaner code
and additional features.
█ USE CASES
- You have an idea for trade signal and need a quick way to verify its potential before writing lengthy/complicated code
- You found a study script for trading signal in public library and want to validate it profitability with minimum effort before including it in your trading playbook
█ FEATURES
- Alert: Ready to use alert function based on signals from your custom indicator.
- Visual Backtest: Auto-plot entry, stop-loss and take profit for simple strategy performance analysis
- Backtest Statistic: Provide basic key metrics based on backtest strategy
- BTE External Signal Protocol: Ready to use code that will supply required state to PineCoders Backtesting & Trading Engine if you wish to have more advance and sophisticated backtesting engine
Notes: All of the above features have On/Off toggle
█ Description & How To Use
This Framework consist of 5 Modules but you only need to edit the first 2 Modules:
Module1: Indicator
Module2: Framework Input Protocol
Module3: Alert
Module4: Backtest
Module5: Backtest & Trading Engine
Tips: The source-code includes collapsible block by module for easy navigating
Module1: Indicator:
-----------------------------------------------------------------------------------
Main Module. Place custom indicator input parameter/calculation/indicator plotting here
Sample Strategy: Double MACD Crossover
MACD Signal: 1st MACD Cross above signal line indicate Buy Signal
1st MACD Cross below signal line indicate Sell Signal
MACD Filter: 2nd MACD is above 0 line indicate Uptrend
2nd MACD is below 0 line indicate Downtrend
Module2: Framework Input Protocol:
-----------------------------------------------------------------------------------
Use this module to connect main indicator/signal calculated in Module1 to the rest of the framework's module
4 variables needed to be defined here:
1. Uptrend
2. Dntrend
3. BuySignal
4. SellSignal
i'm not sure how to place a code snippet here to show you example so in the source code i already put a comment in Module2 on which part u need to edit. I hope its pretty simple to use.
Module3: Alert Module Description:
-----------------------------------------------------------------------------------
As long as the variables in Module2 properly defined, the alert module is ready to use without any further modification.
Input:
Enable Alert --> Enable TV's alert and plot signal to chart
Alert Type --> Set to take Buy only, Sell only or Both alert
Module4: Backtest Module Description:
-----------------------------------------------------------------------------------
As long as the variables in Module2 properly defined, the backtest module is ready to use without any further modification.
Input:
Backtest Stat --> Enable Backtest Statistic Label
Backtest Visual --> Enable Backtest visual simulation
Backtest Type --> Set to take Buy only or Sell only or both
SL Type -->
ATR : Set SL in ATR times Multiplier below entry price
Fixed : Set SL in fixed point below entry point (in 'Dollar'). e.g. for Stocks -> 0.5 equals to 50cent while for EURUSD currency -> 0.005 equal to 50 pips
HiLo Bar: Set SL at highest/lowest wick of previous bar plus/minus Fixed point. e.g. EURUSD HiLo=3 and Fixed Point = 0.0005, buy trade will place SL 5 Pips below lowest of previous 3 bar
SL ATR Multi --> Set Lookback Period used for SL's ATR calculation
SL ATR Multi --> Set ATR Multiplier for SL
SL Fixed --> Set Fixed Level for SL
SL Bar --> Set Number of previous bar to check for SL placement
TP RR Ratio --> Set TP based on RR multiplier. e.g. 2 means TP level will be twice further from entry point compared to Entry-SL distance.
Notes: The point is for preliminary testing, so it only supports 1 trade at a time and no Trailing Stop
Module5: Backtest & Trading Engine Description:
-----------------------------------------------------------------------------------
As long as the variables in Module2 properly defined, the Pinecoders BTE module is ready to use without any further modification.
Input:
External Signal Protocol --> Set ESP State to send to "Backtesting & Trading Engine "
Signal With Filter --> Use this to send entry signal that already filtered by this study indicator (without stoploss level)
Signal Without Filter --> Use this to send raw entry signal that are NOT YET FILTERED by this study indicator (without stoploss level)
Signal and Stop With Filter --> Use this to send entry signal WITH StopLoss that already filtered by this study indicator (with stoploss level)
Signal and Stop Without Filter --> Use this to send raw entry signal WITH StopLoss that are NOT YET FILTERED by this study indicator (with stoploss level)
Notes: Backtesting & Trading Engine already have built-in Filter, Entries and Stop Level. e.g. Unselect all their filter state if only want to use custom filter and make sure send Signal with Filter (with or without SL level)
█ DISCLAIMER:
This framework main objective is to create my personal indicator template so that i just have to modify the indicator module for preliminary testing in future.
The sample strategy included are for educational purpose only. Use at your own risk
credit: LucF/PineCoders for a lot of his scripts that i use as a guide to complete this

Pyramiding Entries On Early Trends (by Coinrule)Pyramiding the entries in a trading strategy may be risky but at the same time very profitable with a proper risk management approach. This strategy seeks to spot early signs of uptrends and increase the position's size while the right conditions persist.
Each trade comes with its stop-loss and take-profit to enforce a proportional risk/reward profile.
The strategy uses a mix of Moving Average based setups to define the buy-signal.
The Moving Average (200) is above the Moving Average (100), which prevents from buying when the uptrend is already in its late stages
The Moving Average (9) is above the Moving Average (100), indicating that the coin is not in a downtrend.
The price crossing above the Moving Average (9) confirms the potential upside used to fire the buy order.
Each entry comes with a stop-loss and a take-profit in a ratio of 1-to-1. After over 400 backtests, we opted for a 3% TP and 3% SL, which provides the best results.
The strategy is optimized on a 1-hour time frame.
The Advantages of this strategy are:
It offers the possibility of adjusting the size of the position proportionally to the confidence in the possibilities that an uptrend will eventually form.
Low drawdowns. On average, the percentage of trades in profit is above 60%, and the stop-loss equal to the take-profit reduces the overall risk.
This strategy returned good returns both with trading pairs with Fiat/stable coins and with BTC. Considering the mixed trends that cryptocurrencies experienced during 2020 vs BTC, this strengthens the strategy's reliability.
The strategy assumes each order to trade 20% of the available capital and pyramids the entries up to 7 times.
A trading fee of 0.1% is taken into account. The fee is aligned to the base fee applied on Binance, which is the largest cryptocurrency exchange.

888 BOT #alerts█ 888 BOT #alerts (open source)
This is an Expert Advisor 'EA' or Automated trading script for ‘longs’ and ‘shorts’, which uses only a Take Profit or, in the worst case, a Stop Loss to close the trade.
It's a much improved version of the previous ‘Repanocha’. It doesn`t use 'Trailing Stop' or 'security ()' functions (although using a security function doesn`t mean that the script repaints) and all signals are confirmed, therefore the script doesn`t repaint in alert mode and is accurate in backtest mode.
Apart from the previous indicators, some more and other functions have been added for Stop-Loss, re-entry and leverage.
It uses 8 indicators, (many of you already know what they are, but in case there is someone new), these are the following:
1. Jurik Moving Average
It's a moving average created by Mark Jurik for professionals which eliminates the 'lag' or delay of the signal. It's better than other moving averages like EMA , DEMA , AMA or T3.
There are two ways to decrease noise using JMA . Increasing the 'LENGTH' parameter will cause JMA to move more slowly and therefore reduce noise at the expense of adding 'lag'
The 'JMA LENGTH', 'PHASE' and 'POWER' parameters offer a way to select the optimal balance between 'lag' and over boost.
Green: Bullish , Red: Bearish .
2. Range filter
Created by Donovan Wall, its function is to filter or eliminate noise and to better determine the price trend in the short term.
First, a uniform average price range 'SAMPLING PERIOD' is calculated for the filter base and multiplied by a specific quantity 'RANGE MULTIPLIER'.
The filter is then calculated by adjusting price movements that do not exceed the specified range.
Finally, the target ranges are plotted to show the prices that will trigger the filter movement.
Green: Bullish , Red: Bearish .
3. Average Directional Index ( ADX Classic) and ( ADX Masanakamura)
It's an indicator designed by Welles Wilder to measure the strength and direction of the market trend. The price movement is strong when the ADX has a positive slope and is above a certain minimum level 'ADX THRESHOLD' and for a given period 'ADX LENGTH'.
The green color of the bars indicates that the trend is bullish and that the ADX is above the level established by the threshold.
The red color of the bars indicates that the trend is down and that the ADX is above the threshold level.
The orange color of the bars indicates that the price is not strong and will surely lateralize.
You can choose between the classic option and the one created by a certain 'Masanakamura'. The main difference between the two is that in the first it uses RMA () and in the second SMA () in its calculation.
4. Parabolic SAR
This indicator, also created by Welles Wilder, places points that help define a trend. The Parabolic SAR can follow the price above or below, the peculiarity that it offers is that when the price touches the indicator, it jumps to the other side of the price (if the Parabolic SAR was below the price it jumps up and vice versa) to a distance predetermined by the indicator. At this time the indicator continues to follow the price, reducing the distance with each candle until it is finally touched again by the price and the process starts again. This procedure explains the name of the indicator: the Parabolic SAR follows the price generating a characteristic parabolic shape, when the price touches it, stops and turns ( SAR is the acronym for 'stop and reverse'), giving rise to a new cycle. When the points are below the price, the trend is up, while the points above the price indicate a downward trend.
5. RSI with Volume
This indicator was created by LazyBear from the popular RSI .
The RSI is an oscillator-type indicator used in technical analysis and also created by Welles Wilder that shows the strength of the price by comparing individual movements up or down in successive closing prices.
LazyBear added a volume parameter that makes it more accurate to the market movement.
A good way to use RSI is by considering the 50 'RSI CENTER LINE' centerline. When the oscillator is above, the trend is bullish and when it is below, the trend is bearish .
6. Moving Average Convergence Divergence ( MACD ) and ( MAC-Z )
It was created by Gerald Appel. Subsequently, the histogram was added to anticipate the crossing of MA. Broadly speaking, we can say that the MACD is an oscillator consisting of two moving averages that rotate around the zero line. The MACD line is the difference between a short moving average 'MACD FAST MA LENGTH' and a long moving average 'MACD SLOW MA LENGTH'. It's an indicator that allows us to have a reference on the trend of the asset on which it is operating, thus generating market entry and exit signals.
We can talk about a bull market when the MACD histogram is above the zero line, along with the signal line, while we are talking about a bear market when the MACD histogram is below the zero line.
There is the option of using the MAC-Z indicator created by LazyBear, which according to its author is more effective, by using the parameter VWAP ( volume weighted average price ) 'Z-VWAP LENGTH' together with a standard deviation 'STDEV LENGTH' in its calculation.
7. Volume Condition
Volume indicates the number of participants in this war between bulls and bears, the more volume the more likely the price will move in favor of the trend. A low trading volume indicates a lower number of participants and interest in the instrument in question. Low volumes may reveal weakness behind a price movement.
With this condition, those signals whose volume is less than the volume SMA for a period 'SMA VOLUME LENGTH' multiplied by a factor 'VOLUME FACTOR' are filtered. In addition, it determines the leverage used, the more volume , the more participants, the more probability that the price will move in our favor, that is, we can use more leverage. The leverage in this script is determined by how many times the volume is above the SMA line.
The maximum leverage is 8.
8. Bollinger Bands
This indicator was created by John Bollinger and consists of three bands that are drawn superimposed on the price evolution graph.
The central band is a moving average, normally a simple moving average calculated with 20 periods is used. ('BB LENGTH' Number of periods of the moving average)
The upper band is calculated by adding the value of the simple moving average X times the standard deviation of the moving average. ('BB MULTIPLIER' Number of times the standard deviation of the moving average)
The lower band is calculated by subtracting the simple moving average X times the standard deviation of the moving average.
the band between the upper and lower bands contains, statistically, almost 90% of the possible price variations, which means that any movement of the price outside the bands has special relevance.
In practical terms, Bollinger bands behave as if they were an elastic band so that, if the price touches them, it has a high probability of bouncing.
Sometimes, after the entry order is filled, the price is returned to the opposite side. If price touch the Bollinger band in the same previous conditions, another order is filled in the same direction of the position to improve the average entry price, (% MINIMUM BETTER PRICE ': Minimum price for the re-entry to be executed and that is better than the price of the previous position in a given %) in this way we give the trade a chance that the Take Profit is executed before. The downside is that the position is doubled in size. 'ACTIVATE DIVIDE TP': Divide the size of the TP in half. More probability of the trade closing but less profit.
█ STOP LOSS and RISK MANAGEMENT.
A good risk management is what can make your equity go up or be liquidated.
The % risk is the percentage of our capital that we are willing to lose by operation. This is recommended to be between 1-5%.
% Risk: (% Stop Loss x % Equity per trade x Leverage) / 100
First the strategy is calculated with Stop Loss, then the risk per operation is determined and from there, the amount per operation is calculated and not vice versa.
In this script you can use a normal Stop Loss or one according to the ATR. Also activate the option to trigger it earlier if the risk percentage is reached. '% RISK ALLOWED' wich is calculated according with: '%EQUITY ON EACH ENTRY'. Only works with Stop Loss on 'NORMAL' or 'BOTH' mode.
'STOP LOSS CONFIRMED': The Stop Loss is only activated if the closing of the previous bar is in the loss limit condition. It's useful to prevent the SL from triggering when they do a ‘pump’ to sweep Stops and then return the price to the previous state.
█ ALERTS
There is an alert for each leverage, therefore a maximum of 8 alerts can be set for 'long' and 8 for 'short', plus an alert to close the trade with Take Profit or Stop Loss in market mode. You can also place Take Profit limit and Stop Loss limit orders a few seconds after filling the position entry order.
- 'MAXIMUM LEVERAGE': It is the maximum allowed multiplier of the % quantity entered on each entry for 1X according to the volume condition.
- 'ADVANCE ALERTS': There is always a time delay from when the alert is triggered until it reaches the exchange and can be between 1-15 seconds. With this parameter, you can advance the alert by the necessary seconds to activate it earlier. In this way it can be synchronized with the exchange so that the execution time of the entry order to the position coincides with the opening of the bar.
The settings are for Bitcoin at Binance Futures (BTC: USDTPERP) in 15 minutes.
For other pairs and other timeframes, the settings have to be adjusted again. And within a month, the settings will be different because we all know the market and the trend are changing.

Ampleforth Rebase MACDThis script reveals Ampleforth rebase levels which are going to always work. In addition to that is MACD crossovers serving as potential buy/sell entries. You can set alerts for MACD crossovers and price entering balanced value area (0.96 - 1.06).
MACD signals can be used to automatically open a position and entering a balanced value area can be used as take-profit. Since the price will always move to this level, using this strategy without leverage should be profitable.
Ampleforth seems like a nice asset to trade since it is unlikely to correlate with anything else. At least not when it gets to the extreme levels.
MACD+ Strategy [SystemAlpha]This is a strategy based on MACD Oscillator . Instead of using just the normal crossovers, we use trend filters, trailing stop loss and take profit targets. This strategy was developed for crypto, forex and stocks on daily timeframe but feel free to experiment on 15 minutes or higher using heikin ashi or normal candles
In this strategy you have a choice of:
Trend Filters:
- Average Directional Index ( ADX ) – buy when price is trend is up and sell when trend is down.
- Moving Average (MA) – buy when price close above the defined moving average and sell when price close below moving average
- Parabolic SAR – buy when SAR is above price is above price and sell when SAR is below price.
- All - Use ADX , MA and SAR as filters
For MA Filter , you can use the “TF MA Type” and "TF MA Period" parameter to select Simple or Exponential Moving Average and length.
Stop Loss:
- Average True Range (ATR) – ATR % stop as trailing stop loss.
- Parabolic SAR ( SAR ) – Parabolic SAR adapted as trailing stop loss.
For ATR , you can use the “ATR Trailing Stop Multiplier” parameter to set an initial offset for trailing stop loss.
Take Profit Target:
- Average True Range (ATR) – ATR % stop as trailing stop loss.
- Standard % – Percent as target profit
For ATR , you can use the “ATR Take Profit Multiplier” parameter to set an initial offset for trailing stop loss.
Additional feature include:
- Regular and Hidden Divergence display and alerts
STRATEGY ONLY:
- Set back test date range
- Set trade direction - Long, Short or Both
- Use timed exit - Select method and bars
- Method 1: Exit after specified number of bars.
- Method 2: Exit after specified number of bars, ONLY if position is currently profitable.
- Method 3: Exit after specified number of bars, ONLY if position is currently losing.
TradingView Links:
Alerts:
MACD:
How to use:
1. Apply the script by browsing through Indicators --> Invite-Only scripts and select the indicator
2. Once loaded, click the gear (settings) button to select/adjust the parameters based on your preference.
3. Wait for the next BUY or SELL signal to enter the trade!
Disclaimer:
The indicator and signals generated do not constitute investment advice; are provided solely for informational purposes and therefore is not an offer to buy or sell a security; are not warranted to be correct, complete or accurate; and are subject to change without notice.
