G Position Size Calculator (Crypto)G Position Size Calculator (Crypto)
This tool helps traders quickly visualize and calculate risk, position size, leverage, and R:R ratio directly on the chart for crypto trading.
It works similarly to TradingView’s Long/Short Position tool but automatically computes all metrics based on your clicks.
⚙️ How to Use
Add to Chart
Click Indicators → My Scripts → G Position Size Calculator (Crypto)
Set Entry, Stop-Loss, and Take-Profit
Open the script’s ⚙️ Settings.
Click the crosshair icon next to Entry, then click on the chart.
Do the same for Stop-Loss and Take-Profit.
Adjust Account & Risk Settings
Enter your Account Size (USD).
Set your Risk % per trade (default: 1%).
Visual Feedback
A green box shows your profit zone (Entry → TP).
A red box shows your loss zone (Entry → SL).
The label on the right displays:
Risk (% and $)
R:R ratio
Position size (units)
Leverage required
Fine-Tune Without Re-clicking
Use the nudge inputs (Entry, Stop, TP) to move levels up/down by 1 tick at a time.
Positive = up, negative = down.
Re-pick Levels Anytime
Re-open settings and click the crosshair again to redefine a level.
📈 Features
Automatic calculation of risk, position size, leverage, and R:R ratio.
Visual green/red box representing profit and loss areas.
Adjustable risk %, account balance, and label offset.
“Nudge” controls to emulate quick drag adjustments.
Clean layout designed for crypto price charts (works on any symbol).
חפש סקריפטים עבור "take profit"

TradeVision Pro - Multi-Factor Analysis System═══════════════════════════════════════════════════════════════════
TRADEVISION PRO - MULTI-FACTOR ANALYSIS SYSTEM
Created by Zakaria Safri
═══════════════════════════════════════════════════════════════════
A comprehensive technical analysis tool combining multiple factors for
signal generation, trend analysis, and dynamic risk management visualization.
Designed for educational purposes to study multi-factor convergence trading
strategies across all markets and timeframes.
⚠️ IMPORTANT DISCLAIMER:
This indicator is provided for EDUCATIONAL and INFORMATIONAL purposes only.
It does NOT constitute financial advice, investment advice, or trading advice.
Past performance does not guarantee future results. Trading involves
substantial risk of loss. Always do your own research and consult a
financial advisor before making trading decisions.
🎯 KEY FEATURES
═══════════════════════════════════════════════════════════════════
✅ MULTI-FACTOR SIGNAL GENERATION
• Price Volume Trend (PVT) analysis
• Rate of Change (ROC) momentum confirmation
• Volume-Weighted Moving Average (VWMA) trend filter
• Simple Moving Average (SMA) price smoothing
• Signals only when all factors align
✅ DYNAMIC RISK VISUALIZATION (Educational Only)
• ATR-based stop loss calculation
• Risk-reward based take profit levels (1-5 targets)
• Visual lines and labels showing entry, SL, and TPs
• Automatically adapts to market volatility
• ⚠️ VISUAL REFERENCE ONLY - Does not execute trades
✅ SUPPORT & RESISTANCE DETECTION
• Automatic pivot-based level identification
• Red dashed lines for resistance zones
• Green dashed lines for support areas
• Helps identify key price levels
✅ VWMA TREND BANDS
• Volume-weighted moving average with standard deviation
• Color-changing bands (Green = Uptrend, Red = Downtrend)
• Filled band area for easy visualization
• Volume-confirmed trend strength
✅ TREND DETECTION SYSTEM
• Counting-based trend confirmation
• Three states: Up Trend, Down Trend, Ranging
• Requires threshold of consecutive bars
• Independent trend validation
✅ PRICE RANGE VISUALIZATION
• High/Low range lines showing market structure
• Filled area highlighting price volatility
• Helps identify breakout zones
✅ COMPREHENSIVE INFO TABLE
• Real-time trend status
• Last signal type (BUY/SELL)
• Entry price display
• Stop loss level
• All active take profit levels
• Clean, professional layout
✅ OPTIONAL FEATURES
• Bar coloring by trend direction
• Customizable alert notifications
• Toggle visibility for all components
• Fully configurable parameters
📊 HOW IT WORKS
═══════════════════════════════════════════════════════════════════
SIGNAL METHODOLOGY:
BUY SIGNAL generates when ALL conditions are met:
• Smoothed price > Moving Average (upward price trend)
• PVT > PVT Average (volume supporting uptrend)
• ROC > 0 (positive momentum)
• Close > VWMA (above volume-weighted average)
SELL SIGNAL generates when ALL conditions are met:
• Smoothed price < Moving Average (downward price trend)
• PVT < PVT Average (volume supporting downtrend)
• ROC < 0 (negative momentum)
• Close < VWMA (below volume-weighted average)
This multi-factor approach filters out weak signals and waits for
strong convergence before generating alerts.
RISK CALCULATION:
Stop Loss = Entry ± (ATR × SL Multiplier)
• Uses Average True Range for volatility measurement
• Automatically adjusts to market conditions
Take Profit Levels = Entry ± (Risk Distance × TP Multiplier × Level)
• Risk Distance = |Entry - Stop Loss|
• Creates risk-reward based targets
• Example: TP Multiplier 1.0 = 1:1, 2:2, 3:3 risk-reward
⚠️ NOTE: All risk levels are VISUAL REFERENCES for educational study.
They do not execute trades automatically.
⚙️ SETTINGS GUIDE
═══════════════════════════════════════════════════════════════════
SIGNAL SETTINGS:
• Signal Length (14): Main calculation period for averages
• Smooth Length (8): Price data smoothing period
• PVT Length (14): Price Volume Trend calculation period
• ROC Length (9): Rate of Change momentum period
RISK MANAGEMENT (Visual Only):
• ATR Length (14): Volatility measurement lookback
• SL Multiplier (2.2): Stop loss distance (× ATR)
• TP Multiplier (1.0): Risk-reward ratio per TP level
• TP Levels (1-5): Number of take profit targets to display
• Show TP/SL Lines: Toggle visual reference lines
SUPPORT & RESISTANCE:
• Pivot Lookback (10): Sensitivity for S/R detection
• Show SR: Toggle support/resistance lines
VWMA BANDS:
• VWMA Length (20): Volume-weighted average period
• Show Bands: Toggle band visibility
TREND DETECTION:
• Trend Threshold (5): Consecutive bars required for trend
PRICE LINES:
• Period (20): High/low calculation lookback
• Show: Toggle price range visualization
DISPLAY OPTIONS:
• Signals: Show/hide BUY/SELL labels
• Table: Show/hide information panel
• Color Bars: Enable trend-based bar coloring
ALERTS:
• Enable: Activate alert notifications for signals
💡 USAGE INSTRUCTIONS
═══════════════════════════════════════════════════════════════════
RECOMMENDED APPROACH:
• Works on all timeframes (1m to Monthly)
• Suitable for all markets (Stocks, Forex, Crypto, etc.)
• Best used with additional analysis and confirmation
• Always practice proper risk management
ENTRY STRATEGY:
1. Wait for BUY or SELL signal to appear
2. Check trend table for trend confirmation
3. Verify VWMA band color matches signal direction
4. Look for nearby support/resistance confluence
5. Consider entering on next candle open
6. Use visual SL level for risk management
EXIT STRATEGY:
1. Use TP levels as potential exit zones
2. Consider scaling out at multiple TP levels
3. Exit on opposite signal
4. Adjust stops as trade progresses
5. Account for spread and slippage
TREND TRADING:
• "Up Trend" → Focus on BUY signals
• "Down Trend" → Focus on SELL signals
• "Ranging" → Wait for clear trend or use range strategies
🎨 VISUAL ELEMENTS
═══════════════════════════════════════════════════════════════════
• GREEN VWMA BANDS → Bullish trend indication
• RED VWMA BANDS → Bearish trend indication
• ORANGE DASHED LINE → Entry price reference
• RED SOLID LINE → Stop loss level
• GREEN DOTTED LINES → Take profit targets
• RED DASHED LINES → Resistance levels
• GREEN DASHED LINES → Support levels
• GREY FILLED AREA → Price high/low range
• GREEN BUY LABEL → Long signal
• RED SELL LABEL → Short signal
• BLUE INFO TABLE → Current trade details
• GREEN/RED BARS → Trend direction (optional)
⚠️ IMPORTANT NOTES
═══════════════════════════════════════════════════════════════════
RISK WARNING:
• Trading involves substantial risk of loss
• You can lose more than your initial investment
• Past performance does not guarantee future results
• No indicator is 100% accurate
• Always use proper position sizing
• Never risk more than you can afford to lose
EDUCATIONAL PURPOSE:
• This tool is for learning and research
• Not a complete trading system
• Should be combined with other analysis
• Requires interpretation and context
• Test thoroughly before live use
• Consider consulting a financial advisor
TECHNICAL LIMITATIONS:
• Signals lag price action (all indicators lag)
• False signals occur in choppy markets
• Works better in trending conditions
• Support/resistance levels are approximate
• TP/SL levels are suggestions, not guarantees
📚 METHODOLOGY
═══════════════════════════════════════════════════════════════════
This indicator combines established technical analysis concepts:
• Price Volume Trend (PVT): Volume-weighted price momentum
• Rate of Change (ROC): Momentum measurement
• Volume-Weighted Moving Average (VWMA): Trend identification
• Average True Range (ATR): Volatility measurement (J. Welles Wilder)
• Pivot Points: Support/resistance detection
All methods are based on publicly available technical analysis
principles. No proprietary or "secret" algorithms are used.
⚖️ FULL DISCLAIMER
═══════════════════════════════════════════════════════════════════
LIABILITY:
The creator (Zakaria Safri) assumes NO liability for:
• Trading losses or damages of any kind
• Loss of capital or profits
• Incorrect signal interpretation
• Technical issues, bugs, or errors
• Any consequences of using this tool
USER RESPONSIBILITY:
By using this indicator, you acknowledge that:
• You are solely responsible for your trading decisions
• You understand the substantial risks involved
• You will not hold the creator liable for losses
• You will conduct your own research and analysis
• You may consult a licensed financial professional
• You are using this tool entirely at your own risk
AS-IS PROVISION:
This indicator is provided "AS IS" without warranty of any kind,
express or implied, including but not limited to warranties of
merchantability, fitness for a particular purpose, or non-infringement.
The creator is not a registered investment advisor, financial planner,
or broker-dealer. This tool is not approved or endorsed by any
financial authority.
📞 ABOUT THE CREATOR
═══════════════════════════════════════════════════════════════════
Created by: Zakaria Safri
Specialization: Technical analysis indicator development
Focus: Multi-factor analysis, risk visualization, trend detection
This is an educational tool designed to demonstrate technical
analysis concepts and multi-factor signal generation methods.
📋 VERSION INFO
═══════════════════════════════════════════════════════════════════
Version: 1.0
Platform: TradingView Pine Script v5
License: Mozilla Public License 2.0
Creator: Zakaria Safri
Year: 2024
═══════════════════════════════════════════════════════════════════
Study Carefully, Trade Wisely, Manage Risk Properly
TradeVision Pro - Educational Trading Tool
Created by Zakaria Safri
═══════════════════════════════════════════════════════════════════

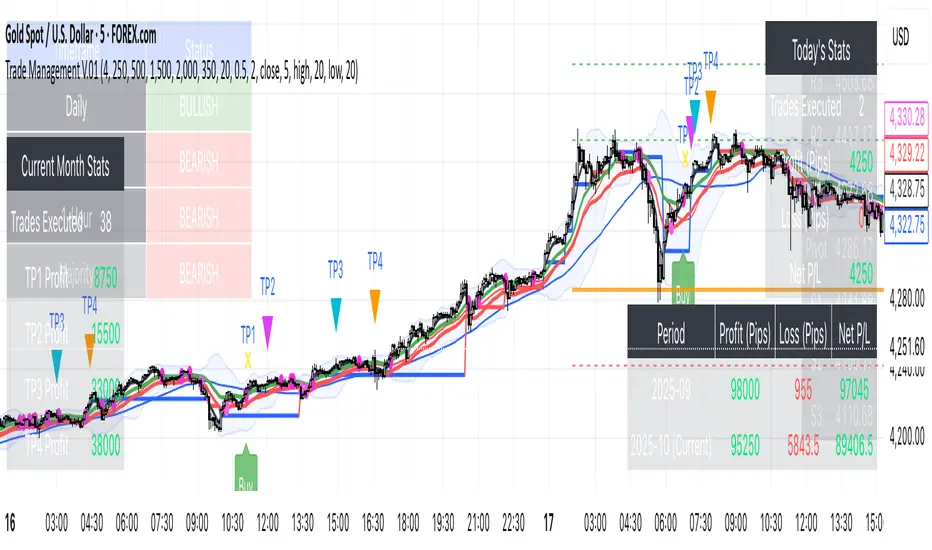
Trade Management V.01The Trend-Confluence Trade Manager
Description:
Overview
For Best Result - USE 5 minute time frame.
Tired of cluttering your charts with dozens of separate indicators? The Trend-Confluence Trade Manager is a comprehensive, all-in-one suite designed to bring clarity, structure, and a professional edge to your trading.
This powerful tool seamlessly integrates a multi-timeframe trend analysis engine with a complete trade and performance management system, displaying everything you need in a clean, intuitive interface directly on your chart. It's built to help you stay on the right side of the market, make informed decisions, and manage your trades from entry to exit with precision.
Key Features
Dynamic Multi-Timeframe Trend Dashboard: At a single glance, instantly understand the market sentiment across the Daily, 4-Hour, and 1-Hour timeframes. The indicator calculates a powerful "Majority Trend" to serve as your primary guide, helping you avoid low-probability counter-trend trades.
Intelligently Filtered Trade Signals: Receive clear, non-repainting "Buy" and "Sell" signals directly on your chart. These signals are generated by our core momentum engine and are then intelligently filtered by the higher-timeframe trend analysis.
Adaptive Buy Logic: Long signals are designed to be more responsive to emerging momentum, capturing opportunities as the 1-Hour trend aligns.
Conservative Sell Logic: Short signals require stricter confirmation from the overall Majority Trend, providing an extra layer of confidence in bearish markets.
Complete On-Chart Trade Management: Once a signal appears, the indicator provides a full suite of management tools:
Multi-Level Take Profits (up to 4 configurable targets).
Automated Break-Even Stop Trigger.
Clear labels for TP hits and stop-outs.
Filtered Stop-and-Reverse signals for dynamic market conditions.
Comprehensive Performance Dashboards: Track your progress with detailed, automated statistics panels:
Monthly P&L Table: Monitor your current and previous month's performance in pips.
Monthly Stats Table: See total trades and profit generated from each Take Profit level for the current month.
Daily Stats Table: Keep track of your real-time P&L for the current trading day.
Classic Technical Analysis Suite: To provide essential market context, the indicator also includes:
Daily Pivots: Automatically calculated and plotted R1-S3 levels with a convenient on-screen table.
Moving Averages & Bollinger Bands: A classic overlay to help identify dynamic support, resistance, and volatility.
Proprietary Momentum Gap Detector: A unique visual tool that identifies significant three-bar price voids, highlighting key areas that may act as future magnets for price.
How to Use
Check the Trend: Start by consulting the Multi-Timeframe Trend Dashboard in the top-left corner. Is the "Majority" trend Bullish or Bearish?
Wait for a Signal: Look for a filtered "Buy" signal when the trend is bullish, or a "Sell" signal when the trend is bearish.
Find Confluence: Use the integrated tools like Daily Pivots, MAs, and Momentum Gaps to add further confirmation to your trade idea.
Manage the Trade: Follow your trading plan using the automated Take Profit levels and Break-Even logic provided.
Customization
This tool is highly customizable to fit your personal trading style. In the settings, you can adjust:
Lot Size, Take Profit & Break-Even Levels.
All parameters for the EMAs and other indicators.
Full color customization for all tables, allowing you to match any chart theme.
Disclaimer: This tool is designed to be an aid for discretionary traders and should not be considered a standalone "get rich quick" system. All trading involves risk. Always use proper risk management and backtest any strategy thoroughly before trading with real capital.
Reversal Entries [akshaykiriti1443]Reversal Entries : An In-Depth Guide
This indicator is designed to identify high-probability trend reversal points. Its primary goal is to pinpoint moments where the price attempts to break a key level, fails, and then snaps back with force. These "fakeouts" or "liquidity grabs" are often powerful signals that the market is about to reverse course.
The indicator provides two clear signals:
* 🟢 **A Bullish "Bounce Point"**: A potential buy signal after price dips below support and recovers.
* 🔴 **A Bearish "Rejection Point"**: A potential sell signal after price spikes above resistance and is pushed back down.
---
## The Core Logic: What Makes a Signal?
The indicator doesn't just look at one factor. Instead, it requires **three key conditions** to be met simultaneously before it generates a signal. This multi-layered approach helps filter out noise and identify only the most promising setups.
### 1. The Price Action "Fakeout" 🕵️♂️
This is the foundation of the signal. The indicator first identifies a short-term support or resistance level.
* **Support:** The lowest price over the `Lookback` period.
* **Resistance:** The highest price over the `Lookback` period.
It then waits for a specific pattern:
* For a **Bullish Bounce**, the current candle's low must dip **below** the support level, but its closing price must be **above** that same support level. This shows that sellers tried to push the price down but buyers stepped in with overwhelming force.
* For a **Bearish Rejection**, the current candle's high must poke **above** the resistance level, but its closing price must be **below** that same resistance level. This shows that buyers tried to break out, but sellers took control and slammed the price back down.
### 2. Volume Confirmation 🔊
A true reversal is almost always accompanied by a surge in trading activity. The indicator confirms the price action by checking for a **volume spike**.
It calculates the recent average volume and only accepts the signal if the volume on the reversal candle is significantly higher than that average (the default is 1.5 times higher). This confirms that there is real conviction and money behind the move, making it much more reliable.
### 3. Recovery Strength & Probability Score 💯
This is the indicator's "secret sauce." It doesn't just see a reversal; it measures *how strong* that reversal is.
* **Measuring the Recovery:** It uses the Average True Range (ATR) to measure the size of the price's recovery. For a bullish bounce, it measures the distance from the candle's low to its close. For a bearish rejection, it measures the distance from the high to the close. A long wick in the direction of the reversal signifies a powerful rejection of lower or higher prices.
* **Calculating a Probability Score:** The indicator takes the volume spike confirmation and the recovery strength and feeds them into a mathematical formula (a sigmoid function) to generate a "probability score" between 0 and 1. Think of this as a confidence score.
* **Applying the Threshold:** A signal is only plotted on your chart if this confidence score is above the `Probability Threshold` (default is 0.7, or 70%). This is the final filter that ensures only high-conviction setups are shown.
---
## How to Use the Indicator in Your Trading
This indicator provides entry signals, but it should be used as part of a complete trading plan.
### Understanding the Signals
* **Green `+` (Bounce Point):** When you see this signal below a candle, it's a potential **BUY entry**. It suggests that the downward momentum has been rejected and the price may be ready to move higher.
* **Red `-` (Rejection Point):** When you see this signal above a candle, it's a potential **SELL entry**. It suggests that the upward momentum has failed and the price may be ready to fall.
### Example Trading Strategy
1. **Entry:** Enter a trade when a signal appears. For a green `+`, place a buy order. For a red `-`, place a sell order.
2. **Stop Loss:** A logical stop loss is crucial.
* For a **buy trade**, place your stop loss just below the low of the signal candle. If the price breaks this low, the reversal idea is invalidated.
* For a **sell trade**, place your stop loss just above the high of the signal candle. If the price breaks this high, the setup has failed.
3. **Take Profit:** Your take profit should be based on your own strategy. A common approach is to target the next significant support or resistance level or use a fixed risk-to-reward ratio (e.g., 1:1.5 or 1:2).
**Important:** Always consider the overall market context. These signals tend to be more powerful when they align with the broader trend or occur at major, higher-timeframe support and resistance zones.
---
## Customizing the Settings
You can fine-tune the indicator's sensitivity in the settings menu to match your trading style and the asset you are trading.
* **`Support/Resistance Lookback`**: Controls how far back the indicator looks to find support and resistance. A **smaller number** makes it more sensitive to very recent price action. A **larger number** will focus on more significant, longer-term levels.
* **`Volume Spike Multiplier`**: Defines what counts as a "spike." Increasing this value (e.g., to 2.0) will demand a much larger volume surge, leading to fewer but potentially more reliable signals.
* **`ATR for Recovery`**: This sets the period for the ATR calculation, which is used to measure the recovery strength. It's generally best to leave this at its default unless you are an advanced user.
* **`Probability Threshold`**: This is the most important sensitivity setting.
* **Increase it** (e.g., to 0.85) for fewer, very high-quality signals.
* **Decrease it** (e.g., to 0.60) to see more potential setups, though some may be less reliable.

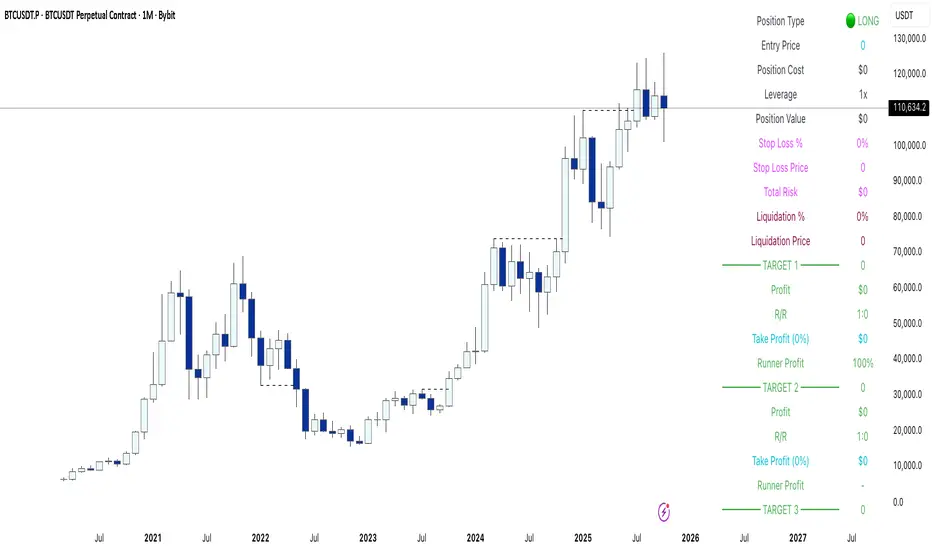
Yuki Leverage RR Calculator**YUKI LEVERAGE RR CALCULATOR**
A professional-grade risk/reward calculator for leveraged crypto or forex trades.
Instantly visualizes entry, stop loss, targets, leverage, and risk-to-reward ratios — helping you plan precise positions with confidence.
──────────────────────────────
**WHAT IT DOES**
Calculates position value, quantity, stop-loss price, liquidation estimate, and per-target profit.
Displays everything in an on-chart table with optional price tags and alerts.
──────────────────────────────
**KEY FEATURES**
• Long / Short toggle (only one active at a time)
• Leverage-aware position sizing based on Position Cost ($) and Leverage
• Dynamic Stop Loss: input % → auto price + $ risk
• Up to 3 Take-Profit Targets with scaling logic
• Instant R:R ratios per target
• Liquidation estimate (approximation only)
• ENTRY / SL / T1 / T2 / T3 / LIQ visual tags
• Dark/Light mode, adjustable table and tag size
• Built-in alerts for Targets and Stop Loss
──────────────────────────────
**INPUTS**
• Long or Short selection
• Entry Price, Stop Loss %
• Target 1 / Target 2 / Target 3 + Take Profit %
• Position Cost ($), Leverage
• Visual preferences: show/hide table, table corner, font size, tag offset, text size
──────────────────────────────
**TABLE OUTPUTS**
Position Info: Type, Entry, Position Cost, Leverage, Value
Risk Section: Stop Loss %, Stop Loss Price, Total Risk ($), Liquidation % & Price
Targets 1–3: Profit ($), R:R, Take Profit ($), Runner % or PnL
──────────────────────────────
**ALERTS**
• Target 1 Hit – when price crosses T1
• Target 2 Hit – when price crosses T2
• Target 3 Hit – when price crosses T3
• Stop Loss Hit – triggers based on direction
(Use TradingView Alerts → Condition → Indicator → select desired alert)
──────────────────────────────
**HOW TO USE**
1. Choose Long or Short
2. Enter Entry Price, Stop Loss %, Position Cost, and Leverage
3. Add Targets 1–3 with optional Take Profit %
4. Adjust visuals as desired
5. Monitor table + alerts for live trade planning
──────────────────────────────
**NOTES**
• Liquidation values are estimates only
• Fees, slippage, and funding not included
• Designed for educational and planning purposes
──────────────────────────────
⚠️ **DISCLAIMER**
For educational use only — not financial advice.
Trading leveraged products involves high risk of loss.
Always confirm calculations with your exchange and trade responsibly.
FVG Buy/Sell [Multi-TF] by akshaykiriti1443The FVG Buy/Sell indicator is a precision trading tool designed for traders who operate with a clear directional bias. It excels at identifying high-probability entry points by detecting when price interacts with Fair Value Gaps (FVGs).
This indicator is built on a core principle: instead of predicting the market's direction, it provides the timing for an entry after you, the trader, have established your market bias. By automatically pinpointing bullish and bearish imbalances on both the current and a higher timeframe, it allows you to wait for the market to pull back to a key level and then provides a clear signal for execution.
The Core Strategy: Bias First, Entry Second
This indicator is most powerful when used as part of a two-step trading process. It is not a standalone signal generator; it is an entry confirmation tool.
Step 1: Determine Your Directional Bias
Before looking for any signals from this indicator, you must first have an opinion on the market's most likely direction. This bias should be derived from your primary analysis method, such as:
The Golden Rule:
If your bias is BULLISH, you will ONLY look for BUY signals generated by bullish (green/blue) FVGs. You will ignore all SELL signals.
If your bias is BEARISH, you will ONLY look for SELL signals generated by bearish (pink/orange) FVGs. You will ignore all BUY signals.
Step 2: Execute with the FVG Tap-In Signal
Once your bias is set, the indicator does the rest of the work. You simply wait for the price to pull back into an FVG zone that aligns with your bias and then wait for the confirmation arrow to appear.
A green up arrow confirms that price has tapped a bullish FVG and closed above it, signaling that support has held and it's a valid moment to enter a long position.
A red down arrow confirms that price has tapped a bearish FVG and closed below it, signaling that resistance has held and it's a valid moment to enter a short position.
How to Take a Trade (Step-by-Step Examples)
Example of a Bullish (Long) Trade Setup:
Establish Bias: Your primary analysis shows the market is in a clear uptrend. Your bias is Bullish. You are now only looking for buying opportunities.
Identify Zone: The indicator draws a bullish FVG (a green or blue box) during an impulsive up-move.
Wait for Pullback: Be patient and let the price retrace down into this FVG zone. Do not chase the price.
Confirmation Signal: A green UP arrow appears below a candle. This is your signal. It confirms that buyers have stepped in at the FVG level and defended it.
Entry: Enter a long (buy) position at the open of the candle immediately following the signal candle.
Stop Loss: Place your stop loss below the low of the signal candle or, for a safer stop, below the bottom of the FVG zone itself.
Take Profit: Target a previous high, a higher-timeframe resistance level, or use a risk-to-reward ratio like 1:2 or 1:3.
Example of a Bearish (Short) Trade Setup:
Establish Bias: Your primary analysis shows the market is breaking down into a downtrend. Your bias is Bearish. You are now only looking for selling opportunities.
Identify Zone: The indicator draws a bearish FVG (a pink or orange box) during an impulsive down-move.
Wait for Pullback: Patiently wait for the price to rally back up into this FVG zone.
Confirmation Signal: A red DOWN arrow appears above a candle. This is your confirmation that sellers have rejected the price at this level.
Entry: Enter a short (sell) position at the open of the next candle.
Stop Loss: Place your stop loss above the high of the signal candle or above the top of the FVG zone.
Take Profit: Target a previous low, a key support level, or the next major FVG below.
Features Explained in Detail
Multi-Timeframe (MTF) Analysis: HTF zones (dotted lines) carry more weight. A signal from a 4-hour FVG while you are on a 15-minute chart is significantly more powerful than a signal from a 15-minute FVG alone. Use HTF zones as major points of interest.
Confirmed Tap-In Logic: The arrow only appears after price has touched the zone and then closed outside of it in the expected direction. This built-in confirmation filters out wicks that simply pass through a zone without a real market reaction.
Dual Alert System:
Entry Alert ("Price has entered..."): This is a heads-up alert. It tells you to pay attention because price is now in your pre-defined zone of interest.
Tap-In Alert ("Confirmed tap-in..."): This is the execution alert. It signals that the conditions for a trade have been met according to the indicator's logic.
Fade on Tapped: When enabled, a zone will become transparent after a confirmed signal. This visually cleans up your chart, showing you which zones have already been tested and "mitigated."
Minimum FVG Size (Ticks): In volatile or ranging markets, many tiny, insignificant FVGs can form. Use this setting to filter out the noise. Increase the value to only display larger, more significant imbalances.
Disclaimer: Trading involves substantial risk. This indicator is a tool for analysis and should not be used as a sole reason to enter a trade. Always practice robust risk management and use this tool in conjunction with your own trading plan. Past performance is not indicative of future results.

PulseGrid Universal Scalper - Adaptive Pulse and Symmetric SpansInstrument agnostic. Works on any symbol and timeframe supported by TradingView.
Message or hit me up in chat for full access .
Purpose and scope
PulseGrid is a short timeframe strategy designed to read intrabar structure and recent path so that entries align with actionable momentum and context. The strategy is private. The description below provides all the information needed to understand how it behaves, how it sizes risk, how to tune it responsibly, and how to evaluate results without making unrealistic claims. The design is instrument agnostic. It runs on any asset class that prints open high low close bars on TradingView. That includes commodities such as Gold and WTI, currencies, crypto, equity indices, and single stocks. Performance will always depend on the symbol’s liquidity, spread, slippage, and session structure, which is why the description focuses on principles and safe parameter ranges instead of hard promises.
What the strategy does at a glance
It builds a composite entry signal named Pulse from five normalized bar features that reflect short term pressure and follow through.
It applies regime guards that keep the strategy inactive when the tape is either too quiet, too bursty, or too directionally random.
It optionally uses a directional filter where a fast and a slow exponential average must agree and their gap must be material relative to recent true range.
When a signal is allowed, risk is sized using symmetric spans that come from nearby untraded price distances above and below the market. The strategy sets a single stop and a single take profit from those spans.
Lines for entry, stop, and take profit are drawn on the chart. A compact on chart table shows trade counts, win rate, average R per trade, and profit factor for all trades, longs only, and shorts only.
This combination yields entries that are reactive but not chaotic, and risk lines that respect the market’s recent path instead of generic pip or point targets.
Why the design is original and useful
The core originality is the union of a composite entry that adapts to volatility and a geometry based risk model. The entry uses five different viewpoints on the same bar space instead of relying on a single technical indicator. The risk model uses spans that come from actual untraded distance rather than fixed multipliers of a generic volatility measure. The result is a framework that is simple to read on a chart and simple to evaluate, yet it avoids the traps of curve fitting to one symbol or one month of data. Because everything is normalized locally, the same logic translates across asset classes with only modest tuning.
The Pulse composite in detail
Pulse is a weighted blend of the following normalized features.
Impulse imbalance. The script sums upward and downward impulses over a short window. An upward impulse is the extension of highs relative to the prior bar. A downward impulse is the extension of lows relative to the prior bar. The net imbalance, scaled by the local range, captures whether extension pressure is building or fading.
Wick and close location. Inside each bar, the distance between the close and the extremes carries information about rejection or acceptance. A bar that closes near the high with relatively heavier lower wick suggests upward acceptance. A bar that closes near the low with heavier upper wick suggests downward acceptance. A weight controls the contribution of wick skew versus close location so that users can favor reversal or momentum behaviour.
Shock touches. Within the recent range window, touches that occur very near the top decile or bottom decile are marked. A short sliding window counts recent shocks. Frequent top shocks in a rising context suggest supply tests. Frequent bottom shocks in a declining context suggest demand tests. The count is normalized by window length.
Breakout ledger. The script compares current extremes to lagged extremes and keeps a simple count of recent upside and downside breakouts. The difference behaves as a short term polarity meter.
Curvature. A simple second difference in closing price acts as a curvature term. It is normalized by the recent maximum of absolute one bar returns so that the value remains bounded and comparable to other terms.
Pulse is smoothed over a fraction of the main signal length. Smoothing removes impulse spikes without destroying the quick reaction that scalpers need. The absolute value of smoothed Pulse can be used with an adaptive gate so that only the top percentile of energy for the recent environment is eligible for entries. A small floor prevents accidental entries during very quiet periods.
Regime guards that keep the strategy selective
Three guards must all pass before any entry can occur.
Auction Balance Factor. This is the proportion of closes that land inside a mid band of the prior bar’s high to low range. High values indicate balanced chop where breakouts tend to fail. Low values indicate directional conditions. The strategy requires ABF to sit below a user chosen maximum.
Dispersion via a Gini style measure on absolute returns. Very low dispersion means bars are small and uniform. Very high dispersion means a few outsized bars dominate and slippage risk can be elevated. The strategy allows the user to require the dispersion measure to remain inside a band that reflects healthy activity.
Binary entropy of direction. Over the core window, the proportion of up closes is used to compute a simple entropy. Values near one indicate coin flip behaviour. Values near zero indicate one sided sequences. The guard requires entropy below a ceiling so that random directionality does not produce noise entries.
An optional directional filter asks that a fast and a slow exponential average agree on direction and that their gap, when divided by an average true range, exceed a threshold. This filter can be enabled on symbols that trend cleanly and disabled when the composite entry is already selective enough.
Risk sizing with symmetric spans
Instead of fixed points or a pure ATR multiplier, the strategy sizes stops and targets from a pair of spans. The upward span reflects recent untraded distance above the market. The downward span reflects recent untraded distance below the market. Each span is floored by a fallback that comes from the maximum of a short simple range average and a standard average true range. A tick based floor prevents microscopic stops on instruments with high tick precision. An asymmetry cap prevents one span from becoming many times larger than the other. For long entries the stop is a multiple of the downward span and the target is a multiple of the upward span. For short entries the stop is a multiple of the upward span and the target is a multiple of the downward span. This creates a risk box that is symmetric by construction yet adaptive to recent voids and gaps.
Execution, ties, and housekeeping
Entries evaluate at bar close. Exits are tested from the next bar forward. If both stop and target are hit within the same bar, the outcome can be resolved in a consistent way that favors the stop or the target according to a single user setting. A short cooldown in bars prevents flip flops. Users can restrict entries to specific sessions such as London and New York. The chart renders entry, stop, and target lines for each trade so that every action is visible. The table in the top right shows trade counts, take profit and stop counts, win rate, average R per trade, and profit factor for the whole set and by direction.
Defaults and responsible backtesting
The default properties in the script use a realistic initial capital and commission value. Users should also set slippage in the strategy properties to reflect their broker and symbol. Small timeframe trading is sensitive to friction and the strategy description does not claim immunity to that reality. The strategy is intended to be tested on a dataset that produces a meaningful sample of trades. A sample in the range of a hundred trades or more is preferred because variance in short samples can be large. On thin symbols or periods with little regular trading, users should either change timeframe, change sessions, or use more selective thresholds so that the sample contains only liquid scenarios.
Universal usage across markets
The strategy is universal by design. It will run and produce lines on any open high low close series on TradingView. The composite entry is made of normalized parts. The regime guards use proportions and bounded measures. The spans use untraded distance and range floors measured in the local price scale. This allows the same logic to function on a currency pair, a commodity, an index future, a stock, or a crypto pair. What changes is calibration.
A safe approach for universal use is as follows.
Start with the default signal length and wick weight.
If the chart prints many weak signals, enable the directional filter and raise the normalized gap threshold slightly.
If the chart is too quiet, lower the adaptive percentile or, with adaptive off, lower the fixed pulse threshold by a small amount.
If stops are too tight in quiet regimes, raise the fallback span multiplier or raise the minimum tick floor in ticks.
If you observe long one sided days, lower the maximum entropy slightly so that entries only occur when directionality is genuine rather than alternating.
Because the logic is bounded and local, these simple steps carry over across symbols. That is why the strategy can be used literally on any asset that you can load on a TradingView chart. The code does not depend on a specific tick size or a specific exchange calendar. It will still remain true that symbols with higher spread or fewer regular trading hours demand stricter thresholds and larger floors.
Suggested parameter ranges for common cases
These ranges are guidelines for one to five minute bars. They are not promises of performance. They reflect the balance between having enough signals to learn from and keeping noise controlled.
Signal length between 18 and 34 for liquid commodities and large capitalization equities.
Wick weight between 0.30 and 0.50 depending on whether you want reversal recognition or close momentum.
Adaptive gate percentile between 85 and 93 when adaptive is enabled. Fixed threshold between 0.10 and 0.18 when adaptive is disabled. Use a non zero floor so very quiet periods still require some energy.
Auction Balance Factor maximum near 0.70 for symbols with clear session bursts. Slightly higher if you prefer to include more balanced prints.
Dispersion band with a lower bound near 0.18 and an upper bound near 0.68 for most session instruments. Tighten the band if you want to skip very bursty days or very flat days.
Entropy maximum near 0.90 so coin flip phases are filtered. Lower the ceiling slightly if the symbol whipsaws frequently.
Stop multiplier near one and take profit multiplier between two and three for a single target approach. Larger target multipliers reduce hit rate and lengthen holding time.
These are safe starting points across commodities, currencies, indices, equities, and crypto. From there, small increments are preferred over dramatic changes.
How to evaluate responsibly
A clean chart and a direct test process help avoid confusion. Use standard candles for signals and exits. If you use a non standard chart type such as Heikin Ashi or Renko, do so only for visualization and not for the strategy’s signal computation, as those chart types can produce unrealistic fills. Turn off other indicators on the published chart unless they are needed to demonstrate a specific property of this strategy. When you post results or discuss outcomes, include the symbol, timeframe, commission and slippage settings, and the session settings used. This makes the context clear and avoids misleading readers.
When you look at results, consider the following.
The distribution of R per trade. A positive average R with a moderate profit factor suggests that exits are sized appropriately for the symbol.
The balance between long and short sides. The HUD table separates the two so you can see if one side carries the edge for that symbol.
The sensitivity to the tie preference. If many bars hit both stop and take profit, the market is chopping inside the risk box and you may need larger floors or stricter regime guards.
The session effect. Session hours matter for many instruments. Align your session filter with where liquidity and volatility concentrate.
Known limitations and honest warnings
PulseGrid is not a guarantee of future profit. It is a systematic way to read short term structure and to size risk in a way that reflects recent path. It assumes that the data feed reflects the exchange reality. It assumes that slippage and spread are non zero and uses explicit commission and user provided slippage to approximate that. It does not place multiple targets. It does not trail stops. It is not a high frequency system and does not attempt to model queue priority or microsecond fills. On illiquid symbols or very short timeframes outside regular hours, signals will be less reliable. Users are responsible for choosing realistic settings and for evaluating whether the symbol’s conditions are suitable.
First use checklist
Load the symbol and timeframe you care about.
If the instrument has clear sessions, turn on the session filter and select realistic London and New York hours or other sessions relevant to the instrument.
Set commission and slippage in the strategy properties to values that match your broker or exchange.
Run the strategy with defaults. Look at the HUD summary and the lines.
Decide whether to enable the directional filter. If you see frequent reversals around the entry line, enable it and raise the normalized gap threshold slightly.
Adjust the adaptive gate. If the chart floods, raise the percentile. If the chart starves, lower it or use a slightly lower fixed threshold.
Adjust the fallback span multiplier and tick floor so that stops are never microscopic.
Review per session performance. If one session underperforms, restrict entries to the better one.
This simple process takes minutes and transfers to any other symbol.
Why this script is private
The source remains private so that the underlying method and its implementation details are not copied or republished. The description here is complete and self contained so that users can understand the purpose, originality, usage, and limitations without needing to inspect the source. Privacy does not change the strategy’s on chart behavior. It only protects the specific coding details.
Guarantee and compliance statements
This description does not contain advertising, solicitations, links, or contact information. It does not make performance promises. It explains how the script is original and how it works. It also warns about limitations and the need for realistic assumptions. The strategy is not investment advice and is not created only for qualified investors. It can be tested and used for educational and research purposes. Users should read TradingView’s documentation on script properties and backtesting. Users should avoid non standard chart types for signal computation because those produce unrealistic results. Users should select realistic account sizes and friction settings. Users should not post claims without showing the settings used.
Closing summary
PulseGrid is a compact framework for short timeframe trading that combines a composite entry built from multiple normalized bar features with a symmetric span model for risk. The entry adapts to volatility. The regime guards keep the strategy inactive when the tape is either too quiet or too erratic. The risk geometry respects recent untraded spans instead of arbitrary distances. The entire design is instrument agnostic. It will run on any symbol that TradingView supports and it will behave consistently across asset classes with modest tuning. Use it with a clean chart, realistic friction, and enough trades to make your evaluation meaningful. Use sessions if the instrument concentrates activity in specific hours. Adjust one control at a time and prefer small increments. The goal is not to find a magic parameter. The goal is to maintain a stable rule set that reads market structure in a way you can trust and audit.

Magracia Entry-Exit 5 Min Time frame//------------------------------------------------------------------------------------------------------
// 🧭 Indicator Description
//------------------------------------------------------------------------------------------------------
// 📘 Overview:
// This indicator is a modified version of the LuxAlgo pattern logic designed to detect
// high-probability **RBD (Rally–Base–Drop)** and **DBR (Drop–Base–Rally)** reversal structures
// directly on the current candle. It automatically identifies potential BUY and SELL zones,
// plots corresponding trade signals, and dynamically calculates **Take Profit (TP)** and **Stop Loss (SL)** levels.
//
// The goal of this tool is to give clear, visually guided trade entries and exits that
// follow price structure and momentum changes without repainting historical data.
//
//------------------------------------------------------------------------------------------------------
// 🧩 How It Works:
// • **RBD (Rally–Base–Drop)** → Indicates a bearish reversal (SELL signal)
// • **DBR (Drop–Base–Rally)** → Indicates a bullish reversal (BUY signal)
// • Optional **RBR / DBD** continuation patterns can be toggled on for trend continuation setups.
// • When a signal is detected, the script automatically places:
// ▫ A BUY or SELL marker at the candle
// ▫ Dynamic TP (green dotted line) and SL (red dotted line) levels
// ▫ An EXIT marker when either TP or SL is reached
//
//------------------------------------------------------------------------------------------------------
// ⚙️ Inputs:
// • Enable or disable individual pattern types (RBD, RBR, DBD, DBR)
// • Toggle continuation patterns (RBR/DBD)
// • Customize Take Profit and Stop Loss percentages
// • Adjust rally/drop bar colors for easier pattern visualization
//
//------------------------------------------------------------------------------------------------------
// 🧠 Usage Tips:
// • Works best on volatile pairs and short–term timeframes (1m to 15m)
// • Can be combined with volume or trend filters for stronger confirmation
// • When used on higher timeframes (e.g., 4H+), increase TP/SL percentage range
//
//------------------------------------------------------------------------------------------------------
// ⚠️ Notes:
// • Signals are plotted **in real-time on the current candle** (not delayed).
// • This indicator is for visual and educational use only and does not guarantee profitability.
// • For optimal results, combine it with proper risk management and confirmation indicators.
//
//------------------------------------------------------------------------------------------------------
// © Gideon (CC BY-NC-SA 4.0 Licensed)
//------------------------------------------------------------------------------------------------------

Algo Trading Signals - Buy/Sell System# 📊 Algo Trading Signals - Dynamic Buy/Sell System
## 🎯 Overview
**Algo Trading Signals** is a sophisticated intraday trading indicator designed for algorithmic traders and active day traders. This system generates precise buy and sell signals based on a dynamic box breakout strategy with intelligent position management, add-on entries, and automatic target adjustment.
The indicator creates a reference price box during a specified time window (default: 9:15 AM - 9:45 AM IST) and generates high-probability signals when price breaks out of this range with confirmation.
---
## ✨ Key Features
### 📍 **Smart Signal Generation**
- **Primary Entry Signals**: Clear buy/sell signals on confirmed breakouts above/below the reference box
- **Confirmation Bars**: Reduces false signals by requiring multiple bar confirmation before entry
- **Cooldown System**: Prevents overtrading with configurable cooldown periods between trades
- **Add-On Positions**: Automatically identifies optimal pullback entries for scaling into positions
### 📦 **Dynamic Reference Box**
- Creates a high/low range during your chosen time window
- Automatically updates after each successful trade
- Visual box display with color-coded boundaries (red=resistance, green=support)
- Mid-level reference line for market structure analysis
### 🎯 **Intelligent Position Management**
- **Automatic Target Calculation**: Sets profit targets based on average move distance
- **Add-On System**: Up to 3 additional entries on optimal pullbacks
- **Position Tracking**: Monitors active trades and remaining add-on capacity
- **Auto Box Shift**: Adjusts reference box after target hits for continued trading
### 📊 **Visual Clarity**
- **Color-Coded Labels**:
- 🟢 Green for BUY signals
- 🔴 Red for SELL signals
- 🔵 Blue for ADD-ON buys
- 🟠 Orange for ADD-ON sells
- ✓ Yellow for Target hits
- **TP Level Lines**: Dotted lines showing current profit targets
- **Hover Tooltips**: Detailed information on entry prices, targets, and add-on numbers
### 📈 **Real-Time Statistics**
Live performance dashboard showing:
- Total buy and sell signals generated
- Number of add-on positions taken
- Take profit hits achieved
- Current trade status (LONG/SHORT/None)
- Cooldown timer status
### 🔔 **Comprehensive Alerts**
Built-in alert conditions for:
- Primary buy entry signals
- Primary sell entry signals
- Add-on buy positions
- Add-on sell positions
- Buy take profit hits
- Sell take profit hits
---
## 🛠️ Configuration Options
### **Time Settings**
- **Box Start Hour/Minute**: Define when to begin tracking the reference range
- **Box End Hour/Minute**: Define when to lock the reference box
- **Default**: 9:15 AM - 9:45 AM (IST) - Perfect for Indian market opening range
### **Trade Settings**
- **Target Points (TP)**: Average move distance for profit targets (default: 40 points)
- **Breakout Confirmation Bars**: Number of bars to confirm breakout (default: 2)
- **Cooldown After Trade**: Bars to wait after closing position (default: 3)
- **Add-On Distance Points**: Minimum pullback for add-on entry (default: 40 points)
- **Max Add-On Positions**: Maximum additional positions allowed (default: 3)
### **Display Options**
- Toggle buy/sell signal labels
- Show/hide trading box visualization
- Show/hide TP level lines
- Show/hide statistics table
---
## 💡 How It Works
### **Phase 1: Box Formation (9:15 AM - 9:45 AM)**
The indicator tracks the high and low prices during your specified time window to create a reference box representing the opening range.
### **Phase 2: Breakout Detection**
After the box is locked, the system monitors for:
- **Bullish Breakout**: Price closes above box high for confirmation bars
- **Bearish Breakout**: Price closes below box low for confirmation bars
### **Phase 3: Signal Generation**
When confirmation requirements are met:
- Entry signal is generated with clear visual label
- Target price is calculated (Entry ± Target Points)
- Position tracking activates
- Cooldown timer starts
### **Phase 4: Position Management**
During active trade:
- **Add-On Logic**: If price pulls back by specified distance but stays within favorable range, additional entry signal fires
- **Target Monitoring**: Continuously checks if price reaches TP level
- **Box Adjustment**: After TP hit, box automatically shifts to new range for next opportunity
### **Phase 5: Trade Exit & Reset**
On target hit:
- Position closes with TP marker
- Statistics update
- Box repositions for next setup
- Cooldown activates
- System ready for next signal
---
## 📌 Best Use Cases
### **Ideal For:**
- ✅ Intraday breakout trading strategies
- ✅ Algorithmic trading systems (via alerts/webhooks)
- ✅ Opening range breakout (ORB) strategies
- ✅ Index futures (Nifty, Bank Nifty, Sensex)
- ✅ High-liquidity stocks with clear ranges
- ✅ Automated trading bots
- ✅ Scalping and day trading
### **Markets:**
- Indian Stock Market (NSE/BSE)
- Futures & Options
- Forex pairs
- Cryptocurrency (adjust timing for 24/7 markets)
- Global indices
---
## ⚙️ Integration with Algo Trading
This indicator is **algo-ready** and can be integrated with automated trading systems:
1. **TradingView Alerts**: Set up alert conditions for each signal type
2. **Webhook Integration**: Connect alerts to trading platforms via webhooks
3. **API Automation**: Use with brokers supporting TradingView integration (Zerodha, Upstox, Interactive Brokers, etc.)
4. **Signal Data Access**: All signals are plotted for external data retrieval
---
## 📖 Quick Start Guide
1. **Add Indicator**: Apply to your chart (works best on 1-5 minute timeframes)
2. **Configure Time Window**: Set your desired box formation period
3. **Adjust Parameters**: Tune confirmation bars, targets, and add-on settings to your trading style
4. **Set Alerts**: Create alert conditions for automated notifications
5. **Backtest**: Review historical signals to validate strategy performance
6. **Go Live**: Enable alerts and start receiving real-time trading signals
---
## ⚠️ Risk Disclaimer
This indicator is a **tool for analysis** and does not guarantee profits. Trading involves substantial risk of loss. Always:
- Use proper position sizing
- Implement stop losses (not included in this indicator)
- Test thoroughly before live trading
- Understand market conditions
- Never risk more than you can afford to lose
- Consider your risk tolerance and trading experience
**Past performance does not indicate future results.**
## 🔄 Version History
**v1.0** - Initial Release
- Dynamic box formation system
- Confirmed breakout signals
- Add-on position management
- Visual signal labels and statistics
- Comprehensive alert system
- Auto-adjusting target boxes
---
## 📞 Support & Feedback
If you find this indicator helpful:
- ⭐ Please leave a like/favorite
- 💬 Share your feedback in comments
- 📊 Share your results and improvements
- 🤝 Suggest features for future updates
---
## 🏷️ Tags
`breakout` `daytrading` `signals` `algo` `automated` `intraday` `ORB` `opening-range` `buy-sell` `scalping` `futures` `nifty` `banknifty` `algorithmic` `box-strategy`
*Remember: The best indicator is combined with proper risk management and trading discipline.* Use it at your own rist, not as financial advie

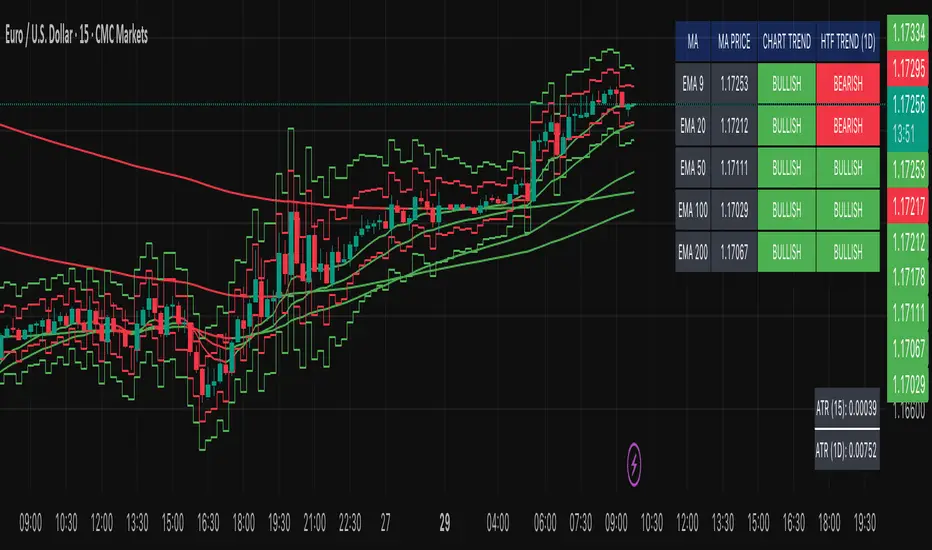
Multi-MA Trend Indicator with ATR by nkChartsThe MMA-ATR is a powerful all-in-one tool that combines multi-timeframe Moving Averages with ATR-based Stop Loss & Take Profit levels. It is designed to help traders quickly assess trend direction, volatility, and potential trade levels in one clean visual setup.
Key Features
Multi-MA Trend Detection
Plots 5 customizable moving averages (choose from EMA, SMA, RMA, WMA, VWMA).
Automatic color coding: Bullish (green), Bearish (red), Neutral (gray).
MA Trend Table with:
MA values
Current chart trend
Higher timeframe (Daily) trend confirmation
ATR-Based Trade Levels
Dynamic Stop Loss (SL) and Take Profit (TP) levels based on ATR multipliers.
Separate visual lines for long and short setups.
ATR Table with:
ATR value for the current chart timeframe
ATR value for the Daily timeframe
Customizations
Choose MA type, length, and price source.
Customize bullish, bearish, and neutral colors.
Adjustable table position and text size.
Fully configurable ATR length, multipliers, and colors.
How to Use
Add the indicator to your chart.
Use the MA Trend Table to identify short-term and higher timeframe trend direction.
Refer to ATR-based SL/TP levels to manage risk and potential profit targets.
Combine both to filter entries and improve trade timing.
Best For
Swing traders and intraday traders who rely on trend confirmation and volatility-based risk management.
Traders looking for a multi-timeframe confirmation system that reduces noise.
⚠️ Disclaimer: This indicator is for educational purposes only. It does not provide financial advice or guarantee profits. Always perform your own analysis before making trading decisions.
BOCS Channel Scalper Indicator - Mean Reversion Alert System# BOCS Channel Scalper Indicator - Mean Reversion Alert System
## WHAT THIS INDICATOR DOES:
This is a mean reversion trading indicator that identifies consolidation channels through volatility analysis and generates alert signals when price enters entry zones near channel boundaries. **This indicator version is designed for manual trading with comprehensive alert functionality.** Unlike automated strategies, this tool sends notifications (via popup, email, SMS, or webhook) when trading opportunities occur, allowing you to manually review and execute trades. The system assumes price will revert to the channel mean, identifying scalp opportunities as price reaches extremes and preparing to bounce back toward center.
## INDICATOR VS STRATEGY - KEY DISTINCTION:
**This is an INDICATOR with alerts, not an automated strategy.** It does not execute trades automatically. Instead, it:
- Displays visual signals on your chart when entry conditions are met
- Sends customizable alerts to your device/email when opportunities arise
- Shows TP/SL levels for reference but does not place orders
- Requires you to manually enter and exit positions based on signals
- Works with all TradingView subscription levels (alerts included on all plans)
**For automated trading with backtesting**, use the strategy version. For manual control with notifications, use this indicator version.
## ALERT CAPABILITIES:
This indicator includes four distinct alert conditions that can be configured independently:
**1. New Channel Formation Alert**
- Triggers when a fresh BOCS channel is identified
- Message: "New BOCS channel formed - potential scalp setup ready"
- Use this to prepare for upcoming trading opportunities
**2. Long Scalp Entry Alert**
- Fires when price touches the long entry zone
- Message includes current price, calculated TP, and SL levels
- Notification example: "LONG scalp signal at 24731.75 | TP: 24743.2 | SL: 24716.5"
**3. Short Scalp Entry Alert**
- Fires when price touches the short entry zone
- Message includes current price, calculated TP, and SL levels
- Notification example: "SHORT scalp signal at 24747.50 | TP: 24735.0 | SL: 24762.75"
**4. Any Entry Signal Alert**
- Combined alert for both long and short entries
- Use this if you want a single alert stream for all opportunities
- Message: "BOCS Scalp Entry: at "
**Setting Up Alerts:**
1. Add indicator to chart and configure settings
2. Click the Alert (⏰) button in TradingView toolbar
3. Select "BOCS Channel Scalper" from condition dropdown
4. Choose desired alert type (Long, Short, Any, or Channel Formation)
5. Set "Once Per Bar Close" to avoid false signals during bar formation
6. Configure delivery method (popup, email, webhook for automation platforms)
7. Save alert - it will fire automatically when conditions are met
**Alert Message Placeholders:**
Alerts use TradingView's dynamic placeholder system:
- {{ticker}} = Symbol name (e.g., NQ1!)
- {{close}} = Current price at signal
- {{plot_1}} = Calculated take profit level
- {{plot_2}} = Calculated stop loss level
These placeholders populate automatically, creating detailed notification messages without manual configuration.
## KEY DIFFERENCE FROM ORIGINAL BOCS:
**This indicator is designed for traders seeking higher trade frequency.** The original BOCS indicator trades breakouts OUTSIDE channels, waiting for price to escape consolidation before entering. This scalper version trades mean reversion INSIDE channels, entering when price reaches channel extremes and betting on a bounce back to center. The result is significantly more trading opportunities:
- **Original BOCS**: 1-3 signals per channel (only on breakout)
- **Scalper Indicator**: 5-15+ signals per channel (every touch of entry zones)
- **Trade Style**: Mean reversion vs trend following
- **Hold Time**: Seconds to minutes vs minutes to hours
- **Best Markets**: Ranging/choppy conditions vs trending breakouts
This makes the indicator ideal for active day traders who want continuous alert opportunities within consolidation zones rather than waiting for breakout confirmation. However, increased signal frequency also means higher potential commission costs and requires disciplined trade selection when acting on alerts.
## TECHNICAL METHODOLOGY:
### Price Normalization Process:
The indicator normalizes price data to create consistent volatility measurements across different instruments and price levels. It calculates the highest high and lowest low over a user-defined lookback period (default 100 bars). Current close price is normalized using: (close - lowest_low) / (highest_high - lowest_low), producing values between 0 and 1 for standardized volatility analysis.
### Volatility Detection:
A 14-period standard deviation is applied to the normalized price series to measure price deviation from the mean. Higher standard deviation values indicate volatility expansion; lower values indicate consolidation. The indicator uses ta.highestbars() and ta.lowestbars() to identify when volatility peaks and troughs occur over the detection period (default 14 bars).
### Channel Formation Logic:
When volatility crosses from a high level to a low level (ta.crossover(upper, lower)), a consolidation phase begins. The indicator tracks the highest and lowest prices during this period, which become the channel boundaries. Minimum duration of 10+ bars is required to filter out brief volatility spikes. Channels are rendered as box objects with defined upper and lower boundaries, with colored zones indicating entry areas.
### Entry Signal Generation:
The indicator uses immediate touch-based entry logic. Entry zones are defined as a percentage from channel edges (default 20%):
- **Long Entry Zone**: Bottom 20% of channel (bottomBound + channelRange × 0.2)
- **Short Entry Zone**: Top 20% of channel (topBound - channelRange × 0.2)
Long signals trigger when candle low touches or enters the long entry zone. Short signals trigger when candle high touches or enters the short entry zone. Visual markers (arrows and labels) appear on chart, and configured alerts fire immediately.
### Cooldown Filter:
An optional cooldown period (measured in bars) prevents alert spam by enforcing minimum spacing between consecutive signals. If cooldown is set to 3 bars, no new long alert will fire until 3 bars after the previous long signal. Long and short cooldowns are tracked independently, allowing both directions to signal within the same period.
### ATR Volatility Filter:
The indicator includes a multi-timeframe ATR filter to avoid alerts during low-volatility conditions. Using request.security(), it fetches ATR values from a specified timeframe (e.g., 1-minute ATR while viewing 5-minute charts). The filter compares current ATR to a user-defined minimum threshold:
- If ATR ≥ threshold: Alerts enabled
- If ATR < threshold: No alerts fire
This prevents notifications during dead zones where mean reversion is unreliable due to insufficient price movement. The ATR status is displayed in the info table with visual confirmation (✓ or ✗).
### Take Profit Calculation:
Two TP methods are available:
**Fixed Points Mode**:
- Long TP = Entry + (TP_Ticks × syminfo.mintick)
- Short TP = Entry - (TP_Ticks × syminfo.mintick)
**Channel Percentage Mode**:
- Long TP = Entry + (ChannelRange × TP_Percent)
- Short TP = Entry - (ChannelRange × TP_Percent)
Default 50% targets the channel midline, a natural mean reversion target. These levels are displayed as visual lines with labels and included in alert messages for reference when manually placing orders.
### Stop Loss Placement:
Stop losses are calculated just outside the channel boundary by a user-defined tick offset:
- Long SL = ChannelBottom - (SL_Offset_Ticks × syminfo.mintick)
- Short SL = ChannelTop + (SL_Offset_Ticks × syminfo.mintick)
This logic assumes channel breaks invalidate the mean reversion thesis. SL levels are displayed on chart and included in alert notifications as suggested stop placement.
### Channel Breakout Management:
Channels are removed when price closes more than 10 ticks outside boundaries. This tolerance prevents premature channel deletion from minor breaks or wicks, allowing the mean reversion setup to persist through small boundary violations.
## INPUT PARAMETERS:
### Channel Settings:
- **Nested Channels**: Allow multiple overlapping channels vs single channel
- **Normalization Length**: Lookback for high/low calculation (1-500, default 100)
- **Box Detection Length**: Period for volatility detection (1-100, default 14)
### Scalping Settings:
- **Enable Long Scalps**: Toggle long alert generation on/off
- **Enable Short Scalps**: Toggle short alert generation on/off
- **Entry Zone % from Edge**: Size of entry zone (5-50%, default 20%)
- **SL Offset (Ticks)**: Distance beyond channel for stop (1+, default 5)
- **Cooldown Period (Bars)**: Minimum spacing between alerts (0 = no cooldown)
### ATR Filter:
- **Enable ATR Filter**: Toggle volatility filter on/off
- **ATR Timeframe**: Source timeframe for ATR (1, 5, 15, 60 min, etc.)
- **ATR Length**: Smoothing period (1-100, default 14)
- **Min ATR Value**: Threshold for alert enablement (0.1+, default 10.0)
### Take Profit Settings:
- **TP Method**: Choose Fixed Points or % of Channel
- **TP Fixed (Ticks)**: Static distance in ticks (1+, default 30)
- **TP % of Channel**: Dynamic target as channel percentage (10-100%, default 50%)
### Appearance:
- **Show Entry Zones**: Toggle zone labels on channels
- **Show Info Table**: Display real-time indicator status
- **Table Position**: Corner placement (Top Left/Right, Bottom Left/Right)
- **Long Color**: Customize long signal color (default: darker green for readability)
- **Short Color**: Customize short signal color (default: red)
- **TP/SL Colors**: Customize take profit and stop loss line colors
- **Line Length**: Visual length of TP/SL reference lines (5-200 bars)
## VISUAL INDICATORS:
- **Channel boxes** with semi-transparent fill showing consolidation zones
- **Colored entry zones** labeled "LONG ZONE ▲" and "SHORT ZONE ▼"
- **Entry signal arrows** below/above bars marking long/short alerts
- **TP/SL reference lines** with emoji labels (⊕ Entry, 🎯 TP, 🛑 SL)
- **Info table** showing channel status, last signal, entry/TP/SL prices, risk/reward ratio, and ATR filter status
- **Visual confirmation** when alerts fire via on-chart markers synchronized with notifications
## HOW TO USE:
### For 1-3 Minute Scalping with Alerts (NQ/ES):
- ATR Timeframe: "1" (1-minute)
- ATR Min Value: 10.0 (for NQ), adjust per instrument
- Entry Zone %: 20-25%
- TP Method: Fixed Points, 20-40 ticks
- SL Offset: 5-10 ticks
- Cooldown: 2-3 bars to reduce alert spam
- **Alert Setup**: Configure "Any Entry Signal" for combined long/short notifications
- **Execution**: When alert fires, verify chart visuals, then manually place limit order at entry zone with provided TP/SL levels
### For 5-15 Minute Day Trading with Alerts:
- ATR Timeframe: "5" or match chart
- ATR Min Value: Adjust to instrument (test 8-15 for NQ)
- Entry Zone %: 20-30%
- TP Method: % of Channel, 40-60%
- SL Offset: 5-10 ticks
- Cooldown: 3-5 bars
- **Alert Setup**: Configure separate "Long Scalp Entry" and "Short Scalp Entry" alerts if you trade directionally based on bias
- **Execution**: Review channel structure on alert, confirm ATR filter shows ✓, then enter manually
### For 30-60 Minute Swing Scalping with Alerts:
- ATR Timeframe: "15" or "30"
- ATR Min Value: Lower threshold for broader market
- Entry Zone %: 25-35%
- TP Method: % of Channel, 50-70%
- SL Offset: 10-15 ticks
- Cooldown: 5+ bars or disable
- **Alert Setup**: Use "New Channel Formation" to prepare for setups, then "Any Entry Signal" for execution alerts
- **Execution**: Larger timeframes allow more analysis time between alert and entry
### Webhook Integration for Semi-Automation:
- Configure alert webhook URL to connect with platforms like TradersPost, TradingView Paper Trading, or custom automation
- Alert message includes all necessary order parameters (direction, entry, TP, SL)
- Webhook receives structured data when signal fires
- External platform can auto-execute based on alert payload
- Still maintains manual oversight vs full strategy automation
## USAGE CONSIDERATIONS:
- **Manual Discipline Required**: Alerts provide opportunities but execution requires judgment. Not all alerts should be taken - consider market context, trend, and channel quality
- **Alert Timing**: Alerts fire on bar close by default. Ensure "Once Per Bar Close" is selected to avoid false signals during bar formation
- **Notification Delivery**: Mobile/email alerts may have 1-3 second delay. For immediate execution, use desktop popups or webhook automation
- **Cooldown Necessity**: Without cooldown, rapidly touching price action can generate excessive alerts. Start with 3-bar cooldown and adjust based on alert volume
- **ATR Filter Impact**: Enabling ATR filter dramatically reduces alert count but improves quality. Track filter status in info table to understand when you're receiving fewer alerts
- **Commission Awareness**: High alert frequency means high potential trade count. Calculate if your commission structure supports frequent scalping before acting on all alerts
## COMPATIBLE MARKETS:
Works on any instrument with price data including stock indices (NQ, ES, YM, RTY), individual stocks, forex pairs (EUR/USD, GBP/USD), cryptocurrency (BTC, ETH), and commodities. Volume-based features are not included in this indicator version. Multi-timeframe ATR requires higher-tier TradingView subscription for request.security() functionality on timeframes below chart timeframe.
## KNOWN LIMITATIONS:
- **Indicator does not execute trades** - alerts are informational only; you must manually place all orders
- **Alert delivery depends on TradingView infrastructure** - delays or failures possible during platform issues
- **No position tracking** - indicator doesn't know if you're in a trade; you must manage open positions independently
- **TP/SL levels are reference only** - you must manually set these on your broker platform; they are not live orders
- **Immediate touch entry can generate many alerts** in choppy zones without adequate cooldown
- **Channel deletion at 10-tick breaks** may be too aggressive or lenient depending on instrument tick size
- **ATR filter from lower timeframes** requires TradingView Premium/Pro+ for request.security()
- **Mean reversion logic fails** in strong breakout scenarios - alerts will fire but trades may hit stops
- **No partial closing capability** - full position management is manual; you determine scaling out
- **Alerts do not account for gaps** or overnight price changes; morning alerts may be stale
## RISK DISCLOSURE:
Trading involves substantial risk of loss. This indicator provides signals for educational and informational purposes only and does not constitute financial advice. Past performance does not guarantee future results. Mean reversion strategies can experience extended drawdowns during trending markets. Alerts are not guaranteed to be profitable and should be combined with your own analysis. Stop losses may not fill at intended levels during extreme volatility or gaps. Never trade with capital you cannot afford to lose. Consider consulting a licensed financial advisor before making trading decisions. Always verify alerts against current market conditions before executing trades manually.
## ACKNOWLEDGMENT & CREDITS:
This indicator is built upon the channel detection methodology created by **AlgoAlpha** in the "Smart Money Breakout Channels" indicator. Full credit and appreciation to AlgoAlpha for pioneering the normalized volatility approach to identifying consolidation patterns. The core channel formation logic using normalized price standard deviation is AlgoAlpha's original contribution to the TradingView community.
Enhancements to the original concept include: mean reversion entry logic (vs breakout), immediate touch-based alert generation, comprehensive alert condition system with customizable notifications, multi-timeframe ATR volatility filtering, cooldown period for alert management, dual TP methods (fixed points vs channel percentage), visual TP/SL reference lines, and real-time status monitoring table. This indicator version is specifically designed for manual traders who prefer alert-based decision making over automated execution.

Katz Impact Wave 🚀Overview of the Katz Impact Wave 🚀
The Katz Impact Wave is a momentum oscillator designed to visualize the battle between buyers and sellers. Instead of combining bullish and bearish pressure into a single line, it separates them into two distinct "Impact Waves."
Its primary goal is to generate clear trade signals by identifying when one side gains control, but only when the market has enough volatility to be considered "moving." This built-in filter helps to avoid signals during flat or choppy market conditions.
Indicator Components: Lines & Plots
Impact Waves & Fill
Green Wave (Total Up Impulses): This line represents the cumulative buying pressure. When this line is rising, it indicates that bulls are getting stronger.
Red Wave (Total Down Impulses): This line represents the cumulative selling pressure. When this line is rising, it indicates that bears are getting stronger.
Colored Fill: The shaded area between the two waves provides an at-a-glance view of who is in control.
Lime Fill: Bulls are dominant (Green Wave is above the Red Wave).
Red Fill: Bears are dominant (Red Wave is above the Green Wave).
Background Color
The background color provides crucial context about the market state according to the indicator's logic.
Green Background: The market is in a bullish state (Green Wave is dominant) AND the Rate of Change (ROC) filter confirms the market is actively moving.
Red Background: The market is in a bearish state (Red Wave is dominant) AND the ROC filter confirms the market is actively moving.
Gray Background: The market is considered "not moving" or is in a low-volatility chop. Signals that occur when the background is gray should be viewed with extreme caution or ignored.
Symbols & Pivot Lines
▲ Blue Triangle (Up): This is your long entry signal. It appears on the bar where the Green Wave crosses above the Red Wave while the market is moving.
▼ Orange Triangle (Down): This is your short entry signal. It appears on the bar where the Red Wave crosses above the Green Wave while the market is moving.
Pivot Lines (Solid Green/Red/White Lines): These lines mark confirmed peaks of exhaustion in momentum, not price.
Green Pivot Line: Marks a peak in the Green Wave, signaling buying momentum exhaustion. This can be a warning that the uptrend is losing steam.
Red Pivot Line: Marks a peak in the Red Wave, signaling selling momentum exhaustion. This can be a warning that the downtrend is losing steam.
▼ Yellow Triangle (Compression): This rare signal appears when buying and selling exhaustion pivots happen at the same level. It signifies a point of extreme indecision or equilibrium that often occurs before a major price expansion.
Trading Rules & Strategy
This indicator provides entry signals but does not provide explicit Take Profit or Stop Loss levels. You must use your own risk management rules.
Long Trade Rules
Entry Signal: Wait for a blue ▲ triangle to appear at the top of the indicator panel.
Confirmation: Ensure the background color is green, confirming the market is in a bullish, moving state.
Action: Enter a long (buy) trade at the open of the next candle after the signal appears.
Short Trade Rules
Entry Signal: Wait for an orange ▼ triangle to appear at the bottom of the indicator panel.
Confirmation: Ensure the background color is red, confirming the market is in a bearish, moving state.
Action: Enter a short (sell) trade at the open of the next candle after the signal appears.
Take Profit (TP) & Stop Loss (SL) Ideas
You must develop and test your own exit strategy. Here are some common approaches:
Stop Loss:
Place a stop loss below the most recent significant swing low on the price chart for a long trade, or above the recent swing high for a short trade.
Use an ATR (Average True Range) based stop, such as 2x the ATR value below your entry for a long, to account for market volatility.
Take Profit:
Opposite Signal: The simplest exit is to close your trade when the opposite signal appears (e.g., close a long trade when a short signal ▼ appears).
Momentum Exhaustion: For a long trade, consider taking partial or full profit when a green Pivot Line appears, signaling that buying momentum is peaking.
Fixed Risk/Reward: Use a predetermined risk/reward ratio (e.g., 1:1.5 or 1:2).
Disclaimer
This indicator is a tool for analysis, not a financial advisor or a guaranteed profit system. All trading and investment activities involve substantial risk. You should not risk more than you are prepared to lose. Past performance is not an indication of future results. You are solely responsible for your own trading decisions, risk management, and for backtesting this or any other tool before using it in a live trading environment. This indicator is for educational purposes only.

Katz Exploding PowerBand FilterUnderstanding the Katz Exploding PowerBand Filter (EPBF) v2.4
1. Indicator Overview
The Katz Exploding PowerBand Filter (EPBF) is an advanced technical indicator designed to identify moments of expanding bullish or bearish momentum, often referred to as "power." It operates as a standalone oscillator in a separate pane below the main price chart.
Its primary goal is to measure underlying market strength by calculating custom "Bull" and "Bear" power components. These components are then filtered through a versatile moving average and a dual signal line system to generate clear entry and exit signals. This indicator is not a simple momentum oscillator; it uses a unique calculation based on exponential envelopes of both price and squared price to derive its values.
2. On-Chart Lines and Components
The indicator pane consists of five main lines:
Bullish Component (Thick Green/Blue/Yellow/Gray Line): This is the core of the indicator. It represents the calculated bullish "power" or momentum in the market.
Bright Green: Indicates a strong, active long signal condition.
Blue: Shows the bull component is above the MA filter, but the filter itself is still pointing down—a potential sign of a reversal or weakening downtrend.
Yellow: A warning sign that bullish power is weakening and has fallen below the primary signal lines.
Gray: Represents neutral or insignificant bullish power.
Bearish Component (Thick Red/Purple/Yellow/Gray Line): This line represents the calculated bearish "power" or downward momentum.
Bright Red: Indicates a strong, active short signal condition.
Purple: Shows the bear component is above the MA filter, but the filter itself is still pointing down—a sign of potential trend continuation.
Yellow: A warning sign that bearish power is weakening.
Gray: Represents neutral or insignificant bearish power.
MA Filter (Purple Line): This is the main filter, calculated using the moving average type and length you select in the settings (e.g., HullMA, EMA). The Bull and Bear components are compared against this line to determine the underlying trend bias.
Signal Line 1 (Orange Line): A fast Exponential Moving Average (EMA) of the stronger power component. It acts as the first level of dynamic support or resistance for the power lines.
Signal Line 2 (Lime/Gray Line): A slower EMA that acts as a confirmation filter.
Lime Green: The line turns lime when it is rising and the faster Signal Line 1 is above it, indicating a confirmed bullish trend in momentum.
Gray: Indicates a neutral or bearish momentum trend.
3. On-Chart Symbols and Their Meanings
Various characters are plotted at the bottom of the indicator pane to provide clear, actionable signals.
L (Pre-Long Signal): The first sign of a potential long entry. It appears when the Bullish Component rises and crosses above both signal lines for the first time.
S (Pre-Short Signal): The first sign of a potential short entry. It appears when the Bearish Component rises and crosses above both signal lines for the first time.
▲ (Post-Long Signal): A stronger confirmation for a long entry. It appears with the 'L' signal only if the momentum trend is also confirmed bullish (i.e., the slower Signal Line 2 is lime green).
▼ (Post-Short Signal): A stronger confirmation for a short entry. It appears with the 'S' signal only if the momentum trend is confirmed bullish.
Exit / Take-Profit Symbols:
These symbols appear when a power component crosses below a line, suggesting that momentum is fading and it may be time to take profit.
⚠️ (Exit Signal 1): The Bull/Bear component has crossed below the main MA Filter. This is the first and most sensitive take-profit signal.
☣️ (Exit Signal 2): The Bull/Bear component has crossed below the faster Signal Line 1. This is a moderate take-profit signal.
🚼 (Exit Signal 3): The Bull/Bear component has crossed below the slower Signal Line 2. This is the slowest take-profit signal, suggesting the trend is more definitively exhausted.
4. Trading Strategy and Rules
Long Entry Rules:
Initial Signal: Wait for an L to appear at the bottom of the indicator. This confirms that bullish power is expanding.
Confirmation (Recommended): For a higher-probability trade, wait for a green ▲ symbol to appear. This confirms the underlying momentum trend aligns with the signal.
Entry: Enter a long (buy) position on the opening of the next candle after the signal appears.
Short Entry Rules:
Initial Signal: Wait for an S to appear at the bottom of the indicator. This confirms that bearish power is expanding.
Confirmation (Recommended): For a higher-probability trade, wait for a maroon ▼ symbol to appear. This confirms the underlying momentum trend aligns with the signal.
Entry: Enter a short (sell) position on the opening of the next candle after the signal appears.
Take Profit (TP) Rules:
The indicator provides three levels of take-profit signals. You can choose to exit your entire position or scale out at each level.
For a long trade, exit when you see ⚠️, ☣️, or 🚼 appear below the Bullish Component.
For a short trade, exit when you see ⚠️, ☣️, or 🚼 appear below the Bearish Component.
Stop Loss (SL) Rules:
The indicator does not provide an explicit stop loss. You must use your own risk management rules. Common methods include:
Swing High/Low: For a long position, place your stop loss below the most recent significant swing low on the price chart. For a short position, place it above the most recent swing high.
ATR-Based: Use an Average True Range (ATR) indicator to set a volatility-based stop loss.
Fixed Percentage: Risk a fixed percentage (e.g., 1-2%) of your account on the trade.
5. Disclaimer
This indicator is a tool for technical analysis and should not be considered financial advice. All trading involves significant risk, and past performance is not indicative of future results. The signals generated by this indicator are probabilistic and can result in losing trades. Always use proper risk management, such as setting a stop loss, and never risk more than you are willing to lose. It is recommended to backtest this indicator and use it in conjunction with other forms of analysis before trading with real capital. The indicator should only be used for educational purposes.

ICT Turtle Soup (Riz)The ICT Turtle Soup Complete System is an advanced implementation of the Inner Circle Trader's interpretation of the classic Turtle Soup pattern, designed to identify and trade liquidity sweeps at key market levels. This strategy capitalizes on the systematic stop-loss hunting behavior of institutional traders by detecting when price temporarily breaches significant support/resistance levels to trigger retail stop-losses, then quickly reverses direction.
Core Trading Logic
Liquidity Sweep Detection Method
The strategy monitors five critical liquidity pools where retail traders commonly place stop-loss orders:
⦁ Yesterday's High/Low: Previous daily session extremes
⦁ Daily High/Low: Rolling 20-day period extremes
⦁ 4-Hour High/Low: 30-period extremes on 4H timeframe
⦁ 1-Hour High/Low: 50-period extremes on hourly timeframe
⦁ Recent High/Low: Current timeframe extremes (20-40 bars based on trading mode)
Entry Signal Generation Process
Buy Signal (Sell-Side Liquidity Sweep):
1. Price penetrates below a key support level by a minimum threshold (5-15 ticks depending on signal quality settings)
2. The penetration bar must show strong rejection with at least 30-50% of the candle's range closing back above the swept level
3. Multi-timeframe confirmation checks for structure shift on lower timeframe (break of recent swing high)
4. Confluence scoring system evaluates 7 factors, requiring minimum 3 confirmations:
⦁ Liquidity sweep detected (weighted 2x)
⦁ Higher timeframe bullish market structure
⦁ Lower timeframe bullish break of structure
⦁ Bullish Fair Value Gap presence
⦁ Bullish Order Block formation
⦁ ICT Kill Zone timing alignment
Sell Signal (Buy-Side Liquidity Sweep):
Mirror opposite of buy signal logic, detecting sweeps above resistance levels with bearish rejection.
Risk Management & Position Sizing
Stop Loss Placement:
⦁ Calculated using ATR (Average True Range) multiplied by an adaptive factor
⦁ Base multipliers: Scalping (1.0x), Day Trading (1.5x), Swing Trading (2.0x)
⦁ Further adjusted by signal quality: Conservative (-20%), Balanced (0%), Aggressive (+20%)
⦁ Positioned beyond the liquidity sweep point to avoid re-sweeping
Take Profit Targets:
⦁ TP1: 2.0R (Risk-Reward ratio)
⦁ TP2: 3.5R
⦁ TP3: 5.0R
⦁ All levels rounded to tick precision for accurate order placement
Advanced Features & Filters
Multi-Timeframe Structure Analysis
The system performs top-down analysis across three timeframes:
⦁ Higher Timeframe (HTF): Determines primary trend bias
⦁ Medium Timeframe (MTF): Confirms intermediate structure
⦁ Lower Timeframe (LTF): Identifies precise entry triggers
ICT Kill Zones
Incorporates time-based filtering for optimal trading sessions:
⦁ Asian Session (8PM-12AM UTC)
⦁ London Session (2AM-5AM UTC)
⦁ New York Session (7AM-10AM UTC)
⦁ London Close (10AM-12PM UTC)
Smart Money Concepts Integration
⦁ Fair Value Gaps (FVG): Identifies and displays price inefficiencies that act as magnets
⦁ Order Blocks: Marks institutional accumulation/distribution zones
⦁ Mitigation Detection: Automatically removes FVGs and Order Blocks when price fills them
⦁ Duplicate Sweep Prevention: 10-bar lookback prevents multiple signals at same level
Adaptive Trading Modes
Three pre-configured modes automatically adjust all parameters:
⦁ Scalping: Tight stops, quick targets, 15-minute to 1-hour focus
⦁ Day Trading: Balanced approach, 4-hour to daily analysis
⦁ Swing Trading: Wide stops, extended targets, daily to weekly perspective
⦁ Custom Mode: Full manual control of all parameters
Signal Quality Management
⦁ Conservative: Requires 5/7 confluence factors, tighter sweep threshold (5 ticks), 50% minimum rejection
⦁ Balanced: Standard 3/7 confluence, moderate threshold (10 ticks), 30% rejection
⦁ Aggressive: Only 2/7 confluence needed, wider threshold (15 ticks), 20% rejection
Visual Components & Dashboard
Real-Time Information Panel
Displays current market conditions including:
⦁ Active trading mode and quality settings
⦁ Timeframe configuration (HTF/MTF/LTF)
⦁ Market bias from higher timeframes
⦁ Current kill zone status
⦁ Liquidity sweep detection status
⦁ Confluence scoring for both directions
⦁ Risk parameters and targets
Trade Visualization
⦁ Entry, stop-loss, and three take-profit levels with precise price labels
⦁ Automatic cleanup when targets are hit or new signals appear
⦁ Maximum of one active setup displayed for chart clarity
⦁ Color-coded boxes for Fair Value Gaps and Order Blocks
How to Use This Indicator
Recommended Timeframes
⦁ Scalping Mode: 1-minute to 5-minute charts
⦁ Day Trading Mode: 5-minute to 15-minute charts
⦁ Swing Trading Mode: 1-hour to 4-hour charts
Optimal Market Conditions
⦁ Works best in ranging or trending markets with clear support/resistance levels
⦁ Most effective during high-liquidity sessions (London/New York overlap)
⦁ Avoid using during major news events unless specifically targeting news-driven sweeps
Signal Interpretation
1. Wait for triangle signal (up/down) with confluence score
2. Verify the swept level shown in the dashboard
3. Confirm risk-reward ratios match your trading plan
4. Enter at market or set limit order at indicated entry level
5. Place stop-loss and take-profit orders at displayed levels
Customization Tips
⦁ Adjust Signal Quality based on market volatility (Conservative for volatile, Aggressive for quiet)
⦁ Modify sweep threshold if getting too many/few signals
⦁ Toggle individual liquidity levels based on their relevance to your timeframe
⦁ Use Kill Zone filter for session-specific trading
Risk Disclaimer
This indicator identifies potential trade setups based on liquidity sweep patterns but does not guarantee profitable outcomes. Past performance does not indicate future results. Always use proper risk management and never risk more than you can afford to lose. The indicator should be used as part of a comprehensive trading plan that includes your own analysis and risk tolerance assessment.

Katz Candle Momentum Reversal Indicator v4.1Katz Candle Momentum Reversal Indicator (CMRI) v4.1
Overview
The Katz CMRI is a comprehensive trading indicator designed to identify trend direction, momentum shifts, and potential market reversals. It combines several different concepts into a single, cohesive visual tool.
At its core, the indicator uses a custom Line Break chart calculation to filter out market noise and a Heikin-Ashi-style formula to smooth price action. This combination helps to more clearly define the underlying trend. The main output is a dynamic, multi-colored trend line accompanied by various signals that appear directly on your chart. It's designed to help traders stay with the trend while also spotting key moments of expansion, contraction, and potential reversal.
How to Interpret the Indicator
The indicator has several key visual components:
Main Trend Line: This is the thick, central line that changes color.
Green: Indicates a bullish (upward) trend.
Red: Indicates a bearish (downward) trend.
Faded/Light Colors: Suggest a potential loss of momentum or a pullback within the trend.
White: Signals a significant break in the trend structure.
Trend Cloud: The shaded area between the main trend line and the white midline (mid). A green cloud shows the trend is above the midpoint, while a red cloud shows it's below.
Upper/Lower Bands: The aqua (Trend Up) and yellow (Trend Down) lines represent the recent highs and lows of the established trend. When price is pushing against these bands, it signals trend strength.
Background Colors:
Gray: A "Contraction Zone." This indicates that the trend is losing momentum and consolidating, warning of potential chop or a reversal.
Blue: An "Expansion Event." This highlights a sudden increase in momentum in the direction of the trend.
Signal Shapes:
Diamonds: These are the primary entry signals. A green diamond below a candle signals a potential long entry, while a red diamond above a candle signals a potential short entry.
⬆️⬇️ Arrows: These are secondary momentum signals. They can be used as confirmation that the trend is continuing.
Trading Strategy & Rules
This strategy uses the primary diamond signals for entries and trend changes for exits.
Long Trade (Buy) Rules
Entry: Wait for a green diamond to appear below the price candles. For confirmation, the main trend line should turn solid green, and the price should ideally be above the white midline.
Exit:
Stop Loss: Place a stop loss below the recent swing low or below the candle where the green diamond appeared.
Take Profit: Consider exiting the trade when a red diamond appears above the candles, signaling a potential trend reversal. Alternatively, a trader might exit if the background turns gray (Contraction Zone), indicating the bullish momentum has faded.
Short Trade (Sell) Rules
Entry: Wait for a red diamond to appear above the price candles. For confirmation, the main trend line should turn solid red, and the price should ideally be below the white midline.
Exit:
Stop Loss: Place a stop loss above the recent swing high or above the candle where the red diamond appeared.
Take Profit: Consider exiting the trade when a green diamond appears below the candles. A gray "Contraction Zone" can also serve as an early warning to exit as bearish momentum wanes.
Indicator Filters Explained
The indicator includes a "Trend Filter Type" setting that allows you to adjust its sensitivity. This can help reduce false signals in choppy markets.
Raw: This is the most sensitive setting. It will generate a trend change signal as soon as the basic conditions are met. Use this for scalping or in strongly trending markets, but be aware that it may produce more false signals.
OutStep: This is the default, balanced setting. It adds an extra layer of confirmation by requiring the main trend line itself to be moving in the direction of the new trend. For example, a new green signal will only be confirmed if the trend line's value is higher than its previous value. This helps filter out weak signals.
FullStep: This is the most conservative and filtered setting. It includes the "OutStep" logic and adds further conditions related to the upper and lower trend bands. This setting will produce the fewest signals, but they are generally the highest quality, making it suitable for swing trading or avoiding choppy market conditions.
Disclaimer
This indicator is a tool for technical analysis and should not be considered financial advice. All trading involves substantial risk, including the possible loss of principal. Past performance is not indicative of future results. The signals generated by this indicator are for educational and informational purposes only. You are solely responsible for any trading decisions you make. Use this indicator at your own risk.

Slingshot System By Dusty InvestmentsSlingshot System by Dusty Investments
What it is
A trend-following pullback system designed to time entries inside an established trend using a two-EMA “cloud” plus a Stochastic-RSI K oscillator.
It's the improved version of this script:
It plots:
An EMA cloud (trend and pullback filter)
Long/Short setup markers
“TAKE PROFIT” markers based on the oscillator
Core building blocks
Trend filter (EMA Cloud)
Fast EMA vs Slow EMA
Uptrend: Fast EMA > Slow EMA
Downtrend: Fast EMA < Slow EMA
The area between the two EMAs is filled (the “cloud”).
Cloud touch
The system requires price to touch/pierce the cloud with a small tolerance (configurable) to qualify a pullback.
Oscillator
K is a smoothed Stochastic of RSI (StochRSI K).
Oversold/Overbought levels default to 20/80, with a small tolerance kTol to avoid edge flicker.
Long logic (pullbacks within uptrend)
Purpose: Catch a second, “higher” dip during an uptrend.
Steps:
Candidate V1: While in uptrend, if K ≤ Oversold and price touches the EMA cloud, a V1 candidate is stored (the first dip).
Deal lock: When K later reaches ≥ Overbought in uptrend, the last V1 candidate is “locked in” as V1 for this cycle.
V2 search: After the lock, if another pullback appears (still in uptrend, K ≤ Oversold, price touching the cloud) and the low stays strictly above V1’s low, the script starts searching for the best V2 low (the lowest low of this second dip that remains above V1’s low).
Long signal: When K exits the oversold area, if a valid V2 was found above V1’s low, the indicator places a LONG label at that V2 low.
Take profit for Long: The “TAKE PROFIT” marker is shown when K crosses up through the Overbought level (≥ 80 by default).
Short logic (pullbacks within downtrend)
Purpose: Catch lower‑high pullbacks during a downtrend. The workflow is explicit and labeled:
D1 (first anchor): In downtrend, when price touches the cloud and K ≥ Overbought, mark D1 (the first high).
Valley: The first time K reaches ≤ Oversold after D1.
D2 (setup high): After the valley, the first bar that again touches the cloud with K ≥ Overbought and makes a strict Lower High vs D1 becomes D2. This opens a “window.”
Signal (live): From D2 until confirmation, the Signal marker follows the most recent swing high that forms on downtrend bars. It never tracks uptrend bars.
Confirmation: The first time K reaches ≤ Oversold after D2, the Signal is fixed at the last tracked high. From here the system waits for TP.
Take profit for Short: The “TAKE PROFIT” marker is shown when K crosses back above the Overbought level (≥ 80 by default).
Chaining (New D1): At TP, the prior D2 is promoted to “New D1,” allowing the next cycle to form if conditions repeat (D1 → Valley → D2).
What the labels mean
LONG: A validated long setup at the V2 low (second dip above the first dip’s low) within an uptrend.
SHORT: The live Short entry marker that moves to the latest downtrend swing high between D2 and confirmation; it gets fixed when K hits ≤ Oversold.
TAKE PROFIT: Suggestive exit markers tied to the K oscillator (Long TP when K crosses up 80; Short TP when K crosses up 80 after a Short confirmation).
Strict constraints baked in
No signals against the trend
Fast EMA / Slow EMA periods (trend and cloud)
RSI period for the StochRSI, Stochastic period, and K smoothing
Oversold/Overbought levels (defaults 20/80)
Cloud touch tolerance (percent)
kTol: tolerance around 20/80 thresholds for K
How to use it
Pick your market and use the 4H timeframe since you get the best results this way.
Trade with the trend:
Uptrend: Watch for LONG markers (V1 then V2 higher‑low behavior).
Downtrend: Watch the D1 → Valley → D2 sequence. The Signal marker appears after D2 and is fixed at confirmation; TP comes on K > 80.
Calibrate touchTolPct and kTol per symbol/timeframe to match how tightly you want to require cloud touches and K thresholds.
Risk management is up to you. The indicator outputs entries and TP suggestions; it does not set stops.
Notes
Signals confirm at bar close. During a Short window, the live Signal may move to newer downtrend highs; once confirmed, it becomes fixed.
The LONG side is symmetrical in spirit (pullback‑then‑higher‑low in uptrend), but naming uses V1/V2 instead of D1/D2.

XINIU Risk-Reward Ratio Helper Pro #1.0.0CN:
专业版描述(中文)
本指标是 TradingView 平台上的一款 实用型风险收益管理工具,专为解决交易者在 风险收益评估、资金管理和进出场决策 上的痛点而设计。
交易者常见痛点:
1. 缺乏盈亏比概念 —— 盲目开单,不清楚单笔交易的最大风险与潜在收益。
2. 人工计算低效 —— 依赖计算器手工测算,费时费力,还容易出错。
3. 错失入场时机 —— 在计算过程中往往错过市场的最佳买入/卖出机会。
核心功能:
1. 自动绘制盈亏比目标价 —— 输入止损价格与目标盈亏比,自动生成止盈价格与参考线。
2. 多组盈亏比配置 —— 支持最多 10 组自定义盈亏比,快速对比不同风险收益结构。
3. 一键切换模式 —— 提供「止损为基准」「止盈为基准」「盈亏比价为基准」三种模式,灵活适配不同策略思路。
4. 资金成本与仓位测算 —— 内置保证金与手续费计算公式,直观显示进场所需资金。
5. 可视化盈亏比结构 —— 止损价、止盈价与 1:1 平衡点清晰绘制,避免盲目下单。
6. 关键分歧点提示 —— 标记多空双方可能快速插针的位置,帮助挂单埋伏。
7. 灵活图表渲染 —— 价格线延展、颜色区分与标签标注,让盈亏比一目了然。
核心好处:
1. 科学化决策 —— 清晰掌握风险与收益,避免情绪化操作。
2. 提升执行效率 —— 摆脱手工计算,用最短时间捕捉入场机会。
3. 优化风险管理 —— 自动测算仓位与资金需求,在关键分歧位“以小博大”。
4. 策略灵活性 —— 多组盈亏比与模式切换,满足不同市场环境下的需求。
风险提示:
● 本指标仅提供 参考数据和计算辅助,不能保证交易盈利。
● 市场存在不可预测波动,投资有风险,入市需谨慎。
● 用户应根据自身风险承受能力、资金状况及交易策略独立判断,不得完全依赖指标信号操作。
● 本指标开发者不对因使用本指标而导致的任何损失承担责任。
借助本指标,交易者能在复杂多变的市场中,以更专业、更高效的方式管理风险与收益,同时明确自身风险责任。
EN:
Professional Version Description (English)
This indicator is a practical Risk-Reward Management Tool on the TradingView platform, specifically designed to address traders' pain points in risk-reward evaluation, capital management, and entry/exit decision-making.
Common trader pain points:
1. Lack of risk-reward awareness – Opening trades blindly without understanding the maximum risk or potential reward of each trade.
2. Inefficient manual calculations – Relying on calculators for manual computation, which is time-consuming, error-prone, and cumbersome.
3. Missed entry opportunities – During calculations, traders often miss the optimal buy/sell opportunities in the market.
Core Features:
1. Automatic risk-reward target plotting – Enter a stop-loss price and desired risk-reward ratio, and the indicator automatically calculates take-profit levels and reference lines.
2. Multiple risk-reward configurations – Supports up to 10 custom risk-reward ratios, allowing quick comparison of different risk-reward structures.
3. One-click mode switching – Provides three flexible modes: “Stop-loss as base”, “Take-profit as base”, and “Risk-reward price as base”, adapting to various trading strategies.
4. Capital and position size calculation – Built-in formulas for margin and fee calculation, clearly displaying the required funds for entry.
5. Visualized risk-reward structure – Clearly plots stop-loss, take-profit, and 1:1 balance levels to prevent blind trading.
6. Key divergence point alerts – Marks potential rapid spikes from both bulls and bears, aiding strategic order placement.
7. Flexible chart rendering – Extendable price lines, color coding, and labeled markers make the risk-reward structure instantly clear.
Key Benefits:
1. Data-driven decision-making – Understand risk and potential reward clearly, avoiding emotional trading.
2. Improved execution efficiency – Eliminate manual calculations and quickly capture optimal entry points.
3. Optimized risk management – Automatically calculate position size and capital needs, enabling “small risk, big reward” at key divergence points.
4. Strategy flexibility – Multiple risk-reward configurations and mode switching meet the demands of varying market conditions.
Risk Disclaimer:
● This indicator provides reference data and calculation assistance only and cannot guarantee trading profits.
● Markets are subject to unpredictable fluctuations; all investments carry risk, and trading should be approached with caution.
● Users should make independent judgments based on their own risk tolerance, capital situation, and trading strategy; the indicator should not be relied upon exclusively.
● The developers of this indicator are not responsible for any losses incurred from its use.
With this tool, traders can manage risk and reward more professionally and efficiently in complex and volatile markets while clearly understanding their own risk responsibilities.
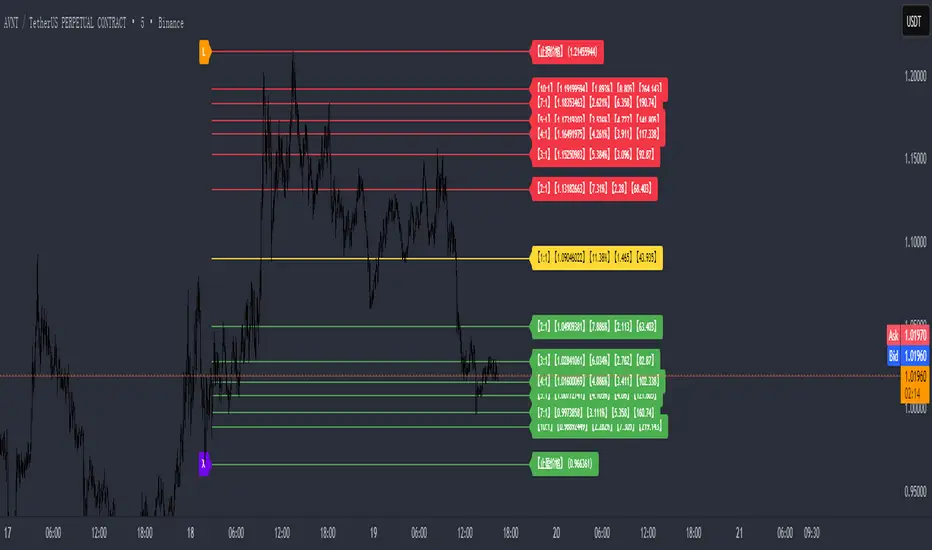
Altcoins Exit Planner [SwissAlgo]Altcoins Exit Planner
Navigating Altcoin Exits: A Strategic Approach: Planning your exits before emotions take over
------------------------------------------------------------------
✅ THE PSYCHOLOGY OF ALTCOIN TRADING
Many traders face recurring challenges when managing altcoin positions:
The Greed Trap : Holding through euphoric rallies, hoping for unrealistic targets, only to watch gains evaporate during market reversals.
The Paralysis Problem : Sitting on large unrealized profits but unsure which assets to exit, when, or how much — leading to inaction.
The FOMO Cycle : Rotating into trending coins too early or too late, often abandoning solid positions prematurely.
Analysis Overload : Consuming endless opinions and indicators without ever forming a clear, actionable exit strategy.
These patterns often stem from a lack of structure and planning . Emotional decision-making in volatile markets can be costly — especially with altcoins.
Developing a systematic framework can help define exit levels in advance , aiming to reduce emotional bias and improve decision clarity. The goal is to build disciplined exit strategies based on predefined logic rather than reactive impulses.
------------------------------------------------------------------
✅ FEATURES & FUNCTIONALITY
This indicator is designed to provide traders with a structured framework for exit planning. It aims to reduce decision-making under pressure by offering a visual roadmap on the chart.
The tool provides an analysis of key data points, including:
Structured Analysis : The indicator evaluates asset strength, identifies potential market phases, and derives potential exit levels from historical price behavior. This analysis may help traders assess whether an asset shows characteristics of strength (e.g., potential for extended targets) or weakness (e.g., early exit signals).
Actionable Information : It generates specific price levels and quantities for consideration as part of a predefined exit strategy.
Proactive Alerts : The system includes configurable alerts that can notify users as prices approach these key levels, allowing time for preparation. This feature is intended to support a shift from reactive trading toward systematic, criteria-based exit planning.
------------------------------------------------------------------
✅ HOW IT WORKS - AUTOMATED ANALYSIS & PLANNING
This indicator is designed to automate key aspects of exit planning that would otherwise require manual effort:
Fibonacci Level Calculation & Plotting : Automatically identifies key historical cycle points (e.g., bear market lows, bull market highs, recent pullbacks) and calculates relevant Fibonacci levels (both "Fib Retracments" from previous cycle ATH to bear market bottom, and "Fib. extensions" - considering major price impulses/waves in current bull market). This may help reduce manual drawing errors and streamline target identification.
Automated Calculation and Plotting of "Fib. Retracement "Levels
(from ATH of previous cycle to bottom in bear market)
Fibonacci retracement levels are a popular tool used in technical analysis to identify potential support and resistance levels in a market. After a significant price move, traders look for the price to "retrace" or pull back to one of several key Fibonacci ratios of the original move before continuing in its original direction. The most common retracement levels are 23.6%, 38.2%, 50%, 61.8%, and 78.6%. These levels are static horizontal lines on a chart, and their predictive power is based on the idea that they are "areas of interest" where a trend might pause or reverse.
Automated Calculation and Plotting of "Fib. Extension" Levels
(Price Impulses/Waves within current Bull Market)
Fibonacci extension levels are used to identify potential price targets or profit zones once a market has moved past its previous high or low. Unlike retracements, which measure a pullback, extensions project how far a trend might continue in the direction of its impulse move. They are typically used to anticipate where a wave or a rally might end and are based on ratios like 127.2%, 161.8%, 261.8%, and sometimes even higher. Extensions are a key tool for traders looking to set price targets for taking profits.
Coin Strength Assessment: Evaluates recovery performance relative to previous cycle peaks and classifies assets into four categories (Weak, Average, Strong, Outlier). Strength ratings may adjust dynamically based on momentum conditions — all derived from price data.
Market Phase Detection : Continuously monitors trend indicators, volume behavior, and altseason dynamics to estimate the current market phase. This may assist in contextualizing exit decisions without requiring manual phase analysis.
Exit Level Generation : Based on the asset’s strength classification and selected strategy (Conservative, Balanced, Aggressive), the system generates sequential exit levels with suggested percentages and quantities. Designed to support structured planning across three stages.
Signal Detection : Tracks multiple conditions — including price extensions, volume surges, momentum shifts, and cycle patterns — to generate alerts when predefined criteria are met.
Emergency Exit Detection : Scans for rare but high-risk scenarios (e.g., cycle top formations with multiple confluences) that may warrant immediate attention. Alerts are designed to highlight potential overextension during volatile phases.
Transfer Alerts : Calculates proximity to key exit zones and may issue early warnings to prepare for execution (e.g., moving assets from cold storage to exchanges), aiming to reduce last-minute decision pressure.
The script operates in two distinct modes:
Coin Analysis Mode Displays automatically-calculated Fibonacci levels, asset strength classification, market phase estimation, and contextual risk factors — designed to support structured analysis.
Exit Plan Mode Generates a customizable exit strategy with calculated price levels, suggested quantities, and potential outcome scenarios — aiming to assist with disciplined planning and reduce emotional bias.
------------------------------------------------------------------
✅ SETUP & INSTALLATION
Step 1: Chart Setup
Add the indicator to your altcoin USD chart (e.g., spot market pairs).
Recommended timeframe: 3 days for signal clarity.
Dark theme suggested for visual contrast.
Step 2: Configure Your Exit Strategy
Open Settings → “Setup Your Exit Plan”
Choose your strategy: Conservative: Prioritizes earlier exits for stricter risk control; Balanced: Combines early and late exits for a mixed approach; Aggressive: Targets later exits, accepting potentially higher volatility.
Input your asset quantity.
(Optional) Set a minimum sell price to block exit signals below your defined threshold.
(Optional) Set a sell-now price to trigger a sell alert when your exit target is reached, bypassing intermediate levels.
Step 3: Choose Display Mode
Coin Analysis Mode: View market conditions, strength classification, Fibonacci levels, and contextual risk insights. Designed to support monitoring and signal validation.
Exit Plan Mode: Displays your structured exit roadmap with suggested price levels, quantities, and visual chart overlays. Focuses on execution and planning.
Step 4: Set Up Alerts (Recommended)
Click the “Alert” button on the chart.
Select “Altcoins Exit Planner” as the condition.
Choose alert type: Planned Exit, Emergency Exit, Transfer Alert, Local Top, Trend Change
Set expiration to “Open-ended”
Configure your preferred notification method.
Alert Types Include:
Planned Exit Alerts: Triggered when suggested exit levels are reached (Exit #1, #2, #3).
Emergency Exit Alerts: Highlight potential cycle tops or full-exit conditions.
Transfer Alerts: Advance notice to prepare for execution (e.g., moving assets to exchanges).
Local Top Alerts: Short-term pullback signals for tactical decisions.
Trend Change Alerts: Indicate potential market phase transitions.
Once configured, the indicator begins analyzing and may notify you when exit conditions align with your selected strategy.
------------------------------------------------------------------
✅ USER INTERFACE
The interface is organized into two primary modes:
1) Coin Analysis Mode
Analysis Table Includes:
Fibonacci levels with price targets and percentage differentials
Market trend status (e.g., Strong Bull, Weakening Bull, Bear Market)
Volume behavior (Normal / Abnormal)
Price extension status (Overextended / Within range)
Altseason detection
Coin strength classification
Reversal risk assessment (Low / Average / High)
Suggested action based on current conditions
Visual Elements:
Bull/Bear trend EMA line
Volume-based candle coloring (overrides default chart candles)
Pivot points for key structural levels
Selectable Fibonacci extension/retracement lines
Background highlighting during altseason periods (potential cycle peak phase)
2) Exit Plan Mode
Exit Plan Table Displays:
Suggested quantity to sell at each exit level
Estimated portfolio value in USD
Structured exit plan with Fibonacci levels, percentages, quantities, and projected amounts
Average exit price calculation
Potential outcome scenarios if all exit levels are reached
Price Lines:
Individual exit level markers with contextual details
Average exit price reference line
Minimum sell price line (if enabled)
Sell-now price line (if enabled)
Signal Indicators:
Blue diamonds: Planned exit levels reached
Red triangles: Cycle top warnings
Orange triangles: Local top signals
These elements are designed to assist with visual interpretation and structured decision-making. All outputs are derived from price data and user-defined settings.
------------------------------------------------------------------
✅ LIMITATIONS
Market Cycle Dependency: This indicator is designed for cryptocurrency market cycles and will not perform similarly in other asset classes or market conditions. Its logic is based on historical crypto behavior, which may not repeat.
Assumption-Based Framework: The methodology relies on assumptions about market cycles, Fibonacci relationships, and altcoin behavior patterns. These assumptions may not hold under future conditions.
User Responsibility
All signals require user interpretation and decision-making.
The indicator provides information, not investment advice.
Signals should be validated with additional analysis.
Position sizing and risk management remain the user's responsibility.
Technical Requirements
Intended for use on the 3-day timeframe.
Designed for altcoin/USD trading pairs.
Requires sufficient historical data for Fibonacci calculations.
May not function properly on newly listed assets with limited price history.
Risk Management Guidelines. Recommended practices include:
Use with limited portions of your portfolio.
Combine with other technical and fundamental tools.
Consider broader market context beyond indicator signals.
Maintain independent stop-loss levels.
Review and adjust settings as market conditions evolve.
Signal Interpretation
Emergency signals highlight conditions that may warrant immediate review.
Planned exits support gradual, structured position reduction.
Transfer alerts provide preparation time before potential execution.
Local top signals may assist short-term tactical decisions.
------------------------------------------------------------------
✅ DISCLAIMER
This indicator is for educational and informational purposes only . It does not constitute financial, investment, or trading advice.
The indicator:
Makes no guarantees about future market performance.
Cannot predict market movements with certainty.
May generate false signals or miss key developments.
Relies on historical patterns that may not repeat.
Should not be used as the sole basis for trading decisions.
Users are responsible for:
Conducting independent research and analysis.
Understanding the risks of cryptocurrency trading.
Making their own investment/divestment decisions.
Managing position sizes and risk exposure appropriately.
Cryptocurrency trading involves substantial risk and may not be suitable for all investors. Past performance does not guarantee future results. Users should only invest what they can afford to lose and consult qualified professionals before making financial decisions.
The indicator’s assumptions may be invalidated by changing market conditions.
By using this tool, users acknowledge these limitations and accept full responsibility for their trading decisions.

TitanFlow Position CalculatorTitanFlow Position Calculator - Professional Risk Management Tool
Transform your trading with precision position sizing and advanced risk management
The TitanFlow Position Calculator is a comprehensive Pine Script indicator designed for serious traders who demand professional-grade risk management tools. Whether you're trading forex, commodities, indices, or crypto, this calculator ensures you never risk more than intended while maximizing your profit potential.
🎯 Key Features:
SMART POSITION SIZING
Automatic lot size calculation based on your risk parameters
Support for percentage risk, fixed amount, or losing streak buffer modes
Real-time position size updates as market conditions change
Double-up mode for aggressive trading strategies
MULTI-ASSET SUPPORT
Pre-configured settings for Forex Major/Minor pairs
Commodities: Gold, Silver, Oil with accurate pip values
Stock indices with proper contract specifications
Cryptocurrency trading support
Custom instrument configuration for any asset
ADVANCED RISK MANAGEMENT
Visual risk level categorization (Conservative, Moderate, Aggressive, Extreme)
Color-coded risk warnings with threshold alerts
Margin requirement calculations with leverage integration
Take profit level planning with lot distribution
PROFESSIONAL THEMES
TitanFlow Dark theme matching the professional trading platform
TitanFlow Light theme for bright chart environments
Classic dark/light themes for traditional traders
Full custom colour control for personalized setups
COMPREHENSIVE LEVERAGE SUPPORT
Complete leverage options from 1:1 to 1:500 including:
1:1, 1:10, 1:15, 1:20, 1:30, 1:50, 1:100, 1:200, 1:300, 1:400, 1:500
📊 What You'll See:
REAL-TIME CALCULATIONS
Position size in lots displayed prominently
Risk level percentage with color coding
Margin requirements in your account currency
Stop loss distance in pips
Take profit distribution across multiple levels
CLEAN INFORMATION TABLE
Account balance and currency display
Current risk amount being wagered
Calculated position size and margin needs
Risk categorization with visual indicators
Leverage ratio confirmation
SMART ALERTS
Extreme risk warnings (>5% per trade)
Large position alerts (>10 lots)
High margin usage notifications (>50% account)
Real-time risk assessment updates
🚀 Take Your Trading Further with TitanFlow
Want more than just position sizing?
Visit titanflow.co.uk to discover the complete TitanFlow trading ecosystem:
✅ Advanced Trading Dashboard - Comprehensive portfolio tracking and analytics
✅ Trade Journal Integration - Log and analyze every trade automatically
✅ AI-Powered Coaching - Get personalized trading insights and recommendations
✅ Monthly Performance Reports - Detailed analytics delivered to your inbox
✅ Risk Management Suite - Professional tools for serious traders
✅ Trading Calendar - Never miss important market events
✅ Community Access - Connect with successful traders worldwide
Special Offer: TradingView users get exclusive access to premium features. Transform your trading from guesswork to systematic success. coming soon
🎨 Customization Options:
Theme Selection
Choose from 5 professional themes
Customize every colour element
Match your chart aesthetic perfectly
Professional branding options
Display Controls
Position table in any corner
Show/hide alerts and warnings
Adjustable text sizes
Clean, distraction-free interface
💡 Perfect For:
Day Traders who need quick position sizing decisions
Swing Traders planning multi-level exits
Scalpers requiring precise risk control
Portfolio Managers overseeing multiple accounts
Risk Managers monitoring exposure levels
Trading Educators teaching proper risk management
🚀 How to Use:
Set Your Account - Enter balance and currency
Choose Risk Mode - Percentage (recommended 1-2%), fixed amount, or losing streak buffer
Configure Instrument - Select asset type or use custom settings
Set Stop Loss - Enter your stop distance in pips
Read Results - Get instant position size and risk analysis
⚠️ Risk Management Excellence:
This calculator embodies the core principle that successful trading is about risk management, not just profit hunting. By using proper position sizing, you'll:
Survive losing streaks with capital intact
Compound profits systematically
Sleep better knowing your risk is controlled
Build consistent trading habits
Protect your trading capital long-term
Ready to elevate your entire trading operation? Start with this position calculator, then visit titanflow.co.uk to unlock the full potential of systematic, professional trading.
This indicator is part of the TitanFlow trading ecosystem. titanflow.co.uk coming soon here you'll be able to obtain the complete professional trading platform.
Adaptive HMA Trendfilter & Profit SpikesShort Description
Adaptive trend-following filter using Hull Moving Average (HMA) slope.
Includes optional Keltner Channel entries/exits and dynamic spike-based take-profit markers (ATR/Z-Score).
Optional Fast HMA for early entry visualization (not included in logic).
USER GUIDE:
1) Quick Overview
Trend Filter: Slow HMA defines Bull / Bear / Sideways (via slope & direction).
Entries / Exits:
Entry: Color change of the slow HMA (red→green = Long, green→red = Short), optionally filtered by the Keltner basis.
Exit: Preferably via Keltner Band (Long: Close under Upper Band; Short: Close above Lower Band).
Fallback: exit on opposite HMA color change.
Take-Profit Spikes: Marks abnormal moves (ATR, Z-Score, or both) as discretionary TP signals.
Fast HMA (optional): Purely visual for early entry opportunities; not part of the core trading logic (see §5).
2) Adding & Basic Setup
Add the indicator to your chart.
Open Settings (gear icon) and configure:
HMA: Slow HMA Length = 55, Slope Lookback = 10, Slope Threshold = 0.20%.
Keltner: KC Length = 20, Multiplier = 1.5.
Spike-TP: Mode = ATR+Z, ATR Length = 14, Z Length = 20, Cooldown = 5.
Optionally: enable Fast HMA (e.g., length = 20).
3) Input Parameters – Key Controls
Slow HMA Length: Higher = smoother, fewer but cleaner signals.
Slope Lookback: How far back HMA slope is compared against.
Slope Threshold (%): Minimum slope to avoid “Sideways” regime.
KC Length / Multiplier: Width and reactivity of Keltner Channels.
Exits via KC Bands: Toggle on/off (recommended: on).
Entries only above/below KC Basis: Helps filter out chop.
Spike Mode: Choose ATR, Z, or ATR+Z (stricter, fewer signals).
Spikes only when in position: TP markers show only when you’re in a trade.
4) Entry & Exit Logic
Entries
Long: Slow HMA turns from red → green, and (if filter enabled) Close > KC Basis.
Short: Slow HMA turns from green → red, and (if filter enabled) Close < KC Basis.
Exits
KC Exit (recommended):
Long → crossunder(close, Upper KC) closes trade.
Short → crossover(close, Lower KC).
Fallback Exit: If KC Exits are off → exit on opposite HMA color change.
Spike-TP (Discretionary)
Marks unusually large deviations from HMA.
Use for partial profits or tightening stops.
⚠️ Not auto-traded — only marker/alert.
5) Early Entry Opportunities (Fast HMA Cross – visual only)
The script can optionally display a Fast HMA (e.g., 20) alongside the Slow HMA (e.g., 55).
Bullish early hint: Fast HMA crosses above Slow HMA, or stays above, before the Slow HMA officially turns green.
Bearish early hint: opposite.
⚠️ These signals are not part of the built-in logic — they are purely discretionary:
Advantage: Earlier entries, more profit potential.
Risk: Higher chance of whipsaws.
Practical workflow (early long entry):
Fast HMA crosses above Slow HMA AND Close > KC Basis.
Enter small position with tight stop (under KC Basis or HMA swing).
Once Slow HMA confirms green → add to position or trail stop tighter.
6) Recommended Presets
Crypto (1h/2h):
HMA: 55 / 10 / 0.20–0.30%
KC: 20 / 1.5–1.8
Spikes: ATR+Z, ATR=14, Z=20, Cooldown 5
FX (1h/4h):
HMA: 55 / 8–10 / 0.10–0.25%
KC: 20 / 1.2–1.5
Indices (15m/1h):
HMA: 50–60 / 8–12 / 0.15–0.30%
KC: 20 / 1.3–1.6
Fine-tuning:
Too noisy? → Raise slope threshold or increase HMA length.
Too sluggish? → Lower slope threshold or shorten HMA length.
7) Alerts – Best Practice
Long/Short Entry – get notified when trend color switches & KC filter is valid.
Long/Short Exit – for KC exits or fallback exits.
Long/Short Spike TP – for discretionary profit-taking.
Set via TradingView: Create Alert → Select this indicator → choose condition.
8) Common Pitfalls & Tips
Too many false signals?
Raise slope threshold (more “Sideways” filtering).
Enable KC filter for entries.
Entries too late?
Use Fast HMA cross for early discretionary entries.
Or lower slope threshold slightly.
Spikes too rare/frequent?
More frequent → ATR mode or lower ATR multiplier / Z-threshold.
Rarer but stronger → ATR+Z with higher thresholds.
9) Example Playbook (Long Trade)
Regime: Slow HMA still red, Fast HMA crosses upward (early hint).
Filter: Close > KC Basis.
Early Entry: Small size, stop below KC Basis or recent swing low.
Confirmation: Slow HMA turns green → scale up or trail stop.
Management: Partial profits at Spike-TP marker; full exit at KC upper band break.
[Top] Simple ATR TP/SLSimple TP/SL from ATR (Locked per Bar) - Advanced Position Management Tool
What This Indicator Does:
Automatically calculates and displays Take Profit (TP) and Stop Loss (SL) levels based on Average True Range (ATR)
Locks ATR values and direction signals at the start of each bar to prevent repainting and provide consistent levels
Offers multiple direction detection modes including real-time candle-based positioning for dynamic trading approaches
Displays entry, TP, and SL levels as clean horizontal lines that extend from the current bar
Original Features That Make This Script Unique:
Bar-Locked ATR System: ATR values are captured and frozen at bar open, ensuring levels remain stable throughout the bar's progression
Multi-Modal Direction Detection: Four distinct modes for determining TP/SL positioning - Trend Following (EMA-based), Bullish Only, Bearish Only, and real-time Candle Based
Real-Time Candle Flipping: In Candle Based mode, TP/SL levels flip immediately when the current candle changes from bullish to bearish or vice versa
Persistent Line Management: Uses efficient line object management to prevent ghost lines and maintain clean visual presentation
Flexible Base Price Selection: Choose between Open (static), Close (dynamic), or midpoint (H+L)/2 for entry level calculation
How The Algorithm Works:
ATR Calculation: Captures ATR value at each bar open using specified length parameter, maintaining consistency throughout the bar
Direction Determination: Uses different methods based on selected mode - EMA crossover for trend following, or real-time candle color for dynamic positioning
Level Calculation: TP level = Base Price + (Direction × TP Multiplier × ATR), SL level = Base Price - (Direction × SL Multiplier × ATR)
Visual Management: Creates persistent line objects once, then updates their positions every bar for optimal performance
Direction Modes Explained:
Trend Following: Uses 5-period and 12-period EMA relationship to determine trend direction (locked at bar open)
Bullish Only: Always places TP above and SL below entry (traditional long setup)
Bearish Only: Always places TP below and SL above entry (traditional short setup)
Candle Based: Dynamically adjusts based on current candle direction - flips in real-time as candle develops
Key Input Parameters:
ATR Length: Period for ATR calculation (default 14) - longer periods provide smoother volatility measurement
TP Multiplier: Take profit distance as multiple of ATR (default 1.0) - higher values target larger profits
SL Multiplier: Stop loss distance as multiple of ATR (default 1.0) - higher values allow more room for price movement
Base Price: Reference point for level calculations - Open for static entry, Close for dynamic tracking
Direction Mode: Method for determining whether TP goes above or below entry level
How To Use This Indicator:
For Position Sizing: Use the displayed SL distance to calculate appropriate position size based on your risk tolerance
For Entry Timing: Wait for price to approach the entry level before taking positions
For Risk Management: Set your actual stop loss orders at or near the displayed SL level
For Profit Taking: Use the TP level as initial profit target, consider scaling out at this level
Mode Selection: Choose Candle Based for scalping and quick reversals, Trend Following for swing trading
Visual Style Customization:
Line Colors: Customize TP line color (default teal) and SL line color (default orange) for easy identification
Line Widths: Adjust TP/SL line thickness (1-5) and entry line thickness (1-3) for visibility preferences
Clean Display: Lines extend 3 bars forward from current bar and update position dynamically
Best Practices:
Use on clean charts without multiple overlapping indicators for clearest visual interpretation
Combine with volume analysis and key support/resistance levels for enhanced decision making
Adjust ATR length based on your trading timeframe - shorter for scalping, longer for position trading
Test different TP/SL multipliers based on the volatility characteristics of your chosen instruments
Consider using Trend Following mode during strong trending periods and Candle Based during ranging markets

Smart Money Trades Pro [BOSWaves]Smart Money Trades Pro – Advanced Market Structure & Liquidity Visualizer
Overview
Smart Money Trades Pro is a comprehensive trading tool designed for traders seeking an in-depth understanding of market structure, liquidity dynamics, and institutional flow. The indicator systematically identifies key market turning points, including break of structure (BOS) and change of character (CHoCH) events, and overlays these with adaptive visualizations to highlight high-probability trade setups. By integrating ATR-based risk zones, progressive take-profit levels, and real-time trade analytics, Smart Money Trades Pro transforms complex price action into an interpretable framework suitable for multiple trading styles, including scalping, intraday, and swing trading.
Unlike traditional static indicators, Smart Money Trades Pro adapts continuously to market conditions. It evaluates swing highs and lows over a configurable lookback period, then determines structural breaks using customizable confirmation methods (candle body or wick). The resulting signals are augmented with dynamic entry, stop-loss, and target levels, allowing traders to analyze potential trade opportunities with both precision and context. The indicator’s design ensures that each visual element—trend-colored candles, signal markers, and risk/reward boxes—reflects real-time market conditions, offering an actionable interpretation of institutional activity.
How It Works
The indicator’s foundation is built upon market structure analysis. By calculating pivot highs and lows over a specified period, Smart Money Trades Pro identifies potential points of liquidity accumulation and exhaustion. When price breaks a pivot high or low, the indicator evaluates whether this constitutes a BOS or a CHoCH, signaling trend continuation or reversal. These events are marked on the chart with distinct visual cues, allowing traders to quickly discern shifts in market sentiment without manually analyzing historical price action.
Once a structural break is confirmed, the indicator automatically determines entry levels, stop-loss placements, and progressive take-profit zones (TP1, TP2, TP3). These calculations are based on ATR-derived volatility, ensuring that targets scale with current market conditions. Risk and reward zones are plotted as shaded boxes, providing a clear visual representation of potential profit relative to risk for each trade setup. This system allows traders to maintain discipline and consistency, with dynamic trade management baked directly into the visualization.
Trend direction is further reinforced by color-coded candles, which reflect the prevailing market bias. Bullish trends are represented by one color, bearish trends by another, and neutral conditions are displayed in muted tones. This continuous visual feedback simplifies the process of trend assessment and helps confirm the validity of trade setups alongside BOS and CHoCH markers.
Signals and Breakouts
Smart Money Trades Pro includes structured visual signals to indicate actionable price movements:
Bullish Break Signals – Triangular markers below the candle appear when a swing high is broken, suggesting potential long opportunities.
Bearish Break Signals – Triangular markers above the candle appear when a swing low is broken, indicating potential short setups.
Change of Character (CHoCH) – Special markers highlight trend reversals, showing where momentum shifts from bullish to bearish or vice versa.
These markers are strategically spaced to prevent overlap and remain clear during high-volatility periods. Traders can use them in combination with trend-colored candles, risk/reward zones, and ATR-based targets to assess the strength and reliability of each setup. The integrated table provides live trade information, including entry price, stop-loss level, take-profit levels, risk/reward ratio, and trade direction, ensuring that trade decisions are informed and data-driven.
Interpretation
Trend Analysis : The indicator’s trend coloring, combined with BOS and CHoCH detection, provides an immediate view of market direction. Rising structures indicate bullish momentum, while falling structures signal bearish momentum. CHoCH markers highlight potential trend reversals or significant liquidity sweeps.
Volatility and Risk Assessment : ATR-based calculations determine stop-loss distances and target levels, giving a quantitative measure of risk relative to market volatility. Wide ATR readings indicate periods of high price fluctuation, whereas narrow readings suggest consolidation and reduced risk exposure.
Market Structure Insights : By monitoring swing highs and lows alongside break confirmations, traders can identify where institutional players are likely active. Areas with multiple structural breaks or overlapping targets can indicate liquidity hotspots, potential reversal zones, or areas of market congestion.
Trade Management : The built-in trade zones allow traders to visualize entry, risk, and reward simultaneously. Progressive targets (TP1, TP2, TP3) reflect incremental profit-taking strategies, while dynamic stop-loss levels help preserve capital during adverse moves.
Strategy Integration
Smart Money Trades Pro supports a range of trading approaches:
Trend Following : Enter trades in the direction of confirmed BOS while using CHoCH markers and trend-colored candles to validate momentum.
Pullback Entries : Use failed breakout retests or minor reversals toward broken structure levels for lower-risk entries.
Mean Reversion : In consolidated zones with narrow ATR and repeated BOS/CHoCH activity, anticipate reversals or short-term corrective moves.
Multi-Timeframe Confirmation : Overlay signals on higher or lower timeframes to filter noise and improve trade accuracy.
Stop-loss levels should be placed just beyond the opposing structural point, while take-profit targets can be scaled using the ATR-based zones. Progressive targets allow for partial exits or scaling out of trades while maintaining exposure to larger moves.
Advanced Techniques
Traders seeking greater precision can combine Smart Money Trades Pro with volume, momentum, or volatility indicators to validate signals. Observing sequences of BOS and CHoCH markers across multiple timeframes provides insight into liquidity accumulation and depletion trends. Tracking the expansion or contraction of ATR-based zones helps anticipate shifts in volatility, enabling better timing for entries and exits.
Customizing the structure period and confirmation type allows the indicator to adapt to different asset classes and timeframes. Shorter periods increase sensitivity to smaller swings, while longer periods filter noise and emphasize higher-probability structural breaks. By integrating these features, the indicator offers a robust statistical framework for disciplined, data-driven trading decisions.
Inputs and Customization
Structure Detection Period : Defines the lookback window for pivot high and low calculation.
Break Confirmation : Choose whether to confirm breaks using candle body or wick.
Display CHoCH : Toggle visibility of change-of-character markers.
Color Trend Bars : Enable color-coding of candles based on market structure direction.
Show Info Table : Display trade dashboard showing entry, stop-loss, take-profits, risk/reward, and bias.
Table Position : Choose from top-left, top-right, bottom-left, or bottom-right placement.
Color Customization : Configure bullish, bearish, neutral, risk, reward, and text colors for enhanced visual clarity.
Why Use Smart Money Trades Pro
Smart Money Trades Pro transforms complex market behavior into an actionable visual framework. By combining market structure analysis, liquidity tracking, ATR-based risk/reward mapping, and a dynamic trade dashboard, it provides a multidimensional view of the market. Traders can focus on execution, interpret trends, and evaluate overextensions or reversals without relying on guesswork. The indicator is suitable for scalping, intraday, and swing strategies, offering a comprehensive system for understanding and trading alongside institutional participants.

Estrategia WT + Squeeze + MMAs v6 (Mejorada)USER GUIDE – WT + Squeeze + MMAs Strategy
1. Preparation
Activate your indicator on the chart of the asset you want to trade (stock, ETF, index, etc.).
Choose the time frame according to your style:
Intraday: 5m, 15m, 30m
Swing: 1h, 4h
Investment: Daily, Weekly
Always check two time frames:
A higher one for the overall trend.
A lower one for precise entry.
2. Initial Filter: Trend
Buy: Price above the 200 MMA.
Sell: Price below the 200 MMA.
❌ Do not trade signals that go against the main trend.
3. Confirm the Momentum
Buy: 10 MMA above the 55 MMA.
Sell: 10 MMA below the 55 MMA.
Both MAs must be aligned with the trend direction indicated by the 200 MMA.
4. Wait for System Confirmation
The script will mark:
📈 BUY (green):
Uptrend confirmed.
WT crosses upward.
Positive Squeeze Momentum (green values).
📉 SELL (red):
Downtrend confirmed.
WT crosses downward.
Negative Squeeze Momentum (red values).
💡 Golden Rule: Only enter if the trend, momentum, and script signals are aligned.
5. Trade Execution
Buy (BUY):
Enter at the open of the candle following the signal.
Stop Loss: Below the last relevant support or recent low.
Take Profit:
Minimum R/R 1:2
Or exit when a sell signal appears.
Sell (SELL):
Enter at the open of the candle following the signal.
Stop Loss: Above the last relevant resistance or recent high.
Take Profit: Same as in buys.
6. Risk Management
Risk no more than 1–2% of your capital in a single trade.
If trading stocks (spot market):
Only use BUY, holding as long as the 10 MMA does not cross below the 55 MMA.
If trading CFDs or on margin:
You can use BUY and SELL, applying a strict SL.
7. Filter Out False Signals
Avoid trading right before major news events (earnings reports, economic announcements).
If the signal appears in a very tight range, wait for a breakout.
On a higher time frame, check that the price is not touching strong resistance (for buys) or strong support (for sells).
Quick Example
On 4H → price is above the 200 MMA (uptrend).
On 15M → 10 MMA > 55 MMA, WT crosses bullish, and Squeeze turns green.
Script marks BUY.
Place a buy order, SL below last support, TP 1:2 or exit when the script marks SELL.
