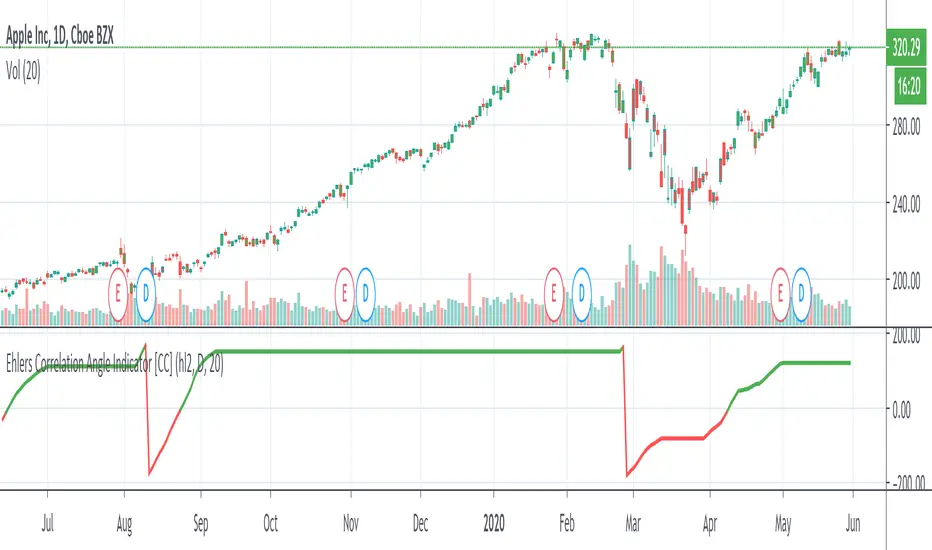
Ehlers Correlation Angle IndicatorThe Correlation Angle Indicator was created by John Ehlers (Stocks & Commodities V. 38:06 (8–15)) and this is technically three indicators in one so I'm splitting each one to a separate script. This particular indicator was designed for trend termination and simply buy when it is green and sell when it turns red.
Let me know if you would like to see me publish other scripts or if you want something custom done!
חפש סקריפטים עבור "technical"
Dual Purpose Pine Based CorrelationThis is my "Pine-based" correlation() function written in raw Pine Script. Other names applied to it are "Pearson Correlation", "Pearson's r", and one I can never remember being "Pearson Product-Moment Correlation Coefficient(PPMCC)". There is two basic ways to utilize this script. One is checking correlation with another asset such as the S&P 500 (provided as a default). The second is using it as a handy independent indicator correlated to time using Pine's bar_index variable. Also, this is in fact two separate correlation indicators with independent period adjustments, so I guess you could say this indicator has a dual purpose split personality. My intention was to take standard old correlation and apply a novel approach to it, and see what happens. Either way you use it, I hope you may find it most helpful enough to add to your daily TV tool belt.
You will notice I used the Pine built-in correlation() in combination with my custom function, so it shows they are precisely equal, even when the first two correlation() parameters are reversed on purpose or by accident. Additionally, there's an interesting technique to provide a visually appealing line with two overlapping plot()s combined together. I'm sure many members may find that plotting tactic useful when a bird's nest of plotting is occurring on the overlay pane in some scenarios. One more thing about correlation is it's always confined to +/-1.0 irregardless of time intervals or the asset(s) it is applied to, making it a unique oscillator.
As always, I have included advanced Pine programming techniques that conform to proper "Pine Etiquette". For those of you who are newcomers to Pine Script, this code release may also help you comprehend the "Power of Pine" by employing advanced programming techniques in Pine exhibiting code utilization in a most effective manner. One of the many tricks I applied here was providing floating point number safeties for _correlation(). While it cannot effectively use a floating point number, it won't error out in the event this should occur especially when applying "dominant cycle periods" to it, IF you might attempt this.
NOTICE: You may have observed there is a sqrt() custom function and you may be thinking... "Did he just sick and twistedly overwrite the Pine built-in sqrt() function?" The answer is... YES, I am and yes I did! One thing I noticed, is that it does provide slightly higher accuracy precision decimal places compared to the Pine built-in sqrt(). Be forewarned, "MY" sqrt() is technically speaking slower than snail snot compared to the native Pine sqrt(), so I wouldn't advise actually using it religiously in other scripts as a daily habit. It is seemingly doing quite well in combination with these simple calculations without being "sluggish". Lastly, of course you may always just delete the custom sqrt() function, via Pine Editor, and then the script will still operate flawlessly, yet more efficiently.
Features List Includes:
Dark Background - Easily disabled in indicator Settings->Style for "Light" charts or with Pine commenting
AND much, much more... You have the source!
The comments section below is solely just for commenting and other remarks, ideas, compliments, etc... regarding only this indicator, not others. When available time provides itself, I will consider your inquiries, thoughts, and concepts presented below in the comments section, should you have any questions or comments regarding this indicator. When my indicators achieve more prevalent use by TV members, I may implement more ideas when they present themselves as worthy additions. As always, "Like" it if you simply just like it with a proper thumbs up, and also return to my scripts list occasionally for additional postings. Have a profitable future everyone!

Combo Backtest 123 Reversal & Donchian Channel Width This is combo strategies for get a cumulative signal.
First strategy
This System was created from the Book "How I Tripled My Money In The
Futures Market" by Ulf Jensen, Page 183. This is reverse type of strategies.
The strategy buys at market, if close price is higher than the previous close
during 2 days and the meaning of 9-days Stochastic Slow Oscillator is lower than 50.
The strategy sells at market, if close price is lower than the previous close price
during 2 days and the meaning of 9-days Stochastic Fast Oscillator is higher than 50.
Second strategy
The Donchian Channel was developed by Richard Donchian and it could be compared
to the Bollinger Bands. When it comes to volatility analysis, the Donchian Channel
Width was created in the same way as the Bollinger Bandwidth technical indicator was.
As was mentioned above the Donchian Channel Width is used in technical analysis to measure
volatility. Volatility is one of the most important parameters in technical analysis.
A price trend is not just about a price change. It is also about volume traded during this
price change and volatility of a this price change. When a technical analyst focuses his/her
attention solely on price analysis by ignoring volume and volatility, he/she only sees a part
of a complete picture only. This could lead to a situation when a trader may miss something and
lose money. Lets take a look at a simple example how volatility may help a trader:
Most of the price based technical indicators are lagging indicators.
When price moves on low volatility, it takes time for a price trend to change its direction and
it could be ok to have some lag in an indicator.
When price moves on high volatility, a price trend changes its direction faster and stronger.
An indicator's lag acceptable under low volatility could be financially suicidal now - Buy/Sell signals could be generated when it is already too late.
Another use of volatility - very popular one - it is to adapt a stop loss strategy to it:
Smaller stop-loss recommended in low volatility periods. If it is not done, a stop-loss could
be generated when it is too late.
Bigger stop-loss recommended in high volatility periods. If it is not done, a stop-loss could
be triggered too often and you may miss good trades.
WARNING:
- For purpose educate only
- This script to change bars colors.

Combo Strategy 123 Reversal & Donchian Channel WidthThis is combo strategies for get a cumulative signal.
First strategy
This System was created from the Book "How I Tripled My Money In The
Futures Market" by Ulf Jensen, Page 183. This is reverse type of strategies.
The strategy buys at market, if close price is higher than the previous close
during 2 days and the meaning of 9-days Stochastic Slow Oscillator is lower than 50.
The strategy sells at market, if close price is lower than the previous close price
during 2 days and the meaning of 9-days Stochastic Fast Oscillator is higher than 50.
Second strategy
The Donchian Channel was developed by Richard Donchian and it could be compared
to the Bollinger Bands. When it comes to volatility analysis, the Donchian Channel
Width was created in the same way as the Bollinger Bandwidth technical indicator was.
As was mentioned above the Donchian Channel Width is used in technical analysis to measure
volatility. Volatility is one of the most important parameters in technical analysis.
A price trend is not just about a price change. It is also about volume traded during this
price change and volatility of a this price change. When a technical analyst focuses his/her
attention solely on price analysis by ignoring volume and volatility, he/she only sees a part
of a complete picture only. This could lead to a situation when a trader may miss something and
lose money. Lets take a look at a simple example how volatility may help a trader:
Most of the price based technical indicators are lagging indicators.
When price moves on low volatility, it takes time for a price trend to change its direction and
it could be ok to have some lag in an indicator.
When price moves on high volatility, a price trend changes its direction faster and stronger.
An indicator's lag acceptable under low volatility could be financially suicidal now - Buy/Sell signals could be generated when it is already too late.
Another use of volatility - very popular one - it is to adapt a stop loss strategy to it:
Smaller stop-loss recommended in low volatility periods. If it is not done, a stop-loss could
be generated when it is too late.
Bigger stop-loss recommended in high volatility periods. If it is not done, a stop-loss could
be triggered too often and you may miss good trades.
WARNING:
- For purpose educate only
- This script to change bars colors.

Sequential Filter - An Original Filtering ApproachRemoving irregular variations in the closing price remain a major task in technical analysis, indicators used to this end mostly include moving averages and other kind of low-pass filters. Understanding what kind of variations we want to remove is important, irregular (noisy) variations have mostly a short term period, fully removing them can be complicated if the filter is not properly selected, for example we might want to fully remove variations with a period of 2 bars and lower, if we select an arithmetic moving average the filter output might still contain such variations because of the ripples in the frequency response passband, all it would take is a variation of high amplitude for that variation to be clearly visible.
Although all it would take for better filtering is a filter with better performance in the frequency domain (gaussian, Butterworth, Bessel...) we can design innovative approaches that does not rely on the model of classical moving averages, today a new technical indicator is proposed, the technical indicator fully remove variations lower than the selected period.
The Indicator Approach
In order for the indicator output to change the closing price need to produce length consecutive up's/down's, length control the variation threshold of the indicator, variations lower than length are fully removed. Lets see a visual example :
Here length = 3, the closing price need to make 3 consecutive up's/down's, when the sequence happen the indicator output is equal to src , here the closing price, else the indicator is equal to its precedent value, hence removing other variations. The value of 3 is the value by default, this is because i have seen in the past that the average smallest variations period where in general of 3 bars.
Because the indicator focus only on the variation sign, it totally ignore the amplitude of the movement, this provide an effective way to filter short term retracement in a fluctuation as show'n below :
The candle option of the indicator allow the indicator to only focus on the body color of a candle, thus ignoring potential gaps, below is an example with the candle option off :
If we activate the "candle" option we end up with :
Note that the candle option is based on the closing and opening price, if you use the indicator on another indicator output make sure to have the candle option off.
Length and Indicator Color
The closing price is infected by noise, and will rarely make a large sequence of consecutive up's/down's, the indicator can therefore be useful to detect consecutive sequence of length period, here 6 is selected on BTCUSD :
A consecutive up's/down's of period 6 can be considered a relatively rare event.
It is important to note that the color of the indicator used by default has nothing to do with the consecutive sequence detected, that is the indicator turning red doesn't necessarily mean that a consecutive down's sequence has occurred, but only that this sequence has occurred at a lower value than the precedent detected sequence. This is show'n below :
In order to make the indicator color based on the detected sequence check the "Color Based On Detected Sequence" option.
Conclusion
An original approach on filtering price variations has been proposed, i believe the indicator code is elegant as well as relatively efficient, and since high values of length can't really be used the indicator execution speed will remain relatively fast.
Thanks for reading !

Adaptive Price Zone Backtest The adaptive price zone (APZ) is a volatility-based technical indicator that helps investors
identify possible market turning points, which can be especially useful in a sideways-moving
market. It was created by technical analyst Lee Leibfarth in the article “Identify the
Turning Point: Trading With An Adaptive Price Zone,” which appeared in the September 2006 issue
of the journal Technical Analysis of Stocks and Commodities.
This indicator attempts to signal significant price movements by using a set of bands based on
short-term, double-smoothed exponential moving averages that lag only slightly behind price changes.
It can help short-term investors and day traders profit in volatile markets by signaling price
reversal points, which can indicate potentially lucrative times to buy or sell. The APZ can be
implemented as part of an automated trading system and can be applied to the charts of all tradeable assets.
WARNING:
- For purpose educate only
- This script to change bars colors.
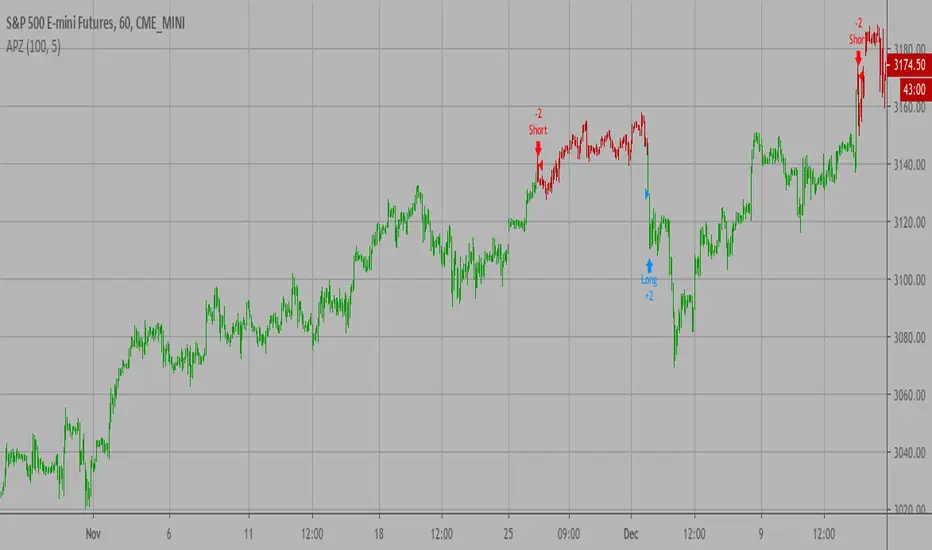
Adaptive Price Zone Strategy The adaptive price zone (APZ) is a volatility-based technical indicator that helps investors
identify possible market turning points, which can be especially useful in a sideways-moving
market. It was created by technical analyst Lee Leibfarth in the article “Identify the
Turning Point: Trading With An Adaptive Price Zone,” which appeared in the September 2006 issue
of the journal Technical Analysis of Stocks and Commodities.
This indicator attempts to signal significant price movements by using a set of bands based on
short-term, double-smoothed exponential moving averages that lag only slightly behind price changes.
It can help short-term investors and day traders profit in volatile markets by signaling price
reversal points, which can indicate potentially lucrative times to buy or sell. The APZ can be
implemented as part of an automated trading system and can be applied to the charts of all tradeable assets.
Green color is long.
Red color is short.
WARNING:
- For purpose educate only
- This script to change bars colors.

Adaptive Price Zone Indicator The adaptive price zone (APZ) is a volatility-based technical indicator that helps investors
identify possible market turning points, which can be especially useful in a sideways-moving
market. It was created by technical analyst Lee Leibfarth in the article “Identify the
Turning Point: Trading With An Adaptive Price Zone,” which appeared in the September 2006 issue
of the journal Technical Analysis of Stocks and Commodities.
This indicator attempts to signal significant price movements by using a set of bands based on
short-term, double-smoothed exponential moving averages that lag only slightly behind price changes.
It can help short-term investors and day traders profit in volatile markets by signaling price
reversal points, which can indicate potentially lucrative times to buy or sell. The APZ can be
implemented as part of an automated trading system and can be applied to the charts of all tradeable assets.

Price-Line Channel - A Friendly Support And Resistance IndicatorIntroduction
Lines are the most widely used figures in technical analysis, this is due to the linear trends that some securities posses (daily log SP500 for example), support and resistances are also responsible for the uses of lines, basically linear support and resistances are made with the assumption that the line connecting two local maximas or minimas will help the user detect a new local maxima or minima when the price will cross the line.
Technical indicators attempting to output lines have always been a concern in technical analysis, the mostly know certainly being the linear regression, however any linear models would fit in this category. In general those indicators always reevaluate their outputs values (repainting), others non repainting indicators returning lines are sometimes to impractical to set-up. This is what has encouraged me to make a simpler indicator based on the framework used in the recursive bands indicator that i published.
The proposed indicator aim to be extremely flexible and easy to use while returning linear support and resistances, an option that allow readjustment is also introduced, thus allowing for a "smarter" indicator.
The Indicator
The indicator return two extremities, the upper one aim to detect resistance points while the lower one aim to detect support points. The length setting control the steepness of the line, with higher values of length involving a lower slope, this make the indicator less reactive and interact with the price less often.
The name "price-line" comes from the fact that the channel is dependent on its own interaction with the price, therefore a breakout methodology can also be used, where price is up-trending when crossing with the upper extremity and down trending when crossing with the lower one.
Readjusted Option
The line steepness can be readjusted based on the market volatility, it make more sense for the line to be more steep when the market is more volatile, thus making it converge faster toward the price, this of course is done at the cost of some linearity. This is achieved by checking the "readjustment" option. The effects can be shown on BTCUSD, below the indicator without the readjusted option :
when the "readjustment" option is checked we have the following results :
The volatile down movement on BTCUSd make the upper extremity converge faster toward the price, this option can be great for volatile markets.
Conclusion
The recursive bands indicator prove to be an excellent framework that allow for the creation of lots of indicators, the proposed indicator is extremely efficient and provide an easy solution for returning linear support and resistances without much drawbacks, the readjusted option allow the indicator to adapt to the market volatility at the cost of linearity.
The performance of the indicator is relative to the motion of the price, however the indicator show signs of returning accurate support and resistances points. I hope the indicator find its use in the community.
Thanks for reading !
Note
Respect the house rules, always request permission before publishing open source code. This is an original work, requesting permission is the least you can do.

G-Channels - Efficient Calculation Of Upper/Lower ExtremitiesIntroduction
Channels indicators are widely used in technical analysis, they provide lot of information. In general, technical indicators giving upper/lower extremities are calculated by adding/subtracting a volatility component to a central tendency estimator. This is the case with Bollinger bands, using the rolling standard deviation as volatility estimator and the simple moving average as central tendency estimator, or the Keltner channels using the exponential moving average and the average true range.
Lots and lots and lots (i can go on) of those indicators have been made, they only really need a central tendency estimator, which can be obtained from pretty much any filter, however i find interesting to focus on the efficiency of those indicators, therefore i propose a super efficient channel indicator using recursion. The average resulting from the upper/lower extremity of the indicator provide a new efficient filter similar to the average highest/lowest.
The calculation - How Does It Works
Efficiency is often associated to recursion, this would allow us to use past output values as input, so how does the indicator is calculated? Lets look at the upper band calculation :
a := max(src,nz(a(1))) - nz(a(1) - b(1))/length
src is the closing price, a is upper extremity, b is the lower one. Here we only need 3 values, the previous values of a and b and the closing price. Basically a := max(src,nz(a(1))) mean :
if the closing price is greater than the precedent value of a then output the closing price, else output the precedent value of a
therefore a will never be inferior to its precedent value, this is useful for getting the maximum price value in our dataset however its not useful to make an upper band, therefore we subtract this to a correction factor defined as the difference between a and b , this force the upper band to have lower values thus acting like a band without loosing its "upper" property, a similar process is done with the lower band.
Of course we could only use 2 values for making the indicator, thus ending with :
a := max(src,nz(a(1))) - nz(abs(close - a(1))/length
In fact this implementation is the same as the one proposed in my paper "Recursive Bands - A New Indicator For Technical Analysis", its also what i used for making the indicator "Adaptive Trailing Stop", this would be more efficient but i used the difference between the upper and lower extremities for a reason.
The Central tendency Estimator
This is the reason why i didn't implemented a more efficient version. Basically this central tendency estimator is just the average between the upper and lower extremities, it behave like the average of the highest/lowest over length period, its central plot in the Donchian channel indicator. Below is a comparison of both with length = 100 :
But why is our average so "boxy"? The extremities are not boxy, so why the average is sometimes equal to its previous value? Explain!
Its super easy to understand, imagine two lines, if their absolute change is the same and they follow an opposite direction, then their average is constant.
the average of the green and red line is the orange line. If both lines follow the same direction then their average will also follow this direction.
When both extremities follow the same direction, the average will also do the same, when both follow an opposite direction then the average will be equal to its precedent value, this is also due to the fact that both extremities are based on the same correction factor (a-b) , else the average wouldn't act that way, now you understand why i made this choice.
Conclusion
I proposed an efficient implementation of a channel indicator that provide an interesting central tendency estimator. This simple implementation would allow for tons of interesting concepts, some of my indicators use a similar approach and allow for great outputs, you'll see them soon enough. I hope this indicator find its use in the community, remember to ask before using this indicator in a script you want to publish.
Thanks for reading !
If you want to discuss about anime stuff send me a pm but don't do it in the commend section.

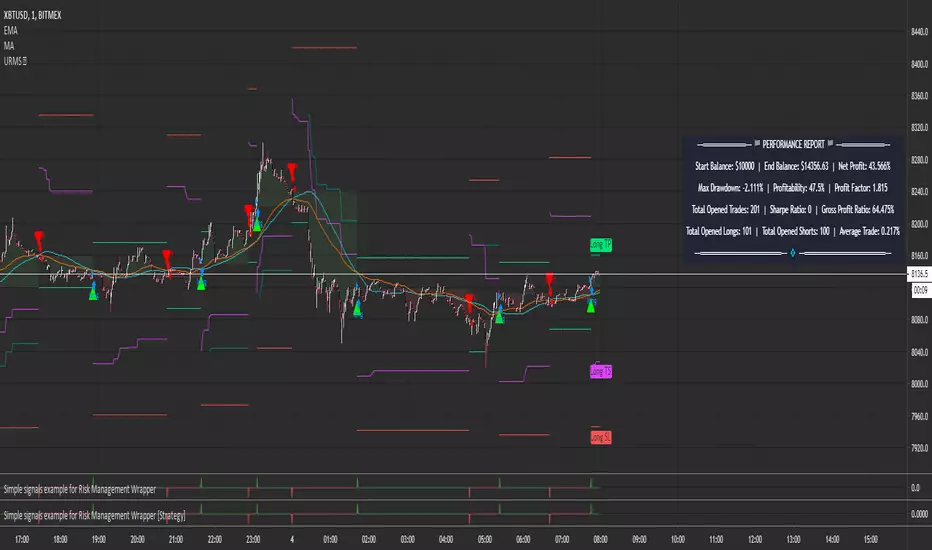
Simple signals example for Risk Management WrapperSimple signals example for Risk Management Wrapper
The unique part is that there is a single variable used for both Buy and Sell conditions.
Technically, a variable can have an infinity of values, so why not use that in our favour.
A value of -1 is used for the SELL alert condition , and a value of +1 is used for the BUY alert condition .
The Risk Management Wrapper can read them and act accordingly.
Any simple indicator on TradingView that gives Sell or Buy signals in a single variable should work.
More complex indicators that give multiple kinds of signals may not work due to TradingView limitations.
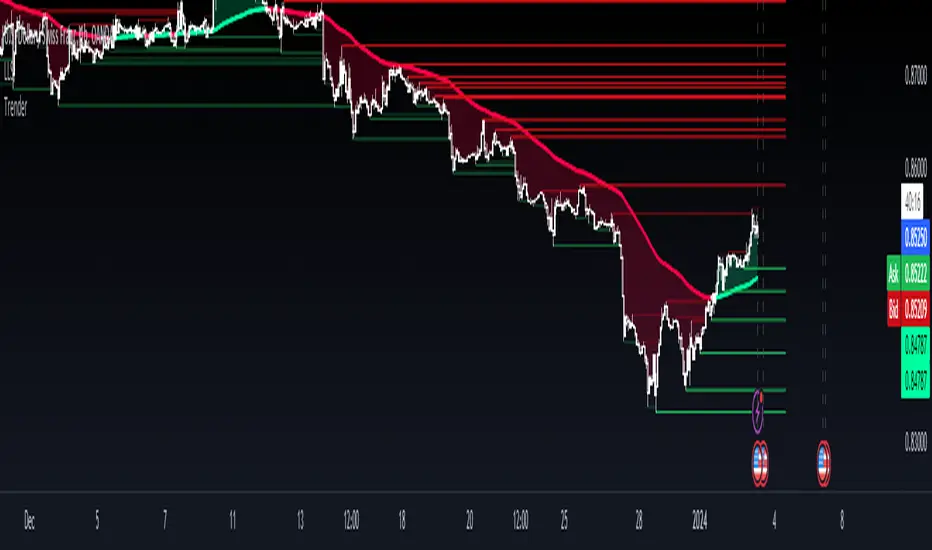
TrenderTrender is an indicator that compiles trend-following ideas in a complete friendly-custom indicator. Based on classic arithmetic moving averages, exponential moving averages, volume and a little bit of Fibonacci. Indicator built and usable in TradingView, focused only for easy visualization of the trend.
CBCI RSI ParallelParallel version of CBCI Cu + RSI w/ SMA and EMA. It's both indicators, but combined into one indicator space with an adjustable bidirectional offset for the spacing and location.
According to Constance Brown, both the CBCI and RSI are technically supposed to be used in tandem to easily spot divergences - this is an attempt to put that into practice, in one indicator, in the context of tradingview subscription limitations for non Pro/Premium users.

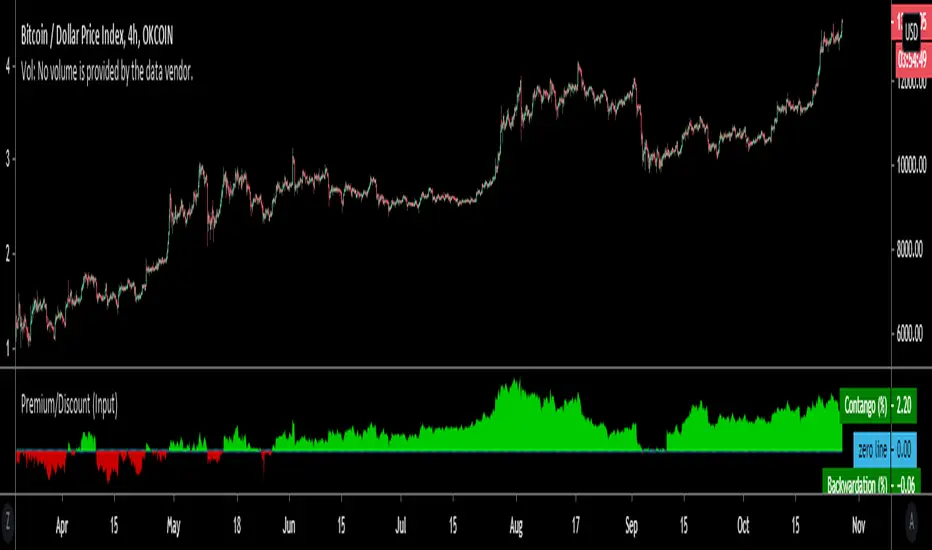
Premium/Discount (Input)Used to show Contango or Backwardation in futures contracts vs spot price. You can input your own tickers so can technically can be used to compare anything.
* In this example I'm showing Okex Quarterly contract vs Okex spot index price because it showcases it better.
* If you are using this after 2019 the default setting will not work because I set it to Bitmex which does not currently have a "current contract in front" ticker available.
It should be fairly self explanatory, but just ask below if you have any questions.
Rumpy's Multi Interval Extended VWAPsExperiment with various intervals of VWAPs and extending them 1 & 2 extra intervals. Uses base intervals from the standard 1 day to half yearly intervals (day/month/quarterly/half yearly).
VWAPs are calculated by the sum of typical price x volume divided by sum volume over the interval. With the 1 D (standard vwap ) the sums reset to zero at the end of the day.
The extensions instead of resetting to zero continues the calculation. Extending the interval an additional interval length.
Technically this means in the case of the standard VWAP that the 1st extension is actually the 2nd day of a 2 Day interval VWAP and the 2nd extension is the 3rd day of a 3 Day interval VWAP .
Same goes for the other intervals eg.
1 Month VWAP =>
1st extension : 2nd Month of a 2 Month interval VWAP
2nd extension : 3rd Month of a 3 Month interval VWAP
2nd extensions are disabled by default as there is usually often overlap, however there can be notable exceptions (such as the current 2nd Monthly extension on BTCUSD )
--------------------------------------
If you find it useful please consider a tip/donation :
BTC - 3BMEXEDyWJ58eXUEALYPadbn1wwWKmf6sA
--------------------------------------

Consensio Vision MA - Tribute to Late Dean Tyler JenksA wonderful mentor, fearless leader and incredibly humble man, father alike and world renowned bitcoin influencer also known for the invention of robust money management system named consensio moving averages, Tribute to Late Dean Tyler Jenks who made this possible.
Explanation
this indicator make use of three simple moving averages, idea is to incrementally invest little by little in the bull market when all moving average is moving up
A more in-depth guide for consensio is available here
How to use this indicator?
This indicator plots weekly moving average on daily and/or hourly time frame, the basic idea is to see how smaller time frame like daily and hourly trend reacts to larger time frame like weekly moving averages and what are the possible support and resistance area on these smaller time frame and also to arrive at better entry points while doing that.
The name Consensio Vision is chosen cuz.. it's a free reminder to never loose long-term vision (in this case weekly trend) of where you're going
Consensio Vision MA - Tribute to Late Dean Tyler Jenks
Lucid's Principles Of Investing - These are principles foretold by Late dean tyler jenks.. he goes on to saying that those 12 principles will keep you out of trouble or will identify trouble or will identify your human behavioral problems
1. CASH IS KING - in terms of my investing principles is very simple cash is king, I would rather be in cash than any other asset class, unless an asset class is trending to the upside (or bull market) the cash is king
2. Market doesn't move in straight line - all asset classes trimmed up and down, as tyler goes on to say he dont believe in buy and hold strategy, i'm giving you the tools to get you out of market so you dont have drive down bear events like 2009 crash, he further suggests you sould react (or make decision) before a 10% drop in market.
3. Timeframe - trends are short days or weeks intermediate weeks or months and long months or years so principle number three is don't just talk about something is in a trend be precise are you talking about a short-term trend an intermediate term trend or a long-term trend...
just saying something is in a trend is irresponsible, you've got to identify your time frame
4. Wait! Bear market is different - cash is king and unless asset class is trending up there are times that you want to take advantage of a trend that is down but it is not the equivalent of investing in a trend that is up it is far more dangerous far more difficult it can be done but that's not one of the main principles, (also check rule number 7 as both are related)
5. Only long-term trends are investments - word trading is not really an investment term trading means buying or selling it has nothing to do with what you're attempting to achieve in terms of either speculation gambling investing ... those are not opportunities for investing because they're short or they're intermediate.. that doesn't mean that you can't speculate and have that turn into a position trade and have it turn into a possible swing trade and then have it turn in to an investment however be prepared once you've made an investment where that investment in a short or an intermediate term time frame to move against you
6. Never invest in a FOMO (fear of missing out)- loss of money loss of cash loss of wealth is not equivalent to a loss of opportunity
it is 100 times more important than a loss of opportunity
7. understand the importance of Percentage - a 50% gain is not an inverse equivalence of a 50% loss that is the single most important rule or principle that Lucid uses in determining when to get into or out of an investment and it goes back to number six that a loss of money is not equivalent to a loss of opportunity
8. all long-term trends are fundamentally based, repeat all long-term trends are fundamentally based
9. number nine is a corollary but it's separate all short and intermediate term trends are not fundamentally based, long term trends are not affected by news are not affected by headlines are not affected by company announcements or country announcements they are affected in the short in the intermediate term and therefore your probability of success goes way up as your timeframe frame goes longer
10. Fundamental vs technical - technical tools are invaluable in identifying trends fundamental tools are not invaluable in identifying trends - that's why technical analysis is so important it gives you something that fundamental analysis will never give you in time so technical a pro active mechanism or money management tool and fundamental is a lagging indicator hoever its what drives the market in log term
11. Profitability based on time aka VISION- I see even very sophisticated investors doing is they let the technical tools give them a signal on the short-termer intermediate-term and they believe because it's the tool that they're using that it's giving them an equivalent probability of success and it is not!
it's probability of success at the short-term is less than at the intermediate term and is less than at the long-term
12. the last one long-term trends are more important than intermediate which are more important than short term, tyler developed a scale where he ranks
long-term trend 5,
intermediate term trend 3,
short-term with a 1
(note: if you add both 3 & 1 its still smaller then 5)
if you add together my intermediate term weighting of 3 and the short term weighting of 1 that you do not equal the long term weighting of 5 that means that both the short and the intermediate term can be going in a direction but that does not negate the direction of the long term trend it's a simple way of looking at it and I use the word in number 12 important not simply to mean importance in terms of the weighting system but the probability of success of each of those 3
so if you're using a short term 15 minute 30 minute one hour signals or probability of success drops dramatically and therefore you've got to factor in where your stops are relative to that probability when you're in a long term trend a five waiting you don't need to use stops when you're in an intermediate term trend you've got to use stops and when you're in a short term trend you've got to use closed stops
official website- lucidinvestmentstrategies.com

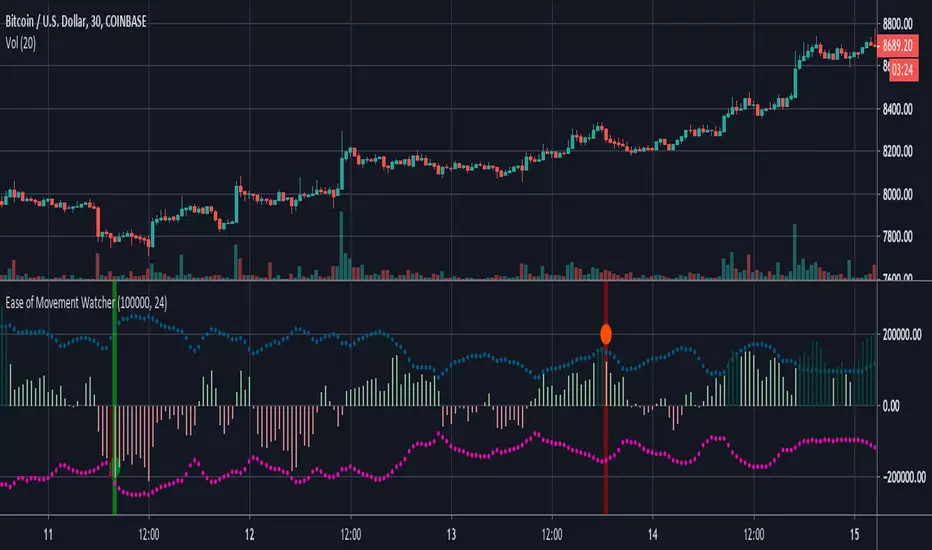
Ease of Movement WatcherHere’s a handy Ease of Movement(EMV) Indicator. I tried to include detailed comments so that anyone that’s learning pine can follow along.
The Ease of Movement Indicator is a volume based oscillator that is designed to measure the ease (or movability) of price movement for a security. The EMV is a centered oscillator, meaning that values can fluctuate above and below zero.
To understand how to use and interpret the EMV Indicator, its crucial to first understand its two main calculations :
Distance Moved = ((high + low) / 2) - ((high + low ) / 2)
-This is the difference between the current period’s midpoint and the previous period’s
midpoint.
Box Ratio = (volume / 100,000) / (high - low)
-When calculating the Box Ratio, it is common to divide the volume by 100,000 for a clearer visualization of the data. However, users can choose
to modify this value with the ‘volumeDiv’ input.
The Ease of Movement Value is then pretty simple to calculate:
EMV = (Distance Moved / Box Ratio)
The indicator then plots a SMA of the previous 24 EMV Values.
Looking at the formula, we know that combining low volume with a large {high, low} range will result in a relatively small box ratio value. Thus, we know that the EMV value for that period will be higher since EMV is found by dividing the Distance Moved by the Box Ratio.
Here’s a simple guide to interpreting the EMV:
- If (EMV > 0)
then price is increasing with relative ease.
-If (EMV < 0)
then price is decreasing with relative ease.
- If high-low range is large and volume is low
then ease of movement is high.
-If high-low range is small and volume is high
then ease of movement is low.
The Chart:
-The histogram represents the Simple Moving Average of EMV Values. The default length is 24, but users can adjust this value at the inputs menu(I've
found 24 works best).
-The teal and pink dotted lines represent the standard deviation of the SMA of EMV values multiplied by 2.5.
-The histogram turns dark green when the EMV SMA is greater than the top teal dotted standard deviations line.
-The histogram turns maroon when the EMV SMA falls below the bottom pink standard deviation line.
How To Use:
Enter a long position when the most recent EMV SMA value was below the lower pink stand. dev. line and the current EMV SMA value rises above that
same pink line. That means the previous bar was maroon and the current bar is not.
If the user enables the option to show entry points, a green dot will be plotted when it is time to enter a long position.
Exit the long position when the most recent EMV SMA value was above the upper green standard deviation line and the current EMV SMA value falls
below that same line. If this is true, then the previous bar will be dark green, and the current will be light green.
If the ‘showExits’ option is enabled, then a red dot will be plotted when it is time to exit the long position.
Input Options:
- 'volumeDiv' : Integer. Used in the calculation of Box Ratio.
- 'lenSMA' : Integer. The length of the Simple Moving Average of Ease of Movement Values.
- 'showStDev' : Bool. If true, dotted green and red lines will be shown at values equal to 2.5 * standard deviation of emvSMA and -2.5 * standard deviation of
emvSMA.
- 'showEntries' and 'showExits' : Bool. If true, a green circle will be plotted at long entry points and a red circle will be plotted at long exit points.
- 'changeBgColor': Bool. If true, the background color will change to green when it is time to enter a long position and red when it is time to exit.
Alerts:
- When it is time to enter a long position, an alert with the message "EMV Tracker - Enter Long" is sent.
- When it is time to exit a long position, an alert with the message "EMV Tracker - Exit Long" is sent.
NOTE:
- I usually use this indicator to confirm signals from other indicators rather than relying on it solely.
- Most accurate signals are generated on 30 minutes with the default input values I've set in the script.
Shoot me a message if you have any ideas for modifications or questions.
~ Happy Trading ~
Dominant Cycle Tuned RsiIntroduction
Adaptive technical indicators are importants in a non stationary market, the ability to adapt to a situation can boost the efficiency of your strategy. A lot of methods have been proposed to make technical indicators "smarters" , from the use of variable smoothing constant for exponential smoothing to artificial intelligence.
The dominant cycle tuned rsi depend on the dominant cycle period of the market, such method allow the rsi to return accurate peaks and valleys levels. This indicator is an estimation of the cycle finder tuned rsi proposed by Lars von Thienen published in Decoding the Hidden Market Rhythm/Fine-tuning technical indicators using the dominant market vibration/2010 using the cycle measurement method described by John F.Ehlers in Cybernetic Analysis for Stocks and Futures .
The following section is for information purpose only, it can be technical so you can skip directly to the The Indicator section.
Frequency Estimation and Maximum Entropy Spectral Analysis
“Looks like rain,” said Tom precipitously.
Tom would have been a great weather forecaster, but market patterns are more complex than weather ones. The ability to measure dominant cycles in a complex signal is hard, also a method able to estimate it really fast add even more challenge to the task. First lets talk about the term dominant cycle , signals can be decomposed in a sum of various sine waves of different frequencies and amplitudes, the dominant cycle is considered to be the frequency of the sine wave with the highest amplitude. In general the highest frequencies are those who form the trend (often called fundamentals) , so detrending is used to eliminate those frequencies in order to keep only mid/mid - highs ones.
A lot of methods have been introduced but not that many target market price, Lars von Thienen proposed a method relying on the following processing chain :
Lars von Thienen Method = Input -> Filtering and Detrending -> Discrete Fourier Transform of the result -> Selection using Bartels statistical test -> Output
Thienen said that his method is better than the one proposed by Elhers. The method from Elhers called MESA was originally developed to interpret seismographic information. This method in short involve the estimation of the phase using low amount of information which divided by 360 return the frequency. At first sight there are no relations with the Maximum entropy spectral estimation proposed by Burg J.P. (1967). Maximum Entropy Spectral Analysis. Proceedings of 37th Meeting, Society of Exploration Geophysics, Oklahoma City.
You may also notice that these methods are plotted in the time domain where more classic method such as : power spectrum, spectrogram or FFT are not. The method from Elhers is the one used to tune our rsi.
The Indicator
Our indicator use the dominant cycle frequency to calculate the period of the rsi thus producing an adaptive rsi . When our adaptive rsi cross under 70, price might start a downtrend, else when our adaptive rsi crossover 30, price might start an uptrend. The alpha parameter is a parameter set to be always lower than 1 and greater than 0. Lower values of alpha minimize the number of detected peaks/valleys while higher ones increase the number of those. 0.07 for alpha seems like a great parameter but it can sometimes need to be changed.
The adaptive indicator can also detect small top/bottoms of small periods
Of course the indicator is subject to failures
At the end it is totally dependent of the dominant cycle estimation, which is still a rough method subject to uncertainty.
Conclusion
Tuning your indicator is a great way to make it adapt to the market, but its also a complex way to do so and i'm not that convinced about the complexity/result ratio. The version using chart background will be published separately.
Feel free to tune your indicators with the estimator from elhers and see if it provide a great enhancement :)
Thanks for reading !
References
for the calculation of the dominant cycle estimator originally from www.davenewberg.com
Decoding the Hidden Market Rhythm (2010) Lars von Thienen
Ehlers , J. F. 2004 . Cybernetic Analysis for Stocks and Futures: Cutting-Edge DSP Technology to Improve Your Trading . Wiley

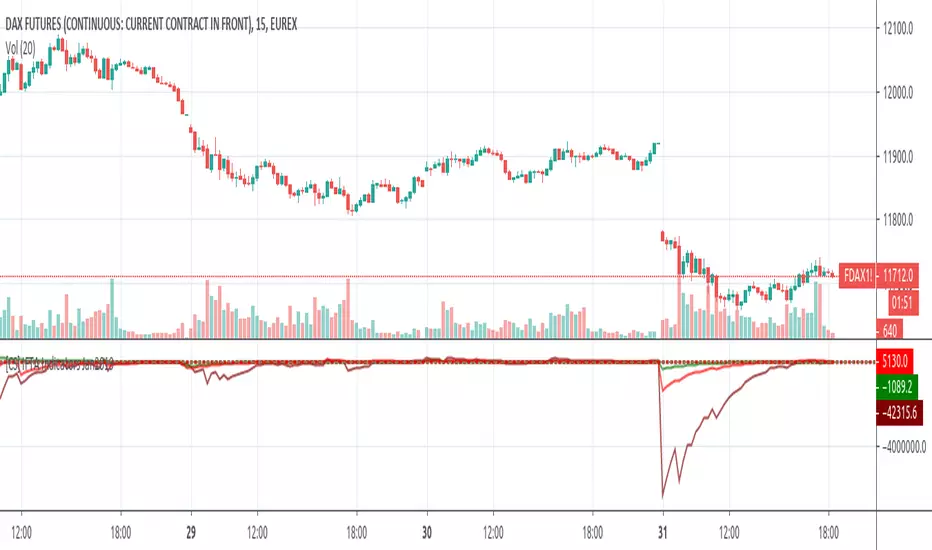
Linear Momentum and Performance IndicatorsThis a porting to Trading View of the 12 new indicators introduced in IFTA Journal (January Edition) by Akram El Sherbini, MFTA, CFTe, CETA.
Indicators are available in "Linear Momentum and Performance Indicators" at page four.
IFTA Journal is available below:
ifta.org
Indicators implemented herein:
Linear Force Index: The linear force index LFI measures the force of buyers and sellers during rallies and declines, respectively. It combines two important pieces of market information—the price acceleration
and volumes.
Pressure Index: The pressure index PRI measures the buying and selling pressure over a certain range within a time interval by moving around its zero line. The index indicates a rise in buying pressure when it crosses above the zero line and a rise in selling pressure
when it crosses below the zero line level. The buying and selling force moves the last price during the session to form a range with low and high boundaries.
Strength Index Index: The strength index SI is a leading indicator to the pressure index. It measures the ability of buyers to resist sellers and vice versa. SI of today is the ratio of the latest pressure index value to the strain of today.
Power Index: It measures the buying and selling power within a time interval by moving around its zero line.
Intensity Index: The intensity index II measures the buying and selling intensity within a time interval by moving around its zero line.
Dynamic Strength Index: The sole purpose of the dynamic strength index DSI and the integral dynamic strength index IDSI is to lead their intensity indicator peers.
Integral Force Index
Integral Pressure Index
Integral Strength Index
Integral Power Index
Integral Intensity Index
Integral Dynamic Strength Index
The following example shows a trade following the signal while several indicators are crossing the zero line:
Integral performance indicators have a fewer number of trades than the performance indicators. This result is normal, as the integral indicators are less sensitive than their peers. Moreover, the power, intensity, and dynamic strength are less sensitive than the force, pressure, and strength indicators. The same applies for their integrals. Therefore, the integrals of power, intensity, and dynamic strength indicators are more inclined to be medium-term indicators.
As the paper is suggesting "the linear momentum and the new performance indicators should make a significant change in categorizing several indicators in technical analysis."
Technical indicators are using biased mathematical implementations. For example Momentum Index is in reality a velocity indicator, Force index a Momentum indicator and so on. From a Physical perspective correct momentum, force, velocity etc. needs to be corrected and re-categorized.
The author also gives important insights in how these indicators can be used "simultaneously to identify price turning points and filter irrelevant divergences."
"This paper will attempt to adjust the price momentum and force concepts introduced by Welles Wilder and Alexander Elder, respectively. By introducing the concept of linear momentum, new indicators will emerge to dissect the market performance into six main elements: market’s force, pressure, strength, power, intensity, and dynamic strength. This will lead to a deeper insight about market action. The leading performance indicators can be used simultaneously to identify price turning points and filter irrelevant divergences. The linear momentum and the new performance indicators should make a significant change in categorizing several indicators in technical analysis."
Suggestions and feedbacks are welcome
Hope you enjoy this,
CryptoStatistical

Linear Momentum and Performance Indicators (IFTA Jan 2019)This a porting to Trading View of the 12 new indicators introduced in IFTA Journal (January Edition) by Akram El Sherbini, MFTA, CFTe, CETA.
Indicators are available in "Linear Momentum and Performance Indicators" at page four.
IFTA Journal is available below:
ifta.org
Indicators implemented herein:
Linear Force Index: The linear force index LFI measures the force of buyers and sellers during rallies and declines, respectively. It combines two important pieces of market information—the price acceleration
and volumes.
Pressure Index: The pressure index PRI measures the buying and selling pressure over a certain range within a time interval by moving around its zero line. The index indicates a rise in buying pressure when it crosses above the zero line and a rise in selling pressure
when it crosses below the zero line level. The buying and selling force moves the last price during the session to form a range with low and high boundaries.
Strength Index Index : The strength index SI is a leading indicator to the pressure index. It measures the ability of buyers to resist sellers and vice versa. SI of today is the ratio of the latest pressure index value to the strain of today.
Power Index : It measures the buying and selling power within a time interval by moving around its zero line.
Intensity Index : The intensity index II measures the buying and selling intensity within a time interval by moving around its zero line.
Dynamic Strength Index : The sole purpose of the dynamic strength index DSI and the integral dynamic strength index IDSI is to lead their intensity indicator peers.
Integral Force Index
Integral Pressure Index
Integral Strength Index
Integral Power Index
Integral Intensity Index
Integral Dynamic Strength Index
The following example shows a trade following the signal while several indicators are crossing the zero line:
Integral performance indicators have a fewer number of trades than the performance indicators. This result is normal, as the integral indicators are less sensitive than their peers. Moreover, the power, intensity, and dynamic strength are less sensitive than the force, pressure, and strength indicators. The same applies for their integrals. Therefore, the integrals of power, intensity, and dynamic strength indicators are more inclined to be medium-term indicators.
As the paper is suggesting "the linear momentum and the new performance indicators should make a significant change in categorizing several indicators in technical analysis."
Technical indicators are using biased mathematical implementations. For example Momentum Index is in reality a velocity indicator, Force index a Momentum indicator and so on. From a Physical perspective correct momentum, force, velocity etc. needs to be corrected and re-categorized.
The author also gives important insights in how these indicators can be used "simultaneously to identify price turning points and filter irrelevant divergences."
"This paper will attempt to adjust the price momentum and force concepts introduced by Welles Wilder and Alexander Elder, respectively. By introducing the concept of linear momentum, new indicators will emerge to dissect the market performance into six main elements: market’s force, pressure, strength, power, intensity, and dynamic strength. This will lead to a deeper insight about market action. The leading performance indicators can be used simultaneously to identify price turning points and filter irrelevant divergences. The linear momentum and the new performance indicators should make a significant change in categorizing several indicators in technical analysis."
Suggestions and feedback are welcome
Hope you enjoy this,
CryptoStatistical
Kawabunga Swing Failure Points Candles (SFP) by RRBKawabunga Swing Failure Points Candles (SFP) by RagingRocketBull 2019
Version 1.0
This indicator shows Swing Failure Points (SFP) and Swing Confirmation Points (SCP) as candles on a chart.
SFP/SCP candles are used by traders as signals for trend confirmation/possible reversal.
The signal is stronger on a higher volume/larger candle size.
A Swing Failure Point (SFP) candle is used to spot a reversal:
- up trend SFP is a failure to close above prev high after making a new higher high => implies reversal down
- down trend SFP is a failure to close below prev low after making a new lower low => implies reversal up
A Swing Confirmation Point (SCP) candle is just the opposite and is used to confirm the current trend:
- up trend SCP is a successful close above prev high after making a new higher high => confirms the trend and implies continuation up
- down trend SCP is a successful close below prev low after making a new lower low => confirms the trend and implies continuation down
Features:
- uses fractal pivots with optional filter
- show/hide SFP/SCP candles, pivots, zigzag, last min/max pivot bands
- dim lag zones/hide false signals introduced by lagging fractals or
- use unconfirmed pivots to eliminate fractal lag/false signals. 2 modes: fractals 1,1 and highest/lowest
- filter only SFP/SCP candles confirmed with volume/candle size
- SFP/SCP candles color highlighting, dim non-important bars
Usage:
- adjust fractal settings to get pivots that best match your data (lower values => more frequent pivots. 0,0 - each candle is a pivot)
- use one of the unconfirmed pivot modes to eliminate false signals or just ignore all signals in the gray lag zones
- optionally filter only SFP/SCP candles with large volume/candle size (volume % change relative to prev bar, abs candle body size value)
- up/down trend SCP (lime/fuchsia) => continuation up/down; up/down trend SFP (orange/aqua) => possible reversal down/up. lime/aqua => up; fuchsia/orange => down.
- when in doubt use show/hide pivots/unconfirmed pivots, min/max pivot bands to see which prev pivot and min/max value were used in comparisons to generate a signal on the following candle.
- disable offset to check on which bar the signal was generated
Notes:
Fractal Pivots:
- SFP/SCP candles depend on fractal pivots, you will get different signals with different pivot settings. Usually 4,4 or 2,2 settings are used to produce fractal pivots, but you can try custom values that fit your data best.
- fractal pivots are a mixed series of highs and lows in no particular order. Pivots must be filtered to produce a proper zigzag where ideally a high is followed by a low and another high in orderly fashion.
Fractal Lag/False Signals:
- only past fractal pivots can be processed on the current bar introducing a lag, therefore, pivots and min/max pivot bands are shown with offset=-rightBars to match their target bars. For unconfirmed pivots an offset=-1 is used with a lag of just 1 bar.
- new pivot is not a confirmed fractal and "does not exist yet" while the distance between it and the current bar is < rightBars => prev old fractal pivot in the same dir is used for comparisons => gives a false signal for that dir
- to show false signals enable lag zones. SFP/SCP candles in lag zones are false. New pivots will be eventually confirmed, but meanwhile you get a false signal because prev pivot in the same dir was used instead.
- to solve this problem you can either temporary hide false signals or completely eliminate them by using unconfirmed pivots of a smaller degree/lag.
- hiding false signals only works for history and should be used only temporary (left disabled). In realtime/replay mode it disables all signals altogether due to TradingView's bug (barcolor doesn't support negative offsets)
Unconfirmed Pivots:
- you have 2 methods to check for unconfirmed pivots: highest/lowest(rightBars) or fractals(1,1) with a min possible step. The first is essentially fractals(0,0) where each candle is a pivot. Both produce more frequent pivots (weaker signals).
- an unconfirmed pivot is used in comparisons to generate a valid signal only when it is a higher high (> max high) or a lower low (< min low) in the dir of a trend. Confirmed pivots of a higher degree are not affected. Zigzag is not affected.
- you can also manually disable the offset to check on which bar the pivot was confirmed. If the pivot just before an SCP/SFP suddenly jumps ahead of it - prev pivot was used, generating a false signal.
- last max high/min low bands can be used to check which value was used in candle comparison to generate a signal: min(pivot min_low, upivot min_low) and max(pivot max_high, upivot max_high) are used
- in the unconfirmed pivots mode the max high/min low pivot bands partially break because you can't have a variable offset to match the random pos of an unconfirmed pivot (anywhere in 0..rightBars from the current bar) to its target bar.
- in the unconfirmed pivots mode h (green) and l (red) pivots become H and L, and h (lime) and l (fuchsia) are used to show unconfirmed pivots of a smaller degree. Some of them will be confirmed later as H and L pivots of a higher degree.
Pivot Filter:
- pivot filter is used to produce a better looking zigzag. Essentially it keeps only higher highs/lower lows in the trend direction until it changes, skipping:
- after a new high: all subsequent lower highs until a new low
- after a new low: all subsequent higher lows until a new high
- you can't filter out all prev highs/lows to keep just the last min/max pivots of the current swing because they were already confirmed as pivots and you can't delete/change history
- alternatively you could just pick the first high following a low and the first low following a high in a sequence and ignore the rest of the pivots in the same dir, producing a crude looking zigzag where obvious max high/min lows are ignored.
- pivot filter affects SCP/SFP signals because it skips some pivots
- pivot filter is not applied to/not affected by the unconfirmed pivots
- zigzag is affected by pivot filter, but not by the unconfirmed pivots. You can't have both high/low on the same bar in a zigzag. High has priority over Low.
- keep same bar pivots option lets you choose which pivots to keep when there are both high/low pivots on the same bar (both kept by default)
SCP/SFP Filters:
- you can confirm/filter only SCP/SFP signals with volume % change/candle size larger than delta. Higher volume/larger candle means stronger signal.
- technically SCP/SFP is always the first matching candle, but it can be invalidated by the following signal in the opposite dir which in turn can be negated by the next signal.
- show first matching SCP/SFP = true - shows only the first signal candle (and any invalidations that follow) and hides further duplicate signals in the same dir, does not highlight the trend.
- show first matching SCP/SFP = false - produces a sequence of candles with duplicate signals, highlights the whole trend until its dir changes (new pivot).
Good Luck! Feel free to learn from/reuse the code to build your own indicators!

[ALERTS] ADX and DIThe average directional index (ADX) is a technical analysis metric. Analysts use it to determine the relative strength of a trend, with the direction of the trend either upwards or downwards.
The Average Directional Index (ADX) along with the Negative Directional Indicator (-DI) and the Positive Directional Indicator (+DI) are momentum strength indicators that evolved for use in stock trading. Commodities trader J. Welles Wilder pioneered their use. Technical traders who use charting techniques want to know when first spotting a shifting trend how strong that trend is and how likely it is to sustain itself over time. The ADX helps investors determine trend strength as they plan their investment strategies.
Confirmation on a chart and other momentum indicators help investors spot trend reversals. But some trends are more potent than others and investors want to better understand the strength of a trend. The ADX identifies a strong positive trend when the ADX is over 25 and a weak trend when the ADX is below 20. Investors can determine directional movement by analyzing the difference between two consecutive low prices and their correlated highs. The movement is +DM when the current high price, less the previous high price, is greater than the previous low price less the current low. The opposite applies in determining the negative or –DI.
When analyzing charts, stock price is the single most important variable to follow. ADX and other indicators are supplementary to price movements in providing additional directional information and support. For example, some of the best trends come about from price range consolidation. It is those tugs of war between buying and selling volumes that lead to breakouts and other trading opportunities.
The Inventor of the Average Directional Index
J. Welles Wilder, Jr. is a former American engineer and real estate developer who went on to revolutionize trading analysis by applying mathematical systems to the world of investing. In addition to developing the ADX, Wilder is also responsible for several other commonly used technical analysis tools including the Average True Range (ATR), the Relative Strength Index (RSI) and the Parabolic SAR.
www.investopedia.com
This script has alerts and includes the filter for markets with no trend defined.
Green Alert --> Long
Red Alert --> Short
Yellow Area --> Weak trend. ADX below threshold
Green candles --> Bullish Market
Red Candles --> Bearish Market
Orange candles --> No defined trend
Enjoy!

