חפש סקריפטים עבור "text"


Price Action Concepts [RUDYINDICATOR]/// This work is licensed under a Attribution-NonCommercial-ShareAlike 4.0 International (CC BY-NC-SA 4.0) creativecommons.org
// © RUDYBANK INDICATOR - formerly know as RUDY INDICATOR
//@version=5
indicator("Price Action Concepts ", shorttitle = "RUDYINDICATOR-V1
- Price Action RUDYINDICATOR ", overlay = true, max_lines_count = 500, max_labels_count = 500, max_boxes_count = 500, max_bars_back = 500, max_polylines_count = 100)
//-----------------------------------------------------------------------------{
//Boolean set
//-----------------------------------------------------------------------------{
s_BOS = 0
s_CHoCH = 1
i_BOS = 2
i_CHoCH = 3
i_pp_CHoCH = 4
green_candle = 5
red_candle = 6
s_CHoCHP = 7
i_CHoCHP = 8
boolean =
array.from(
false
, false
, false
, false
, false
, false
, false
, false
, false
)
//-----------------------------------------------------------------------------{
// User inputs
//-----------------------------------------------------------------------------{
show_swing_ms = input.string ("All" , "Swing        " , inline = "1", group = "MARKET STRUCTURE" , options = )
show_internal_ms = input.string ("All" , "Internal     " , inline = "2", group = "MARKET STRUCTURE" , options = )
internal_r_lookback = input.int (5 , "" , inline = "2", group = "MARKET STRUCTURE" , minval = 2)
swing_r_lookback = input.int (50 , "" , inline = "1", group = "MARKET STRUCTURE" , minval = 2)
ms_mode = input.string ("Manual" , "Market Structure Mode" , inline = "a", group = "MARKET STRUCTURE" , tooltip = " Use selected lenght\n Use automatic lenght" ,options = )
show_mtf_str = input.bool (true , "MTF Scanner" , inline = "9", group = "MARKET STRUCTURE" , tooltip = "Display Multi-Timeframe Market Structure Trend Directions. Green = Bullish. Red = Bearish")
show_eql = input.bool (false , "Show EQH/EQL" , inline = "6", group = "MARKET STRUCTURE")
plotcandle_bool = input.bool (false , "Plotcandle" , inline = "3", group = "MARKET STRUCTURE" , tooltip = "Displays a cleaner colored candlestick chart in place of the default candles. (requires hiding the current ticker candles)")
barcolor_bool = input.bool (false , "Bar Color" , inline = "4", group = "MARKET STRUCTURE" , tooltip = "Color the candle bodies according to market strucutre trend")
i_ms_up_BOS = input.color (#089981 , "" , inline = "2", group = "MARKET STRUCTURE")
i_ms_dn_BOS = input.color (#f23645 , "" , inline = "2", group = "MARKET STRUCTURE")
s_ms_up_BOS = input.color (#089981 , "" , inline = "1", group = "MARKET STRUCTURE")
s_ms_dn_BOS = input.color (#f23645 , "" , inline = "1", group = "MARKET STRUCTURE")
lvl_daily = input.bool (false , "Day   " , inline = "1", group = "HIGHS & LOWS MTF")
lvl_weekly = input.bool (false , "Week " , inline = "2", group = "HIGHS & LOWS MTF")
lvl_monthly = input.bool (false , "Month" , inline = "3", group = "HIGHS & LOWS MTF")
lvl_yearly = input.bool (false , "Year  " , inline = "4", group = "HIGHS & LOWS MTF")
css_d = input.color (color.blue , "" , inline = "1", group = "HIGHS & LOWS MTF")
css_w = input.color (color.blue , "" , inline = "2", group = "HIGHS & LOWS MTF")
css_m = input.color (color.blue , "" , inline = "3", group = "HIGHS & LOWS MTF")
css_y = input.color (color.blue , "" , inline = "4", group = "HIGHS & LOWS MTF")
s_d = input.string ('⎯⎯⎯' , '' , inline = '1', group = 'HIGHS & LOWS MTF' , options = )
s_w = input.string ('⎯⎯⎯' , '' , inline = '2', group = 'HIGHS & LOWS MTF' , options = )
s_m = input.string ('⎯⎯⎯' , '' , inline = '3', group = 'HIGHS & LOWS MTF' , options = )
s_y = input.string ('⎯⎯⎯' , '' , inline = '4', group = 'HIGHS & LOWS MTF' , options = )
ob_show = input.bool (true , "Show Last    " , inline = "1", group = "VOLUMETRIC ORDER BLOCKS" , tooltip = "Display volumetric order blocks on the chart \n\n Ammount of volumetric order blocks to show")
ob_num = input.int (5 , "" , inline = "1", group = "VOLUMETRIC ORDER BLOCKS" , tooltip = "Orderblocks number", minval = 1, maxval = 10)
ob_metrics_show = input.bool (true , "Internal Buy/Sell Activity" , inline = "2", group = "VOLUMETRIC ORDER BLOCKS" , tooltip = "Display volume metrics that have formed the orderblock")
css_metric_up = input.color (color.new(#089981, 50) , "         " , inline = "2", group = "VOLUMETRIC ORDER BLOCKS")
css_metric_dn = input.color (color.new(#f23645 , 50) , "" , inline = "2", group = "VOLUMETRIC ORDER BLOCKS")
ob_swings = input.bool (false , "Swing Order Blocks" , inline = "a", group = "VOLUMETRIC ORDER BLOCKS" , tooltip = "Display swing volumetric order blocks")
css_swing_up = input.color (color.new(color.gray , 90) , "                 " , inline = "a", group = "VOLUMETRIC ORDER BLOCKS")
css_swing_dn = input.color (color.new(color.silver, 90) , "" , inline = "a", group = "VOLUMETRIC ORDER BLOCKS")
ob_filter = input.string ("None" , "Filtering             " , inline = "d", group = "VOLUMETRIC ORDER BLOCKS" , tooltip = "Filter out volumetric order blocks by BOS/CHoCH/CHoCH+", options = )
ob_mitigation = input.string ("Absolute" , "Mitigation           " , inline = "4", group = "VOLUMETRIC ORDER BLOCKS" , tooltip = "Trigger to remove volumetric order blocks", options = )
ob_pos = input.string ("Precise" , "Positioning          " , inline = "k", group = "VOLUMETRIC ORDER BLOCKS" , tooltip = "Position of the Order Block\n Cover the whole candle\n Cover half candle\n Adjust to volatility\n Same as Accurate but more precise", options = )
use_grayscale = input.bool (false , "Grayscale" , inline = "6", group = "VOLUMETRIC ORDER BLOCKS" , tooltip = "Use gray as basic order blocks color")
use_show_metric = input.bool (true , "Show Metrics" , inline = "7", group = "VOLUMETRIC ORDER BLOCKS" , tooltip = "Show volume associated with the orderblock and his relevance")
use_middle_line = input.bool (true , "Show Middle-Line" , inline = "8", group = "VOLUMETRIC ORDER BLOCKS" , tooltip = "Show mid-line order blocks")
use_overlap = input.bool (true , "Hide Overlap" , inline = "9", group = "VOLUMETRIC ORDER BLOCKS" , tooltip = "Hide overlapping order blocks")
use_overlap_method = input.string ("Previous" , "Overlap Method    " , inline = "Z", group = "VOLUMETRIC ORDER BLOCKS" , tooltip = " Preserve the most recent volumetric order blocks\n\n Preserve the previous volumetric order blocks", options = )
ob_bull_css = input.color (color.new(#089981 , 90) , "" , inline = "1", group = "VOLUMETRIC ORDER BLOCKS")
ob_bear_css = input.color (color.new(#f23645 , 90) , "" , inline = "1", group = "VOLUMETRIC ORDER BLOCKS")
show_acc_dist_zone = input.bool (false , "" , inline = "1", group = "Accumulation And Distribution")
zone_mode = input.string ("Fast" , "" , inline = "1", group = "Accumulation And Distribution" , tooltip = " Find small zone pattern formation\n Find bigger zone pattern formation" ,options = )
acc_css = input.color (color.new(#089981 , 60) , "" , inline = "1", group = "Accumulation And Distribution")
dist_css = input.color (color.new(#f23645 , 60) , "" , inline = "1", group = "Accumulation And Distribution")
show_lbl = input.bool (false , "Show swing point" , inline = "1", group = "High and Low" , tooltip = "Display swing point")
show_mtb = input.bool (false , "Show High/Low/Equilibrium" , inline = "2", group = "High and Low" , tooltip = "Display Strong/Weak High And Low and Equilibrium")
toplvl = input.color (color.red , "Premium Zone   " , inline = "3", group = "High and Low")
midlvl = input.color (color.gray , "Equilibrium Zone" , inline = "4", group = "High and Low")
btmlvl = input.color (#089981 , "Discount Zone    " , inline = "5", group = "High and Low")
fvg_enable = input.bool (false , "        " , inline = "1", group = "FAIR VALUE GAP" , tooltip = "Display fair value gap")
what_fvg = input.string ("FVG" , "" , inline = "1", group = "FAIR VALUE GAP" , tooltip = "Display fair value gap", options = )
fvg_num = input.int (5 , "Show Last  " , inline = "1a", group = "FAIR VALUE GAP" , tooltip = "Number of fvg to show")
fvg_upcss = input.color (color.new(#089981, 80) , "" , inline = "1", group = "FAIR VALUE GAP")
fvg_dncss = input.color (color.new(color.red , 80) , "" , inline = "1", group = "FAIR VALUE GAP")
fvg_extend = input.int (10 , "Extend FVG" , inline = "2", group = "FAIR VALUE GAP" , tooltip = "Extend the display of the FVG.")
fvg_src = input.string ("Close" , "Mitigation  " , inline = "3", group = "FAIR VALUE GAP" , tooltip = " Use the close of the body as trigger\n\n Use the extreme point of the body as trigger", options = )
fvg_tf = input.timeframe ("" , "Timeframe " , inline = "4", group = "FAIR VALUE GAP" , tooltip = "Timeframe of the fair value gap")
t = color.t (ob_bull_css)
invcol = color.new (color.white , 100)
//{----------------------------------------------------------------------------------------------------------------------------------------------}
//{----------------------------------------------------------------------------------------------------------------------------------------------}
//{----------------------------------------------------------------------------------------------------------------------------------------------}
//{----------------------------------------------------------------------------------------------------------------------------------------------}
//{ - UDT }
//{----------------------------------------------------------------------------------------------------------------------------------------------}
//{----------------------------------------------------------------------------------------------------------------------------------------------}
//{----------------------------------------------------------------------------------------------------------------------------------------------}
//{----------------------------------------------------------------------------------------------------------------------------------------------}
type bar
float o = open
float c = close
float h = high
float l = low
float v = volume
int n = bar_index
int t = time
type Zphl
line top
line bottom
label top_label
label bottom_label
bool stopcross
bool sbottomcross
bool itopcross
bool ibottomcross
string txtup
string txtdn
float topy
float bottomy
float topx
float bottomx
float tup
float tdn
int tupx
int tdnx
float itopy
float itopx
float ibottomy
float ibottomx
float uV
float dV
type FVG
box box
line ln
bool bull
float top
float btm
int left
int right
type ms
float p
int n
float l
type msDraw
int n
float p
color css
string txt
bool bull
type obC
float top
float btm
int left
float avg
float dV
float cV
int wM
int blVP
int brVP
int dir
float h
float l
int n
type obD
box ob
box eOB
box blB
box brB
line mL
type zone
chart.point points
float p
int c
int t
type hqlzone
box pbx
box ebx
box lbx
label plb
label elb
label lbl
type ehl
float pt
int t
float pb
int b
type pattern
string found = "None"
bool isfound = false
int period = 0
bool bull = false
type alerts
bool chochswing = false
bool chochplusswing = false
bool swingbos = false
bool chochplus = false
bool choch = false
bool bos = false
bool equal = false
bool ob = false
bool swingob = false
bool zone = false
bool fvg = false
bool obtouch = false
//{----------------------------------------------------------------------------------------------------------------------------------------------}
//{----------------------------------------------------------------------------------------------------------------------------------------------}
//{----------------------------------------------------------------------------------------------------------------------------------------------}
//{----------------------------------------------------------------------------------------------------------------------------------------------}
//{ - End }
//{----------------------------------------------------------------------------------------------------------------------------------------------}
//{----------------------------------------------------------------------------------------------------------------------------------------------}
//{----------------------------------------------------------------------------------------------------------------------------------------------}
//{----------------------------------------------------------------------------------------------------------------------------------------------}
//{----------------------------------------------------------------------------------------------------------------------------------------------}
//{----------------------------------------------------------------------------------------------------------------------------------------------}
//{----------------------------------------------------------------------------------------------------------------------------------------------}
//{----------------------------------------------------------------------------------------------------------------------------------------------}
//{ - General Setup }
//{----------------------------------------------------------------------------------------------------------------------------------------------}
//{----------------------------------------------------------------------------------------------------------------------------------------------}
//{----------------------------------------------------------------------------------------------------------------------------------------------}
//{----------------------------------------------------------------------------------------------------------------------------------------------}
bar b = bar.new()
var pattern p = pattern.new()
alerts blalert = alerts.new()
alerts bralert = alerts.new()
if p.isfound
p.period += 1
if p.period == 50
p.period := 0
p.found := "None"
p.isfound := false
p.bull := na
switch
b.c > b.o => boolean.set(green_candle, true)
b.c < b.o => boolean.set(red_candle , true)
f_zscore(src, lookback) =>
(src - ta.sma(src, lookback)) / ta.stdev(src, lookback)
var int iLen = internal_r_lookback
var int sLen = swing_r_lookback
vv = f_zscore(((close - close ) / close ) * 100,iLen)
if ms_mode == "Dynamic"
switch
vv >= 1.5 or vv <= -1.5 => iLen := 10
vv >= 1.6 or vv <= -1.6 => iLen := 9
vv >= 1.7 or vv <= -1.7 => iLen := 8
vv >= 1.8 or vv <= -1.8 => iLen := 7
vv >= 1.9 or vv <= -1.9 => iLen := 6
vv >= 2.0 or vv <= -2.0 => iLen := 5
=> iLen
var msline = array.new(0)
iH = ta.pivothigh(high, iLen, iLen)
sH = ta.pivothigh(high, sLen, sLen)
iL = ta.pivotlow (low , iLen, iLen)
sL = ta.pivotlow (low , sLen, sLen)
//{----------------------------------------------------------------------------------------------------------------------------------------------}
//{----------------------------------------------------------------------------------------------------------------------------------------------}
//{----------------------------------------------------------------------------------------------------------------------------------------------}
//{----------------------------------------------------------------------------------------------------------------------------------------------}
//{ - End }
//{----------------------------------------------------------------------------------------------------------------------------------------------}
//{----------------------------------------------------------------------------------------------------------------------------------------------}
//{----------------------------------------------------------------------------------------------------------------------------------------------}
//{----------------------------------------------------------------------------------------------------------------------------------------------}
//{----------------------------------------------------------------------------------------------------------------------------------------------}
//{----------------------------------------------------------------------------------------------------------------------------------------------}
//{----------------------------------------------------------------------------------------------------------------------------------------------}
//{----------------------------------------------------------------------------------------------------------------------------------------------}
//{ - ARRAYS }
//{----------------------------------------------------------------------------------------------------------------------------------------------}
//{----------------------------------------------------------------------------------------------------------------------------------------------}
//{----------------------------------------------------------------------------------------------------------------------------------------------}
//{----------------------------------------------------------------------------------------------------------------------------------------------}
hl () =>
= request.security(syminfo.tickerid , 'D' , hl() , lookahead = barmerge.lookahead_on)
= request.security(syminfo.tickerid , 'W' , hl() , lookahead = barmerge.lookahead_on)
= request.security(syminfo.tickerid , 'M' , hl() , lookahead = barmerge.lookahead_on)
= request.security(syminfo.tickerid , '12M', hl() , lookahead = barmerge.lookahead_on)
lstyle(style) =>
out = switch style
'⎯⎯⎯' => line.style_solid
'----' => line.style_dashed
'····' => line.style_dotted
mtfphl(h, l ,tf ,css, pdhl_style) =>
var line hl = line.new(
na
, na
, na
, na
, xloc = xloc.bar_time
, color = css
, style = lstyle(pdhl_style)
)
var line ll = line.new(
na
, na
, na
, na
, xloc = xloc.bar_time
, color = css
, style = lstyle(pdhl_style)
)
var label lbl = label.new(
na
, na
, xloc = xloc.bar_time
, text = str.format('P{0}L', tf)
, color = invcol
, textcolor = css
, size = size.small
, style = label.style_label_left
)
var label hlb = label.new(
na
, na
, xloc = xloc.bar_time
, text = str.format('P{0}H', tf)
, color = invcol
, textcolor = css
, size = size.small
, style = label.style_label_left
)
hy = ta.valuewhen(h != h , h , 1)
hx = ta.valuewhen(h == high , time , 1)
ly = ta.valuewhen(l != l , l , 1)
lx = ta.valuewhen(l == low , time , 1)
if barstate.islast
extension = time + (time - time ) * 50
line.set_xy1(hl , hx , hy)
line.set_xy2(hl , extension , hy)
label.set_xy(hlb, extension , hy)
line.set_xy1(ll , lx , ly)
line.set_xy2(ll , extension , ly)
label.set_xy(lbl, extension , ly)
if lvl_daily
mtfphl(pdh , pdl , 'D' , css_d, s_d)
if lvl_weekly
mtfphl(pwh , pwl , 'W' , css_w, s_w)
if lvl_monthly
mtfphl(pmh , pml, 'M' , css_m, s_m)
if lvl_yearly
mtfphl(pyh , pyl , '12M', css_y, s_y)
//{----------------------------------------------------------------------------------------------------------------------------------------------}
//{----------------------------------------------------------------------------------------------------------------------------------------------}
//{----------------------------------------------------------------------------------------------------------------------------------------------}
//{----------------------------------------------------------------------------------------------------------------------------------------------}
//{ - End }
//{----------------------------------------------------------------------------------------------------------------------------------------------}
//{----------------------------------------------------------------------------------------------------------------------------------------------}
//{----------------------------------------------------------------------------------------------------------------------------------------------}
//{----------------------------------------------------------------------------------------------------------------------------------------------}
//{----------------------------------------------------------------------------------------------------------------------------------------------}
//{----------------------------------------------------------------------------------------------------------------------------------------------}
//{----------------------------------------------------------------------------------------------------------------------------------------------}
//{----------------------------------------------------------------------------------------------------------------------------------------------}
//{ - Market Structure }
//{----------------------------------------------------------------------------------------------------------------------------------------------}
//{----------------------------------------------------------------------------------------------------------------------------------------------}
//{----------------------------------------------------------------------------------------------------------------------------------------------}
//{----------------------------------------------------------------------------------------------------------------------------------------------}
method darkcss(color css, float factor, bool bull) =>
blue = color.b(css) * (1 - factor)
red = color.r(css) * (1 - factor)
green = color.g(css) * (1 - factor)
color.rgb(red, green, blue, 0)
method f_line(msDraw d, size, style) =>
var line id = na
var label lbl = na
id := line.new(
d.n
, d.p
, b.n
, d.p
, color = d.css
, width = 1
, style = style
)
if msline.size() >= 250
line.delete(msline.shift())
msline.push(id)
lbl := label.new(
int(math.avg(d.n, b.n))
, d.p
, d.txt
, color = invcol
, textcolor = d.css
, style = d.bull ? label.style_label_down : label.style_label_up
, size = size
, text_font_family = font.family_monospace
)
structure(bool mtf) =>
msDraw drw = na
bool isdrw = false
bool isdrwS = false
var color css = na
var color icss = na
var int itrend = 0
var int trend = 0
bool bull_ob = false
bool bear_ob = false
bool s_bull_ob = false
bool s_bear_ob = false
n = bar_index
var ms up = ms.new(
array.new()
, array.new< int >()
, array.new()
)
var ms dn = ms.new(
array.new()
, array.new< int >()
, array.new()
)
var ms sup = ms.new(
array.new()
, array.new< int >()
, array.new()
)
var ms sdn = ms.new(
array.new()
, array.new< int >()
, array.new()
)
switch show_swing_ms
"All" => boolean.set(s_BOS , true ), boolean.set(s_CHoCH, true ) , boolean.set(s_CHoCHP, true )
"CHoCH" => boolean.set(s_BOS , false), boolean.set(s_CHoCH, true ) , boolean.set(s_CHoCHP, false )
"CHoCH+" => boolean.set(s_BOS , false), boolean.set(s_CHoCH, false) , boolean.set(s_CHoCHP, true )
"BOS" => boolean.set(s_BOS , true ), boolean.set(s_CHoCH, false) , boolean.set(s_CHoCHP, false )
"None" => boolean.set(s_BOS , false), boolean.set(s_CHoCH, false) , boolean.set(s_CHoCHP, false )
=> na
switch show_internal_ms
"All" => boolean.set(i_BOS, true ), boolean.set(i_CHoCH, true ), boolean.set(i_CHoCHP, true )
"CHoCH" => boolean.set(i_BOS, false), boolean.set(i_CHoCH, true ), boolean.set(i_CHoCHP, false)
"CHoCH+" => boolean.set(i_BOS, false), boolean.set(i_CHoCH, false ), boolean.set(i_CHoCHP, true )
"BOS" => boolean.set(i_BOS, true ), boolean.set(i_CHoCH, false ), boolean.set(i_CHoCHP, false)
"None" => boolean.set(i_BOS, false), boolean.set(i_CHoCH, false ), boolean.set(i_CHoCHP, false)
=> na
switch
iH =>
up.p.unshift(b.h )
up.l.unshift(b.h )
up.n.unshift(n )
iL =>
dn.p.unshift(b.l )
dn.l.unshift(b.l )
dn.n.unshift(n )
sL =>
sdn.p.unshift(b.l )
sdn.l.unshift(b.l )
sdn.n.unshift(n )
sH =>
sup.p.unshift(b.h )
sup.l.unshift(b.h )
sup.n.unshift(n )
// INTERNAL BULLISH STRUCTURE
if up.p.size() > 0 and dn.l.size() > 1
if ta.crossover(b.c, up.p.first())
bool CHoCH = na
string txt = na
if itrend < 0
CHoCH := true
switch
not CHoCH =>
txt := "BOS"
css := i_ms_up_BOS
blalert.bos := true
if boolean.get(i_BOS) and mtf == false and na(drw)
isdrw := true
drw := msDraw.new(
up.n.first()
, up.p.first()
, i_ms_up_BOS
, txt
, true
)
CHoCH =>
dn.l.first() > dn.l.get(1) ? blalert.chochplus : blalert.choch
txt := dn.l.first() > dn.l.get(1) ? "CHoCH+" : "CHoCH"
css := i_ms_up_BOS.darkcss(0.25, true)
if (dn.l.first() > dn.l.get(1) ? boolean.get(i_CHoCHP) : boolean.get(i_CHoCH)) and mtf == false and na(drw)
isdrw := true
drw := msDraw.new(
up.n.first()
, up.p.first()
, i_ms_up_BOS.darkcss(0.25, true)
, txt
, true
)
if mtf == false
switch
ob_filter == "None" => bull_ob := true
ob_filter == "BOS" and txt == "BOS" => bull_ob := true
ob_filter == "CHoCH" and txt == "CHoCH" => bull_ob := true
ob_filter == "CHoCH+" and txt == "CHoCH+" => bull_ob := true
itrend := 1
up.n.clear()
up.p.clear()
// INTERNAL BEARISH STRUCTURE
if dn.p.size() > 0 and up.l.size() > 1
if ta.crossunder(b.c, dn.p.first())
bool CHoCH = na
string txt = na
if itrend > 0
CHoCH := true
switch
not CHoCH =>
bralert.bos := true
txt := "BOS"
css := i_ms_dn_BOS
if boolean.get(i_BOS) and mtf == false and na(drw)
isdrw := true
drw := msDraw.new(
dn.n.first()
, dn.p.first()
, i_ms_dn_BOS
, txt
, false
)
CHoCH =>
if up.l.first() < up.l.get(1)
bralert.chochplus := true
else
bralert.choch := true
txt := up.l.first() < up.l.get(1) ? "CHoCH+" : "CHoCH"
css := i_ms_dn_BOS.darkcss(0.25, false)
if (up.l.first() < up.l.get(1) ? boolean.get(i_CHoCHP) : boolean.get(i_CHoCH)) and mtf == false and na(drw)
isdrw := true
drw := msDraw.new(
dn.n.first()
, dn.p.first()
, i_ms_dn_BOS.darkcss(0.25, false)
, txt
, false
)
if mtf == false
switch
ob_filter == "None" => bear_ob := true
ob_filter == "BOS" and txt == "BOS" => bear_ob := true
ob_filter == "CHoCH" and txt == "CHoCH" => bear_ob := true
ob_filter == "CHoCH+" and txt == "CHoCH+" => bear_ob := true
itrend := -1
dn.n.clear()
dn.p.clear()
// SWING BULLISH STRUCTURE
if sup.p.size() > 0 and sdn.l.size() > 1
if ta.crossover(b.c, sup.p.first())
bool CHoCH = na
string txt = na
if trend < 0
CHoCH := true
switch
not CHoCH =>
blalert.swingbos := true
txt := "BOS"
icss := s_ms_up_BOS
if boolean.get(s_BOS) and mtf == false and na(drw)
isdrwS := true
drw := msDraw.new(
sup.n.first()
, sup.p.first()
, s_ms_up_BOS
, txt
, true
)
CHoCH =>
if sdn.l.first() > sdn.l.get(1)
blalert.chochplusswing := true
else
blalert.chochswing := true
txt := sdn.l.first() > sdn.l.get(1) ? "CHoCH+" : "CHoCH"
icss := s_ms_up_BOS.darkcss(0.25, true)
if (sdn.l.first() > sdn.l.get(1) ? boolean.get(s_CHoCHP) : boolean.get(s_CHoCH)) and mtf == false and na(drw)
isdrwS := true
drw := msDraw.new(
sup.n.first()
, sup.p.first()
, s_ms_up_BOS.darkcss(0.25, true)
, txt
, true
)
if mtf == false
switch
ob_filter == "None" => s_bull_ob := true
ob_filter == "BOS" and txt == "BOS" => s_bull_ob := true
ob_filter == "CHoCH" and txt == "CHoCH" => s_bull_ob := true
ob_filter == "CHoCH+" and txt == "CHoCH+" => s_bull_ob := true
trend := 1
sup.n.clear()
sup.p.clear()
// SWING BEARISH STRUCTURE
if sdn.p.size() > 0 and sup.l.size() > 1
if ta.crossunder(b.c, sdn.p.first())
bool CHoCH = na
string txt = na
if trend > 0
CHoCH := true
switch
not CHoCH =>
bralert.swingbos := true
txt := "BOS"
icss := s_ms_dn_BOS
if boolean.get(s_BOS) and mtf == false and na(drw)
isdrwS := true
drw := msDraw.new(
sdn.n.first()
, sdn.p.first()
, s_ms_dn_BOS
, txt
, false
)
CHoCH =>
if sup.l.first() < sup.l.get(1)
bralert.chochplusswing := true
else
bralert.chochswing := true
txt := sup.l.first() < sup.l.get(1) ? "CHoCH+" : "CHoCH"
icss := s_ms_dn_BOS.darkcss(0.25, false)
if (sup.l.first() < sup.l.get(1) ? boolean.get(s_CHoCHP) : boolean.get(s_CHoCH)) and mtf == false and na(drw)
isdrwS := true
drw := msDraw.new(
sdn.n.first()
, sdn.p.first()
, s_ms_dn_BOS.darkcss(0.25, false)
, txt
, false
)
if mtf == false
switch
ob_filter == "None" => s_bear_ob := true
ob_filter == "BOS" and txt == "BOS" => s_bear_ob := true
ob_filter == "CHoCH" and txt == "CHoCH" => s_bear_ob := true
ob_filter == "CHoCH+" and txt == "CHoCH+" => s_bear_ob := true
trend := -1
sdn.n.clear()
sdn.p.clear()
= structure(false)
if isdrw
f_line(drw, size.small, line.style_dashed)
if isdrwS
f_line(drw, size.small, line.style_solid)
= request.security("", "15" , structure(true))
= request.security("", "60" , structure(true))
= request.security("", "240" , structure(true))
= request.security("", "1440" , structure(true))
if show_mtf_str
var tab = table.new(position = position.top_right, columns = 10, rows = 10, bgcolor = na, frame_color = color.rgb(54, 58, 69, 0), frame_width = 1, border_color = color.rgb(54, 58, 69, 100), border_width = 1)
table.cell(tab, 0, 1, text = "15" , text_color = color.silver, text_halign = text.align_center, text_size = size.normal, bgcolor = chart.bg_color, text_font_family = font.family_monospace, width = 2)
table.cell(tab, 0, 2, text = "1H" , text_color = color.silver, text_halign = text.align_center, text_size = size.normal, bgcolor = chart.bg_color, text_font_family = font.family_monospace, width = 2)
table.cell(tab, 0, 3, text = "4H" , text_color = color.silver, text_halign = text.align_center, text_size = size.normal, bgcolor = chart.bg_color, text_font_family = font.family_monospace, width = 2)
table.cell(tab, 0, 4, text = "1D" , text_color = color.silver, text_halign = text.align_center, text_size = size.normal, bgcolor = chart.bg_color, text_font_family = font.family_monospace, width = 2)
table.cell(tab, 1, 1, text = itrend15 == 1 ? "BULLISH" : itrend15 == -1 ? "BEARISH" : na , text_halign = text.align_center, text_size = size.normal, text_color = itrend15 == 1 ? i_ms_up_BOS.darkcss(-0.25, true) : itrend15 == -1 ? i_ms_dn_BOS.darkcss(0.25, false) : color.gray, bgcolor = chart.bg_color, text_font_family = font.family_monospace)
table.cell(tab, 1, 2, text = itrend1H == 1 ? "BULLISH" : itrend1H == -1 ? "BEARISH" : na , text_halign = text.align_center, text_size = size.normal, text_color = itrend1H == 1 ? i_ms_up_BOS.darkcss(-0.25, true) : itrend1H == -1 ? i_ms_dn_BOS.darkcss(0.25, false) : color.gray, bgcolor = chart.bg_color, text_font_family = font.family_monospace)
table.cell(tab, 1, 3, text = itrend4H == 1 ? "BULLISH" : itrend4H == -1 ? "BEARISH" : na , text_halign = text.align_center, text_size = size.normal, text_color = itrend4H == 1 ? i_ms_up_BOS.darkcss(-0.25, true) : itrend4H == -1 ? i_ms_dn_BOS.darkcss(0.25, false) : color.gray, bgcolor = chart.bg_color, text_font_family = font.family_monospace)
table.cell(tab, 1, 4, text = itrend1D == 1 ? "BULLISH" : itrend1D == -1 ? "BEARISH" : na , text_halign = text.align_center, text_size = size.normal, text_color = itrend1D == 1 ? i_ms_up_BOS.darkcss(-0.25, true) : itrend1D == -1 ? i_ms_dn_BOS.darkcss(0.25, false) : color.gray, bgcolor = chart.bg_color, text_font_family = font.family_monospace)
table.cell(tab, 0, 5, text = "Detected Pattern", text_halign = text.align_center, text_size = size.normal, text_color = color.silver, bgcolor = chart.bg_color, text_font_family = font.family_monospace)
table.cell(tab, 0, 6, text = p.found, text_halign = text.align_center, text_size = size.normal, text_color = na(p.bull) ? color.white : p.bull ? i_ms_up_BOS.darkcss(-0.25, true) : p.bull == false ? i_ms_dn_BOS.darkcss(0.25, false) : na, bgcolor = chart.bg_color, text_font_family = font.family_monospace)
table.merge_cells(tab, 0, 5, 1, 5)
table.merge_cells(tab, 0, 6, 1, 6)
//{----------------------------------------------------------------------------------------------------------------------------------------------}
//{----------------------------------------------------------------------------------------------------------------------------------------------}
//{----------------------------------------------------------------------------------------------------------------------------------------------}
//{----------------------------------------------------------------------------------------------------------------------------------------------}
//{ - End }
//{----------------------------------------------------------------------------------------------------------------------------------------------}
//{----------------------------------------------------------------------------------------------------------------------------------------------}
//{----------------------------------------------------------------------------------------------------------------------------------------------}
//{----------------------------------------------------------------------------------------------------------------------------------------------}
//{----------------------------------------------------------------------------------------------------------------------------------------------}
//{----------------------------------------------------------------------------------------------------------------------------------------------}
//{----------------------------------------------------------------------------------------------------------------------------------------------}
//{----------------------------------------------------------------------------------------------------------------------------------------------}
//{ - Strong/Weak High/Low And Equilibrium }
//{----------------------------------------------------------------------------------------------------------------------------------------------}
//{----------------------------------------------------------------------------------------------------------------------------------------------}
//{----------------------------------------------------------------------------------------------------------------------------------------------}
//{----------------------------------------------------------------------------------------------------------------------------------------------}
var phl = Zphl.new(
na
, na
, label.new(na , na , color = invcol , textcolor = i_ms_dn_BOS , style = label.style_label_down , size = size.tiny , text = "")
, label.new(na , na , color = invcol , textcolor = i_ms_up_BOS , style = label.style_label_up , size = size.tiny , text = "")
, true
, true
, true
, true
, ""
, ""
, 0
, 0
, 0
, 0
, high
, low
, 0
, 0
, 0
, 0
, 0
, 0
, na
, na
)
zhl(len)=>
upper = ta.highest(len)
lower = ta.lowest(len)
var float out = 0
out := b.h > upper ? 0 : b.l < lower ? 1 : out
top = out == 0 and out != 0 ? b.h : 0
btm = out == 1 and out != 1 ? b.l : 0
= zhl(sLen)
= zhl(iLen)
upphl(trend) =>
var label lbl = label.new(
na
, na
, color = invcol
, textcolor = toplvl
, style = label.style_label_down
, size = size.small
)
if top
phl.stopcross := true
phl.txtup := top > phl.topy ? "HH" : "HL"
if show_lbl
topl = label.new(
b.n - swing_r_lookback
, top
, phl.txtup
, color = invcol
, textcolor = toplvl
, style = label.style_label_down
, size = size.small
)
line.delete(phl.top )
phl.top := line.new(
b.n - sLen
, top
, b.n
, top
, color = toplvl)
phl.topy := top
phl.topx := b.n - sLen
phl.tup := top
phl.tupx := b.n - sLen
if itop
phl.itopcross := true
phl.itopy := itop
phl.itopx := b.n - iLen
phl.tup := math.max(high, phl.tup)
phl.tupx := phl.tup == high ? b.n : phl.tupx
phl.uV := phl.tup != phl.tup ? b.v : phl.uV
if barstate.islast
line.set_xy1(
phl.top
, phl.tupx
, phl.tup
)
line.set_xy2(
phl.top
, b.n + 50
, phl.tup
)
label.set_x(
lbl
, b.n + 50
)
label.set_y(
lbl
, phl.tup
)
dist = math.abs(phl.uV / (phl.uV + phl.dV)) * 100
label.set_text (lbl, trend < 0
? "Strong High | " + str.tostring(phl.uV, format.volume) + " (" + str.tostring(math.round(dist,0)) + "%)"
: "Weak High | " + str.tostring(phl.uV, format.volume) + " (" + str.tostring(math.round(dist,0)) + "%)")
dnphl(trend) =>
var label lbl = label.new(
na
, na
, color = invcol
, textcolor = btmlvl
, style = label.style_label_up
, size = size.small
)
if btm
phl.sbottomcross := true
phl.txtdn := btm > phl.bottomy ? "LH" : "LL"
if show_lbl
btml = label.new(
b.n - swing_r_lookback
, btm, phl.txtdn
, color = invcol
, textcolor = btmlvl
, style = label.style_label_up
, size = size.small
)
line.delete(phl.bottom )
phl.bottom := line.new(
b.n - sLen
, btm
, b.n
, btm
, color = btmlvl
)
phl.bottomy := btm
phl.bottomx := b.n - sLen
phl.tdn := btm
phl.tdnx := b.n - sLen
if ibtm
phl.ibottomcross := true
phl.ibottomy := ibtm
phl.ibottomx := b.n - iLen
phl.tdn := math.min(low, phl.tdn)
phl.tdnx := phl.tdn == low ? b.n : phl.tdnx
phl.dV := phl.tdn != phl.tdn ? b.v : phl.dV
if barstate.islast
line.set_xy1(
phl.bottom
, phl.tdnx
, phl.tdn
)
line.set_xy2(
phl.bottom
, b.n + 50
, phl.tdn
)
label.set_x(
lbl
, b.n + 50
)
label.set_y(
lbl
, phl.tdn
)
dist = math.abs(phl.dV / (phl.uV + phl.dV)) * 100
label.set_text (lbl, trend > 0
? "Strong Low | " + str.tostring(phl.dV, format.volume) + " (" + str.tostring(math.round(dist,0)) + "%)"
: "Weak Low | " + str.tostring(phl.uV, format.volume) + " (" + str.tostring(math.round(dist,0)) + "%)")
midphl() =>
avg = math.avg(phl.bottom.get_y2(), phl.top.get_y2())
var line l = line.new(
y1 = avg
, y2 = avg
, x1 = b.n - sLen
, x2 = b.n + 50
, color = midlvl
, style = line.style_solid
)
var label lbl = label.new(
x = b.n + 50
, y = avg
, text = "Equilibrium"
, style = label.style_label_left
, color = invcol
, textcolor = midlvl
, size = size.small
)
if barstate.islast
more = (phl.bottom.get_x1() + phl.bottom.get_x2()) > (phl.top.get_x1() + phl.top.get_x2()) ? phl.top.get_x1() : phl.bottom.get_x1()
line.set_xy1(l , more , avg)
line.set_xy2(l , b.n + 50, avg)
label.set_x (lbl , b.n + 50 )
label.set_y (lbl , avg )
dist = math.abs((l.get_y2() - close) / close) * 100
label.set_text (lbl, "Equilibrium (" + str.tostring(math.round(dist,0)) + "%)")
hqlzone() =>
if barstate.islast
var hqlzone dZone = hqlzone.new(
box.new(
na
, na
, na
, na
, bgcolor = color.new(toplvl, 70)
, border_color = na
)
, box.new(
na
, na
, na
, na
, bgcolor = color.new(midlvl, 70)
, border_color = na
)
, box.new(
na
, na
, na
, na
, bgcolor = color.new(btmlvl, 70)
, border_color = na
)
, label.new(na, na, text = "Premium" , color = invcol, textcolor = toplvl, style = label.style_label_down, size = size.small)
, label.new(na, na, text = "Equilibrium", color = invcol, textcolor = midlvl, style = label.style_label_left, size = size.small)
, label.new(na, na, text = "Discount" , color = invcol, textcolor = btmlvl, style = label.style_label_up , size = size.small)
)
dZone.pbx.set_lefttop(int(math.max(phl.topx, phl.bottomx)) , phl.tup)
dZone.pbx.set_rightbottom(b.n + 50 , 0.95 * phl.tup + 0.05 * phl.tdn)
dZone.ebx.set_lefttop(int(math.max(phl.topx, phl.bottomx)), 0.525 * phl.tup + 0.475 * phl.tdn)
dZone.ebx.set_rightbottom(b.n + 50 , 0.525 * phl.tdn + 0.475 * phl.tup)
dZone.lbx.set_lefttop(int(math.max(phl.topx, phl.bottomx)), 0.95 * phl.tdn + 0.05 * phl.tup)
dZone.lbx.set_rightbottom(b.n + 50 , phl.tdn)
dZone.plb.set_xy( int(math.avg(math.max(phl.topx, phl.bottomx), int(b.n + 50))) , phl.tup)
dZone.elb.set_xy( int(b.n + 50) , math.avg(phl.tup, phl.tdn))
dZone.lbl.set_xy( int(math.avg(math.max(phl.topx, phl.bottomx), int(b.n + 50))) , phl.tdn)
if show_mtb
upphl (trend)
dnphl (trend)
hqlzone()
//{----------------------------------------------------------------------------------------------------------------------------------------------}
//{----------------------------------------------------------------------------------------------------------------------------------------------}
//{----------------------------------------------------------------------------------------------------------------------------------------------}
//{----------------------------------------------------------------------------------------------------------------------------------------------}
//{ - End }
//{----------------------------------------------------------------------------------------------------------------------------------------------}
//{----------------------------------------------------------------------------------------------------------------------------------------------}
//{----------------------------------------------------------------------------------------------------------------------------------------------}
//{----------------------------------------------------------------------------------------------------------------------------------------------}
//{----------------------------------------------------------------------------------------------------------------------------------------------}
//{----------------------------------------------------------------------------------------------------------------------------------------------}
//{----------------------------------------------------------------------------------------------------------------------------------------------}
//{----------------------------------------------------------------------------------------------------------------------------------------------}
//{ - Volumetric Order Block }
//{----------------------------------------------------------------------------------------------------------------------------------------------}
//{----------------------------------------------------------------------------------------------------------------------------------------------}
//{----------------------------------------------------------------------------------------------------------------------------------------------}
//{----------------------------------------------------------------------------------------------------------------------------------------------}
method eB(box b, bool ext, color css, bool swing) =>
b.unshift(
box.new(
na
, na
, na
, na
, xloc = xloc.bar_time
, text_font_family = font.family_monospace
, extend = ext ? extend.right : extend.none
, border_color = swing ? color.new(css, 0) : color.new(color.white,100)
, bgcolor = css
, border_width = 1
)
)
method eL(line l, bool ext, bool solid, color css) =>
l.unshift(
line.new(
na
, na
, na
, na
, width = 1
, color = css
, xloc = xloc.bar_time
, extend = ext ? extend.right : extend.none
, style = solid ? line.style_solid : line.style_dashed
)
)
method drawVOB(bool cdn, bool bull, color css, int loc, bool swing) =>
= request.security(
syminfo.tickerid
, ""
,
, lookahead = barmerge.lookahead_off
)
var obC obj = obC.new(
array.new()
, array.new()
, array.new< int >()
, array.new()
, array.new()
, array.new()
, array.new< int >()
, array.new< int >()
, array.new< int >()
, array.new< int >()
, array.new()
, array.new()
, array.new< int >()
)
var obD draw = obD.new(
array.new()
, array.new()
, array.new()
, array.new()
, array.new()
)
if barstate.isfirst
for i = 0 to ob_num - 1
draw.mL .eL(false, false, use_grayscale ? color.new(color.gray, 0) : color.new(css,0))
draw.ob .eB(false, use_grayscale ? color.new(color.gray, 90) : css, swing)
draw.blB.eB(false, css_metric_up , swing)
draw.brB.eB(false, css_metric_dn , swing)
draw.eOB.eB(true , use_grayscale ? color.new(color.gray, 90) : css, swing)
float pos = ob_pos == "Full"
? (bull ? high : low)
: ob_pos == "Middle"
? ohlc4
: ob_pos == "Accurate"
? hl2
: hl2
if cdn
obj.h.clear()
obj.l.clear()
obj.n.clear()
for i = 0 to math.abs((loc - b.n)) - 1
obj.h.push(hH )
obj.l.push(lL )
obj.n.push(b.t )
// obj.h.reverse()
// obj.l.reverse()
int iU = obj.l.indexof(obj.l.min()) + 1
int iD = obj.h.indexof(obj.h.max()) + 1
obj.dir.unshift(
bull
? (b.c > b.o ? 1 : -1)
: (b.c > b.o ? 1 : -1)
)
obj.top.unshift(
bull
? pos
: obj.h.max()
)
obj.btm.unshift(
bull
? obj.l.min()
: pos
)
obj.left.unshift(
bull
? obj.n.get(obj.l.indexof(obj.l.min()))
: obj.n.get(obj.h.indexof(obj.h.max()))
)
obj.avg.unshift(
math.avg(obj.top.first(), obj.btm.first())
)
obj.cV.unshift(
bull
? b.v
: b.v
)
if ob_pos == "Precise"
switch bull
true =>
if obj.avg.get(0) < (b.c < b.o ? b.c : b.o ) and obj.top.get(0) > hlcc4
obj.top.set(0, obj.avg.get(0))
obj.avg.set(0, math.avg(obj.top.first(), obj.btm.first()))
false =>
if obj.avg.get(0) > (b.c < b.o ? b.o : b.c ) and obj.btm.get(0) < hlcc4
obj.btm.set(0, obj.avg.get(0))
obj.avg.set(0, math.avg(obj.top.first(), obj.btm.first()))
obj.blVP.unshift ( 0 )
obj.brVP.unshift ( 0 )
obj.wM .unshift ( 1 )
if use_overlap
int rmP = use_overlap_method == "Recent" ? 1 : 0
if obj.avg.size() > 1
if bull
? obj.btm.first() < obj.top.get(1)
: obj.top.first() > obj.btm.get(1)
obj.wM .remove(rmP)
obj.cV .remove(rmP)
obj.dir .remove(rmP)
obj.top .remove(rmP)
obj.avg .remove(rmP)
obj.btm .remove(rmP)
obj.left .remove(rmP)
obj.blVP .remove(rmP)
obj.brVP .remove(rmP)
if barstate.isconfirmed
for x = 0 to ob_num - 1
tg = switch ob_mitigation
"Middle" => obj.avg
"Absolute" => bull ? obj.btm : obj.top
for in tg
if (bull ? cC < pt : cC > pt)
obj.wM .remove(idx)
obj.cV .remove(idx)
obj.dir .remove(idx)
obj.top .remove(idx)
obj.avg .remove(idx)
obj.btm .remove(idx)
obj.left .remove(idx)
obj.blVP .remove(idx)
obj.brVP .remove(idx)
if barstate.islast
if obj.avg.size() > 0
// Alert
if bull
? ta.crossunder(low , obj.top.get(0))
: ta.crossover (high, obj.btm.get(0))
switch bull
true => blalert.obtouch := true
false => bralert.obtouch := true
float tV = 0
obj.dV.clear()
seq = math.min(ob_num - 1, obj.avg.size() - 1)
for j = 0 to seq
tV += obj.cV.get(j)
if j == seq
for y = 0 to seq
obj.dV.unshift(
math.floor(
(obj.cV.get(y) / tV) * 100)
)
obj.dV.reverse()
for i = 0 to math.min(ob_num - 1, obj.avg.size() - 1)
dmL = draw.mL .get(i)
dOB = draw.ob .get(i)
dblB = draw.blB.get(i)
dbrB = draw.brB.get(i)
deOB = draw.eOB.get(i)
dOB.set_lefttop (obj.left .get(i) , obj.top.get(i))
deOB.set_lefttop (b.t , obj.top.get(i))
dOB.set_rightbottom (b.t , obj.btm.get(i))
deOB.set_rightbottom(b.t + (b.t - b.t ) * 100 , obj.btm.get(i))
if use_middle_line
dmL.set_xy1(obj.left.get(i), obj.avg.get(i))
dmL.set_xy2(b.t , obj.avg.get(i))
if ob_metrics_show
dblB.set_lefttop (obj.left.get(i), obj.top.get(i))
dbrB.set_lefttop (obj.left.get(i), obj.avg.get(i))
dblB.set_rightbottom(obj.left.get(i), obj.avg.get(i))
dbrB.set_rightbottom(obj.left.get(i), obj.btm.get(i))
rpBL = dblB.get_right()
rpBR = dbrB.get_right()
dbrB.set_right(rpBR + (b.t - b.t ) * obj.brVP.get(i))
dblB.set_right(rpBL + (b.t - b.t ) * obj.blVP.get(i))
if use_show_metric
txt = switch
obj.cV.get(i) >= 1000000000 => str.tostring(math.round(obj.cV.get(i) / 1000000000,3)) + "B"
obj.cV.get(i) >= 1000000 => str.tostring(math.round(obj.cV.get(i) / 1000000,3)) + "M"
obj.cV.get(i) >= 1000 => str.tostring(math.round(obj.cV.get(i) / 1000,3)) + "K"
obj.cV.get(i) < 1000 => str.tostring(math.round(obj.cV.get(i)))
deOB.set_text(
str.tostring(
txt + " (" + str.tostring(obj.dV.get(i)) + "%)")
)
deOB.set_text_size (size.auto)
deOB.set_text_halign(text.align_left)
deOB.set_text_color (use_grayscale ? color.silver : color.new(css, 0))
if ob_metrics_show and barstate.isconfirmed
if obj.wM.size() > 0
for i = 0 to obj.avg.size() - 1
switch obj.dir.get(i)
1 =>
switch obj.wM.get(i)
1 => obj.blVP.set(i, obj.blVP.get(i) + 1), obj.wM.set(i, 2)
2 => obj.blVP.set(i, obj.blVP.get(i) + 1), obj.wM.set(i, 3)
3 => obj.brVP.set(i, obj.brVP.get(i) + 1), obj.wM.set(i, 1)
-1 =>
switch obj.wM.get(i)
1 => obj.brVP.set(i, obj.brVP.get(i) + 1), obj.wM.set(i, 2)
2 => obj.brVP.set(i, obj.brVP.get(i) + 1), obj.wM.set(i, 3)
3 => obj.blVP.set(i, obj.blVP.get(i) + 1), obj.wM.set(i, 1)
var hN = array.new(1, b.n)
var lN = array.new(1, b.n)
var hS = array.new(1, b.n)
var lS = array.new(1, b.n)
if iH
hN.pop()
hN.unshift(int(b.n ))
if iL
lN.pop()
lN.unshift(int(b.n ))
if sH
hS.pop()
hS.unshift(int(b.n ))
if sL
lS.pop()
lS.unshift(int(b.n ))
if ob_show
bull_ob.drawVOB(true , ob_bull_css, hN.first(), false)
bear_ob.drawVOB(false, ob_bear_css, lN.first(), false)
if ob_swings
s_bull_ob.drawVOB(true , css_swing_up, hS.first(), true)
s_bear_ob.drawVOB(false, css_swing_dn, lS.first(), true)
if bull_ob
blalert.ob := true
if bear_ob
bralert.ob := true
if s_bull_ob
blalert.swingob := true
if s_bear_ob
blalert.swingob := true
//{----------------------------------------------------------------------------------------------------------------------------------------------}
//{----------------------------------------------------------------------------------------------------------------------------------------------}
//{----------------------------------------------------------------------------------------------------------------------------------------------}
//{----------------------------------------------------------------------------------------------------------------------------------------------}
//{ - End }
//{----------------------------------------------------------------------------------------------------------------------------------------------}
//{----------------------------------------------------------------------------------------------------------------------------------------------}
//{----------------------------------------------------------------------------------------------------------------------------------------------}
//{----------------------------------------------------------------------------------------------------------------------------------------------}
//{----------------------------------------------------------------------------------------------------------------------------------------------}
//{----------------------------------------------------------------------------------------------------------------------------------------------}
//{----------------------------------------------------------------------------------------------------------------------------------------------}
//{----------------------------------------------------------------------------------------------------------------------------------------------}
//{ - FVG | VI | OG }
//{----------------------------------------------------------------------------------------------------------------------------------------------}
//{----------------------------------------------------------------------------------------------------------------------------------------------}
//{----------------------------------------------------------------------------------------------------------------------------------------------}
//{----------------------------------------------------------------------------------------------------------------------------------------------}
ghl() => request.security(syminfo.tickerid, fvg_tf, [high , low , close , open ])
tfG() => request.security(syminfo.tickerid, fvg_tf, )
cG(bool bull) =>
= ghl()
= tfG()
var FVG draw = FVG.new(
array.new()
, array.new()
)
var FVG cords = array.new()
float pup = na
float pdn = na
bool cdn = na
int pos = 2
cc = timeframe.change(fvg_tf)
if barstate.isfirst
for i = 0 to fvg_num - 1
draw.box.unshift(box.new (na, na, na, na, border_color = color.new(color.white, 100), xloc = xloc.bar_time))
draw.ln.unshift (line.new(na, na, na, na, xloc = xloc.bar_time, width = 1, style = line.style_solid))
switch what_fvg
"FVG" =>
pup := bull ? gl : l
pdn := bull ? h : gh
cdn := bull ? gl > h and cc : gh < l and cc
pos := 2
"VI" =>
pup := bull
? (gc > go
? go
: gc)
: (gc > go
? go
: gc )
pdn := bull
? (gc > go
? gc
: go )
: (gc > go
? gc
: go)
cdn := bull
? go > gc and gh >

Execution Heatmap v4.1 — AI EnhancedThis indicator is an AI‑style execution dashboard that compresses structure, momentum, volume, volatility, and risk into a compact heatmap panel plus BUY/SELL signals on the chart. It is specifically tuned for gold and silver, automatically adapting its thresholds to the volatility profile of XAU/GC and XAG/SI symbols.
Core architecture
The system builds a multi‑factor model in layers:
Adaptive structure engine: Tracks dynamic higher‑high / lower‑low progression using rolling reference highs and lows, classifying price as structural UP, DOWN, or NEUTRAL.
Precision VWAP bias: Uses VWAP with a small threshold band to filter out noise and label price as ABOVE, BELOW, or neutral relative to value.
Impulse & angle: Combines short‑term rate of change and normalized slope (price vs ATR over 5 bars) to detect directional thrust, then clamps values into
for stable scoring.
Volume, wicks, and patterns
Adaptive volume tiers: Uses a 20‑bar volume average with gold/silver‑specific multipliers to tag candles as SURGE, HIGH, NORMAL, or LOW volume, with distinct coloring for extremes.
Wick analytics: Measures upper/lower wick size vs total range to detect demand/supply style rejections and encode them as bullish or bearish wick signals.
AI pattern score: Blends structure, VWAP, impulse, wicks, and angle into a normalized pattern score, then classifies it as STRONG↑, NEU↑, NEU, NEU↓, or STRONG↓ with color‑coded emphasis.
AI scoring and prediction layer
Predictive engine: Uses a neural‑network‑style weighted sum of structure, VWAP, impulse, wicks, angle, volume, and pattern to generate a prediction score in
, then converts it into a percentage and arrow (↑, ↑↑, ↓, ↓↓, →) for intuitive directional bias.
Execution score: Aggregates key factors into an EXEC score (0–200+ style scale), color‑graded from weak (red) through medium (orange) to strong (green) execution context.
Uncertainty & risk: Separately models uncertainty (low impulse/angle or low conviction) and risk (fake breaks, VWAP position, uncertainty tier, low volume), then feeds them into a combined confidence calculation.
Final signal & confidence
Final classification:
BUY: High exec score, high confidence, and controlled risk.
SELL: Very low exec score, low confidence in upside, and acceptable risk.
WAIT: All other conditions where edge or clarity is insufficient.
Confidence bar: A textual mini‑bar (🟩 blocks) plus percentage shows how strong the current signal environment is, making it easy to visually gauge setup quality at a glance.
Professional heatmap panel
A two‑column table in the top‑right of the chart organizes the logic into layers:
Base layer: STRUCT, VWAP, IMPULSE, VOLUME.
AI layer: FAKE, REGIME (Trend/Pullback/Reverse/Chop), ANGLE.
Decision layer: PATTERN, PREDICT, EXEC, RISK, CONF, and FINAL direction.

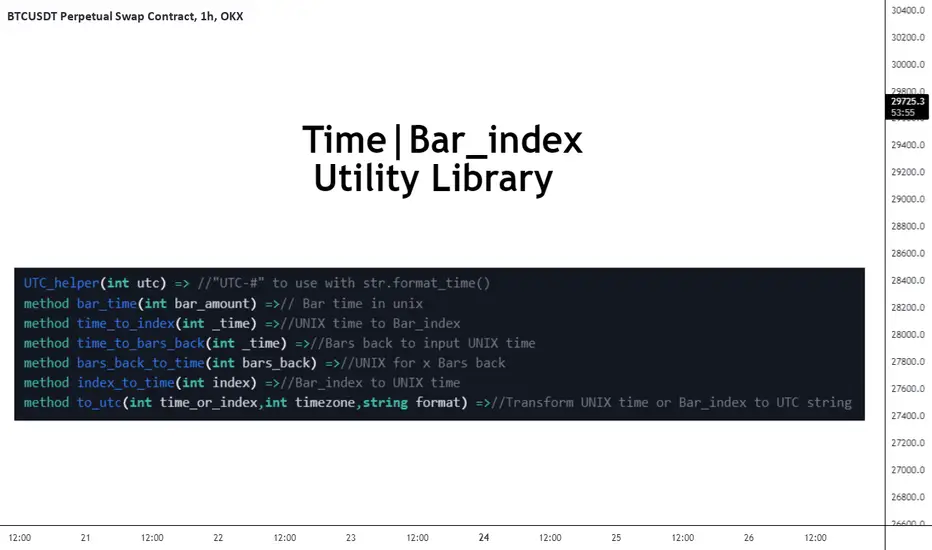
FrizLabz_Time_Utility_MethodsLibrary "FrizLabz_Time_Utility_Methods"
Some time to index and index to time helper methods made them for another library thought I would try to make
them as methods
UTC_helper(utc)
UTC helper function this adds the + to the positive utc times, add "UTC" to the string
and can be used in the timezone arg of for format_time()
Parameters:
utc : (int) | +/- utc offset
Returns: string | string to be added to the timezone paramater for utc timezone usage
bar_time(bar_amount)
from a time to index
Parameters:
bar_amount : (int) | default - 1)
Returns: int bar_time
time_to_index(_time)
from time to bar_index
Parameters:
_time : (int)
Returns: int time_to_index | bar_index that corresponds to time provided
time_to_bars_back(_time)
from a time quanity to bar quanity for use with .
Parameters:
_time : (int)
Returns: int bars_back | yeilds the amount of bars from current bar to reach _time provided
bars_back_to_time(bars_back)
from bars_back to time
Parameters:
bars_back
Returns: int | using same logic as this will return the
time of the bar = to the bar that corresponds to bars_back
index_time(index)
bar_index to UNIX time
Parameters:
index : (int)
Returns: int time | time in unix that corrresponds to the bar_index
to_utc(time_or_index, timezone, format)
method to use with a time or bar_index variable that will detect if it is an index or unix time
and convert it to a printable string
Parameters:
time_or_index : (int) required) | time in unix or bar_index
timezone : (int) required) | utc offset to be appled to output
format : (string) | default - "yyyy-MM-dd'T'HH:mm:ssZ") | the format for the time, provided string is
default one from str.format_time()
Returns: string | time formatted string
GET(line)
Gets the location paramaters of a Line
Parameters:
line : (line)
Returns: tuple
GET(box)
Gets the location paramaters of a Box
Parameters:
box : (box)
Returns: tuple
GET(label)
Gets the location paramaters and text of a Label
Parameters:
label : (label)
Returns: tuple
GET(linefill)
Gets line 1 and 2 from a Linefill
Parameters:
linefill : (linefill)
Returns: tuple
Format(line, timezone)
converts Unix time in time or index params to formatted time
and returns a tuple of the params as string with the time/index params formatted
Parameters:
line : (line) | required
timezone : (int) | default - na
Returns: tuple
Line(x1, y1, x2, y2, extend, color, style, width)
similar to line.new() with the exception
of not needing to include y2 for a flat line, y1 defaults to close,
and it doesnt require xloc.bar_time or xloc.bar_index, if no x1
Parameters:
x1 : (int) default - time
y1 : (float) default - close
x2 : (int) default - last_bar_time/last_bar_index | not required for line that ends on current bar
y2 : (float) default - y1 | not required for flat line
extend : (string) default - extend.none | extend.left, extend.right, extend.both
color : (color) default - chart.fg_color
style : (string) default - line.style_solid | line.style_dotted, line.style_dashed,
line.style_arrow_both, line.style_arrow_left, line.style_arrow_right
width
Returns: line
Box(left, top, right, bottom, extend, border_color, bgcolor, text_color, border_width, border_style, txt, text_halign, text_valign, text_size, text_wrap)
similar to box.new() but only requires top and bottom to create box,
auto detects if it is bar_index or time used in the (left) arg. xloc.bar_time and xloc.bar_index are not used
args are ordered by purpose | position -> colors -> styling -> text options
Parameters:
left : (int) default - time
top : (float) required
right : (int) default - last_bar_time/last_bar_index | will default to current bar index or time
depending on (left) arg
bottom : (float) required
extend : (string) default - extend.none | extend.left, extend.right, extend.both
border_color : (color) default - chart.fg_color
bgcolor : (color) default - color.new(chart.fg_color,75)
text_color : (color) default - chart.bg_color
border_width : (int) default - 1
border_style : (string) default - line.style_solid | line.style_dotted, line.style_dashed,
txt : (string) default - ''
text_halign : (string) default - text.align_center | text.align_left, text.align_right
text_valign : (string) default - text.align_center | text.align_top, text.align_bottom
text_size : (string) default - size.normal | size.tiny, size.small, size.large, size.huge
text_wrap : (string) default - text.wrap_auto | text.wrap_none
Returns: box
Label(x, y, txt, yloc, color, textcolor, style, size, textalign, text_font_family, tooltip)
similar to label.new() but only requires no args to create label,
auto detects if it is bar_index or time used in the (x) arg. xloc.bar_time and xloc.bar_index are not used
args are ordered by purpose | position -> colors -> styling -> text options
Parameters:
x : (int) default - time
y : (float) default - high or low | depending on bar direction
txt : (string) default - ''
yloc : (string) default - yloc.price | yloc.price, yloc.abovebar, yloc.belowbar
color : (color) default - chart.fg_color
textcolor : (color) default - chart.bg_color
style : (string) default - label.style_label_down | label.style_none
label.style_xcross,label.style_cross,label.style_triangleup,label.style_triangledown
label.style_flag, label.style_circle, label.style_arrowup, label.style_arrowdown,
label.style_label_up, label.style_label_down, label.style_label_left, label.style_label_right,
label.style_label_lower_left, label.style_label_lower_right, label.style_label_upper_left,
label.style_label_upper_right, label.style_label_center, label.style_square,
label.style_diamond
size : (string) default - size.normal | size.tiny, size.small, size.large, size.huge
textalign : (string) default - text.align_center | text.align_left, text.align_right
text_font_family : (string) default - font.family_default | font.family_monospace
tooltip : (string) default - na
Returns: label
Kripto Fema ind/ This Pine Script™ code is subject to the terms of the Mozilla Public License 2.0 at mozilla.org
// © Femayakup
//@version=5
indicator(title = "Kripto Fema ind", shorttitle="Kripto Fema ind", overlay=true, format=format.price, precision=2,max_lines_count = 500, max_labels_count = 500, max_bars_back=500)
showEma200 = input(true, title="EMA 200")
showPmax = input(true, title="Pmax")
showLinreg = input(true, title="Linreg")
showMavilim = input(true, title="Mavilim")
showNadaray = input(true, title="Nadaraya Watson")
ma(source, length, type) =>
switch type
"SMA" => ta.sma(source, length)
"EMA" => ta.ema(source, length)
"SMMA (RMA)" => ta.rma(source, length)
"WMA" => ta.wma(source, length)
"VWMA" => ta.vwma(source, length)
//Ema200
timeFrame = input.timeframe(defval = '240',title= 'EMA200 TimeFrame',group = 'EMA200 Settings')
len200 = input.int(200, minval=1, title="Length",group = 'EMA200 Settings')
src200 = input(close, title="Source",group = 'EMA200 Settings')
offset200 = input.int(title="Offset", defval=0, minval=-500, maxval=500,group = 'EMA200 Settings')
out200 = ta.ema(src200, len200)
higherTimeFrame = request.security(syminfo.tickerid,timeFrame,out200 ,barmerge.gaps_on,barmerge.lookahead_on)
ema200Plot = showEma200 ? higherTimeFrame : na
plot(ema200Plot, title="EMA200", offset=offset200)
//Linreq
group1 = "Linreg Settings"
lengthInput = input.int(100, title="Length", minval = 1, maxval = 5000,group = group1)
sourceInput = input.source(close, title="Source")
useUpperDevInput = input.bool(true, title="Upper Deviation", inline = "Upper Deviation", group = group1)
upperMultInput = input.float(2.0, title="", inline = "Upper Deviation", group = group1)
useLowerDevInput = input.bool(true, title="Lower Deviation", inline = "Lower Deviation", group = group1)
lowerMultInput = input.float(2.0, title="", inline = "Lower Deviation", group = group1)
group2 = "Linreg Display Settings"
showPearsonInput = input.bool(true, "Show Pearson's R", group = group2)
extendLeftInput = input.bool(false, "Extend Lines Left", group = group2)
extendRightInput = input.bool(true, "Extend Lines Right", group = group2)
extendStyle = switch
extendLeftInput and extendRightInput => extend.both
extendLeftInput => extend.left
extendRightInput => extend.right
=> extend.none
group3 = "Linreg Color Settings"
colorUpper = input.color(color.new(color.blue, 85), "Linreg Renk", inline = group3, group = group3)
colorLower = input.color(color.new(color.red, 85), "", inline = group3, group = group3)
calcSlope(source, length) =>
max_bars_back(source, 5000)
if not barstate.islast or length <= 1
else
sumX = 0.0
sumY = 0.0
sumXSqr = 0.0
sumXY = 0.0
for i = 0 to length - 1 by 1
val = source
per = i + 1.0
sumX += per
sumY += val
sumXSqr += per * per
sumXY += val * per
slope = (length * sumXY - sumX * sumY) / (length * sumXSqr - sumX * sumX)
average = sumY / length
intercept = average - slope * sumX / length + slope
= calcSlope(sourceInput, lengthInput)
startPrice = i + s * (lengthInput - 1)
endPrice = i
var line baseLine = na
if na(baseLine) and not na(startPrice) and showLinreg
baseLine := line.new(bar_index - lengthInput + 1, startPrice, bar_index, endPrice, width=1, extend=extendStyle, color=color.new(colorLower, 0))
else
line.set_xy1(baseLine, bar_index - lengthInput + 1, startPrice)
line.set_xy2(baseLine, bar_index, endPrice)
na
calcDev(source, length, slope, average, intercept) =>
upDev = 0.0
dnDev = 0.0
stdDevAcc = 0.0
dsxx = 0.0
dsyy = 0.0
dsxy = 0.0
periods = length - 1
daY = intercept + slope * periods / 2
val = intercept
for j = 0 to periods by 1
price = high - val
if price > upDev
upDev := price
price := val - low
if price > dnDev
dnDev := price
price := source
dxt = price - average
dyt = val - daY
price -= val
stdDevAcc += price * price
dsxx += dxt * dxt
dsyy += dyt * dyt
dsxy += dxt * dyt
val += slope
stdDev = math.sqrt(stdDevAcc / (periods == 0 ? 1 : periods))
pearsonR = dsxx == 0 or dsyy == 0 ? 0 : dsxy / math.sqrt(dsxx * dsyy)
= calcDev(sourceInput, lengthInput, s, a, i)
upperStartPrice = startPrice + (useUpperDevInput ? upperMultInput * stdDev : upDev)
upperEndPrice = endPrice + (useUpperDevInput ? upperMultInput * stdDev : upDev)
var line upper = na
lowerStartPrice = startPrice + (useLowerDevInput ? -lowerMultInput * stdDev : -dnDev)
lowerEndPrice = endPrice + (useLowerDevInput ? -lowerMultInput * stdDev : -dnDev)
var line lower = na
if na(upper) and not na(upperStartPrice) and showLinreg
upper := line.new(bar_index - lengthInput + 1, upperStartPrice, bar_index, upperEndPrice, width=1, extend=extendStyle, color=color.new(colorUpper, 0))
else
line.set_xy1(upper, bar_index - lengthInput + 1, upperStartPrice)
line.set_xy2(upper, bar_index, upperEndPrice)
na
if na(lower) and not na(lowerStartPrice) and showLinreg
lower := line.new(bar_index - lengthInput + 1, lowerStartPrice, bar_index, lowerEndPrice, width=1, extend=extendStyle, color=color.new(colorUpper, 0))
else
line.set_xy1(lower, bar_index - lengthInput + 1, lowerStartPrice)
line.set_xy2(lower, bar_index, lowerEndPrice)
na
showLinregPlotUpper = showLinreg ? upper : na
showLinregPlotLower = showLinreg ? lower : na
showLinregPlotBaseLine = showLinreg ? baseLine : na
linefill.new(showLinregPlotUpper, showLinregPlotBaseLine, color = colorUpper)
linefill.new(showLinregPlotBaseLine, showLinregPlotLower, color = colorLower)
// Pearson's R
var label r = na
label.delete(r )
if showPearsonInput and not na(pearsonR) and showLinreg
r := label.new(bar_index - lengthInput + 1, lowerStartPrice, str.tostring(pearsonR, "#.################"), color = color.new(color.white, 100), textcolor=color.new(colorUpper, 0), size=size.normal, style=label.style_label_up)
//Mavilim
group4 = "Mavilim Settings"
mavilimold = input(false, title="Show Previous Version of MavilimW?",group=group4)
fmal=input(3,"First Moving Average length",group = group4)
smal=input(5,"Second Moving Average length",group = group4)
tmal=fmal+smal
Fmal=smal+tmal
Ftmal=tmal+Fmal
Smal=Fmal+Ftmal
M1= ta.wma(close, fmal)
M2= ta.wma(M1, smal)
M3= ta.wma(M2, tmal)
M4= ta.wma(M3, Fmal)
M5= ta.wma(M4, Ftmal)
MAVW= ta.wma(M5, Smal)
col1= MAVW>MAVW
col3= MAVWpmaxsrc ? pmaxsrc-pmaxsrc : 0
vdd1=pmaxsrc
ma = 0.0
if mav == "SMA"
ma := ta.sma(pmaxsrc, length)
ma
if mav == "EMA"
ma := ta.ema(pmaxsrc, length)
ma
if mav == "WMA"
ma := ta.wma(pmaxsrc, length)
ma
if mav == "TMA"
ma := ta.sma(ta.sma(pmaxsrc, math.ceil(length / 2)), math.floor(length / 2) + 1)
ma
if mav == "VAR"
ma := VAR
ma
if mav == "WWMA"
ma := WWMA
ma
if mav == "ZLEMA"
ma := ZLEMA
ma
if mav == "TSF"
ma := TSF
ma
ma
MAvg=getMA(pmaxsrc, length)
longStop = Normalize ? MAvg - Multiplier*atr/close : MAvg - Multiplier*atr
longStopPrev = nz(longStop , longStop)
longStop := MAvg > longStopPrev ? math.max(longStop, longStopPrev) : longStop
shortStop = Normalize ? MAvg + Multiplier*atr/close : MAvg + Multiplier*atr
shortStopPrev = nz(shortStop , shortStop)
shortStop := MAvg < shortStopPrev ? math.min(shortStop, shortStopPrev) : shortStop
dir = 1
dir := nz(dir , dir)
dir := dir == -1 and MAvg > shortStopPrev ? 1 : dir == 1 and MAvg < longStopPrev ? -1 : dir
PMax = dir==1 ? longStop: shortStop
plot(showsupport ? MAvg : na, color=#fbff04, linewidth=2, title="EMA9")
pALL=plot(PMax, color=color.new(color.red, transp = 0), linewidth=2, title="PMax")
alertcondition(ta.cross(MAvg, PMax), title="Cross Alert", message="PMax - Moving Avg Crossing!")
alertcondition(ta.crossover(MAvg, PMax), title="Crossover Alarm", message="Moving Avg BUY SIGNAL!")
alertcondition(ta.crossunder(MAvg, PMax), title="Crossunder Alarm", message="Moving Avg SELL SIGNAL!")
alertcondition(ta.cross(pmaxsrc, PMax), title="Price Cross Alert", message="PMax - Price Crossing!")
alertcondition(ta.crossover(pmaxsrc, PMax), title="Price Crossover Alarm", message="PRICE OVER PMax - BUY SIGNAL!")
alertcondition(ta.crossunder(pmaxsrc, PMax), title="Price Crossunder Alarm", message="PRICE UNDER PMax - SELL SIGNAL!")
buySignalk = ta.crossover(MAvg, PMax)
plotshape(buySignalk and showsignalsk ? PMax*0.995 : na, title="Buy", text="Buy", location=location.absolute, style=shape.labelup, size=size.tiny, color=color.new(color.green, transp = 0), textcolor=color.white)
sellSignallk = ta.crossunder(MAvg, PMax)
plotshape(sellSignallk and showsignalsk ? PMax*1.005 : na, title="Sell", text="Sell", location=location.absolute, style=shape.labeldown, size=size.tiny, color=color.new(color.red, transp = 0), textcolor=color.white)
// buySignalc = ta.crossover(pmaxsrc, PMax)
// plotshape(buySignalc and showsignalsc ? PMax*0.995 : na, title="Buy", text="Buy", location=location.absolute, style=shape.labelup, size=size.tiny, color=#0F18BF, textcolor=color.white)
// sellSignallc = ta.crossunder(pmaxsrc, PMax)
// plotshape(sellSignallc and showsignalsc ? PMax*1.005 : na, title="Sell", text="Sell", location=location.absolute, style=shape.labeldown, size=size.tiny, color=#0F18BF, textcolor=color.white)
// mPlot = plot(ohlc4, title="", style=plot.style_circles, linewidth=0,display=display.none)
longFillColor = highlighting ? (MAvg>PMax ? color.new(color.green, transp = 90) : na) : na
shortFillColor = highlighting ? (MAvg math.exp(-(math.pow(x, 2)/(h * h * 2)))
//-----------------------------------------------------------------------------}
//Append lines
//-----------------------------------------------------------------------------{
n = bar_index
var ln = array.new_line(0)
if barstate.isfirst and repaint
for i = 0 to 499
array.push(ln,line.new(na,na,na,na))
//-----------------------------------------------------------------------------}
//End point method
//-----------------------------------------------------------------------------{
var coefs = array.new_float(0)
var den = 0.
if barstate.isfirst and not repaint
for i = 0 to 499
w = gauss(i, h)
coefs.push(w)
den := coefs.sum()
out = 0.
if not repaint
for i = 0 to 499
out += src * coefs.get(i)
out /= den
mae = ta.sma(math.abs(src - out), 499) * mult
upperN = out + mae
lowerN = out - mae
//-----------------------------------------------------------------------------}
//Compute and display NWE
//-----------------------------------------------------------------------------{
float y2 = na
float y1 = na
nwe = array.new(0)
if barstate.islast and repaint
sae = 0.
//Compute and set NWE point
for i = 0 to math.min(499,n - 1)
sum = 0.
sumw = 0.
//Compute weighted mean
for j = 0 to math.min(499,n - 1)
w = gauss(i - j, h)
sum += src * w
sumw += w
y2 := sum / sumw
sae += math.abs(src - y2)
nwe.push(y2)
sae := sae / math.min(499,n - 1) * mult
for i = 0 to math.min(499,n - 1)
if i%2 and showNadaray
line.new(n-i+1, y1 + sae, n-i, nwe.get(i) + sae, color = upCss)
line.new(n-i+1, y1 - sae, n-i, nwe.get(i) - sae, color = dnCss)
if src > nwe.get(i) + sae and src < nwe.get(i) + sae and showNadaray
label.new(n-i, src , '▼', color = color(na), style = label.style_label_down, textcolor = dnCss, textalign = text.align_center)
if src < nwe.get(i) - sae and src > nwe.get(i) - sae and showNadaray
label.new(n-i, src , '▲', color = color(na), style = label.style_label_up, textcolor = upCss, textalign = text.align_center)
y1 := nwe.get(i)
//-----------------------------------------------------------------------------}
//Dashboard
//-----------------------------------------------------------------------------{
var tb = table.new(position.top_right, 1, 1
, bgcolor = #1e222d
, border_color = #373a46
, border_width = 1
, frame_color = #373a46
, frame_width = 1)
if repaint
tb.cell(0, 0, 'Repainting Mode Enabled', text_color = color.white, text_size = size.small)
//-----------------------------------------------------------------------------}
//Plot
//-----------------------------------------------------------------------------}
// plot(repaint ? na : out + mae, 'Upper', upCss)
// plot(repaint ? na : out - mae, 'Lower', dnCss)
//Crossing Arrows
// plotshape(ta.crossunder(close, out - mae) ? low : na, "Crossunder", shape.labelup, location.absolute, color(na), 0 , text = '▲', textcolor = upCss, size = size.tiny)
// plotshape(ta.crossover(close, out + mae) ? high : na, "Crossover", shape.labeldown, location.absolute, color(na), 0 , text = '▼', textcolor = dnCss, size = size.tiny)
//-----------------------------------------------------------------------------}
//////////////////////////////////////////////////////////////////////////////////
enableD = input (true, "DIVERGANCE ON/OFF" , group="INDICATORS ON/OFF")
//DIVERGANCE
prd1 = input.int (defval=5 , title='PIVOT PERIOD' , minval=1, maxval=50 , group="DIVERGANCE")
source = input.string(defval='HIGH/LOW' , title='SOURCE FOR PIVOT POINTS' , options= , group="DIVERGANCE")
searchdiv = input.string(defval='REGULAR/HIDDEN', title='DIVERGANCE TYPE' , options= , group="DIVERGANCE")
showindis = input.string(defval='FULL' , title='SHOW INDICATORS NAME' , options= , group="DIVERGANCE")
showlimit = input.int(1 , title='MINIMUM NUMBER OF DIVERGANCES', minval=1, maxval=11 , group="DIVERGANCE")
maxpp = input.int (defval=20 , title='MAXIMUM PIVOT POINTS TO CHECK', minval=1, maxval=20 , group="DIVERGANCE")
maxbars = input.int (defval=200 , title='MAXIMUM BARS TO CHECK' , minval=30, maxval=200 , group="DIVERGANCE")
showlast = input (defval=false , title='SHOW ONLY LAST DIVERGANCE' , group="DIVERGANCE")
dontconfirm = input (defval=false , title="DON'T WAIT FOR CONFORMATION" , group="DIVERGANCE")
showlines = input (defval=false , title='SHOW DIVERGANCE LINES' , group="DIVERGANCE")
showpivot = input (defval=false , title='SHOW PIVOT POINTS' , group="DIVERGANCE")
calcmacd = input (defval=true , title='MACD' , group="DIVERGANCE")
calcmacda = input (defval=true , title='MACD HISTOGRAM' , group="DIVERGANCE")
calcrsi = input (defval=true , title='RSI' , group="DIVERGANCE")
calcstoc = input (defval=true , title='STOCHASTIC' , group="DIVERGANCE")
calccci = input (defval=true , title='CCI' , group="DIVERGANCE")
calcmom = input (defval=true , title='MOMENTUM' , group="DIVERGANCE")
calcobv = input (defval=true , title='OBV' , group="DIVERGANCE")
calcvwmacd = input (true , title='VWMACD' , group="DIVERGANCE")
calccmf = input (true , title='CHAIKIN MONEY FLOW' , group="DIVERGANCE")
calcmfi = input (true , title='MONEY FLOW INDEX' , group="DIVERGANCE")
calcext = input (false , title='CHECK EXTERNAL INDICATOR' , group="DIVERGANCE")
externalindi = input (defval=close , title='EXTERNAL INDICATOR' , group="DIVERGANCE")
pos_reg_div_col = input (defval=#ffffff , title='POSITIVE REGULAR DIVERGANCE' , group="DIVERGANCE")
neg_reg_div_col = input (defval=#00def6 , title='NEGATIVE REGULAR DIVERGANCE' , group="DIVERGANCE")
pos_hid_div_col = input (defval=#00ff0a , title='POSITIVE HIDDEN DIVERGANCE' , group="DIVERGANCE")
neg_hid_div_col = input (defval=#ff0015 , title='NEGATIVE HIDDEN DIVERGANCE' , group="DIVERGANCE")
reg_div_l_style_ = input.string(defval='SOLID' , title='REGULAR DIVERGANCE LINESTYLE' , options= , group="DIVERGANCE")
hid_div_l_style_ = input.string(defval='SOLID' , title='HIDDEN DIVERGANCE LINESTYLE' , options= , group="DIVERGANCE")
reg_div_l_width = input.int (defval=2 , title='REGULAR DIVERGANCE LINEWIDTH' , minval=1, maxval=5 , group="DIVERGANCE")
hid_div_l_width = input.int (defval=2 , title='HIDDEN DIVERGANCE LINEWIDTH' , minval=1, maxval=5 , group="DIVERGANCE")
showmas = input.bool (defval=false , title='SHOW MOVING AVERAGES (50 & 200)', inline='MA' , group="DIVERGANCE")
cma1col = input.color (defval=#ffffff , title='' , inline='MA' , group="DIVERGANCE")
cma2col = input.color (defval=#00def6 , title='' , inline='MA' , group="DIVERGANCE")
//PLOTS
plot(showmas ? ta.sma(close, 50) : na, color=showmas ? cma1col : na)
plot(showmas ? ta.sma(close, 200) : na, color=showmas ? cma2col : na)
var reg_div_l_style = reg_div_l_style_ == 'SOLID' ? line.style_solid : reg_div_l_style_ == 'DASHED' ? line.style_dashed : line.style_dotted
var hid_div_l_style = hid_div_l_style_ == 'SOLID' ? line.style_solid : hid_div_l_style_ == 'DASHED' ? line.style_dashed : line.style_dotted
rsi = ta.rsi(close, 14)
= ta.macd(close, 12, 26, 9)
moment = ta.mom(close, 10)
cci = ta.cci(close, 10)
Obv = ta.obv
stk = ta.sma(ta.stoch(close, high, low, 14), 3)
maFast = ta.vwma(close, 12)
maSlow = ta.vwma(close, 26)
vwmacd = maFast - maSlow
Cmfm = (close - low - (high - close)) / (high - low)
Cmfv = Cmfm * volume
cmf = ta.sma(Cmfv, 21) / ta.sma(volume, 21)
Mfi = ta.mfi(close, 14)
var indicators_name = array.new_string(11)
var div_colors = array.new_color(4)
if barstate.isfirst and enableD
array.set(indicators_name, 0, showindis == "DON'T SHOW" ? '' : '')
array.set(indicators_name, 1, showindis == "DON'T SHOW" ? '' : '')
array.set(indicators_name, 2, showindis == "DON'T SHOW" ? '' : '')
array.set(indicators_name, 3, showindis == "DON'T SHOW" ? '' : '')
array.set(indicators_name, 4, showindis == "DON'T SHOW" ? '' : '')
array.set(indicators_name, 5, showindis == "DON'T SHOW" ? '' : '')
array.set(indicators_name, 6, showindis == "DON'T SHOW" ? '' : '')
array.set(indicators_name, 7, showindis == "DON'T SHOW" ? '' : '')
array.set(indicators_name, 8, showindis == "DON'T SHOW" ? '' : '')
array.set(indicators_name, 9, showindis == "DON'T SHOW" ? '' : '')
array.set(indicators_name, 10, showindis == "DON'T SHOW" ? '' : '')
array.set(div_colors, 0, pos_reg_div_col)
array.set(div_colors, 1, neg_reg_div_col)
array.set(div_colors, 2, pos_hid_div_col)
array.set(div_colors, 3, neg_hid_div_col)
float ph1 = ta.pivothigh(source == 'CLOSE' ? close : high, prd1, prd1)
float pl1 = ta.pivotlow(source == 'CLOSE' ? close : low, prd1, prd1)
plotshape(ph1 and showpivot, text='H', style=shape.labeldown, color=color.new(color.white, 100), textcolor=#00def6, location=location.abovebar, offset=-prd1)
plotshape(pl1 and showpivot, text='L', style=shape.labelup, color=color.new(color.white, 100), textcolor=#ffffff, location=location.belowbar, offset=-prd1)
var int maxarraysize = 20
var ph_positions = array.new_int(maxarraysize, 0)
var pl_positions = array.new_int(maxarraysize, 0)
var ph_vals = array.new_float(maxarraysize, 0.)
var pl_vals = array.new_float(maxarraysize, 0.)
if ph1
array.unshift(ph_positions, bar_index)
array.unshift(ph_vals, ph1)
if array.size(ph_positions) > maxarraysize
array.pop(ph_positions)
array.pop(ph_vals)
if pl1
array.unshift(pl_positions, bar_index)
array.unshift(pl_vals, pl1)
if array.size(pl_positions) > maxarraysize
array.pop(pl_positions)
array.pop(pl_vals)
positive_regular_positive_hidden_divergence(src, cond) =>
divlen = 0
prsc = source == 'CLOSE' ? close : low
if dontconfirm or src > src or close > close
startpoint = dontconfirm ? 0 : 1
for x = 0 to maxpp - 1 by 1
len = bar_index - array.get(pl_positions, x) + prd1
if array.get(pl_positions, x) == 0 or len > maxbars
break
if len > 5 and (cond == 1 and src > src and prsc < nz(array.get(pl_vals, x)) or cond == 2 and src < src and prsc > nz(array.get(pl_vals, x)))
slope1 = (src - src ) / (len - startpoint)
virtual_line1 = src - slope1
slope2 = (close - close ) / (len - startpoint)
virtual_line2 = close - slope2
arrived = true
for y = 1 + startpoint to len - 1 by 1
if src < virtual_line1 or nz(close ) < virtual_line2
arrived := false
break
virtual_line1 -= slope1
virtual_line2 -= slope2
virtual_line2
if arrived
divlen := len
break
divlen
negative_regular_negative_hidden_divergence(src, cond) =>
divlen = 0
prsc = source == 'CLOSE' ? close : high
if dontconfirm or src < src or close < close
startpoint = dontconfirm ? 0 : 1
for x = 0 to maxpp - 1 by 1
len = bar_index - array.get(ph_positions, x) + prd1
if array.get(ph_positions, x) == 0 or len > maxbars
break
if len > 5 and (cond == 1 and src < src and prsc > nz(array.get(ph_vals, x)) or cond == 2 and src > src and prsc < nz(array.get(ph_vals, x)))
slope1 = (src - src ) / (len - startpoint)
virtual_line1 = src - slope1
slope2 = (close - nz(close )) / (len - startpoint)
virtual_line2 = close - slope2
arrived = true
for y = 1 + startpoint to len - 1 by 1
if src > virtual_line1 or nz(close ) > virtual_line2
arrived := false
break
virtual_line1 -= slope1
virtual_line2 -= slope2
virtual_line2
if arrived
divlen := len
break
divlen
//CALCULATIONS
calculate_divs(cond, indicator_1) =>
divs = array.new_int(4, 0)
array.set(divs, 0, cond and (searchdiv == 'REGULAR' or searchdiv == 'REGULAR/HIDDEN') ? positive_regular_positive_hidden_divergence(indicator_1, 1) : 0)
array.set(divs, 1, cond and (searchdiv == 'REGULAR' or searchdiv == 'REGULAR/HIDDEN') ? negative_regular_negative_hidden_divergence(indicator_1, 1) : 0)
array.set(divs, 2, cond and (searchdiv == 'HIDDEN' or searchdiv == 'REGULAR/HIDDEN') ? positive_regular_positive_hidden_divergence(indicator_1, 2) : 0)
array.set(divs, 3, cond and (searchdiv == 'HIDDEN' or searchdiv == 'REGULAR/HIDDEN') ? negative_regular_negative_hidden_divergence(indicator_1, 2) : 0)
divs
var all_divergences = array.new_int(44)
array_set_divs(div_pointer, index) =>
for x = 0 to 3 by 1
array.set(all_divergences, index * 4 + x, array.get(div_pointer, x))
array_set_divs(calculate_divs(calcmacd , macd) , 0)
array_set_divs(calculate_divs(calcmacda , deltamacd) , 1)
array_set_divs(calculate_divs(calcrsi , rsi) , 2)
array_set_divs(calculate_divs(calcstoc , stk) , 3)
array_set_divs(calculate_divs(calccci , cci) , 4)
array_set_divs(calculate_divs(calcmom , moment) , 5)
array_set_divs(calculate_divs(calcobv , Obv) , 6)
array_set_divs(calculate_divs(calcvwmacd, vwmacd) , 7)
array_set_divs(calculate_divs(calccmf , cmf) , 8)
array_set_divs(calculate_divs(calcmfi , Mfi) , 9)
array_set_divs(calculate_divs(calcext , externalindi), 10)
total_div = 0
for x = 0 to array.size(all_divergences) - 1 by 1
total_div += math.round(math.sign(array.get(all_divergences, x)))
total_div
if total_div < showlimit
array.fill(all_divergences, 0)
var pos_div_lines = array.new_line(0)
var neg_div_lines = array.new_line(0)
var pos_div_labels = array.new_label(0)
var neg_div_labels = array.new_label(0)
delete_old_pos_div_lines() =>
if array.size(pos_div_lines) > 0
for j = 0 to array.size(pos_div_lines) - 1 by 1
line.delete(array.get(pos_div_lines, j))
array.clear(pos_div_lines)
delete_old_neg_div_lines() =>
if array.size(neg_div_lines) > 0
for j = 0 to array.size(neg_div_lines) - 1 by 1
line.delete(array.get(neg_div_lines, j))
array.clear(neg_div_lines)
delete_old_pos_div_labels() =>
if array.size(pos_div_labels) > 0
for j = 0 to array.size(pos_div_labels) - 1 by 1
label.delete(array.get(pos_div_labels, j))
array.clear(pos_div_labels)
delete_old_neg_div_labels() =>
if array.size(neg_div_labels) > 0
for j = 0 to array.size(neg_div_labels) - 1 by 1
label.delete(array.get(neg_div_labels, j))
array.clear(neg_div_labels)
delete_last_pos_div_lines_label(n) =>
if n > 0 and array.size(pos_div_lines) >= n
asz = array.size(pos_div_lines)
for j = 1 to n by 1
line.delete(array.get(pos_div_lines, asz - j))
array.pop(pos_div_lines)
if array.size(pos_div_labels) > 0
label.delete(array.get(pos_div_labels, array.size(pos_div_labels) - 1))
array.pop(pos_div_labels)
delete_last_neg_div_lines_label(n) =>
if n > 0 and array.size(neg_div_lines) >= n
asz = array.size(neg_div_lines)
for j = 1 to n by 1
line.delete(array.get(neg_div_lines, asz - j))
array.pop(neg_div_lines)
if array.size(neg_div_labels) > 0
label.delete(array.get(neg_div_labels, array.size(neg_div_labels) - 1))
array.pop(neg_div_labels)
pos_reg_div_detected = false
neg_reg_div_detected = false
pos_hid_div_detected = false
neg_hid_div_detected = false
var last_pos_div_lines = 0
var last_neg_div_lines = 0
var remove_last_pos_divs = false
var remove_last_neg_divs = false
if pl1
remove_last_pos_divs := false
last_pos_div_lines := 0
last_pos_div_lines
if ph1
remove_last_neg_divs := false
last_neg_div_lines := 0
last_neg_div_lines
divergence_text_top = ''
divergence_text_bottom = ''
distances = array.new_int(0)
dnumdiv_top = 0
dnumdiv_bottom = 0
top_label_col = color.white
bottom_label_col = color.white
old_pos_divs_can_be_removed = true
old_neg_divs_can_be_removed = true
startpoint = dontconfirm ? 0 : 1
for x = 0 to 10 by 1
div_type = -1
for y = 0 to 3 by 1
if array.get(all_divergences, x * 4 + y) > 0
div_type := y
if y % 2 == 1
dnumdiv_top += 1
top_label_col := array.get(div_colors, y)
top_label_col
if y % 2 == 0
dnumdiv_bottom += 1
bottom_label_col := array.get(div_colors, y)
bottom_label_col
if not array.includes(distances, array.get(all_divergences, x * 4 + y))
array.push(distances, array.get(all_divergences, x * 4 + y))
new_line = showlines ? line.new(x1=bar_index - array.get(all_divergences, x * 4 + y), y1=source == 'CLOSE' ? close : y % 2 == 0 ? low : high , x2=bar_index - startpoint, y2=source == 'CLOSE' ? close : y % 2 == 0 ? low : high , color=array.get(div_colors, y), style=y < 2 ? reg_div_l_style : hid_div_l_style, width=y < 2 ? reg_div_l_width : hid_div_l_width) : na
if y % 2 == 0
if old_pos_divs_can_be_removed
old_pos_divs_can_be_removed := false
if not showlast and remove_last_pos_divs
delete_last_pos_div_lines_label(last_pos_div_lines)
last_pos_div_lines := 0
last_pos_div_lines
if showlast
delete_old_pos_div_lines()
array.push(pos_div_lines, new_line)
last_pos_div_lines += 1
remove_last_pos_divs := true
remove_last_pos_divs
if y % 2 == 1
if old_neg_divs_can_be_removed
old_neg_divs_can_be_removed := false
if not showlast and remove_last_neg_divs
delete_last_neg_div_lines_label(last_neg_div_lines)
last_neg_div_lines := 0
last_neg_div_lines
if showlast
delete_old_neg_div_lines()
array.push(neg_div_lines, new_line)
last_neg_div_lines += 1
remove_last_neg_divs := true
remove_last_neg_divs
if y == 0
pos_reg_div_detected := true
pos_reg_div_detected
if y == 1
neg_reg_div_detected := true
neg_reg_div_detected
if y == 2
pos_hid_div_detected := true
pos_hid_div_detected
if y == 3
neg_hid_div_detected := true
neg_hid_div_detected
if div_type >= 0
divergence_text_top += (div_type % 2 == 1 ? showindis != "DON'T SHOW" ? array.get(indicators_name, x) + '\n' : '' : '')
divergence_text_bottom += (div_type % 2 == 0 ? showindis != "DON'T SHOW" ? array.get(indicators_name, x) + '\n' : '' : '')
divergence_text_bottom
if showindis != "DON'T SHOW"
if dnumdiv_top > 0
divergence_text_top += str.tostring(dnumdiv_top)
divergence_text_top
if dnumdiv_bottom > 0
divergence_text_bottom += str.tostring(dnumdiv_bottom)
divergence_text_bottom
if divergence_text_top != ''
if showlast
delete_old_neg_div_labels()
array.push(neg_div_labels, label.new(x=bar_index, y=math.max(high, high ), color=top_label_col, style=label.style_diamond, size = size.auto))
if divergence_text_bottom != ''
if showlast
delete_old_pos_div_labels()
array.push(pos_div_labels, label.new(x=bar_index, y=math.min(low, low ), color=bottom_label_col, style=label.style_diamond, size = size.auto))
// POSITION AND SIZE
PosTable = input.string(defval="Bottom Right", title="Position", options= , group="Table Location & Size", inline="1")
SizTable = input.string(defval="Auto", title="Size", options= , group="Table Location & Size", inline="1")
Pos1Table = PosTable == "Top Right" ? position.top_right : PosTable == "Middle Right" ? position.middle_right : PosTable == "Bottom Right" ? position.bottom_right : PosTable == "Top Center" ? position.top_center : PosTable == "Middle Center" ? position.middle_center : PosTable == "Bottom Center" ? position.bottom_center : PosTable == "Top Left" ? position.top_left : PosTable == "Middle Left" ? position.middle_left : position.bottom_left
Siz1Table = SizTable == "Auto" ? size.auto : SizTable == "Huge" ? size.huge : SizTable == "Large" ? size.large : SizTable == "Normal" ? size.normal : SizTable == "Small" ? size.small : size.tiny
tbl = table.new(Pos1Table, 21, 16, border_width = 1, border_color = color.gray, frame_color = color.gray, frame_width = 1)
// Kullanıcı tarafından belirlenecek yeşil ve kırmızı zaman dilimi sayısı
greenThreshold = input.int(5, minval=1, maxval=10, title="Yeşil Zaman Dilimi Sayısı", group="Alarm Ayarları")
redThreshold = input.int(5, minval=1, maxval=10, title="Kırmızı Zaman Dilimi Sayısı", group="Alarm Ayarları")
// TIMEFRAMES OPTIONS
box01 = input.bool(true, "TF ", inline = "01", group="Select Timeframe")
tf01 = input.timeframe("1", "", inline = "01", group="Select Timeframe")
box02 = input.bool(false, "TF ", inline = "02", group="Select Timeframe")
tf02 = input.timeframe("3", "", inline = "02", group="Select Timeframe")
box03 = input.bool(true, "TF ", inline = "03", group="Select Timeframe")
tf03 = input.timeframe("5", "", inline = "03", group="Select Timeframe")
box04 = input.bool(true, "TF ", inline = "04", group="Select Timeframe")
tf04 = input.timeframe("15", "", inline = "04", group="Select Timeframe")
box05 = input.bool(false, "TF ", inline = "05", group="Select Timeframe")
tf05 = input.timeframe("30", "", inline = "05", group="Select Timeframe")
box06 = input.bool(true, "TF ", inline = "01", group="Select Timeframe")
tf06 = input.timeframe("60", "", inline = "01", group="Select Timeframe")
box07 = input.bool(false, "TF ", inline = "02", group="Select Timeframe")
tf07 = input.timeframe("120", "", inline = "02", group="Select Timeframe")
box08 = input.bool(false, "TF ", inline = "03", group="Select Timeframe")
tf08 = input.timeframe("180", "", inline = "03", group="Select Timeframe")
box09 = input.bool(true, "TF ", inline = "04", group="Select Timeframe")
tf09 = input.timeframe("240", "", inline = "04", group="Select Timeframe")
box10 = input.bool(false, "TF ", inline = "05", group="Select Timeframe")
tf10 = input.timeframe("D", "", inline = "05", group="Select Timeframe")
// indicator('Tillson FEMA', overlay=true)
length1 = input(1, 'FEMA Length')
a1 = input(0.7, 'Volume Factor')
e1 = ta.ema((high + low + 2 * close) / 4, length1)
e2 = ta.ema(e1, length1)
e3 = ta.ema(e2, length1)
e4 = ta.ema(e3, length1)
e5 = ta.ema(e4, length1)
e6 = ta.ema(e5, length1)
c1 = -a1 * a1 * a1
c2 = 3 * a1 * a1 + 3 * a1 * a1 * a1
c3 = -6 * a1 * a1 - 3 * a1 - 3 * a1 * a1 * a1
c4 = 1 + 3 * a1 + a1 * a1 * a1 + 3 * a1 * a1
FEMA = c1 * e6 + c2 * e5 + c3 * e4 + c4 * e3
tablocol1 = FEMA > FEMA
tablocol3 = FEMA < FEMA
color_1 = col1 ? color.rgb(149, 219, 35): col3 ? color.rgb(238, 11, 11) : color.yellow
plot(FEMA, color=color_1, linewidth=3, title='FEMA')
tilson1 = FEMA
tilson1a =FEMA
// DEFINITION OF VALUES
symbol = ticker.modify(syminfo.tickerid, syminfo.session)
tfArr = array.new(na)
tilson1Arr = array.new(na)
tilson1aArr = array.new(na)
// DEFINITIONS OF RSI & CCI FUNCTIONS APPENDED IN THE TIMEFRAME OPTIONS
cciNcciFun(tf, flg) =>
= request.security(symbol, tf, )
if flg and (barstate.isrealtime ? true : timeframe.in_seconds(timeframe.period) <= timeframe.in_seconds(tf))
array.push(tfArr, na(tf) ? timeframe.period : tf)
array.push(tilson1Arr, tilson_)
array.push(tilson1aArr, tilson1a_)
cciNcciFun(tf01, box01), cciNcciFun(tf02, box02), cciNcciFun(tf03, box03), cciNcciFun(tf04, box04),
cciNcciFun(tf05, box05), cciNcciFun(tf06, box06), cciNcciFun(tf07, box07), cciNcciFun(tf08, box08),
cciNcciFun(tf09, box09), cciNcciFun(tf10, box10)
// TABLE AND CELLS CONFIG
// Post Timeframe in format
tfTxt(x)=>
out = x
if not str.contains(x, "S") and not str.contains(x, "M") and
not str.contains(x, "W") and not str.contains(x, "D")
if str.tonumber(x)%60 == 0
out := str.tostring(str.tonumber(x)/60)+"H"
else
out := x + "m"
out
if barstate.islast
table.clear(tbl, 0, 0, 20, 15)
// TITLES
table.cell(tbl, 0, 0, "⏱", text_color=color.white, text_size=Siz1Table, bgcolor=#000000)
table.cell(tbl, 1, 0, "FEMA("+str.tostring(length1)+")", text_color=#FFFFFF, text_size=Siz1Table, bgcolor=#000000)
j = 1
greenCounter = 0 // Yeşil zaman dilimlerini saymak için bir sayaç
redCounter = 0
if array.size(tilson1Arr) > 0
for i = 0 to array.size(tilson1Arr) - 1
if not na(array.get(tilson1Arr, i))
//config values in the cells
TF_VALUE = array.get(tfArr,i)
tilson1VALUE = array.get(tilson1Arr, i)
tilson1aVALUE = array.get(tilson1aArr, i)
SIGNAL1 = tilson1VALUE >= tilson1aVALUE ? "▲" : tilson1VALUE <= tilson1aVALUE ? "▼" : na
// Yeşil oklar ve arka planı ayarla
greenArrowColor1 = SIGNAL1 == "▲" ? color.rgb(0, 255, 0) : color.rgb(255, 0, 0)
greenBgColor1 = SIGNAL1 == "▲" ? color.rgb(25, 70, 22) : color.rgb(93, 22, 22)
allGreen = tilson1VALUE >= tilson1aVALUE
allRed = tilson1VALUE <= tilson1aVALUE
// Determine background color for time text
timeBgColor = allGreen ? #194616 : (allRed ? #5D1616 : #000000)
txtColor = allGreen ? #00FF00 : (allRed ? #FF4500 : color.white)
if allGreen
greenCounter := greenCounter + 1
redCounter := 0
else if allRed
redCounter := redCounter + 1
greenCounter := 0
else
redCounter := 0
greenCounter := 0
// Dinamik pair değerini oluşturma
pair = "USDT_" + syminfo.basecurrency + "USDT"
// Bot ID için kullanıcı girişi
bot_id = input.int(12387976, title="Bot ID", minval=0,group ='3Comas Message', inline = '1') // Varsayılan değeri 12387976 olan bir tamsayı girişi alır
// E-posta tokenı için kullanıcı girişi
email_token = input("cd4111d4-549a-4759-a082-e8f45c91fa47", title="Email Token",group ='3Comas Message', inline = '1')
// USER INPUT FOR DELAY
delay_seconds = input.int(0, title="Delay Seconds", minval=0, maxval=86400,group ='3Comas Message', inline = '1')
// Dinamik mesajın oluşturulması
message = '{ "message_type": "bot", "bot_id": ' + str.tostring(bot_id) + ', "email_token": "' + email_token + '", "delay_seconds": ' + str.tostring(delay_seconds) + ', "pair": "' + pair + '"}'
// Kullanıcının belirlediği yeşil veya kırmızı zaman dilimi sayısına ulaşıldığında alarmı tetikle
if greenCounter >= greenThreshold
alert(message, alert.freq_once_per_bar_close)
// if redCounter >= redThreshold
// alert(message, alert.freq_once_per_bar_close)
// Kullanıcının belirlediği yeşil veya kırmızı zaman dilimi sayısına ulaşıldığında alarmı tetikle
// if greenCounter >= greenThreshold
// alert("Yeşil zaman dilimi sayısı " + str.tostring(greenThreshold) + " adede ulaştı", alert.freq_once_per_bar_close)
// if redCounter >= redThreshold
// alert("Kırmızı zaman dilimi sayısı " + str.tostring(redThreshold) + " adede ulaştı", alert.freq_once_per_bar_close)
table.cell(tbl, 0, j, tfTxt(TF_VALUE), text_color=txtColor, text_halign=text.align_left, text_size=Siz1Table, bgcolor=timeBgColor)
table.cell(tbl, 1, j, str.tostring(tilson1VALUE, "#.#######")+SIGNAL1, text_color=greenArrowColor1, text_halign=text.align_right, text_size=Siz1Table, bgcolor=greenBgColor1)
j += 1
prd = input.int(defval=10, title='Pivot Period', minval=4, maxval=30, group='Setup')
ppsrc = input.string(defval='High/Low', title='Source', options= , group='Setup')
maxnumpp = input.int(defval=20, title=' Maximum Number of Pivot', minval=5, maxval=100, group='Setup')
ChannelW = input.int(defval=10, title='Maximum Channel Width %', minval=1, group='Setup')
maxnumsr = input.int(defval=5, title=' Maximum Number of S/R', minval=1, maxval=10, group='Setup')
min_strength = input.int(defval=2, title=' Minimum Strength', minval=1, maxval=10, group='Setup')
labelloc = input.int(defval=20, title='Label Location', group='Colors', tooltip='Positive numbers reference future bars, negative numbers reference histical bars')
linestyle = input.string(defval='Dashed', title='Line Style', options= , group='Colors')
linewidth = input.int(defval=2, title='Line Width', minval=1, maxval=4, group='Colors')
resistancecolor = input.color(defval=color.red, title='Resistance Color', group='Colors')
supportcolor = input.color(defval=color.lime, title='Support Color', group='Colors')
showpp = input(false, title='Show Point Points')
float src1 = ppsrc == 'High/Low' ? high : math.max(close, open)
float src2 = ppsrc == 'High/Low' ? low : math.min(close, open)
float ph = ta.pivothigh(src1, prd, prd)
float pl = ta.pivotlow(src2, prd, prd)
plotshape(ph and showpp, text='H', style=shape.labeldown, color=na, textcolor=color.new(color.red, 0), location=location.abovebar, offset=-prd)
plotshape(pl and showpp, text='L', style=shape.labelup, color=na, textcolor=color.new(color.lime, 0), location=location.belowbar, offset=-prd)
Lstyle = linestyle == 'Dashed' ? line.style_dashed : linestyle == 'Solid' ? line.style_solid : line.style_dotted
//calculate maximum S/R channel zone width
prdhighest = ta.highest(300)
prdlowest = ta.lowest(300)
cwidth = (prdhighest - prdlowest) * ChannelW / 100
var pivotvals = array.new_float(0)
if ph or pl
array.unshift(pivotvals, ph ? ph : pl)
if array.size(pivotvals) > maxnumpp // limit the array size
array.pop(pivotvals)
get_sr_vals(ind) =>
float lo = array.get(pivotvals, ind)
float hi = lo
int numpp = 0
for y = 0 to array.size(pivotvals) - 1 by 1
float cpp = array.get(pivotvals, y)
float wdth = cpp <= lo ? hi - cpp : cpp - lo
if wdth <= cwidth // fits the max channel width?
if cpp <= hi
lo := math.min(lo, cpp)
else
hi := math.max(hi, cpp)
numpp += 1
numpp
var sr_up_level = array.new_float(0)
var sr_dn_level = array.new_float(0)
sr_strength = array.new_float(0)
find_loc(strength) =>
ret = array.size(sr_strength)
for i = ret > 0 ? array.size(sr_strength) - 1 : na to 0 by 1
if strength <= array.get(sr_strength, i)
break
ret := i
ret
ret
check_sr(hi, lo, strength) =>
ret = true
for i = 0 to array.size(sr_up_level) > 0 ? array.size(sr_up_level) - 1 : na by 1
//included?
if array.get(sr_up_level, i) >= lo and array.get(sr_up_level, i) <= hi or array.get(sr_dn_level, i) >= lo and array.get(sr_dn_level, i) <= hi
if strength >= array.get(sr_strength, i)
array.remove(sr_strength, i)
array.remove(sr_up_level, i)
array.remove(sr_dn_level, i)
ret
else
ret := false
ret
break
ret
var sr_lines = array.new_line(11, na)
var sr_labels = array.new_label(11, na)
for x = 1 to 10 by 1
rate = 100 * (label.get_y(array.get(sr_labels, x)) - close) / close
label.set_text(array.get(sr_labels, x), text=str.tostring(label.get_y(array.get(sr_labels, x))) + '(' + str.tostring(rate, '#.##') + '%)')
label.set_x(array.get(sr_labels, x), x=bar_index + labelloc)
label.set_color(array.get(sr_labels, x), color=label.get_y(array.get(sr_labels, x)) >= close ? color.red : color.lime)
label.set_textcolor(array.get(sr_labels, x), textcolor=label.get_y(array.get(sr_labels, x)) >= close ? color.white : color.black)
label.set_style(array.get(sr_labels, x), style=label.get_y(array.get(sr_labels, x)) >= close ? label.style_label_down : label.style_label_up)
line.set_color(array.get(sr_lines, x), color=line.get_y1(array.get(sr_lines, x)) >= close ? resistancecolor : supportcolor)
if ph or pl
//because of new calculation, remove old S/R levels
array.clear(sr_up_level)
array.clear(sr_dn_level)
array.clear(sr_strength)
//find S/R zones
for x = 0 to array.size(pivotvals) - 1 by 1
= get_sr_vals(x)
if check_sr(hi, lo, strength)
loc = find_loc(strength)
// if strength is in first maxnumsr sr then insert it to the arrays
if loc < maxnumsr and strength >= min_strength
array.insert(sr_strength, loc, strength)
array.insert(sr_up_level, loc, hi)
array.insert(sr_dn_level, loc, lo)
// keep size of the arrays = 5
if array.size(sr_strength) > maxnumsr
array.pop(sr_strength)
array.pop(sr_up_level)
array.pop(sr_dn_level)
for x = 1 to 10 by 1
line.delete(array.get(sr_lines, x))
label.delete(array.get(sr_labels, x))
for x = 0 to array.size(sr_up_level) > 0 ? array.size(sr_up_level) - 1 : na by 1
float mid = math.round_to_mintick((array.get(sr_up_level, x) + array.get(sr_dn_level, x)) / 2)
rate = 100 * (mid - close) / close
array.set(sr_labels, x + 1, label.new(x=bar_index + labelloc, y=mid, text=str.tostring(mid) + '(' + str.tostring(rate, '#.##') + '%)', color=mid >= close ? color.red : color.lime, textcolor=mid >= close ? color.white : color.black, style=mid >= close ? label.style_label_down : label.style_label_up))
array.set(sr_lines, x + 1, line.new(x1=bar_index, y1=mid, x2=bar_index - 1, y2=mid, extend=extend.both, color=mid >= close ? resistancecolor : supportcolor, style=Lstyle, width=linewidth))
f_crossed_over() =>
ret = false
for x = 0 to array.size(sr_up_level) > 0 ? array.size(sr_up_level) - 1 : na by 1
float mid = math.round_to_mintick((array.get(sr_up_level, x) + array.get(sr_dn_level, x)) / 2)
if close <= mid and close > mid
ret := true
ret
ret
f_crossed_under() =>
ret = false
for x = 0 to array.size(sr_up_level) > 0 ? array.size(sr_up_level) - 1 : na by 1
float mid = math.round_to_mintick((array.get(sr_up_level, x) + array.get(sr_dn_level, x)) / 2)
if close >= mid and close < mid
ret := true
ret
ret
alertcondition(f_crossed_over(), title='Resistance Broken', message='Resistance Broken')
alertcondition(f_crossed_under(), title='Support Broken', message='Support Broken')

DrawingLibrary "Drawing"
User Defined types and methods for basic drawing structure. Consolidated from the earlier libraries - DrawingTypes and DrawingMethods
method get_price(this, bar)
get line price based on bar
Namespace types: Line
Parameters:
this (Line) : (series Line) Line object.
bar (int) : (series/int) bar at which line price need to be calculated
Returns: line price at given bar.
method init(this)
Namespace types: PolyLine
Parameters:
this (PolyLine)
method tostring(this, sortKeys, sortOrder, includeKeys)
Converts DrawingTypes/Point object to string representation
Namespace types: chart.point
Parameters:
this (chart.point) : DrawingTypes/Point object
sortKeys (bool) : If set to true, string output is sorted by keys.
sortOrder (int) : Applicable only if sortKeys is set to true. Positive number will sort them in ascending order whreas negative numer will sort them in descending order. Passing 0 will not sort the keys
includeKeys (array) : Array of string containing selective keys. Optional parmaeter. If not provided, all the keys are considered
Returns: string representation of DrawingTypes/Point
method tostring(this, sortKeys, sortOrder, includeKeys)
Converts DrawingTypes/LineProperties object to string representation
Namespace types: LineProperties
Parameters:
this (LineProperties) : DrawingTypes/LineProperties object
sortKeys (bool) : If set to true, string output is sorted by keys.
sortOrder (int) : Applicable only if sortKeys is set to true. Positive number will sort them in ascending order whreas negative numer will sort them in descending order. Passing 0 will not sort the keys
includeKeys (array) : Array of string containing selective keys. Optional parmaeter. If not provided, all the keys are considered
Returns: string representation of DrawingTypes/LineProperties
method tostring(this, sortKeys, sortOrder, includeKeys)
Converts DrawingTypes/Line object to string representation
Namespace types: Line
Parameters:
this (Line) : DrawingTypes/Line object
sortKeys (bool) : If set to true, string output is sorted by keys.
sortOrder (int) : Applicable only if sortKeys is set to true. Positive number will sort them in ascending order whreas negative numer will sort them in descending order. Passing 0 will not sort the keys
includeKeys (array) : Array of string containing selective keys. Optional parmaeter. If not provided, all the keys are considered
Returns: string representation of DrawingTypes/Line
method tostring(this, sortKeys, sortOrder, includeKeys)
Converts DrawingTypes/LabelProperties object to string representation
Namespace types: LabelProperties
Parameters:
this (LabelProperties) : DrawingTypes/LabelProperties object
sortKeys (bool) : If set to true, string output is sorted by keys.
sortOrder (int) : Applicable only if sortKeys is set to true. Positive number will sort them in ascending order whreas negative numer will sort them in descending order. Passing 0 will not sort the keys
includeKeys (array) : Array of string containing selective keys. Optional parmaeter. If not provided, all the keys are considered
Returns: string representation of DrawingTypes/LabelProperties
method tostring(this, sortKeys, sortOrder, includeKeys)
Converts DrawingTypes/Label object to string representation
Namespace types: Label
Parameters:
this (Label) : DrawingTypes/Label object
sortKeys (bool) : If set to true, string output is sorted by keys.
sortOrder (int) : Applicable only if sortKeys is set to true. Positive number will sort them in ascending order whreas negative numer will sort them in descending order. Passing 0 will not sort the keys
includeKeys (array) : Array of string containing selective keys. Optional parmaeter. If not provided, all the keys are considered
Returns: string representation of DrawingTypes/Label
method tostring(this, sortKeys, sortOrder, includeKeys)
Converts DrawingTypes/Linefill object to string representation
Namespace types: Linefill
Parameters:
this (Linefill) : DrawingTypes/Linefill object
sortKeys (bool) : If set to true, string output is sorted by keys.
sortOrder (int) : Applicable only if sortKeys is set to true. Positive number will sort them in ascending order whreas negative numer will sort them in descending order. Passing 0 will not sort the keys
includeKeys (array) : Array of string containing selective keys. Optional parmaeter. If not provided, all the keys are considered
Returns: string representation of DrawingTypes/Linefill
method tostring(this, sortKeys, sortOrder, includeKeys)
Converts DrawingTypes/BoxProperties object to string representation
Namespace types: BoxProperties
Parameters:
this (BoxProperties) : DrawingTypes/BoxProperties object
sortKeys (bool) : If set to true, string output is sorted by keys.
sortOrder (int) : Applicable only if sortKeys is set to true. Positive number will sort them in ascending order whreas negative numer will sort them in descending order. Passing 0 will not sort the keys
includeKeys (array) : Array of string containing selective keys. Optional parmaeter. If not provided, all the keys are considered
Returns: string representation of DrawingTypes/BoxProperties
method tostring(this, sortKeys, sortOrder, includeKeys)
Converts DrawingTypes/BoxText object to string representation
Namespace types: BoxText
Parameters:
this (BoxText) : DrawingTypes/BoxText object
sortKeys (bool) : If set to true, string output is sorted by keys.
sortOrder (int) : Applicable only if sortKeys is set to true. Positive number will sort them in ascending order whreas negative numer will sort them in descending order. Passing 0 will not sort the keys
includeKeys (array) : Array of string containing selective keys. Optional parmaeter. If not provided, all the keys are considered
Returns: string representation of DrawingTypes/BoxText
method tostring(this, sortKeys, sortOrder, includeKeys)
Converts DrawingTypes/Box object to string representation
Namespace types: Box
Parameters:
this (Box) : DrawingTypes/Box object
sortKeys (bool) : If set to true, string output is sorted by keys.
sortOrder (int) : Applicable only if sortKeys is set to true. Positive number will sort them in ascending order whreas negative numer will sort them in descending order. Passing 0 will not sort the keys
includeKeys (array) : Array of string containing selective keys. Optional parmaeter. If not provided, all the keys are considered
Returns: string representation of DrawingTypes/Box
method delete(this)
Deletes line from DrawingTypes/Line object
Namespace types: Line
Parameters:
this (Line) : DrawingTypes/Line object
Returns: Line object deleted
method delete(this)
Deletes label from DrawingTypes/Label object
Namespace types: Label
Parameters:
this (Label) : DrawingTypes/Label object
Returns: Label object deleted
method delete(this)
Deletes Linefill from DrawingTypes/Linefill object
Namespace types: Linefill
Parameters:
this (Linefill) : DrawingTypes/Linefill object
Returns: Linefill object deleted
method delete(this)
Deletes box from DrawingTypes/Box object
Namespace types: Box
Parameters:
this (Box) : DrawingTypes/Box object
Returns: DrawingTypes/Box object deleted
method delete(this)
Deletes lines from array of DrawingTypes/Line objects
Namespace types: array
Parameters:
this (array) : Array of DrawingTypes/Line objects
Returns: Array of DrawingTypes/Line objects
method delete(this)
Deletes labels from array of DrawingTypes/Label objects
Namespace types: array
Parameters:
this (array) : Array of DrawingTypes/Label objects
Returns: Array of DrawingTypes/Label objects
method delete(this)
Deletes linefill from array of DrawingTypes/Linefill objects
Namespace types: array
Parameters:
this (array) : Array of DrawingTypes/Linefill objects
Returns: Array of DrawingTypes/Linefill objects
method delete(this)
Deletes boxes from array of DrawingTypes/Box objects
Namespace types: array
Parameters:
this (array) : Array of DrawingTypes/Box objects
Returns: Array of DrawingTypes/Box objects
method clear(this)
clear items from array of DrawingTypes/Line while deleting underlying objects
Namespace types: array
Parameters:
this (array) : array
Returns: void
method clear(this)
clear items from array of DrawingTypes/Label while deleting underlying objects
Namespace types: array
Parameters:
this (array) : array
Returns: void
method clear(this)
clear items from array of DrawingTypes/Linefill while deleting underlying objects
Namespace types: array
Parameters:
this (array) : array
Returns: void
method clear(this)
clear items from array of DrawingTypes/Box while deleting underlying objects
Namespace types: array
Parameters:
this (array) : array
Returns: void
method draw(this)
Creates line from DrawingTypes/Line object
Namespace types: Line
Parameters:
this (Line) : DrawingTypes/Line object
Returns: line created from DrawingTypes/Line object
method draw(this)
Creates lines from array of DrawingTypes/Line objects
Namespace types: array
Parameters:
this (array) : Array of DrawingTypes/Line objects
Returns: Array of DrawingTypes/Line objects
method draw(this)
Creates label from DrawingTypes/Label object
Namespace types: Label
Parameters:
this (Label) : DrawingTypes/Label object
Returns: label created from DrawingTypes/Label object
method draw(this)
Creates labels from array of DrawingTypes/Label objects
Namespace types: array
Parameters:
this (array) : Array of DrawingTypes/Label objects
Returns: Array of DrawingTypes/Label objects
method draw(this)
Creates linefill object from DrawingTypes/Linefill
Namespace types: Linefill
Parameters:
this (Linefill) : DrawingTypes/Linefill objects
Returns: linefill object created
method draw(this)
Creates linefill objects from array of DrawingTypes/Linefill objects
Namespace types: array
Parameters:
this (array) : Array of DrawingTypes/Linefill objects
Returns: Array of DrawingTypes/Linefill used for creating linefills
method draw(this)
Creates box from DrawingTypes/Box object
Namespace types: Box
Parameters:
this (Box) : DrawingTypes/Box object
Returns: box created from DrawingTypes/Box object
method draw(this)
Creates labels from array of DrawingTypes/Label objects
Namespace types: array
Parameters:
this (array) : Array of DrawingTypes/Label objects
Returns: Array of DrawingTypes/Label objects
method createLabel(this, lblText, tooltip, properties)
Creates DrawingTypes/Label object from DrawingTypes/Point
Namespace types: chart.point
Parameters:
this (chart.point) : DrawingTypes/Point object
lblText (string) : Label text
tooltip (string) : Tooltip text. Default is na
properties (LabelProperties) : DrawingTypes/LabelProperties object. Default is na - meaning default values are used.
Returns: DrawingTypes/Label object
method createLine(this, other, properties)
Creates DrawingTypes/Line object from one DrawingTypes/Point to other
Namespace types: chart.point
Parameters:
this (chart.point) : First DrawingTypes/Point object
other (chart.point) : Second DrawingTypes/Point object
properties (LineProperties) : DrawingTypes/LineProperties object. Default set to na - meaning default values are used.
Returns: DrawingTypes/Line object
method createLinefill(this, other, fillColor, transparency)
Creates DrawingTypes/Linefill object from DrawingTypes/Line object to other DrawingTypes/Line object
Namespace types: Line
Parameters:
this (Line) : First DrawingTypes/Line object
other (Line) : Other DrawingTypes/Line object
fillColor (color) : fill color of linefill. Default is color.blue
transparency (int) : fill transparency for linefill. Default is 80
Returns: Array of DrawingTypes/Linefill object
method createBox(this, other, properties, textProperties)
Creates DrawingTypes/Box object from one DrawingTypes/Point to other
Namespace types: chart.point
Parameters:
this (chart.point) : First DrawingTypes/Point object
other (chart.point) : Second DrawingTypes/Point object
properties (BoxProperties) : DrawingTypes/BoxProperties object. Default set to na - meaning default values are used.
textProperties (BoxText) : DrawingTypes/BoxText object. Default is na - meaning no text will be drawn
Returns: DrawingTypes/Box object
method createBox(this, properties, textProperties)
Creates DrawingTypes/Box object from DrawingTypes/Line as diagonal line
Namespace types: Line
Parameters:
this (Line) : Diagonal DrawingTypes/PoLineint object
properties (BoxProperties) : DrawingTypes/BoxProperties object. Default set to na - meaning default values are used.
textProperties (BoxText) : DrawingTypes/BoxText object. Default is na - meaning no text will be drawn
Returns: DrawingTypes/Box object
LineProperties
Properties of line object
Fields:
xloc (series string) : X Reference - can be either xloc.bar_index or xloc.bar_time. Default is xloc.bar_index
extend (series string) : Property which sets line to extend towards either right or left or both. Valid values are extend.right, extend.left, extend.both, extend.none. Default is extend.none
color (series color) : Line color
style (series string) : Line style, valid values are line.style_solid, line.style_dashed, line.style_dotted, line.style_arrow_left, line.style_arrow_right, line.style_arrow_both. Default is line.style_solid
width (series int) : Line width. Default is 1
Line
Line object created from points
Fields:
start (chart.point) : Starting point of the line
end (chart.point) : Ending point of the line
properties (LineProperties) : LineProperties object which defines the style of line
object (series line) : Derived line object
LabelProperties
Properties of label object
Fields:
xloc (series string) : X Reference - can be either xloc.bar_index or xloc.bar_time. Default is xloc.bar_index
yloc (series string) : Y reference - can be yloc.price, yloc.abovebar, yloc.belowbar. Default is yloc.price
color (series color) : Label fill color
style (series string) : Label style as defined in Tradingview Documentation. Default is label.style_none
textcolor (series color) : text color. Default is color.black
size (series string) : Label text size. Default is size.normal. Other values are size.auto, size.tiny, size.small, size.normal, size.large, size.huge
textalign (series string) : Label text alignment. Default if text.align_center. Other allowed values - text.align_right, text.align_left, text.align_top, text.align_bottom
text_font_family (series string) : The font family of the text. Default value is font.family_default. Other available option is font.family_monospace
Label
Label object
Fields:
point (chart.point) : Point where label is drawn
lblText (series string) : label text
tooltip (series string) : Tooltip text. Default is na
properties (LabelProperties) : LabelProperties object
object (series label) : Pine label object
Linefill
Linefill object
Fields:
line1 (Line) : First line to create linefill
line2 (Line) : Second line to create linefill
fillColor (series color) : Fill color
transparency (series int) : Fill transparency range from 0 to 100
object (series linefill) : linefill object created from wrapper
BoxProperties
BoxProperties object
Fields:
border_color (series color) : Box border color. Default is color.blue
bgcolor (series color) : box background color
border_width (series int) : Box border width. Default is 1
border_style (series string) : Box border style. Default is line.style_solid
extend (series string) : Extend property of box. default is extend.none
xloc (series string) : defines if drawing needs to be done based on bar index or time. default is xloc.bar_index
BoxText
Box Text properties.
Fields:
boxText (series string) : Text to be printed on the box
text_size (series string) : Text size. Default is size.auto
text_color (series color) : Box text color. Default is color.yellow.
text_halign (series string) : horizontal align style - default is text.align_center
text_valign (series string) : vertical align style - default is text.align_center
text_wrap (series string) : text wrap style - default is text.wrap_auto
text_font_family (series string) : Text font. Default is
Box
Box object
Fields:
p1 (chart.point) : Diagonal point one
p2 (chart.point) : Diagonal point two
properties (BoxProperties) : Box properties
textProperties (BoxText) : Box text properties
object (series box) : Box object created
PolyLineProperties
Fields:
curved (series bool)
closed (series bool)
xloc (series string)
lineColor (series color)
fillColor (series color)
lineStyle (series string)
lineWidth (series int)
PolyLine
Fields:
points (array)
properties (PolyLineProperties)
object (series polyline)
DrawingTypesLibrary "DrawingTypes"
User Defined Types for basic drawing structure. Other types and methods will be built on these.
Point
Point refers to point on chart
Fields:
price : pivot price
bar : pivot bar
bartime : pivot bar time
LineProperties
Properties of line object
Fields:
xloc : X Reference - can be either xloc.bar_index or xloc.bar_time. Default is xloc.bar_index
extend : Property which sets line to extend towards either right or left or both. Valid values are extend.right, extend.left, extend.both, extend.none. Default is extend.none
color : Line color
style : Line style, valid values are line.style_solid, line.style_dashed, line.style_dotted, line.style_arrow_left, line.style_arrow_right, line.style_arrow_both. Default is line.style_solid
width : Line width. Default is 1
Line
Line object created from points
Fields:
start : Starting point of the line
end : Ending point of the line
properties : LineProperties object which defines the style of line
object : Derived line object
LabelProperties
Properties of label object
Fields:
xloc : X Reference - can be either xloc.bar_index or xloc.bar_time. Default is xloc.bar_index
yloc : Y reference - can be yloc.price, yloc.abovebar, yloc.belowbar. Default is yloc.price
color : Label fill color
style : Label style as defined in www.tradingview.com Default is label.style_none
textcolor : text color. Default is color.black
size : Label text size. Default is size.normal. Other values are size.auto, size.tiny, size.small, size.normal, size.large, size.huge
textalign : Label text alignment. Default if text.align_center. Other allowed values - text.align_right, text.align_left, text.align_top, text.align_bottom
text_font_family : The font family of the text. Default value is font.family_default. Other available option is font.family_monospace
Label
Label object
Fields:
point : Point where label is drawn
lblText : label text
tooltip : Tooltip text. Default is na
properties : LabelProperties object
object : Pine label object
Linefill
Linefill object
Fields:
line1 : First line to create linefill
line2 : Second line to create linefill
fillColor : Fill color
transparency : Fill transparency range from 0 to 100
object : linefill object created from wrapper
BoxProperties
BoxProperties object
Fields:
border_color : Box border color. Default is color.blue
bgcolor : box background color
border_width : Box border width. Default is 1
border_style : Box border style. Default is line.style_solid
extend : Extend property of box. default is extend.none
xloc : defines if drawing needs to be done based on bar index or time. default is xloc.bar_index
BoxText
Box Text properties.
Fields:
boxText : Text to be printed on the box
text_size : Text size. Default is size.auto
text_color : Box text color. Default is color.yellow.
text_halign : horizontal align style - default is text.align_center
text_valign : vertical align style - default is text.align_center
text_wrap : text wrap style - default is text.wrap_auto
text_font_family : Text font. Default is
Box
Box object
Fields:
p1 : Diagonal point one
p2 : Diagonal point two
properties : Box properties
textProperties : Box text properties
object : Box object created
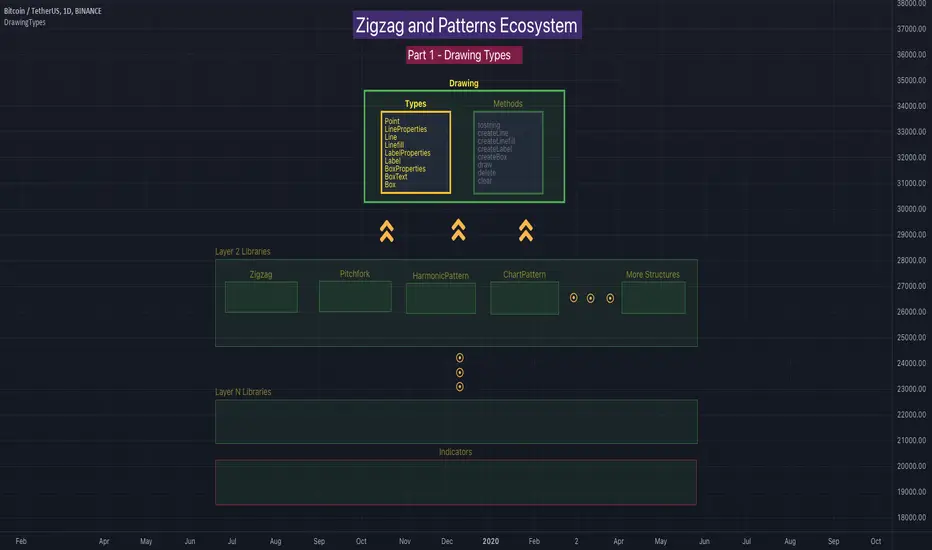
ObjectHelpersLibrary "ObjectHelpers"
Line | Box | Label | Linefill -- Maker, Setter, Getter Library
TODO: add table functionality
set(object)
set all params for `line`, `box`, `label`, `linefill` objects with 1 function
***
## Overloaded
***
```
method set(line Line, int x1=na, float y1=na, int x2=na, float y2=na,string xloc=na,string extend=na,color color=na,string style=na,int width=na,bool update=na) => line
```
### Params
- **Line** `line` - line object | `required`
- **x1** `int` - value to set x1
- **y1** `float` - value to set y1
- **x2** `int` - value to set x2
- **y2** `float` - value to set y2
- **xloc** `int` - value to set xloc
- **yloc** `int` - value to set yloc
- **extend** `string` - value to set extend
- **color** `color` - value to set color
- **style** `string` - value to set style
- **width** `int` - value to set width
- **update** `bool` - value to set update
***
```
method set(box Box,int left=na,float top=na,int right=na, float bottom=na,color bgcolor=na,color border_color=na,string border_style=na,int border_width=na,string extend=na,string txt=na,color text_color=na,string text_font_family=na,string text_halign=na,string text_valign=na,string text_wrap=na,bool update=false) => box
```
### Params
- **Box** `box` - box object
- **left** `int` - value to set left
- **top** `float` - value to set top
- **right** `int` - value to set right
- **bottom** `float` - value to set bottom
- **bgcolor** `color` - value to set bgcolor
- **border_color** `color` - value to set border_color
- **border_style** `string` - value to set border_style
- **border_width** `int` - value to set border_width
- **extend** `string` - value to set extend
- **txt** `string` - value to set _text
- **text_color** `color` - value to set text_color
- **text_font_family** `string` - value to set text_font_family
- **text_halign** `string` - value to set text_halign
- **text_valign** `string` - value to set text_valign
- **text_wrap** `string` - value to set text_wrap
- **update** `bool` - value to set update
***
```
method set(label Label,int x=na,float y=na, string txt=na,string xloc=na,color color=na,color textcolor=na,string size=na,string style=na,string textalign=na,string tooltip=na,string text_font_family=na,bool update=false) => label
```
### Paramas
- **Label** `label` - label object
- **x** `int` - value to set x
- **y** `float` - value to set y
- **txt** `string` - value to set text add`"+++"` to the _text striing to have the current label text concatenated to the location of the "+++")
- **textcolor** `color` - value to set textcolor
- **size** `string` - value to set size
- **style** `string` - value to set style (use "flip" ,as the style to have label flip to top or bottom of bar depending on if open > close and vice versa)
- **text_font_family** `string` - value to set text_font_family
- **textalign** `string` - value to set textalign
- **tooltip** `string` - value to set tooltip
- **update** `bool` - update label to next bar
***
```
method set(linefill Linefill=na,line line1=na,line line2=na,color color=na) => linefill
```
### Params
- **linefill** `linefill` - linefill object
- **line1** `line` - line object
- **line2** `line` - line object
- **color** `color` - color
Parameters:
object (obj)
Returns: `line`, `box`, `label`, `linefill`
method set(Line, x1, y1, x2, y2, xloc, extend, color, style, width, update)
set the location params of a line with 1 function auto detects time or bar_index for xloc param
Namespace types: series line
Parameters:
Line (line) : `line` - line object | `required`
x1 (int) : `int` - value to set x1
y1 (float) : `float` - value to set y1
x2 (int) : `int` - value to set x2
y2 (float) : `float` - value to set y2
xloc (string) : `int` - value to set xloc
extend (string) : `string` - value to set extend
color (color) : `color` - value to set color
style (string) : `string` - value to set style
width (int) : `int` - value to set width
update (bool) : `bool` - value to set update
Returns: `line`
method set(Box, left, top, right, bottom, bgcolor, border_color, border_style, border_width, extend, txt, text_color, text_font_family, text_halign, text_valign, text_wrap, update)
set the location params of a box with 1 function
Namespace types: series box
Parameters:
Box (box) : `box` - box object | `required`
left (int) : `int` - value to set left
top (float) : `float` - value to set top
right (int) : `int` - value to set right
bottom (float) : `float` - value to set bottom
bgcolor (color) : `color` - value to set bgcolor
border_color (color) : `color` - value to set border_color
border_style (string) : `string` - value to set border_style
border_width (int) : `int` - value to set border_width
extend (string) : `string` - value to set extend
txt (string) : `string` - value to set _text
text_color (color) : `color` - value to set text_color
text_font_family (string) : `string` - value to set text_font_family
text_halign (string) : `string` - value to set text_halign
text_valign (string) : `string` - value to set text_valign
text_wrap (string) : `string` - value to set text_wrap
update (bool) : `bool` - value to set update
Returns: `box`
method set(Label, x, y, txt, xloc, color, textcolor, size, style, textalign, tooltip, text_font_family, update)
set the location params of a label with 1 function auto detects time or bar_index for xloc param
Namespace types: series label
Parameters:
Label (label) : `label` | `required`
x (int) : `int` - value to set x
y (float) : `float` - value to set y
txt (string) : `string` - value to set text add`"+++"` to the _text striing to have the current label text concatenated to the location of the "+++")
xloc (string)
color (color)
textcolor (color) : `color` - value to set textcolor
size (string) : `string` - value to set size
style (string) : `string` - value to set style (use "flip" ,as the style to have label flip to top or bottom of bar depending on if open > close and vice versa)
textalign (string) : `string` - value to set textalign
tooltip (string) : `string` - value to set tooltip
text_font_family (string) : `string` - value to set text_font_family
update (bool) : `bool` - update label to next bar
Returns: `label`
method set(Linefill, line1, line2, color)
change the 1 or 2 of the lines in a linefill object
Namespace types: series linefill
Parameters:
Linefill (linefill)
line1 (line) : `line` - line object
line2 (line) : `line` - line object
color (color) : `color` - color
Returns: `linefill`
get(object)
get all of the location variables for `line`, `box`, `label` objects or the line objects from a `linefill`
***
## Overloaded
***
```
method get(line Line) =>
```
### Params
- **Line** `line` - line object | `required`
***
```
method get(box Box) =>
```
### Params
- **Box** `box` - box object | `required`
***
```
method get(label Label) =>
```
### Paramas
- **Label** `label` - label object | `required`
***
```
method get(linefill Linefill) =>
```
### Params
- **Linefill** `linefill` - linefill object | `required`
Parameters:
object (obj)
Returns: ` `
method get(Line)
Gets the location paramaters of a Line
Namespace types: series line
Parameters:
Line (line) : `line` - line object
Returns:
method get(Box)
Gets the location paramaters of a Box
Namespace types: series box
Parameters:
Box (box) : `box` - box object
Returns:
method get(Label)
Gets the `x`, `y`, `text` of a Label
Namespace types: series label
Parameters:
Label (label) : `label` - label object
Returns:
method get(Linefill)
Gets `line 1`, `line 2` from a Linefill
Namespace types: series linefill
Parameters:
Linefill (linefill) : `linefill` - linefill object
Returns:
method set_x(Line, x1, x2)
set the `x1`, `x2` of a line
***
### Params
- **Line** `line` - line object | `required`
- **x1** `int` - value to set x1 | `required`
- **x2** `int` - value to set x2 | `required`
Namespace types: series line
Parameters:
Line (line) : `line` - line object
x1 (int) : `int` - value to set x1
x2 (int) : `int` - value to set x2
Returns: `line`
method set_y(Line, y1, y2)
set `y1`, `y2` of a line
***
### Params
- **Line** `line` - line object | `required`
- **y1** `float` - value to set y1 | `required`
- **y2** `float` - value to set y2 | `required`
Namespace types: series line
Parameters:
Line (line) : `line` - line object
y1 (float) : `float` - value to set y1
y2 (float) : `float` - value to set y2
Returns: `line`
method Line(x1, y1, x2, y2, extend, color, style, width)
Similar to `line.new()` but can detect time or bar_index for xloc param and has defaults for all params but `x1`, `y1`, `x2`, `y2`
***
### Params
- **x1** `int` - value to set
- **y1** `float` - value to set
- **x2** `int` - value to set
- **y2** `float` - value to set
- **extend** `string` - extend value to set line
- **color** `color` - color to set line
- **style** `string` - style to set line
- **width** `int` - width to set line
Namespace types: series int, simple int, input int, const int
Parameters:
x1 (int) : `int` - value to set
y1 (float) : `float` - value to set
x2 (int) : `int` - value to set
y2 (float) : `float` - value to set
extend (string) : `string` - extend value to set line
color (color) : `color` - color to set line
style (string) : `string` - style to set line
width (int) : `int` - width to set line
Returns: `line`
method Box(left, top, right, bottom, extend, border_color, bgcolor, text_color, border_width, border_style, txt, text_halign, text_valign, text_size, text_wrap)
similar to box.new() with the but can detect xloc param and has defaults for everything but location params
***
### Params
- **left** `int` - value to set
- **top** `float` - value to set
- **right** `int` - value to set
- **bottom** `float` - value to set
- **extend** `string` - extend value to set box
- **border_color** `color` - color to set border
- **bgcolor** `color` - color to set background
- **text_color** `color` - color to set text
- **border_width** `int` - width to set border
- **border_style** `string` - style to set border
- **txt** `string` - text to set
- **text_halign** `string` - horizontal alignment to set text
- **text_valign** `string` - vertical alignment to set text
- **text_size** `string` - size to set text
- **text_wrap** `string` - wrap to set text
Namespace types: series int, simple int, input int, const int
Parameters:
left (int) : `int` - value to set
top (float) : `float` - value to set
right (int) : `int` - value to set
bottom (float) : `float` - value to set
extend (string) : `string` - extend value to set box
border_color (color) : `color` - color to set border
bgcolor (color) : `color` - color to set background
text_color (color) : `color` - color to set text
border_width (int) : `int` - width to set border
border_style (string) : `string` - style to set border
txt (string) : `string` - text to set
text_halign (string) : `string` - horizontal alignment to set text
text_valign (string) : `string` - vertical alignment to set text
text_size (string) : `string` - size to set text
text_wrap (string) : `string` - wrap to set text
Returns: `box`
method Label(txt, x, y, yloc, color, textcolor, style, size, textalign, text_font_family, tooltip)
Similar to label.new() but can detect time or bar_index for xloc param and has defaults for all params but x, y, txt, tooltip \n
***
### Params
- **txt** `string` - string to set
- **x** `int` - value to set
- **y** `float` - value to set
- **yloc** `string` - y location to set
- **color** `color` - label color to set
- **textcolor** `color` - text color to set
- **style** `string` - style to set
- **size** `string` - size to set
- **textalign** `string` - text alignment to set
- **text_font_family** `string` - font family to set
- **tooltip** `string` - tooltip to set
Namespace types: series string, simple string, input string, const string
Parameters:
txt (string) : `string` - string to set
x (int) : `int` - value to set
y (float) : `float` - value to set
yloc (string) : `string` - y location to set
color (color) : `color` - label color to set
textcolor (color) : `color` - text color to set
style (string) : `string` - style to set
size (string) : `string` - size to set
textalign (string) : `string` - text alignment to set
text_font_family (string) : `string` - font family to set
tooltip (string) : `string` - tooltip to set
Returns: `label`
obj
Fields:
obj (series__string)
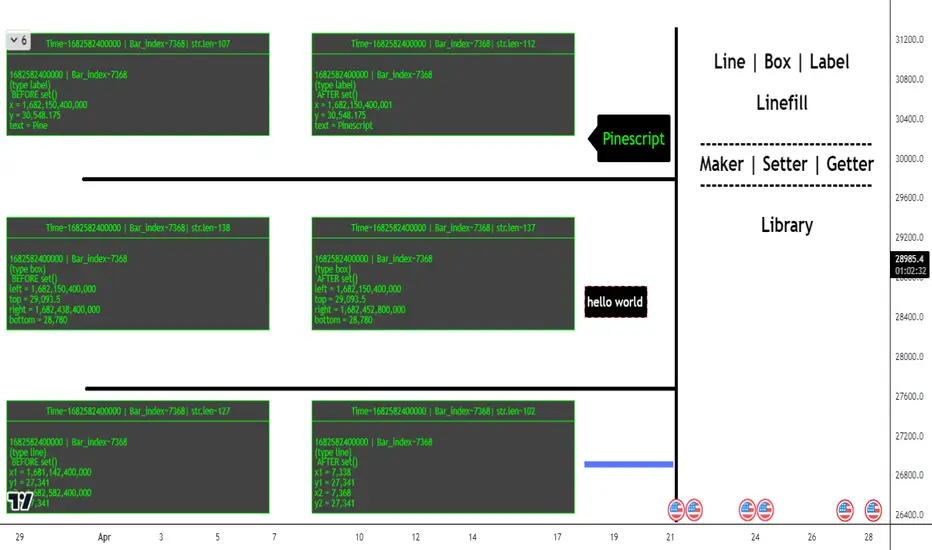
SR & POI Indicator//@version=5
indicator(title='SR & POI Indicator', overlay=true, max_boxes_count=500, max_lines_count=500, max_labels_count=500)
//============================================================================
// SUPPLY/DEMAND & POI SETTINGS
//============================================================================
swing_length = input.int(10, title = 'Swing High/Low Length', group = 'Supply/Demand Settings', minval = 1, maxval = 50)
history_of_demand_to_keep = input.int(20, title = 'History To Keep', group = 'Supply/Demand Settings', minval = 5, maxval = 50)
box_width = input.float(2.5, title = 'Supply/Demand Box Width', group = 'Supply/Demand Settings', minval = 1, maxval = 10, step = 0.5)
show_price_action_labels = input.bool(false, title = 'Show Price Action Labels', group = 'Supply/Demand Visual Settings')
supply_color = input.color(color.new(#EDEDED,70), title = 'Supply', group = 'Supply/Demand Visual Settings', inline = '3')
supply_outline_color = input.color(color.new(color.white,75), title = 'Outline', group = 'Supply/Demand Visual Settings', inline = '3')
demand_color = input.color(color.new(#00FFFF,70), title = 'Demand', group = 'Supply/Demand Visual Settings', inline = '4')
demand_outline_color = input.color(color.new(color.white,75), title = 'Outline', group = 'Supply/Demand Visual Settings', inline = '4')
bos_label_color = input.color(color.white, title = 'BOS Label', group = 'Supply/Demand Visual Settings')
poi_label_color = input.color(color.white, title = 'POI Label', group = 'Supply/Demand Visual Settings')
swing_type_color = input.color(color.black, title = 'Price Action Label', group = 'Supply/Demand Visual Settings')
//============================================================================
// SR SETTINGS
//============================================================================
enableSR = input(true, "SR On/Off", group="SR Settings")
colorSup = input(#00DBFF, "Support Color", group="SR Settings")
colorRes = input(#E91E63, "Resistance Color", group="SR Settings")
strengthSR = input.int(2, "S/R Strength", 1, group="SR Settings")
lineStyle = input.string("Dotted", "Line Style", , group="SR Settings")
lineWidth = input.int(2, "S/R Line Width", 1, group="SR Settings")
useZones = input(true, "Zones On/Off", group="SR Settings")
useHLZones = input(true, "High Low Zones On/Off", group="SR Settings")
zoneWidth = input.int(2, "Zone Width %", 0, tooltip="it's calculated using % of the distance between highest/lowest in last 300 bars", group="SR Settings")
expandSR = input(true, "Expand SR", group="SR Settings")
//============================================================================
// SUPPLY/DEMAND FUNCTIONS
//============================================================================
// Function to add new and remove last in array
f_array_add_pop(array, new_value_to_add) =>
array.unshift(array, new_value_to_add)
array.pop(array)
// Function for swing H & L labels
f_sh_sl_labels(array, swing_type) =>
var string label_text = na
if swing_type == 1
if array.get(array, 0) >= array.get(array, 1)
label_text := 'HH'
else
label_text := 'LH'
label.new(bar_index - swing_length, array.get(array,0), text = label_text, style=label.style_label_down, textcolor = swing_type_color, color = color.new(swing_type_color, 100), size = size.tiny)
else if swing_type == -1
if array.get(array, 0) >= array.get(array, 1)
label_text := 'HL'
else
label_text := 'LL'
label.new(bar_index - swing_length, array.get(array,0), text = label_text, style=label.style_label_up, textcolor = swing_type_color, color = color.new(swing_type_color, 100), size = size.tiny)
// Function to check overlapping
f_check_overlapping(new_poi, box_array, atr) =>
atr_threshold = atr * 2
okay_to_draw = true
for i = 0 to array.size(box_array) - 1
top = box.get_top(array.get(box_array, i))
bottom = box.get_bottom(array.get(box_array, i))
poi = (top + bottom) / 2
upper_boundary = poi + atr_threshold
lower_boundary = poi - atr_threshold
if new_poi >= lower_boundary and new_poi <= upper_boundary
okay_to_draw := false
break
else
okay_to_draw := true
okay_to_draw
// Function to draw supply or demand zone
f_supply_demand(value_array, bn_array, box_array, label_array, box_type, atr) =>
atr_buffer = atr * (box_width / 10)
box_left = array.get(bn_array, 0)
box_right = bar_index
var float box_top = 0.00
var float box_bottom = 0.00
var float poi = 0.00
if box_type == 1
box_top := array.get(value_array, 0)
box_bottom := box_top - atr_buffer
poi := (box_top + box_bottom) / 2
else if box_type == -1
box_bottom := array.get(value_array, 0)
box_top := box_bottom + atr_buffer
poi := (box_top + box_bottom) / 2
okay_to_draw = f_check_overlapping(poi, box_array, atr)
if box_type == 1 and okay_to_draw
box.delete( array.get(box_array, array.size(box_array) - 1) )
f_array_add_pop(box_array, box.new( left = box_left, top = box_top, right = box_right, bottom = box_bottom, border_color = supply_outline_color,
bgcolor = supply_color, extend = extend.right, text = 'SUPPLY', text_halign = text.align_center, text_valign = text.align_center, text_color = poi_label_color, text_size = size.small, xloc = xloc.bar_index))
box.delete( array.get(label_array, array.size(label_array) - 1) )
f_array_add_pop(label_array, box.new( left = box_left, top = poi, right = box_right, bottom = poi, border_color = color.new(poi_label_color,90),
bgcolor = color.new(poi_label_color,90), extend = extend.right, text = 'POI', text_halign = text.align_left, text_valign = text.align_center, text_color = poi_label_color, text_size = size.small, xloc = xloc.bar_index))
else if box_type == -1 and okay_to_draw
box.delete( array.get(box_array, array.size(box_array) - 1) )
f_array_add_pop(box_array, box.new( left = box_left, top = box_top, right = box_right, bottom = box_bottom, border_color = demand_outline_color,
bgcolor = demand_color, extend = extend.right, text = 'DEMAND', text_halign = text.align_center, text_valign = text.align_center, text_color = poi_label_color, text_size = size.small, xloc = xloc.bar_index))
box.delete( array.get(label_array, array.size(label_array) - 1) )
f_array_add_pop(label_array, box.new( left = box_left, top = poi, right = box_right, bottom = poi, border_color = color.new(poi_label_color,90),
bgcolor = color.new(poi_label_color,90), extend = extend.right, text = 'POI', text_halign = text.align_left, text_valign = text.align_center, text_color = poi_label_color, text_size = size.small, xloc = xloc.bar_index))
// Function to change supply/demand to BOS if broken
f_sd_to_bos(box_array, bos_array, label_array, zone_type) =>
if zone_type == 1
for i = 0 to array.size(box_array) - 1
level_to_break = box.get_top(array.get(box_array,i))
if close >= level_to_break
copied_box = box.copy(array.get(box_array,i))
f_array_add_pop(bos_array, copied_box)
mid = (box.get_top(array.get(box_array,i)) + box.get_bottom(array.get(box_array,i))) / 2
box.set_top(array.get(bos_array,0), mid)
box.set_bottom(array.get(bos_array,0), mid)
box.set_extend( array.get(bos_array,0), extend.none)
box.set_right( array.get(bos_array,0), bar_index)
box.set_text( array.get(bos_array,0), 'BOS' )
box.set_text_color( array.get(bos_array,0), bos_label_color)
box.set_text_size( array.get(bos_array,0), size.small)
box.set_text_halign( array.get(bos_array,0), text.align_center)
box.set_text_valign( array.get(bos_array,0), text.align_center)
box.delete(array.get(box_array, i))
box.delete(array.get(label_array, i))
if zone_type == -1
for i = 0 to array.size(box_array) - 1
level_to_break = box.get_bottom(array.get(box_array,i))
if close <= level_to_break
copied_box = box.copy(array.get(box_array,i))
f_array_add_pop(bos_array, copied_box)
mid = (box.get_top(array.get(box_array,i)) + box.get_bottom(array.get(box_array,i))) / 2
box.set_top(array.get(bos_array,0), mid)
box.set_bottom(array.get(bos_array,0), mid)
box.set_extend( array.get(bos_array,0), extend.none)
box.set_right( array.get(bos_array,0), bar_index)
box.set_text( array.get(bos_array,0), 'BOS' )
box.set_text_color( array.get(bos_array,0), bos_label_color)
box.set_text_size( array.get(bos_array,0), size.small)
box.set_text_halign( array.get(bos_array,0), text.align_center)
box.set_text_valign( array.get(bos_array,0), text.align_center)
box.delete(array.get(box_array, i))
box.delete(array.get(label_array, i))
// Function to extend box endpoint
f_extend_box_endpoint(box_array) =>
for i = 0 to array.size(box_array) - 1
box.set_right(array.get(box_array, i), bar_index + 100)
//============================================================================
// SR FUNCTIONS
//============================================================================
percWidth(len, perc) => (ta.highest(len) - ta.lowest(len)) * perc / 100
//============================================================================
// SUPPLY/DEMAND CALCULATIONS
//============================================================================
atr = ta.atr(50)
swing_high = ta.pivothigh(high, swing_length, swing_length)
swing_low = ta.pivotlow(low, swing_length, swing_length)
var swing_high_values = array.new_float(5,0.00)
var swing_low_values = array.new_float(5,0.00)
var swing_high_bns = array.new_int(5,0)
var swing_low_bns = array.new_int(5,0)
var current_supply_box = array.new_box(history_of_demand_to_keep, na)
var current_demand_box = array.new_box(history_of_demand_to_keep, na)
var current_supply_poi = array.new_box(history_of_demand_to_keep, na)
var current_demand_poi = array.new_box(history_of_demand_to_keep, na)
var supply_bos = array.new_box(5, na)
var demand_bos = array.new_box(5, na)
// New swing high
if not na(swing_high)
f_array_add_pop(swing_high_values, swing_high)
f_array_add_pop(swing_high_bns, bar_index )
if show_price_action_labels
f_sh_sl_labels(swing_high_values, 1)
f_supply_demand(swing_high_values, swing_high_bns, current_supply_box, current_supply_poi, 1, atr)
// New swing low
else if not na(swing_low)
f_array_add_pop(swing_low_values, swing_low)
f_array_add_pop(swing_low_bns, bar_index )
if show_price_action_labels
f_sh_sl_labels(swing_low_values, -1)
f_supply_demand(swing_low_values, swing_low_bns, current_demand_box, current_demand_poi, -1, atr)
f_sd_to_bos(current_supply_box, supply_bos, current_supply_poi, 1)
f_sd_to_bos(current_demand_box, demand_bos, current_demand_poi, -1)
f_extend_box_endpoint(current_supply_box)
f_extend_box_endpoint(current_demand_box)
//============================================================================
// SR CALCULATIONS & PLOTTING
//============================================================================
rb = 10
prd = 284
ChannelW = 10
label_loc = 55
style = lineStyle == "Solid" ? line.style_solid : lineStyle == "Dotted" ? line.style_dotted : line.style_dashed
ph = ta.pivothigh(rb, rb)
pl = ta.pivotlow (rb, rb)
sr_levels = array.new_float(21, na)
prdhighest = ta.highest(prd)
prdlowest = ta.lowest(prd)
cwidth = percWidth(prd, ChannelW)
zonePerc = percWidth(300, zoneWidth)
aas = array.new_bool(41, true)
u1 = 0.0, u1 := nz(u1 )
d1 = 0.0, d1 := nz(d1 )
highestph = 0.0, highestph := highestph
lowestpl = 0.0, lowestpl := lowestpl
var sr_levs = array.new_float(21, na)
label hlabel = na, label.delete(hlabel )
label llabel = na, label.delete(llabel )
var sr_lines = array.new_line(21, na)
var sr_linesH = array.new_line(21, na)
var sr_linesL = array.new_line(21, na)
var sr_linesF = array.new_linefill(21, na)
var sr_labels = array.new_label(21, na)
if ph or pl
for x = 0 to array.size(sr_levels) - 1
array.set(sr_levels, x, na)
highestph := prdlowest
lowestpl := prdhighest
countpp = 0
for x = 0 to prd
if na(close )
break
if not na(ph ) or not na(pl )
highestph := math.max(highestph, nz(ph , prdlowest), nz(pl , prdlowest))
lowestpl := math.min(lowestpl, nz(ph , prdhighest), nz(pl , prdhighest))
countpp += 1
if countpp > 40
break
if array.get(aas, countpp)
upl = (ph ? high : low ) + cwidth
dnl = (ph ? high : low ) - cwidth
u1 := countpp == 1 ? upl : u1
d1 := countpp == 1 ? dnl : d1
tmp = array.new_bool(41, true)
cnt = 0
tpoint = 0
for xx = 0 to prd
if na(close )
break
if not na(ph ) or not na(pl )
chg = false
cnt += 1
if cnt > 40
break
if array.get(aas, cnt)
if not na(ph )
if high <= upl and high >= dnl
tpoint += 1
chg := true
if not na(pl )
if low <= upl and low >= dnl
tpoint += 1
chg := true
if chg and cnt < 41
array.set(tmp, cnt, false)
if tpoint >= strengthSR
for g = 0 to 40 by 1
if not array.get(tmp, g)
array.set(aas, g, false)
if ph and countpp < 21
array.set(sr_levels, countpp, high )
if pl and countpp < 21
array.set(sr_levels, countpp, low )
// Plot SR
var line highest_ = na, line.delete(highest_)
var line lowest_ = na, line.delete(lowest_)
var line highest_fill1 = na, line.delete(highest_fill1)
var line highest_fill2 = na, line.delete(highest_fill2)
var line lowest_fill1 = na, line.delete(lowest_fill1)
var line lowest_fill2 = na, line.delete(lowest_fill2)
hi_col = close >= highestph ? colorSup : colorRes
lo_col = close >= lowestpl ? colorSup : colorRes
if enableSR
highest_ := line.new(bar_index - 311, highestph, bar_index, highestph, xloc.bar_index, expandSR ? extend.both : extend.right, hi_col, style, lineWidth)
lowest_ := line.new(bar_index - 311, lowestpl , bar_index, lowestpl , xloc.bar_index, expandSR ? extend.both : extend.right, lo_col, style, lineWidth)
if useHLZones
highest_fill1 := line.new(bar_index - 311, highestph + zonePerc, bar_index, highestph + zonePerc, xloc.bar_index, expandSR ? extend.both : extend.right, na)
highest_fill2 := line.new(bar_index - 311, highestph - zonePerc, bar_index, highestph - zonePerc, xloc.bar_index, expandSR ? extend.both : extend.right, na)
lowest_fill1 := line.new(bar_index - 311, lowestpl + zonePerc , bar_index, lowestpl + zonePerc , xloc.bar_index, expandSR ? extend.both : extend.right, na)
lowest_fill2 := line.new(bar_index - 311, lowestpl - zonePerc , bar_index, lowestpl - zonePerc , xloc.bar_index, expandSR ? extend.both : extend.right, na)
linefill.new(highest_fill1, highest_fill2, color.new(hi_col, 80))
linefill.new(lowest_fill1 , lowest_fill2 , color.new(lo_col, 80))
if ph or pl
for x = 0 to array.size(sr_lines) - 1
array.set(sr_levs, x, array.get(sr_levels, x))
for x = 0 to array.size(sr_lines) - 1
line.delete(array.get(sr_lines, x))
line.delete(array.get(sr_linesH, x))
line.delete(array.get(sr_linesL, x))
linefill.delete(array.get(sr_linesF, x))
if array.get(sr_levs, x) and enableSR
line_col = close >= array.get(sr_levs, x) ? colorSup : colorRes
array.set(sr_lines, x, line.new(bar_index - 355, array.get(sr_levs, x), bar_index, array.get(sr_levs, x), xloc.bar_index, expandSR ? extend.both : extend.right, line_col, style, lineWidth))
if useZones
array.set(sr_linesH, x, line.new(bar_index - 355, array.get(sr_levs, x) + zonePerc, bar_index, array.get(sr_levs, x) + zonePerc, xloc.bar_index, expandSR ? extend.both : extend.right, na))
array.set(sr_linesL, x, line.new(bar_index - 355, array.get(sr_levs, x) - zonePerc, bar_index, array.get(sr_levs, x) - zonePerc, xloc.bar_index, expandSR ? extend.both : extend.right, na))
array.set(sr_linesF, x, linefill.new(array.get(sr_linesH, x), array.get(sr_linesL, x), color.new(line_col, 80)))
for x = 0 to array.size(sr_labels) - 1
label.delete(array.get(sr_labels, x))
if array.get(sr_levs, x) and enableSR
lab_loc = close >= array.get(sr_levs, x) ? label.style_label_up : label.style_label_down
lab_col = close >= array.get(sr_levs, x) ? colorSup : colorRes
array.set(sr_labels, x, label.new(bar_index + label_loc, array.get(sr_levs, x), str.tostring(math.round_to_mintick(array.get(sr_levs, x))), color=lab_col , textcolor=#000000, style=lab_loc))
hlabel := enableSR ? label.new(bar_index + label_loc + math.round(math.sign(label_loc)) * 20, highestph, "High Level : " + str.tostring(highestph), color=hi_col, textcolor=#000000, style=label.style_label_down) : na
llabel := enableSR ? label.new(bar_index + label_loc + math.round(math.sign(label_loc)) * 20, lowestpl , "Low Level : " + str.tostring(lowestpl) , color=lo_col, textcolor=#000000, style=label.style_label_up ) : na

Volume Delta Volume Signals by Claudio [hapharmonic]// This Pine Script™ code is subject to the terms of the Mozilla Public License 2.0 at mozilla.org
// © hapharmonic
//@version=6
FV = format.volume
FP = format.percent
indicator('Volume Delta Volume Signals by Claudio ', format = FV, max_bars_back = 4999, max_labels_count = 500)
//------------------------------------------
// Settings |
//------------------------------------------
bool usecandle = input.bool(true, title = 'Volume on Candles',display=display.none)
color C_Up = input.color(#12cef8, title = 'Volume Buy', inline = ' ', group = 'Style')
color C_Down = input.color(#fe3f00, title = 'Volume Sell', inline = ' ', group = 'Style')
// ✅ Nueva entrada para colores de señales
color buySignalColor = input.color(color.new(color.green, 0), "Buy Signal Color", group = "Signals")
color sellSignalColor = input.color(color.new(color.red, 0), "Sell Signal Color", group = "Signals")
string P_ = input.string(position.top_right,"Position",options = ,
group = "Style",display=display.none)
string sL = input.string(size.small , 'Size Label', options = , group = 'Style',display=display.none)
string sT = input.string(size.normal, 'Size Table', options = , group = 'Style',display=display.none)
bool Label = input.bool(false, inline = 'l')
History = input.bool(true, inline = 'l')
// Inputs for EMA lengths and volume confirmation
bool MAV = input.bool(true, title = 'EMA', group = 'EMA')
string volumeOption = input.string('Use Volume Confirmation', title = 'Volume Option', options = , group = 'EMA',display=display.none)
bool useVolumeConfirmation = volumeOption == 'none' ? false : true
int emaFastLength = input(12, title = 'Fast EMA Length', group = 'EMA',display=display.none)
int emaSlowLength = input(26, title = 'Slow EMA Length', group = 'EMA',display=display.none)
int volumeConfirmationLength = input(6, title = 'Volume Confirmation Length', group = 'EMA',display=display.none)
string alert_freq = input.string(alert.freq_once_per_bar_close, title="Alert Frequency",
options= ,group = "EMA",
tooltip="If you choose once_per_bar, you will receive immediate notifications (but this may cause interference or indicator repainting).
\n However, if you choose once_per_bar_close, it will wait for the candle to confirm the signal before notifying.",display=display.none)
//------------------------------------------
// UDT_identifier |
//------------------------------------------
type OHLCV
float O = open
float H = high
float L = low
float C = close
float V = volume
type VolumeData
float buyVol
float sellVol
float pcBuy
float pcSell
bool isBuyGreater
float higherVol
float lowerVol
color higherCol
color lowerCol
//------------------------------------------
// Calculate volumes and percentages |
//------------------------------------------
calcVolumes(OHLCV ohlcv) =>
var VolumeData data = VolumeData.new()
data.buyVol := ohlcv.V * (ohlcv.C - ohlcv.L) / (ohlcv.H - ohlcv.L)
data.sellVol := ohlcv.V - data.buyVol
data.pcBuy := data.buyVol / ohlcv.V * 100
data.pcSell := 100 - data.pcBuy
data.isBuyGreater := data.buyVol > data.sellVol
data.higherVol := data.isBuyGreater ? data.buyVol : data.sellVol
data.lowerVol := data.isBuyGreater ? data.sellVol : data.buyVol
data.higherCol := data.isBuyGreater ? C_Up : C_Down
data.lowerCol := data.isBuyGreater ? C_Down : C_Up
data
//------------------------------------------
// Get volume data |
//------------------------------------------
ohlcv = OHLCV.new()
volData = calcVolumes(ohlcv)
// Plot volumes and create labels
plot(ohlcv.V, color=color.new(volData.higherCol, 90), style=plot.style_columns, title='Total',display = display.all - display.status_line)
plot(ohlcv.V, color=volData.higherCol, style=plot.style_stepline_diamond, title='Total2', linewidth = 2,display = display.pane)
plot(volData.higherVol, color=volData.higherCol, style=plot.style_columns, title='Higher Volume', display = display.all - display.status_line)
plot(volData.lowerVol , color=volData.lowerCol , style=plot.style_columns, title='Lower Volume',display = display.all - display.status_line)
S(D,F)=>str.tostring(D,F)
volStr = S(math.sign(ta.change(ohlcv.C)) * ohlcv.V, FV)
buyVolStr = S(volData.buyVol , FV )
sellVolStr = S(volData.sellVol , FV )
// ✅ MODIFICACIÓN: Porcentaje sin decimales
buyPercentStr = str.tostring(math.round(volData.pcBuy)) + " %"
sellPercentStr = str.tostring(math.round(volData.pcSell)) + " %"
totalbuyPercentC_ = volData.buyVol / (volData.buyVol + volData.sellVol) * 100
sup = not na(ohlcv.V)
if sup
TC = text.align_center
CW = color.white
var table tb = table.new(P_, 6, 6, bgcolor = na, frame_width = 2, frame_color = chart.fg_color, border_width = 1, border_color = CW)
tb.cell(0, 0, text = 'Volume Candles', text_color = #FFBF00, bgcolor = #0E2841, text_halign = TC, text_valign = TC, text_size = sT)
tb.merge_cells(0, 0, 5, 0)
tb.cell(0, 1, text = 'Current Volume', text_color = CW, bgcolor = #0B3040, text_halign = TC, text_valign = TC, text_size = sT)
tb.merge_cells(0, 1, 1, 1)
tb.cell(0, 2, text = 'Buy', text_color = #000000, bgcolor = #92D050, text_halign = TC, text_valign = TC, text_size = sT)
tb.cell(1, 2, text = 'Sell', text_color = #000000, bgcolor = #FF0000, text_halign = TC, text_valign = TC, text_size = sT)
tb.cell(0, 3, text = buyVolStr, text_color = CW, bgcolor = #074F69, text_halign = TC, text_valign = TC, text_size = sT)
tb.cell(1, 3, text = sellVolStr, text_color = CW, bgcolor = #074F69, text_halign = TC, text_valign = TC, text_size = sT)
tb.cell(0, 5, text = 'Net: ' + volStr, text_color = CW, bgcolor = #074F69, text_halign = TC, text_valign = TC, text_size = sT)
tb.merge_cells(0, 5, 1, 5)
tb.cell(0, 4, text = buyPercentStr, text_color = CW, bgcolor = #074F69, text_halign = TC, text_valign = TC, text_size = sT)
tb.cell(1, 4, text = sellPercentStr, text_color = CW, bgcolor = #074F69, text_halign = TC, text_valign = TC, text_size = sT)
cellCount = 20
filledCells = 0
for r = 5 to 1 by 1
for c = 2 to 5 by 1
if filledCells < cellCount * (totalbuyPercentC_ / 100)
tb.cell(c, r, text = '', bgcolor = C_Up)
else
tb.cell(c, r, text = '', bgcolor = C_Down)
filledCells := filledCells + 1
filledCells
if Label
sp = ' '
l = label.new(bar_index, ohlcv.V,
text=str.format('Net: {0}\nBuy: {1} ({2})\nSell: {3} ({4})\n{5}/\\\n {5}l\n {5}l',
volStr, buyVolStr, buyPercentStr, sellVolStr, sellPercentStr, sp),
style=label.style_none, textcolor=volData.higherCol, size=sL, textalign=text.align_left)
if not History
(l ).delete()
//------------------------------------------
// Draw volume levels on the candlesticks |
//------------------------------------------
float base = na,float value = na
bool uc = usecandle and sup
if volData.isBuyGreater
base := math.min(ohlcv.O, ohlcv.C)
value := base + math.abs(ohlcv.O - ohlcv.C) * (volData.pcBuy / 100)
else
base := math.max(ohlcv.O, ohlcv.C)
value := base - math.abs(ohlcv.O - ohlcv.C) * (volData.pcSell / 100)
barcolor(sup ? color.new(na, na) : ohlcv.C < ohlcv.O ? color.red : color.green,display = usecandle? display.all:display.none)
UseC = uc ? volData.higherCol:color.new(na, na)
plotcandle(uc?base:na, uc?base:na, uc?value:na, uc?value:na,
title='Body', color=UseC, bordercolor=na, wickcolor=UseC,
display = usecandle ? display.all - display.status_line : display.none, force_overlay=true,editable=false)
plotcandle(uc?ohlcv.O:na, uc?ohlcv.H:na, uc?ohlcv.L:na, uc?ohlcv.C:na,
title='Fill', color=color.new(UseC,80), bordercolor=UseC, wickcolor=UseC,
display = usecandle ? display.all - display.status_line : display.none, force_overlay=true,editable=false)
//------------------------------------------------------------
// Plot the EMA and filter out the noise with volume control. |
//------------------------------------------------------------
float emaFast = ta.ema(ohlcv.C, emaFastLength)
float emaSlow = ta.ema(ohlcv.C, emaSlowLength)
bool signal = emaFast > emaSlow
color c_signal = signal ? C_Up : C_Down
float volumeMA = ta.sma(ohlcv.V, volumeConfirmationLength)
bool crossover = ta.crossover(emaFast, emaSlow)
bool crossunder = ta.crossunder(emaFast, emaSlow)
isVolumeConfirmed(source, length, ma) =>
math.sum(source > ma ? source : 0, length) >= math.sum(source < ma ? source : 0, length)
bool ISV = isVolumeConfirmed(ohlcv.V, volumeConfirmationLength, volumeMA)
bool crossoverConfirmed = crossover and (not useVolumeConfirmation or ISV)
bool crossunderConfirmed = crossunder and (not useVolumeConfirmation or ISV)
PF = MAV ? emaFast : na
PS = MAV ? emaSlow : na
p1 = plot(PF, color = c_signal, editable = false, force_overlay = true, display = display.pane)
plot(PF, color = color.new(c_signal, 80), linewidth = 10, editable = false, force_overlay = true, display = display.pane)
plot(PF, color = color.new(c_signal, 90), linewidth = 20, editable = false, force_overlay = true, display = display.pane)
plot(PF, color = color.new(c_signal, 95), linewidth = 30, editable = false, force_overlay = true, display = display.pane)
plot(PF, color = color.new(c_signal, 98), linewidth = 45, editable = false, force_overlay = true, display = display.pane)
p2 = plot(PS, color = c_signal, editable = false, force_overlay = true, display = display.pane)
plot(PS, color = color.new(c_signal, 80), linewidth = 10, editable = false, force_overlay = true, display = display.pane)
plot(PS, color = color.new(c_signal, 90), linewidth = 20, editable = false, force_overlay = true, display = display.pane)
plot(PS, color = color.new(c_signal, 95), linewidth = 30, editable = false, force_overlay = true, display = display.pane)
plot(PS, color = color.new(c_signal, 98), linewidth = 45, editable = false, force_overlay = true, display = display.pane)
fill(p1, p2, top_value=crossover ? emaFast : emaSlow,
bottom_value =crossover ? emaSlow : emaFast,
top_color =color.new(c_signal, 80),
bottom_color =color.new(c_signal, 95)
)
// ✅ Usar colores configurables para señales
plotshape(crossoverConfirmed and MAV, style=shape.triangleup , location=location.belowbar, color=buySignalColor , size=size.small, force_overlay=true,display =display.pane)
plotshape(crossunderConfirmed and MAV, style=shape.triangledown, location=location.abovebar, color=sellSignalColor, size=size.small, force_overlay=true,display =display.pane)
string msg = '---------\n'+"Buy volume ="+buyVolStr+"\nBuy Percent = "+buyPercentStr+"\nSell volume = "+sellVolStr+"\nSell Percent = "+sellPercentStr+"\nNet = "+volStr+'\n---------'
if crossoverConfirmed
alert("Price (" + str.tostring(close) + ") Crossed over MA\n" + msg, alert_freq)
if crossunderConfirmed
alert("Price (" + str.tostring(close) + ") Crossed under MA\n" + msg, alert_freq)

lib_plot_objectsLibrary "lib_plot_objects"
library wrapping basic builtin object constructors, to be able to do calculations with points/lines/boxes/triangles/polygons via libraries and on securities. inspired by Trendoscope's ( and ) with added update mechanism to not have to recreate objects on every iteration for continously drawn items, automated xloc selection for coordinates, compatibility check for Points, added Triangle and Polygon types, object reflection via tostring to valid json (logging via webhook)
method assert_same_xloc(a, b, test)
checks two points for compatibility, i.e. having the same xloc
Namespace types: Point
Parameters:
a (Point)
b (Point)
test (Test type from robbatt/lib_unit/6)
method assert_same_xloc(a, b, test)
checks two lines for compatibility, i.e. having the same xloc
Namespace types: Line
Parameters:
a (Line)
b (Line)
test (Test type from robbatt/lib_unit/6)
method or_default(args)
checks args oject for being na, if so, provide a default instead
Namespace types: LineArgs
Parameters:
args (LineArgs)
method or_default(args)
checks args oject for being na, if so, provide a default instead
Namespace types: LabelArgs
Parameters:
args (LabelArgs)
method or_default(args)
checks args oject for being na, if so, provide a default instead
Namespace types: BoxArgs
Parameters:
args (BoxArgs)
method or_default(args)
checks args oject for being na, if so, provide a default instead
Namespace types: BoxTextArgs
Parameters:
args (BoxTextArgs)
method x(point, xloc)
automatically returns the correct x coordinate, based on the point's set xloc
Namespace types: Point
Parameters:
point (Point)
xloc (string)
method tostring(this, date_format)
converts object to json representation
Namespace types: Point
Parameters:
this (Point)
date_format (string)
method tostring(this, date_format)
converts object to json representation
Namespace types: Point
Parameters:
this (Point )
date_format (string)
method tostring(this)
converts object to json representation
Namespace types: LineArgs
Parameters:
this (LineArgs)
method tostring(this, date_format)
converts object to json representation
Namespace types: Line
Parameters:
this (Line)
date_format (string)
method tostring(this)
Namespace types: LabelArgs
Parameters:
this (LabelArgs)
method tostring(this, date_format)
Namespace types: Label
Parameters:
this (Label)
date_format (string)
method tostring(this, date_format)
Namespace types: LineFill
Parameters:
this (LineFill)
date_format (string)
method tostring(this)
Namespace types: BoxArgs
Parameters:
this (BoxArgs)
method tostring(this)
Namespace types: BoxTextArgs
Parameters:
this (BoxTextArgs)
method tostring(this, date_format)
Namespace types: Box
Parameters:
this (Box)
date_format (string)
method tostring(this, date_format)
Namespace types: Triangle
Parameters:
this (Triangle)
date_format (string)
method tostring(this, date_format)
Namespace types: TriangleFill
Parameters:
this (TriangleFill)
date_format (string)
method tostring(this, date_format)
Namespace types: Polygon
Parameters:
this (Polygon)
date_format (string)
method tostring(this, date_format)
Namespace types: PolygonFill
Parameters:
this (PolygonFill)
date_format (string)
method tostring(this, date_format)
Namespace types: Line
Parameters:
this (Line )
date_format (string)
method tostring(this, date_format)
Namespace types: Box
Parameters:
this (Box )
date_format (string)
method tostring(this, date_format)
Namespace types: Triangle
Parameters:
this (Triangle )
date_format (string)
method tostring(this, date_format)
Namespace types: Polygon
Parameters:
this (Polygon )
date_format (string)
method tostring(this, date_format)
Namespace types: PolygonFill
Parameters:
this (PolygonFill )
date_format (string)
method create_center(points)
Namespace types: Point
Parameters:
points (Point )
method create_center(this, other)
Namespace types: Point
Parameters:
this (Point)
other (Point)
method create_center(this)
Namespace types: Line
Parameters:
this (Line)
method create_line(this, other, args)
Namespace types: Point
Parameters:
this (Point)
other (Point)
args (LineArgs)
method create_triangle(this, b, c, args)
Namespace types: Point
Parameters:
this (Point)
b (Point)
c (Point)
args (LineArgs)
method create_triangle(this, c)
Namespace types: Line
Parameters:
this (Line)
c (Point)
method create_box(this, other, txt, args, text_args)
Namespace types: Point
Parameters:
this (Point)
other (Point)
txt (string)
args (BoxArgs)
text_args (BoxTextArgs)
method create_box(this, txt, args, text_args)
Namespace types: Line
Parameters:
this (Line)
txt (string)
args (BoxArgs)
text_args (BoxTextArgs)
method create_polygon(points, args)
Namespace types: Point
Parameters:
points (Point )
args (LineArgs)
method create_polygon(start, others, args)
Namespace types: Point
Parameters:
start (Point)
others (Point )
args (LineArgs)
method create_fill(this, other, fill_color)
Namespace types: Line
Parameters:
this (Line)
other (Line)
fill_color (color)
method create_fill(this, fill_color)
Namespace types: Triangle
Parameters:
this (Triangle)
fill_color (color)
method create_fill(this, fill_color)
Namespace types: Polygon
Parameters:
this (Polygon)
fill_color (color)
method create_label(this, txt, args, tooltip)
Namespace types: Point
Parameters:
this (Point)
txt (string)
args (LabelArgs)
tooltip (string)
method create_label(this, txt, args, tooltip)
Namespace types: Line
Parameters:
this (Line)
txt (string)
args (LabelArgs)
tooltip (string)
method create_label(this, txt, args, tooltip)
Namespace types: Box
Parameters:
this (Box)
txt (string)
args (LabelArgs)
tooltip (string)
method create_label(this, txt, args, tooltip)
Namespace types: Triangle
Parameters:
this (Triangle)
txt (string)
args (LabelArgs)
tooltip (string)
method create_label(this, txt, args, tooltip)
Namespace types: Polygon
Parameters:
this (Polygon)
txt (string)
args (LabelArgs)
tooltip (string)
method update(this, bar_time, bar_idx, price)
Namespace types: Point
Parameters:
this (Point)
bar_time (int)
bar_idx (int)
price (float)
method update(this, update)
Namespace types: Point
Parameters:
this (Point)
update (Point)
method update(this, point)
Namespace types: Label
Parameters:
this (Label)
point (Point)
method update(this, start, end)
Namespace types: Line
Parameters:
this (Line)
start (Point)
end (Point)
method update(this, left_top, right_bottom)
Namespace types: Box
Parameters:
this (Box)
left_top (Point)
right_bottom (Point)
method update(this, a, b, c)
Namespace types: Triangle
Parameters:
this (Triangle)
a (Point)
b (Point)
c (Point)
method update(this, points)
Namespace types: Polygon
Parameters:
this (Polygon)
points (Point )
method delete(this)
Namespace types: Line
Parameters:
this (Line)
method delete(this)
Namespace types: Label
Parameters:
this (Label)
method delete(this)
Namespace types: LineFill
Parameters:
this (LineFill)
method delete(this)
Namespace types: Box
Parameters:
this (Box)
method delete(this)
Namespace types: TriangleFill
Parameters:
this (TriangleFill)
method delete(this)
Namespace types: Triangle
Parameters:
this (Triangle)
method delete(this)
Namespace types: Polygon
Parameters:
this (Polygon)
method delete(this)
Namespace types: PolygonFill
Parameters:
this (PolygonFill)
method delete(this)
Namespace types: Line
Parameters:
this (Line )
method delete(this)
Namespace types: Label
Parameters:
this (Label )
method delete(this)
Namespace types: LineFill
Parameters:
this (LineFill )
method delete(this)
Namespace types: Box
Parameters:
this (Box )
method delete(this)
Namespace types: TriangleFill
Parameters:
this (TriangleFill )
method delete(this)
Namespace types: Polygon
Parameters:
this (Polygon )
method delete(this)
Namespace types: Triangle
Parameters:
this (Triangle )
method delete(this)
Namespace types: PolygonFill
Parameters:
this (PolygonFill )
method draw(this)
Namespace types: Label
Parameters:
this (Label)
method draw(this)
Namespace types: Line
Parameters:
this (Line)
method draw(this)
Namespace types: Box
Parameters:
this (Box)
method draw(this)
Namespace types: Triangle
Parameters:
this (Triangle)
method draw(this)
Namespace types: Polygon
Parameters:
this (Polygon)
method draw(this)
Namespace types: LineFill
Parameters:
this (LineFill)
method draw(this)
Namespace types: TriangleFill
Parameters:
this (TriangleFill)
method draw(this)
Namespace types: PolygonFill
Parameters:
this (PolygonFill)
Point
Fields:
bar_time (series int) : time based x coordinate
bar_idx (series int) : bar index based x coordinate
price (series float) : price based y coordinate
xloc (series string) : To select if x coordinate is represented by bar_idx or bar_time. Possible values: xloc.bar_index and xloc.bar_time. Default is xloc.bar_index.
LabelArgs
Fields:
text_color (series color) : Text color.
bg_color (series color) : Color of the label border and arrow.
text_font_family (series string) : The font family of the text. Optional. The default value is font.family_default. Possible values: font.family_default, font.family_monospace.
yloc (series string) : Possible values are yloc.price, yloc.abovebar, yloc.belowbar. If yloc=yloc.price, y argument specifies the price of the label position. If yloc=yloc.abovebar, label is located above bar. If yloc=yloc.belowbar, label is located below bar. Default is yloc.price.
style (series string) : Label style. Possible values: label.style_none, label.style_xcross, label.style_cross, label.style_triangleup, label.style_triangledown, label.style_flag, label.style_circle, label.style_arrowup, label.style_arrowdown, label.style_label_up, label.style_label_down, label.style_label_left, label.style_label_right, label.style_label_lower_left, label.style_label_lower_right, label.style_label_upper_left, label.style_label_upper_right, label.style_label_center, label.style_square, label.style_diamond, label.style_text_outline. Default is label.style_label_down.
size (series string) : Label size. Possible values: size.auto, size.tiny, size.small, size.normal, size.large, size.huge. Default value is size.normal.
text_align (series string) : Label text alignment. Possible values: text.align_left, text.align_center, text.align_right. Default value is text.align_center.
Label
Fields:
point (Point) : The Label coordinates
txt (series string) : Label text. Default is empty string.
args (LabelArgs) : Wrapper for reusable arguments for label.new()
tooltip (series string) : Hover to see tooltip label.
plot (series label) : The label object to be added and plotted via draw()
LineArgs
Fields:
line_color (series color) : Line color.
style (series string) : Line style. Possible values: line.style_solid, line.style_dotted, line.style_dashed, line.style_arrow_left, line.style_arrow_right, line.style_arrow_both.
width (series int) : Line width in pixels.
extend (series string) : f extend=extend.none, draws segment starting at point (x1, y1) and ending at point (x2, y2). If extend is equal to extend.right or extend.left, draws a ray starting at point (x1, y1) or (x2, y2), respectively. If extend=extend.both, draws a straight line that goes through these points. Default value is extend.none.
Line
Fields:
start (Point) : starting point of the line
end (Point)
args (LineArgs) : Wrapper for reusable arguments for line.new()
plot (series line) : The line object to be added and plotted via draw()
LineFill
Fields:
a (Line) : The first Line object
b (Line) : The second Line object
fill_color (series color) : The color used to fill the space between the lines.
plot (series linefill) : The linefill object to be added and plotted via draw()
BoxArgs
Fields:
border_color (series color) : Color of the four borders. Optional. The default is color.blue.
border_width (series int) : Width of the four borders, in pixels. Optional. The default is 1 pixel.
border_style (series string) : Style of the four borders. Possible values: line.style_solid, line.style_dotted, line.style_dashed. Optional. The default value is line.style_solid.
bg_color (series color) : Background color of the box. Optional. The default is color.blue.
extend (series string) : When extend.none is used, the horizontal borders start at the left border and end at the right border. With extend.left or extend.right, the horizontal borders are extended indefinitely to the left or right of the box, respectively. With extend.both, the horizontal borders are extended on both sides. Optional. The default value is extend.none.
BoxTextArgs
Fields:
text_color (series color) : The color of the text. Optional. The default is color.black.
text_size (series string) : The size of the text. An optional parameter, the default value is size.auto. Possible values: size.auto, size.tiny, size.small, size.normal, size.large, size.huge.
text_halign (series string) : The horizontal alignment of the box's text. Optional. The default value is text.align_center. Possible values: text.align_left, text.align_center, text.align_right.
text_valign (series string) : The vertical alignment of the box's text. Optional. The default value is text.align_center. Possible values: text.align_top, text.align_center, text.align_bottom.
text_wrap (series string) : Defines whether the text is presented in a single line, extending past the width of the box if necessary, or wrapped so every line is no wider than the box itself (and clipped by the bottom border of the box if the height of the resulting wrapped text is higher than the height of the box). Optional. The default value is text.wrap_none. Possible values: text.wrap_none, text.wrap_auto.
text_font_family (series string) : The font family of the text. Optional. The default value is font.family_default. Possible values: font.family_default, font.family_monospace.
Box
Fields:
left_top (Point) : top-left corner of the box
right_bottom (Point) : bottom-right corner of the box
txt (series string) : The text to be displayed inside the box. Optional. The default is empty string.
args (BoxArgs) : Wrapper for reusable arguments for box.new()
text_args (BoxTextArgs)
plot (series box) : The box object to be added and plotted via draw()
Triangle
Fields:
a (Point) : first Corner
b (Point) : second Corner
c (Point) : third Corner
args (LineArgs) : Wrapper for reusable arguments for line.new()
plot_ab (series line) : The line object to be added and plotted via draw()
plot_ac (series line) : The line object to be added and plotted via draw()
plot_bc (series line) : The line object to be added and plotted via draw()
TriangleFill
Fields:
triangle (Triangle) : The Triangle object
fill_color (series color) : The color used to fill the space between the lines.
plot (series linefill) : The linefill object to be added and plotted via draw()
Polygon
Fields:
points (Point ) : array of points that make up the Polygon
center (Point) : Center point of the Polygon, can be used for a label and will be center for PolygonFill
args (LineArgs) : Wrapper for reusable arguments for line.new()
plot (line ) : An array of Lines that form Polygon Border
PolygonFill
Fields:
poly (Polygon) : the Polygon
fill_color (series color) : The color used to fill the space between the lines.
plot_segments (line ) : An array of helper lines to create linefills
plot_fills (linefill ) : An array of linefills that cover the Polygon surface
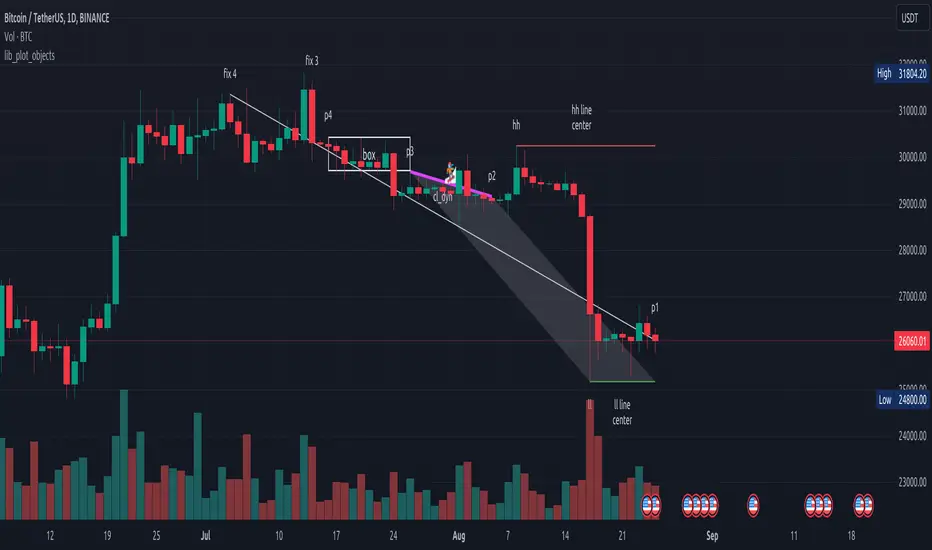
لbsm15// This work is licensed under a Attribution-NonCommercial-ShareAlike 4.0 International (CC BY-NC-SA 4.0) creativecommons.org
// © LuxAlgo
//@version=5
indicator("لbsm15", overlay = true, max_lines_count = 500, max_boxes_count = 500, max_bars_back = 3000)
//------------------------------------------------------------------------------
//Settings
//-----------------------------------------------------------------------------{
liqGrp = 'Liquidity Detection'
liqLen = input.int (7, title = 'Detection Length', minval = 3, maxval = 13, inline = 'LIQ', group = liqGrp)
liqMar = 10 / input.float (6.9, 'Margin', minval = 4, maxval = 9, step = 0.1, inline = 'LIQ', group = liqGrp)
liqBuy = input.bool (true, 'Buyside Liquidity Zones, Margin', inline = 'Buyside', group = liqGrp)
marBuy = input.float(2.3, '', minval = 1.5, maxval = 10, step = .1, inline = 'Buyside', group = liqGrp)
cLIQ_B = input.color (color.new(#4caf50, 0), '', inline = 'Buyside', group = liqGrp)
liqSel = input.bool (true, 'Sellside Liquidity Zones, Margin', inline = 'Sellside', group = liqGrp)
marSel = input.float(2.3, '', minval = 1.5, maxval = 10, step = .1, inline = 'Sellside', group = liqGrp)
cLIQ_S = input.color (color.new(#f23645, 0), '', inline = 'Sellside', group = liqGrp)
lqVoid = input.bool (false, 'Liquidity Voids, Bullish', inline = 'void', group = liqGrp)
cLQV_B = input.color (color.new(#4caf50, 0), '', inline = 'void', group = liqGrp)
cLQV_S = input.color (color.new(#f23645, 0), 'Bearish', inline = 'void', group = liqGrp)
lqText = input.bool (false, 'Label', inline = 'void', group = liqGrp)
mode = input.string('Present', title = 'Mode', options = , inline = 'MOD', group = liqGrp)
visLiq = input.int (3, ' # Visible Levels', minval = 1, maxval = 50, inline = 'MOD', group = liqGrp)
//-----------------------------------------------------------------------------}
//General Calculations
//-----------------------------------------------------------------------------{
maxSize = 50
atr = ta.atr(10)
atr200 = ta.atr(200)
per = mode == 'Present' ? last_bar_index - bar_index <= 500 : true
//-----------------------------------------------------------------------------}
//User Defined Types
//-----------------------------------------------------------------------------{
// @type used to store pivot high/low data
//
// @field d (array) The array where the trend direction is to be maintained
// @field x (array) The array where the bar index value of pivot high/low is to be maintained
// @field y (array) The array where the price value of pivot high/low is to be maintained
type ZZ
int d
int x
float y
// @type bar properties with their values
//
// @field o (float) open price of the bar
// @field h (float) high price of the bar
// @field l (float) low price of the bar
// @field c (float) close price of the bar
// @field i (int) index of the bar
type bar
float o = open
float h = high
float l = low
float c = close
int i = bar_index
// @type liquidity object definition
//
// @field bx (box) box maitaing the liquity level margin extreme levels
// @field bxz (box) box maitaing the liquity zone margin extreme levels
// @field bxt (box) box maitaing the labels
// @field brZ (bool) mainains broken zone status
// @field brL (bool) mainains broken level status
// @field ln (line) maitaing the liquity level line
// @field lne (line) maitaing the liquity extended level line
type liq
box bx
box bxz
box bxt
bool brZ
bool brL
line ln
line lne
//-----------------------------------------------------------------------------}
//Variables
//-----------------------------------------------------------------------------{
var ZZ aZZ = ZZ.new(
array.new (maxSize, 0),
array.new (maxSize, 0),
array.new (maxSize, na)
)
bar b = bar.new()
var liq b_liq_B = array.new (1, liq.new(box(na), box(na), box(na), false, false, line(na), line(na)))
var liq b_liq_S = array.new (1, liq.new(box(na), box(na), box(na), false, false, line(na), line(na)))
var b_liq_V = array.new_box()
var int dir = na, var int x1 = na, var float y1 = na, var int x2 = na, var float y2 = na
//-----------------------------------------------------------------------------}
//Functions/methods
//-----------------------------------------------------------------------------{
// @function maintains arrays
// it prepends a `value` to the arrays and removes their oldest element at last position
// @param aZZ (UDT, array, array>) The UDT obejct of arrays
// @param _d (array) The array where the trend direction is maintained
// @param _x (array) The array where the bar index value of pivot high/low is maintained
// @param _y (array) The array where the price value of pivot high/low is maintained
//
// @returns none
method in_out(ZZ aZZ, int _d, int _x, float _y) =>
aZZ.d.unshift(_d), aZZ.x.unshift(_x), aZZ.y.unshift(_y), aZZ.d.pop(), aZZ.x.pop(), aZZ.y.pop()
// @function (build-in) sets the maximum number of bars that is available for historical reference
max_bars_back(time, 1000)
//-----------------------------------------------------------------------------}
//Calculations
//-----------------------------------------------------------------------------{
x2 := b.i - 1
ph = ta.pivothigh(liqLen, 1)
pl = ta.pivotlow (liqLen, 1)
if ph
dir := aZZ.d.get(0)
x1 := aZZ.x.get(0)
y1 := aZZ.y.get(0)
y2 := nz(b.h )
if dir < 1
aZZ.in_out(1, x2, y2)
else
if dir == 1 and ph > y1
aZZ.x.set(0, x2), aZZ.y.set(0, y2)
if per
count = 0
st_P = 0.
st_B = 0
minP = 0.
maxP = 10e6
for i = 0 to maxSize - 1
if aZZ.d.get(i) == 1
if aZZ.y.get(i) > ph + (atr / liqMar)
break
else
if aZZ.y.get(i) > ph - (atr / liqMar) and aZZ.y.get(i) < ph + (atr / liqMar)
count += 1
st_B := aZZ.x.get(i)
st_P := aZZ.y.get(i)
if aZZ.y.get(i) > minP
minP := aZZ.y.get(i)
if aZZ.y.get(i) < maxP
maxP := aZZ.y.get(i)
if count > 2
getB = b_liq_B.get(0)
if st_B == getB.bx.get_left()
getB.bx.set_top(math.avg(minP, maxP) + (atr / liqMar))
getB.bx.set_rightbottom(b.i + 10, math.avg(minP, maxP) - (atr / liqMar))
else
b_liq_B.unshift(
liq.new(
box.new(st_B, math.avg(minP, maxP) + (atr / liqMar), b.i + 10, math.avg(minP, maxP) - (atr / liqMar), bgcolor=color(na), border_color=color(na)),
box.new(na, na, na, na, bgcolor = color(na), border_color = color(na)),
box.new(st_B, st_P, b.i + 10, st_P, text = 'Buyside liquidity', text_size = size.tiny, text_halign = text.align_left, text_valign = text.align_bottom, text_color = color.new(cLIQ_B, 25), bgcolor = color(na), border_color = color(na)),
false,
false,
line.new(st_B , st_P, b.i - 1, st_P, color = color.new(cLIQ_B, 0)),
line.new(b.i - 1, st_P, na , st_P, color = color.new(cLIQ_B, 0), style = line.style_dotted))
)
alert('buyside liquidity level detected/updated for ' + syminfo.ticker)
if b_liq_B.size() > visLiq
getLast = b_liq_B.pop()
getLast.bx.delete()
getLast.bxz.delete()
getLast.bxt.delete()
getLast.ln.delete()
getLast.lne.delete()
if pl
dir := aZZ.d.get (0)
x1 := aZZ.x.get (0)
y1 := aZZ.y.get (0)
y2 := nz(b.l )
if dir > -1
aZZ.in_out(-1, x2, y2)
else
if dir == -1 and pl < y1
aZZ.x.set(0, x2), aZZ.y.set(0, y2)
if per
count = 0
st_P = 0.
st_B = 0
minP = 0.
maxP = 10e6
for i = 0 to maxSize - 1
if aZZ.d.get(i) == -1
if aZZ.y.get(i) < pl - (atr / liqMar)
break
else
if aZZ.y.get(i) > pl - (atr / liqMar) and aZZ.y.get(i) < pl + (atr / liqMar)
count += 1
st_B := aZZ.x.get(i)
st_P := aZZ.y.get(i)
if aZZ.y.get(i) > minP
minP := aZZ.y.get(i)
if aZZ.y.get(i) < maxP
maxP := aZZ.y.get(i)
if count > 2
getB = b_liq_S.get(0)
if st_B == getB.bx.get_left()
getB.bx.set_top(math.avg(minP, maxP) + (atr / liqMar))
getB.bx.set_rightbottom(b.i + 10, math.avg(minP, maxP) - (atr / liqMar))
else
b_liq_S.unshift(
liq.new(
box.new(st_B, math.avg(minP, maxP) + (atr / liqMar), b.i + 10, math.avg(minP, maxP) - (atr / liqMar), bgcolor=color(na), border_color=color(na)),
box.new(na, na, na, na, bgcolor=color(na), border_color=color(na)),
box.new(st_B, st_P, b.i + 10, st_P, text = 'Sellside liquidity', text_size = size.tiny, text_halign = text.align_left, text_valign = text.align_top, text_color = color.new(cLIQ_S, 25), bgcolor=color(na), border_color=color(na)),
false,
false,
line.new(st_B , st_P, b.i - 1, st_P, color = color.new(cLIQ_S, 0)),
line.new(b.i - 1, st_P, na , st_P, color = color.new(cLIQ_S, 0), style = line.style_dotted))
)
alert('sellside liquidity level detected/updated for ' + syminfo.ticker)
if b_liq_S.size() > visLiq
getLast = b_liq_S.pop()
getLast.bx.delete()
getLast.bxz.delete()
getLast.bxt.delete()
getLast.ln.delete()
getLast.lne.delete()
for i = 0 to b_liq_B.size() - 1
x = b_liq_B.get(i)
if not x.brL
x.lne.set_x2(b.i)
if b.h > x.bx.get_top()
x.brL := true
x.brZ := true
alert('buyside liquidity level breached for ' + syminfo.ticker)
x.bxz.set_lefttop(b.i - 1, math.min(x.ln.get_y1() + marBuy * (atr), b.h))
x.bxz.set_rightbottom(b.i + 1, x.ln.get_y1())
x.bxz.set_bgcolor(color.new(cLIQ_B, liqBuy ? 73 : 100))
else if x.brZ
if b.l > x.ln.get_y1() - marBuy * (atr) and b.h < x.ln.get_y1() + marBuy * (atr)
x.bxz.set_right(b.i + 1)
x.bxz.set_top(math.max(b.h, x.bxz.get_top()))
if liqBuy
x.lne.set_x2(b.i + 1)
else
x.brZ := false
for i = 0 to b_liq_S.size() - 1
x = b_liq_S.get(i)
if not x.brL
x.lne.set_x2(b.i)
if b.l < x.bx.get_bottom()
x.brL := true
x.brZ := true
alert('sellside liquidity level breached for ' + syminfo.ticker)
x.bxz.set_lefttop(b.i - 1, x.ln.get_y1())
x.bxz.set_rightbottom(b.i + 1, math.max(x.ln.get_y1() - marSel * (atr), b.l))
x.bxz.set_bgcolor(color.new(cLIQ_S, liqSel ? 73 : 100))
else if x.brZ
if b.l > x.ln.get_y1() - marSel * (atr) and b.h < x.ln.get_y1() + marSel * (atr)
x.bxz.set_rightbottom(b.i + 1, math.min(b.l, x.bxz.get_bottom()))
if liqSel
x.lne.set_x2(b.i + 1)
else
x.brZ := false
if lqVoid and per
bull = b.l - b.h > atr200 and b.l > b.h and b.c > b.h
bear = b.l - b.h > atr200 and b.h < b.l and b.c < b.l
if bull
l = 13
if bull
st = math.abs(b.l - b.l ) / l
for i = 0 to l - 1
array.push(b_liq_V, box.new(b.i - 2, b.l + i * st, b.i, b.l + (i + 1) * st, border_color = na, bgcolor = color.new(cLQV_B, 90) ))
else
st = math.abs(b.l - b.h ) / l
for i = 0 to l - 1
if lqText and i == 0
array.push(b_liq_V, box.new(b.i - 2, b.h + i * st, b.i, b.h + (i + 1) * st, text = 'Liquidity Void ', text_size = size.tiny, text_halign = text.align_right, text_valign = text.align_bottom, text_color = na, border_color = na, bgcolor = color.new(cLQV_B, 90) ))
else
array.push(b_liq_V, box.new(b.i - 2, b.h + i * st, b.i, b.h + (i + 1) * st, border_color = na, bgcolor = color.new(cLQV_B, 90) ))
if bear
l = 13
if bear
st = math.abs(b.h - b.h) / l
for i = 0 to l - 1
array.push(b_liq_V, box.new(b.i - 2, b.h + i * st, b.i, b.h + (i + 1) * st, border_color = na, bgcolor = color.new(cLQV_S, 90) ))
else
st = math.abs(b.l - b.h) / l
for i = 0 to l - 1
if lqText and i == l - 1
array.push(b_liq_V, box.new(b.i - 2, b.h + i * st, b.i, b.h + (i + 1) * st, text = 'Liquidity Void ', text_size = size.tiny, text_halign = text.align_right, text_valign = text.align_top, text_color = na, border_color = na, bgcolor = color.new(cLQV_S, 90) ))
else
array.push(b_liq_V, box.new(b.i - 2, b.h + i * st, b.i, b.h + (i + 1) * st, border_color = na, bgcolor = color.new(cLQV_S, 90) ))
if b_liq_V.size() > 0
qt = b_liq_V.size()
for bn = qt - 1 to 0
if bn < b_liq_V.size()
cb = b_liq_V.get(bn)
ba = math.avg(cb.get_bottom(), cb.get_top())
if math.sign(b.c - ba) != math.sign(b.c - ba) or math.sign(b.c - ba) != math.sign(b.l - ba) or math.sign(b.c - ba) != math.sign(b.h - ba)
b_liq_V.remove(bn)
else
cb.set_right(b.i + 1)
if b.i - cb.get_left() > 21
cb.set_text_color(color.new(color.gray, 25))
//-----------------------------------------------------------------------------}

TTB_TableBuilderLibrary "TTB_TableBuilder"
A helper library to make it simpler to create tables in pinescript
DefaultDarkStyle()
method Size(this, width, height)
Change the size (width, height) of the table cell.
Namespace types: Cell
Parameters:
this (Cell)
width (int)
height (int)
Returns: Cell
method Size(this, width, height)
Change the width of all cells in that row
Namespace types: Row
Parameters:
this (Row)
width (int)
height (int)
Returns: Row
method Width(this, width)
Change the width of the table cell.
Namespace types: Cell
Parameters:
this (Cell)
width (int)
Returns: Cell
method Width(this, width)
Change the width of all cells in that row
Namespace types: Row
Parameters:
this (Row)
width (int)
Returns: Row
method Height(this, height)
Change the height of the table cell.
Namespace types: Cell
Parameters:
this (Cell)
height (int)
Returns: Cell
method Height(this, height)
Change the height of all cells in that row
Namespace types: Row
Parameters:
this (Row)
height (int)
Returns: Row
method Text(this, text_)
Change the text of the table cell.
Namespace types: Cell
Parameters:
this (Cell)
text_ (string)
Returns: Cell
method Text(this, c0, c1, c3, c4, c5, c6, c7, c8, c9, c10, c11, c12, c13, c14, c15, c16, c17, c18, c19, c20, c21, c22, c23, c24, c25, c26, c27, c28, c29)
Set text
Namespace types: Row
Parameters:
this (Row)
c0 (string) : ... c29
c1 (string)
c3 (string)
c4 (string)
c5 (string)
c6 (string)
c7 (string)
c8 (string)
c9 (string)
c10 (string)
c11 (string)
c12 (string)
c13 (string)
c14 (string)
c15 (string)
c16 (string)
c17 (string)
c18 (string)
c19 (string)
c20 (string)
c21 (string)
c22 (string)
c23 (string)
c24 (string)
c25 (string)
c26 (string)
c27 (string)
c28 (string)
c29 (string)
Returns: Row
method TextSize(this, text_size)
Change the text size of the table cell.
Namespace types: Cell
Parameters:
this (Cell)
text_size (string)
Returns: Cell
method TextSize(this, text_size)
Set text size
Namespace types: Row
Parameters:
this (Row)
text_size (string)
Returns: Row
method TextColor(this, c)
Change the text color of the table cell.
Namespace types: Cell
Parameters:
this (Cell)
c (color)
Returns: Cell
method TextColor(this, text_color)
Change the text color of all cells in that row
Namespace types: Row
Parameters:
this (Row)
text_color (color)
Returns: Row
method Bg(this, c)
Change the background color of the table cell.
Namespace types: Cell
Parameters:
this (Cell)
c (color)
Returns: Cell
method Bg(this, bg)
Change the background color of all cells in that row
Namespace types: Row
Parameters:
this (Row)
bg (color)
Returns: Row
method Font(this, text_font_family)
Change the font family of the table cell.
Namespace types: Cell
Parameters:
this (Cell)
text_font_family (string)
Returns: Cell
method Font(this, text_font_family)
Change the width of all cells in that row
Namespace types: Row
Parameters:
this (Row)
text_font_family (string)
Returns: Row
method AlignH(this, halign)
Change the horizontal align of the table cell.
Namespace types: Cell
Parameters:
this (Cell)
halign (string)
Returns: Cell
method AlignH(this, halign)
Change the horizontal align of all cells in that row
Namespace types: Row
Parameters:
this (Row)
halign (string)
Returns: Cell
method AlignV(this, valign)
Change the vertical align of the table cell.
Namespace types: Cell
Parameters:
this (Cell)
valign (string)
Returns: Cell
method AlignV(this, valign)
Change the vertical of all cells in that row
Namespace types: Row
Parameters:
this (Row)
valign (string)
Returns: Cell
method C(this, column)
Get the cell corresponding to the column number
Namespace types: Row
Parameters:
this (Row)
column (int)
Returns: Cell
method C(this, column, row)
Namespace types: Table
Parameters:
this (Table)
column (int)
row (int)
method R(this, row)
Namespace types: Table
Parameters:
this (Table)
row (int)
method Style(this, style)
Namespace types: Table
Parameters:
this (Table)
style (TableStyle)
method Position(this, position)
Namespace types: Table
Parameters:
this (Table)
position (string)
new(position, columns, rows, style)
Parameters:
position (string)
columns (int)
rows (int)
style (TableStyle)
CellStyle
Fields:
text_color (series__color)
text_halign (series__string)
text_valign (series__string)
text_size (series__integer)
bgcolor (series__color)
tooltip (series__string)
text_font_family (series__string)
TableStyle
Fields:
bgcolor (series__color)
frame_color (series__color)
frame_width (series__integer)
border_color (series__color)
border_width (series__integer)
default_cell_style (|CellStyle|#OBJ)
Cell
Fields:
ref (series__table)
column (series__integer)
row (series__integer)
Row
Fields:
ref (series__table)
row (series__integer)
cells (array__|Cell|#OBJ)
Table
Fields:
body (series__table)
rows (array__|Row|#OBJ)
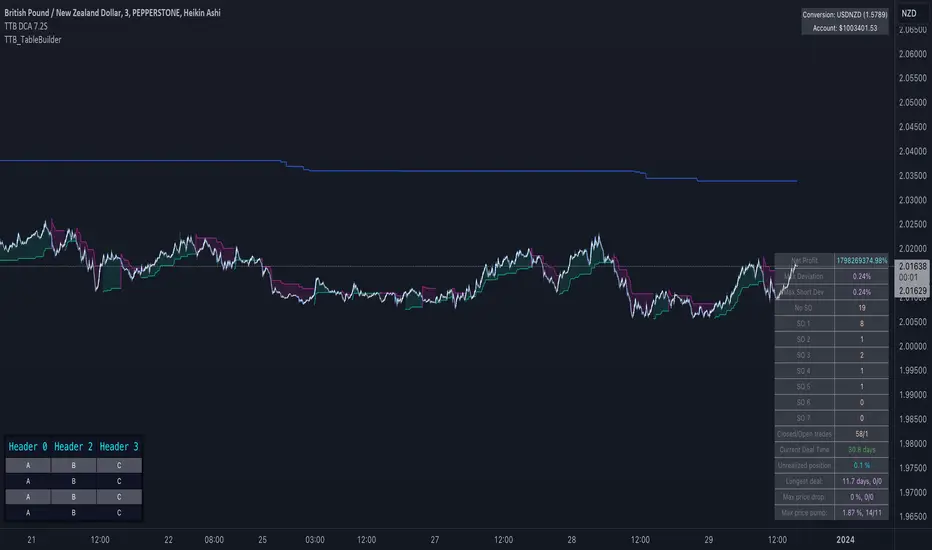
Bar Index & TimeLibrary to convert a bar index to a timestamp and vice versa.
Utilizes runtime memory to store the 𝚝𝚒𝚖𝚎 and 𝚝𝚒𝚖𝚎_𝚌𝚕𝚘𝚜𝚎 values of every bar on the chart (and optional future bars), with the ability of storing additional custom values for every chart bar.
█ PREFACE
This library aims to tackle some problems that pine coders (from beginners to advanced) often come across, such as:
I'm trying to draw an object with a 𝚋𝚊𝚛_𝚒𝚗𝚍𝚎𝚡 that is more than 10,000 bars into the past, but this causes my script to fail. How can I convert the 𝚋𝚊𝚛_𝚒𝚗𝚍𝚎𝚡 to a UNIX time so that I can draw visuals using xloc.bar_time ?
I have a diagonal line drawing and I want to get the "y" value at a specific time, but line.get_price() only accepts a bar index value. How can I convert the timestamp into a bar index value so that I can still use this function?
I want to get a previous 𝚘𝚙𝚎𝚗 value that occurred at a specific timestamp. How can I convert the timestamp into a historical offset so that I can use 𝚘𝚙𝚎𝚗 ?
I want to reference a very old value for a variable. How can I access a previous value that is older than the maximum historical buffer size of 𝚟𝚊𝚛𝚒𝚊𝚋𝚕𝚎 ?
This library can solve the above problems (and many more) with the addition of a few lines of code, rather than requiring the coder to refactor their script to accommodate the limitations.
█ OVERVIEW
The core functionality provided is conversion between xloc.bar_index and xloc.bar_time values.
The main component of the library is the 𝙲𝚑𝚊𝚛𝚝𝙳𝚊𝚝𝚊 object, created via the 𝚌𝚘𝚕𝚕𝚎𝚌𝚝𝙲𝚑𝚊𝚛𝚝𝙳𝚊𝚝𝚊() function which basically stores the 𝚝𝚒𝚖𝚎 and 𝚝𝚒𝚖𝚎_𝚌𝚕𝚘𝚜𝚎 of every bar on the chart, and there are 3 more overloads to this function that allow collecting and storing additional data. Once a 𝙲𝚑𝚊𝚛𝚝𝙳𝚊𝚝𝚊 object is created, use any of the exported methods:
Methods to convert a UNIX timestamp into a bar index or bar offset:
𝚝𝚒𝚖𝚎𝚜𝚝𝚊𝚖𝚙𝚃𝚘𝙱𝚊𝚛𝙸𝚗𝚍𝚎𝚡(), 𝚐𝚎𝚝𝙽𝚞𝚖𝚋𝚎𝚛𝙾𝚏𝙱𝚊𝚛𝚜𝙱𝚊𝚌𝚔()
Methods to retrieve the stored data for a bar index:
𝚝𝚒𝚖𝚎𝙰𝚝𝙱𝚊𝚛𝙸𝚗𝚍𝚎𝚡(), 𝚝𝚒𝚖𝚎𝙲𝚕𝚘𝚜𝚎𝙰𝚝𝙱𝚊𝚛𝙸𝚗𝚍𝚎𝚡(), 𝚟𝚊𝚕𝚞𝚎𝙰𝚝𝙱𝚊𝚛𝙸𝚗𝚍𝚎𝚡(), 𝚐𝚎𝚝𝙰𝚕𝚕𝚅𝚊𝚛𝚒𝚊𝚋𝚕𝚎𝚜𝙰𝚝𝙱𝚊𝚛𝙸𝚗𝚍𝚎𝚡()
Methods to retrieve the stored data at a number of bars back (i.e., historical offset):
𝚝𝚒𝚖𝚎(), 𝚝𝚒𝚖𝚎𝙲𝚕𝚘𝚜𝚎(), 𝚟𝚊𝚕𝚞𝚎()
Methods to retrieve all the data points from the earliest bar (or latest bar) stored in memory, which can be useful for debugging purposes:
𝚐𝚎𝚝𝙴𝚊𝚛𝚕𝚒𝚎𝚜𝚝𝚂𝚝𝚘𝚛𝚎𝚍𝙳𝚊𝚝𝚊(), 𝚐𝚎𝚝𝙻𝚊𝚝𝚎𝚜𝚝𝚂𝚝𝚘𝚛𝚎𝚍𝙳𝚊𝚝𝚊()
Note: the library's strong suit is referencing data from very old bars in the past, which is especially useful for scripts that perform its necessary calculations only on the last bar.
█ USAGE
Step 1
Import the library. Replace with the latest available version number for this library.
//@version=6
indicator("Usage")
import n00btraders/ChartData/
Step 2
Create a 𝙲𝚑𝚊𝚛𝚝𝙳𝚊𝚝𝚊 object to collect data on every bar. Do not declare as `var` or `varip`.
chartData = ChartData.collectChartData() // call on every bar to accumulate the necessary data
Step 3
Call any method(s) on the 𝙲𝚑𝚊𝚛𝚝𝙳𝚊𝚝𝚊 object. Do not modify its fields directly.
if barstate.islast
int firstBarTime = chartData.timeAtBarIndex(0)
int lastBarTime = chartData.time(0)
log.info("First `time`: " + str.format_time(firstBarTime) + ", Last `time`: " + str.format_time(lastBarTime))
█ EXAMPLES
• Collect Future Times
The overloaded 𝚌𝚘𝚕𝚕𝚎𝚌𝚝𝙲𝚑𝚊𝚛𝚝𝙳𝚊𝚝𝚊() functions that accept a 𝚋𝚊𝚛𝚜𝙵𝚘𝚛𝚠𝚊𝚛𝚍 argument can additionally store time values for up to 500 bars into the future.
//@version=6
indicator("Example `collectChartData(barsForward)`")
import n00btraders/ChartData/1
chartData = ChartData.collectChartData(barsForward = 500)
var rectangle = box.new(na, na, na, na, xloc = xloc.bar_time, force_overlay = true)
if barstate.islast
int futureTime = chartData.timeAtBarIndex(bar_index + 100)
int lastBarTime = time
box.set_lefttop(rectangle, lastBarTime, open)
box.set_rightbottom(rectangle, futureTime, close)
box.set_text(rectangle, "Extending box 100 bars to the right. Time: " + str.format_time(futureTime))
• Collect Custom Data
The overloaded 𝚌𝚘𝚕𝚕𝚎𝚌𝚝𝙲𝚑𝚊𝚛𝚝𝙳𝚊𝚝𝚊() functions that accept a 𝚟𝚊𝚛𝚒𝚊𝚋𝚕𝚎𝚜 argument can additionally store custom user-specified values for every bar on the chart.
//@version=6
indicator("Example `collectChartData(variables)`")
import n00btraders/ChartData/1
var map variables = map.new()
variables.put("open", open)
variables.put("close", close)
variables.put("open-close midpoint", (open + close) / 2)
variables.put("boolean", open > close ? 1 : 0)
chartData = ChartData.collectChartData(variables = variables)
var fgColor = chart.fg_color
var table1 = table.new(position.top_right, 2, 9, color(na), fgColor, 1, fgColor, 1, true)
var table2 = table.new(position.bottom_right, 2, 9, color(na), fgColor, 1, fgColor, 1, true)
if barstate.isfirst
table.cell(table1, 0, 0, "ChartData.value()", text_color = fgColor)
table.cell(table2, 0, 0, "open ", text_color = fgColor)
table.merge_cells(table1, 0, 0, 1, 0)
table.merge_cells(table2, 0, 0, 1, 0)
for i = 1 to 8
table.cell(table1, 0, i, text_color = fgColor, text_halign = text.align_left, text_font_family = font.family_monospace)
table.cell(table2, 0, i, text_color = fgColor, text_halign = text.align_left, text_font_family = font.family_monospace)
table.cell(table1, 1, i, text_color = fgColor)
table.cell(table2, 1, i, text_color = fgColor)
if barstate.islast
for i = 1 to 8
float open1 = chartData.value("open", 5000 * i)
float open2 = i < 3 ? open : -1
table.cell_set_text(table1, 0, i, "chartData.value(\"open\", " + str.tostring(5000 * i) + "): ")
table.cell_set_text(table2, 0, i, "open : ")
table.cell_set_text(table1, 1, i, str.tostring(open1))
table.cell_set_text(table2, 1, i, open2 >= 0 ? str.tostring(open2) : "Error")
• xloc.bar_index → xloc.bar_time
The 𝚝𝚒𝚖𝚎 value (or 𝚝𝚒𝚖𝚎_𝚌𝚕𝚘𝚜𝚎 value) can be retrieved for any bar index that is stored in memory by the 𝙲𝚑𝚊𝚛𝚝𝙳𝚊𝚝𝚊 object.
//@version=6
indicator("Example `timeAtBarIndex()`")
import n00btraders/ChartData/1
chartData = ChartData.collectChartData()
if barstate.islast
int start = bar_index - 15000
int end = bar_index - 100
// line.new(start, close, end, close) // !ERROR - `start` value is too far from current bar index
start := chartData.timeAtBarIndex(start)
end := chartData.timeAtBarIndex(end)
line.new(start, close, end, close, xloc.bar_time, width = 10)
• xloc.bar_time → xloc.bar_index
Use 𝚝𝚒𝚖𝚎𝚜𝚝𝚊𝚖𝚙𝚃𝚘𝙱𝚊𝚛𝙸𝚗𝚍𝚎𝚡() to find the bar that a timestamp belongs to.
If the timestamp falls in between the close of one bar and the open of the next bar,
the 𝚜𝚗𝚊𝚙 parameter can be used to determine which bar to choose:
𝚂𝚗𝚊𝚙.𝙻𝙴𝙵𝚃 - prefer to choose the leftmost bar (typically used for closing times)
𝚂𝚗𝚊𝚙.𝚁𝙸𝙶𝙷𝚃 - prefer to choose the rightmost bar (typically used for opening times)
𝚂𝚗𝚊𝚙.𝙳𝙴𝙵𝙰𝚄𝙻𝚃 (or 𝚗𝚊) - copies the same behavior as xloc.bar_time uses for drawing objects
//@version=6
indicator("Example `timestampToBarIndex()`")
import n00btraders/ChartData/1
startTimeInput = input.time(timestamp("01 Aug 2025 08:30 -0500"), "Session Start Time")
endTimeInput = input.time(timestamp("01 Aug 2025 15:15 -0500"), "Session End Time")
chartData = ChartData.collectChartData()
if barstate.islastconfirmedhistory
int startBarIndex = chartData.timestampToBarIndex(startTimeInput, ChartData.Snap.RIGHT)
int endBarIndex = chartData.timestampToBarIndex(endTimeInput, ChartData.Snap.LEFT)
line1 = line.new(startBarIndex, 0, startBarIndex, 1, extend = extend.both, color = color.new(color.green, 60), force_overlay = true)
line2 = line.new(endBarIndex, 0, endBarIndex, 1, extend = extend.both, color = color.new(color.green, 60), force_overlay = true)
linefill.new(line1, line2, color.new(color.green, 90))
// using Snap.DEFAULT to show that it is equivalent to drawing lines using `xloc.bar_time` (i.e., it aligns to the same bars)
startBarIndex := chartData.timestampToBarIndex(startTimeInput)
endBarIndex := chartData.timestampToBarIndex(endTimeInput)
line.new(startBarIndex, 0, startBarIndex, 1, extend = extend.both, color = color.yellow, width = 3)
line.new(endBarIndex, 0, endBarIndex, 1, extend = extend.both, color = color.yellow, width = 3)
line.new(startTimeInput, 0, startTimeInput, 1, xloc.bar_time, extend.both, color.new(color.blue, 85), width = 11)
line.new(endTimeInput, 0, endTimeInput, 1, xloc.bar_time, extend.both, color.new(color.blue, 85), width = 11)
• Get Price of Line at Timestamp
The pine script built-in function line.get_price() requires working with bar index values. To get the price of a line in terms of a timestamp, convert the timestamp into a bar index or offset.
//@version=6
indicator("Example `line.get_price()` at timestamp")
import n00btraders/ChartData/1
lineStartInput = input.time(timestamp("01 Aug 2025 08:30 -0500"), "Line Start")
chartData = ChartData.collectChartData()
var diagonal = line.new(na, na, na, na, force_overlay = true)
if time <= lineStartInput
line.set_xy1(diagonal, bar_index, open)
if barstate.islastconfirmedhistory
line.set_xy2(diagonal, bar_index, close)
if barstate.islast
int timeOneWeekAgo = timenow - (7 * timeframe.in_seconds("1D") * 1000)
// Note: could also use `timetampToBarIndex(timeOneWeekAgo, Snap.DEFAULT)` and pass the value directly to `line.get_price()`
int barsOneWeekAgo = chartData.getNumberOfBarsBack(timeOneWeekAgo)
float price = line.get_price(diagonal, bar_index - barsOneWeekAgo)
string formatString = "Time 1 week ago: {0,number,#}\n - Equivalent to {1} bars ago\n\n𝚕𝚒𝚗𝚎.𝚐𝚎𝚝_𝚙𝚛𝚒𝚌𝚎(): {2,number,#.##}"
string labelText = str.format(formatString, timeOneWeekAgo, barsOneWeekAgo, price)
label.new(timeOneWeekAgo, price, labelText, xloc.bar_time, style = label.style_label_lower_right, size = 16, textalign = text.align_left, force_overlay = true)
█ RUNTIME ERROR MESSAGES
This library's functions will generate a custom runtime error message in the following cases:
𝚌𝚘𝚕𝚕𝚎𝚌𝚝𝙲𝚑𝚊𝚛𝚝𝙳𝚊𝚝𝚊() is not called consecutively, or is called more than once on a single bar
Invalid 𝚋𝚊𝚛𝚜𝙵𝚘𝚛𝚠𝚊𝚛𝚍 argument in the 𝚌𝚘𝚕𝚕𝚎𝚌𝚝𝙲𝚑𝚊𝚛𝚝𝙳𝚊𝚝𝚊() function
Invalid 𝚟𝚊𝚛𝚒𝚊𝚋𝚕𝚎𝚜 argument in the 𝚌𝚘𝚕𝚕𝚎𝚌𝚝𝙲𝚑𝚊𝚛𝚝𝙳𝚊𝚝𝚊() function
Invalid 𝚕𝚎𝚗𝚐𝚝𝚑 argument in any of the functions that accept a number of bars back
Note: there is no runtime error generated for an invalid 𝚝𝚒𝚖𝚎𝚜𝚝𝚊𝚖𝚙 or 𝚋𝚊𝚛𝙸𝚗𝚍𝚎𝚡 argument in any of the functions. Instead, the functions will assign 𝚗𝚊 to the returned values.
Any other runtime errors are due to incorrect usage of the library.
█ NOTES
• Function Descriptions
The library source code uses Markdown for the exported functions. Hover over a function/method call in the Pine Editor to display formatted, detailed information about the function/method.
//@version=6
indicator("Demo Function Tooltip")
import n00btraders/ChartData/1
chartData = ChartData.collectChartData()
int barIndex = chartData.timestampToBarIndex(timenow)
log.info(str.tostring(barIndex))
• Historical vs. Realtime Behavior
Under the hood, the data collector for this library is declared as `var`. Because of this, the 𝙲𝚑𝚊𝚛𝚝𝙳𝚊𝚝𝚊 object will always reflect the latest available data on realtime updates. Any data that is recorded for historical bars will remain unchanged throughout the execution of a script.
//@version=6
indicator("Demo Realtime Behavior")
import n00btraders/ChartData/1
var map variables = map.new()
variables.put("open", open)
variables.put("close", close)
chartData = ChartData.collectChartData(variables)
if barstate.isrealtime
varip float initialOpen = open
varip float initialClose = close
varip int updateCount = 0
updateCount += 1
float latestOpen = open
float latestClose = close
float recordedOpen = chartData.valueAtBarIndex("open", bar_index)
float recordedClose = chartData.valueAtBarIndex("close", bar_index)
string formatString = "# of updates: {0}\n\n𝚘𝚙𝚎𝚗 at update #1: {1,number,#.##}\n𝚌𝚕𝚘𝚜𝚎 at update #1: {2,number,#.##}\n\n"
+ "𝚘𝚙𝚎𝚗 at update #{0}: {3,number,#.##}\n𝚌𝚕𝚘𝚜𝚎 at update #{0}: {4,number,#.##}\n\n"
+ "𝚘𝚙𝚎𝚗 stored in memory: {5,number,#.##}\n𝚌𝚕𝚘𝚜𝚎 stored in memory: {6,number,#.##}"
string labelText = str.format(formatString, updateCount, initialOpen, initialClose, latestOpen, latestClose, recordedOpen, recordedClose)
label.new(bar_index, close, labelText, style = label.style_label_left, force_overlay = true)
• Collecting Chart Data for Other Contexts
If your use case requires collecting chart data from another context, avoid directly retrieving the 𝙲𝚑𝚊𝚛𝚝𝙳𝚊𝚝𝚊 object as this may exceed memory limits .
//@version=6
indicator("Demo Return Calculated Results")
import n00btraders/ChartData/1
timeInput = input.time(timestamp("01 Sep 2025 08:30 -0500"), "Time")
var int oneMinuteBarsAgo = na
// !ERROR - Memory Limits Exceeded
// chartDataArray = request.security_lower_tf(syminfo.tickerid, "1", ChartData.collectChartData())
// oneMinuteBarsAgo := chartDataArray.last().getNumberOfBarsBack(timeInput)
// function that returns calculated results (a single integer value instead of an entire `ChartData` object)
getNumberOfBarsBack() =>
chartData = ChartData.collectChartData()
chartData.getNumberOfBarsBack(timeInput)
calculatedResultsArray = request.security_lower_tf(syminfo.tickerid, "1", getNumberOfBarsBack())
oneMinuteBarsAgo := calculatedResultsArray.size() > 0 ? calculatedResultsArray.last() : na
if barstate.islast
string labelText = str.format("The selected timestamp occurs 1-minute bars ago", oneMinuteBarsAgo)
label.new(bar_index, hl2, labelText, style = label.style_label_left, size = 16, force_overlay = true)
• Memory Usage
The library's convenience and ease of use comes at the cost of increased usage of computational resources. For simple scripts, using this library will likely not cause any issues with exceeding memory limits. But for large and complex scripts, you can reduce memory issues by specifying a lower 𝚌𝚊𝚕𝚌_𝚋𝚊𝚛𝚜_𝚌𝚘𝚞𝚗𝚝 amount in the indicator() or strategy() declaration statement.
//@version=6
// !ERROR - Memory Limits Exceeded using the default number of bars available (~20,000 bars for Premium plans)
//indicator("Demo `calc_bars_count` parameter")
// Reduce number of bars using `calc_bars_count` parameter
indicator("Demo `calc_bars_count` parameter", calc_bars_count = 15000)
import n00btraders/ChartData/1
map variables = map.new()
variables.put("open", open)
variables.put("close", close)
variables.put("weekofyear", weekofyear)
variables.put("dayofmonth", dayofmonth)
variables.put("hour", hour)
variables.put("minute", minute)
variables.put("second", second)
// simulate large memory usage
chartData0 = ChartData.collectChartData(variables)
chartData1 = ChartData.collectChartData(variables)
chartData2 = ChartData.collectChartData(variables)
chartData3 = ChartData.collectChartData(variables)
chartData4 = ChartData.collectChartData(variables)
chartData5 = ChartData.collectChartData(variables)
chartData6 = ChartData.collectChartData(variables)
chartData7 = ChartData.collectChartData(variables)
chartData8 = ChartData.collectChartData(variables)
chartData9 = ChartData.collectChartData(variables)
log.info(str.tostring(chartData0.time(0)))
log.info(str.tostring(chartData1.time(0)))
log.info(str.tostring(chartData2.time(0)))
log.info(str.tostring(chartData3.time(0)))
log.info(str.tostring(chartData4.time(0)))
log.info(str.tostring(chartData5.time(0)))
log.info(str.tostring(chartData6.time(0)))
log.info(str.tostring(chartData7.time(0)))
log.info(str.tostring(chartData8.time(0)))
log.info(str.tostring(chartData9.time(0)))
if barstate.islast
result = table.new(position.middle_right, 1, 1, force_overlay = true)
table.cell(result, 0, 0, "Script Execution Successful ✅", text_size = 40)
█ EXPORTED ENUMS
Snap
Behavior for determining the bar that a timestamp belongs to.
Fields:
LEFT : Snap to the leftmost bar.
RIGHT : Snap to the rightmost bar.
DEFAULT : Default `xloc.bar_time` behavior.
Note: this enum is used for the 𝚜𝚗𝚊𝚙 parameter of 𝚝𝚒𝚖𝚎𝚜𝚝𝚊𝚖𝚙𝚃𝚘𝙱𝚊𝚛𝙸𝚗𝚍𝚎𝚡().
█ EXPORTED TYPES
Note: users of the library do not need to worry about directly accessing the fields of these types; all computations are done through method calls on an object of the 𝙲𝚑𝚊𝚛𝚝𝙳𝚊𝚝𝚊 type.
Variable
Represents a user-specified variable that can be tracked on every chart bar.
Fields:
name (series string) : Unique identifier for the variable.
values (array) : The array of stored values (one value per chart bar).
ChartData
Represents data for all bars on a chart.
Fields:
bars (series int) : Current number of bars on the chart.
timeValues (array) : The `time` values of all chart (and future) bars.
timeCloseValues (array) : The `time_close` values of all chart (and future) bars.
variables (array) : Additional custom values to track on all chart bars.
█ EXPORTED FUNCTIONS
collectChartData()
Collects and tracks the `time` and `time_close` value of every bar on the chart.
Returns: `ChartData` object to convert between `xloc.bar_index` and `xloc.bar_time`.
collectChartData(barsForward)
Collects and tracks the `time` and `time_close` value of every bar on the chart as well as a specified number of future bars.
Parameters:
barsForward (simple int) : Number of future bars to collect data for.
Returns: `ChartData` object to convert between `xloc.bar_index` and `xloc.bar_time`.
collectChartData(variables)
Collects and tracks the `time` and `time_close` value of every bar on the chart. Additionally, tracks a custom set of variables for every chart bar.
Parameters:
variables (simple map) : Custom values to collect on every chart bar.
Returns: `ChartData` object to convert between `xloc.bar_index` and `xloc.bar_time`.
collectChartData(barsForward, variables)
Collects and tracks the `time` and `time_close` value of every bar on the chart as well as a specified number of future bars. Additionally, tracks a custom set of variables for every chart bar.
Parameters:
barsForward (simple int) : Number of future bars to collect data for.
variables (simple map) : Custom values to collect on every chart bar.
Returns: `ChartData` object to convert between `xloc.bar_index` and `xloc.bar_time`.
█ EXPORTED METHODS
method timestampToBarIndex(chartData, timestamp, snap)
Converts a UNIX timestamp to a bar index.
Namespace types: ChartData
Parameters:
chartData (series ChartData) : The `ChartData` object.
timestamp (series int) : A UNIX time.
snap (series Snap) : A `Snap` enum value.
Returns: A bar index, or `na` if unable to find the appropriate bar index.
method getNumberOfBarsBack(chartData, timestamp)
Converts a UNIX timestamp to a history-referencing length (i.e., number of bars back).
Namespace types: ChartData
Parameters:
chartData (series ChartData) : The `ChartData` object.
timestamp (series int) : A UNIX time.
Returns: A bar offset, or `na` if unable to find a valid number of bars back.
method timeAtBarIndex(chartData, barIndex)
Retrieves the `time` value for the specified bar index.
Namespace types: ChartData
Parameters:
chartData (series ChartData) : The `ChartData` object.
barIndex (int) : The bar index.
Returns: The `time` value, or `na` if there is no `time` stored for the bar index.
method time(chartData, length)
Retrieves the `time` value of the bar that is `length` bars back relative to the latest bar.
Namespace types: ChartData
Parameters:
chartData (series ChartData) : The `ChartData` object.
length (series int) : Number of bars back.
Returns: The `time` value `length` bars ago, or `na` if there is no `time` stored for that bar.
method timeCloseAtBarIndex(chartData, barIndex)
Retrieves the `time_close` value for the specified bar index.
Namespace types: ChartData
Parameters:
chartData (series ChartData) : The `ChartData` object.
barIndex (series int) : The bar index.
Returns: The `time_close` value, or `na` if there is no `time_close` stored for the bar index.
method timeClose(chartData, length)
Retrieves the `time_close` value of the bar that is `length` bars back from the latest bar.
Namespace types: ChartData
Parameters:
chartData (series ChartData) : The `ChartData` object.
length (series int) : Number of bars back.
Returns: The `time_close` value `length` bars ago, or `na` if there is none stored.
method valueAtBarIndex(chartData, name, barIndex)
Retrieves the value of a custom variable for the specified bar index.
Namespace types: ChartData
Parameters:
chartData (series ChartData) : The `ChartData` object.
name (series string) : The variable name.
barIndex (series int) : The bar index.
Returns: The value of the variable, or `na` if that variable is not stored for the bar index.
method value(chartData, name, length)
Retrieves a variable value of the bar that is `length` bars back relative to the latest bar.
Namespace types: ChartData
Parameters:
chartData (series ChartData) : The `ChartData` object.
name (series string) : The variable name.
length (series int) : Number of bars back.
Returns: The value `length` bars ago, or `na` if that variable is not stored for the bar index.
method getAllVariablesAtBarIndex(chartData, barIndex)
Retrieves all custom variables for the specified bar index.
Namespace types: ChartData
Parameters:
chartData (series ChartData) : The `ChartData` object.
barIndex (series int) : The bar index.
Returns: Map of all custom variables that are stored for the specified bar index.
method getEarliestStoredData(chartData)
Gets all values from the earliest bar data that is currently stored in memory.
Namespace types: ChartData
Parameters:
chartData (series ChartData) : The `ChartData` object.
Returns: A tuple:
method getLatestStoredData(chartData, futureData)
Gets all values from the latest bar data that is currently stored in memory.
Namespace types: ChartData
Parameters:
chartData (series ChartData) : The `ChartData` object.
futureData (series bool) : Whether to include the future data that is stored in memory.
Returns: A tuple:

CCI TIME COUNT//@version=6
indicator("CCI Multi‑TF", overlay=true)
// === Inputs ===
// CCI Inputs
cciLength = input.int(20, "CCI Length", minval=1)
src = input.source(hlc3, "Source")
// Timeframes
timeframes = array.from("1", "3", "5", "10", "15", "30", "60", "1D", "1W")
labels = array.from("1m", "3m", "5m", "10m", "15m", "30m", "60m", "Daily", "Weekly")
// === Table Settings ===
tblPos = input.string('Top Right', 'Table Position', options = , group = 'Table Settings')
i_textSize = input.string('Small', 'Text Size', options = , group = 'Table Settings')
textSize = i_textSize == 'Small' ? size.small : i_textSize == 'Normal' ? size.normal : i_textSize == 'Large' ? size.large : size.tiny
textColor = color.white
// Resolve table position
var pos = switch tblPos
'Top Left' => position.top_left
'Top Right' => position.top_right
'Bottom Left' => position.bottom_left
'Bottom Right' => position.bottom_right
'Middle Left' => position.middle_left
'Middle Right' => position.middle_right
=> position.top_right
// === Custom CCI Function ===
customCCI(source, length) =>
sma = ta.sma(source, length)
dev = ta.dev(source, length)
(source - sma) / (0.015 * dev)
// === CCI Values for All Timeframes ===
var float cciVals = array.new_float(array.size(timeframes))
for i = 0 to array.size(timeframes) - 1
tf = array.get(timeframes, i)
cciVal = request.security(syminfo.tickerid, tf, customCCI(src, cciLength))
array.set(cciVals, i, cciVal)
// === Countdown Timers ===
var string countdowns = array.new_string(array.size(timeframes))
for i = 0 to array.size(timeframes) - 1
tf = array.get(timeframes, i)
closeTime = request.security(syminfo.tickerid, tf, time_close)
sec_left = barstate.isrealtime and not na(closeTime) ? math.max(0, (closeTime - timenow) / 1000) : na
min_left = sec_left >= 0 ? math.floor(sec_left / 60) : na
sec_mod = sec_left >= 0 ? math.floor(sec_left % 60) : na
timer_text = barstate.isrealtime and not na(sec_left) ? str.format("{0,number,00}:{1,number,00}", min_left, sec_mod) : "–"
array.set(countdowns, i, timer_text)
// === Build Table ===
if barstate.islast
rows = array.size(timeframes) + 1
var table t = table.new(pos, 3, rows, frame_color=color.rgb(252, 250, 250), border_color=color.rgb(243, 243, 243))
// Headers
table.cell(t, 0, 0, "Timeframe", text_color=textColor, bgcolor=color.rgb(238, 240, 242), text_size=textSize)
table.cell(t, 1, 0, "CCI (" + str.tostring(cciLength) + ")", text_color=textColor, bgcolor=color.rgb(239, 243, 246), text_size=textSize)
table.cell(t, 2, 0, "Time to Close", text_color=textColor, bgcolor=color.rgb(239, 244, 248), text_size=textSize)
// Data Rows
for i = 0 to array.size(timeframes) - 1
row = i + 1
label = array.get(labels, i)
cciVal = array.get(cciVals, i)
countdown = array.get(countdowns, i)
// Color CCI: Green if < -100, Red if > 100
cciColor = cciVal < -100 ? color.green : cciVal > 100 ? color.red : color.rgb(236, 237, 240)
// Background warning if <60 seconds to close
tf = array.get(timeframes, i)
closeTime = request.security(syminfo.tickerid, tf, time_close)
sec_left = barstate.isrealtime and not na(closeTime) ? math.max(0, (closeTime - timenow) / 1000) : na
countdownBg = sec_left < 60 ? color.rgb(255, 220, 220, 90) : na
// Table cells
table.cell(t, 0, row, label, text_color=color.rgb(239, 240, 244), text_size=textSize)
table.cell(t, 1, row, str.tostring(cciVal, "#.##"), text_color=cciColor, text_size=textSize)
table.cell(t, 2, row, countdown, text_color=color.rgb(232, 235, 243), bgcolor=countdownBg, text_size=textSize)

Autotable█ OVERVIEW
The library allows to automatically draw a table based on a string or float matrix (or both) controlling all of the parameters of the table (including merging cells) with parameter matrices (like, e.g. matrix of cell colors).
All things you would normally do with table.new() and table.cell() are now possible using respective parameters of library's main function, autotable() (as explained further below).
Headers can be supplied as arrays.
Merging of the cells is controlled with a special matrix of "L" and "U" values which instruct a cell to merged with the cell to the left or upwards (please see examples in the script and in this description).
█ USAGE EXAMPLES
The simplest and most straightforward:
mxF = matrix.new(3,3, 3.14)
mxF.autotable(bgcolor = color.rgb(249, 209, 29)) // displays float matrix as a table in the top right corner with defalult settings
mxS = matrix.new(3,3,"PI")
// displays string matrix as a table in the top right corner with defalult settings
mxS.autotable(Ypos = "bottom", Xpos = "right", bgcolor = #b4d400)
// displays matrix displaying a string value over a float value in each cell
mxS.autotable(mxF, Ypos = "middle", Xpos = "center", bgcolor = color.gray, text_color = #86f62a)
Draws this:
Tables with headers:
if barstate.islast
mxF = matrix.new(3,3, 3.14)
mxS = matrix.new(3,3,"PI")
arColHeaders = array.from("Col1", "Col2", "Col3")
arRowHeaders = array.from("Row1", "Row2", "Row3")
// float matrix with col headers
mxF.autotable(
bgcolor = #fdfd6b
, arColHeaders = arColHeaders
)
// string matrix with row headers
mxS.autotable(arRowHeaders = arRowHeaders, Ypos = "bottom", Xpos = "right", bgcolor = #b4d400)
// string/float matrix with both row and column headers
mxS.autotable(mxF
, Ypos = "middle", Xpos = "center"
, arRowHeaders = arRowHeaders
, arColHeaders = arColHeaders
, cornerBgClr = #707070, cornerTitle = "Corner\ncell", cornerTxtClr = #ffdc13
, bgcolor = color.gray, text_color = #86f62a
)
Draws this:
█ FUNCTIONS
One main function is autotable() which has only one required argument mxValS, a string matrix.
Please see below the description of all of the function parameters:
The table:
tbl (table) (Optional) If supplied, this table will be deleted.
The data:
mxValS (matrix ) (Required) Cell text values
mxValF (matrix) (Optional) Numerical part of cell text values. Is concatenated to the mxValS values via `string_float_separator` string (default "\n")
Table properties, have same effect as in table.new() :
defaultBgColor (color) (Optional) bgcolor to be used if mxBgColor is not supplied
Ypos (string) (Optional) "top", "bottom" or "center"
Xpos (string) (Optional) "left", "right", or "center"
frame_color (color) (Optional) frame_color like in table.new()
frame_width (int) (Optional) frame_width like in table.new()
border_color (color) (Optional) border_color like in table.new()
border_width (int) (Optional) border_width like in table.new()
force_overlay (simple bool) (Optional) If true draws table on main pane.
Cell parameters, have same effect as in table.cell() ):
mxBgColor (matrix) (Optional) like bgcolor argument in table.cell()
mxTextColor (matrix) (Optional) like text_color argument in table.cell()
mxTt (matrix) (Optional) like tooltip argument in table.cell()
mxWidth (matrix) (Optional) like width argument in table.cell()
mxHeight (matrix) (Optional) like height argument in table.cell()
mxHalign (matrix) (Optional) like text_halign argument in table.cell()
mxValign (matrix) (Optional) like text_valign argument in table.cell()
mxTextSize (matrix) (Optional) like text_size argument in table.cell()
mxFontFamily (matrix) (Optional) like text_font_family argument in table.cell()
Other table properties:
tableWidth (float) (Optional) Overrides table width if cell widths are non zero. E.g. if there are four columns and cell widths are 20 (either as set via cellW or via mxWidth) then if tableWidth is set to e.g. 50 then cell widths will be 50 * (20 / 80), where 80 is 20*4 = total width of all cells. Works simialar for widths set via mxWidth - determines max sum of widths across all cloumns of mxWidth and adjusts cell widths proportionally to it. If cell widths are 0 (i.e. auto-adjust) tableWidth has no effect.
tableHeight (float) (Optional) Overrides table height if cell heights are non zero. E.g. if there are four rows and cell heights are 20 (either as set via cellH or via mxHeight) then if tableHeigh is set to e.g. 50 then cell heights will be 50 * (20 / 80), where 80 is 20*4 = total height of all cells. Works simialar for heights set via mxHeight - determines max sum of heights across all cloumns of mxHeight and adjusts cell heights proportionally to it. If cell heights are 0 (i.e. auto-adjust) tableHeight has no effect.
defaultTxtColor (color) (Optional) text_color to be used if mxTextColor is not supplied
text_size (string) (Optional) text_size to be used if mxTextSize is not supplied
font_family (string) (Optional) cell text_font_family value to be used if a value in mxFontFamily is no supplied
cellW (float) (Optional) cell width to be used if a value in mxWidth is no supplied
cellH (float) (Optional) cell height to be used if a value in mxHeight is no supplied
halign (string) (Optional) cell text_halign value to be used if a value in mxHalign is no supplied
valign (string) (Optional) cell text_valign value to be used if a value in mxValign is no supplied
Headers parameters:
arColTitles (array) (Optional) Array of column titles. If not na a header row is added.
arRowTitles (array) (Optional) Array of row titles. If not na a header column is added.
cornerTitle (string) (Optional) If both row and column titles are supplied allows to set the value of the corner cell.
colTitlesBgColor (color) (Optional) bgcolor for header row
colTitlesTxtColor (color) (Optional) text_color for header row
rowTitlesBgColor (color) (Optional) bgcolor for header column
rowTitlesTxtColor (color) (Optional) text_color for header column
cornerBgClr (color) (Optional) bgcolor for the corner cell
cornerTxtClr (color) (Optional) text_color for the corner cell
Cell merge parameters:
mxMerge (matrix) (Optional) A matrix determining how cells will be merged. "L" - cell merges to the left, "U" - upwards.
mergeAllColTitles (bool) (Optional) Allows to print a table title instead of column headers, merging all header row cells and leaving just the value of the first cell. For more flexible options use matrix arguments leaving header/row arguments na.
mergeAllRowTitles (bool) (Optional) Allows to print one text value merging all header row cells and leaving just the value of the first cell. For more flexible options use matrix arguments leaving header/row arguments na.
Format:
string_float_separator (string) (Optional) A string used to separate string and float parts of cell values (mxValS and mxValF). Default is "\n"
format (string) (Optional) format string like in str.format() used to format numerical values
nz (string) (Optional) Determines how na numerical values are displayed.
The only other available function is autotable(string,... ) with a string parameter instead of string and float matrices which draws a one cell table.
█ SAMPLE USE
E.g., CSVParser library demo uses Autotable's for generating complex tables with merged cells.
█ CREDITS
The library was inspired by @kaigouthro's matrixautotable . A true master. Many thanks to him for his creative, beautiful and very helpful libraries.

DebugLibrary "Debug"
Some debugging functions.
label_on_each_bar(txt, y_position, label_size, label_color, txt_color)
Prints a label on every bar to show text. By default, only the last 50 labels will be shown on the chart. You can increase this amount up to a maximum of 500 by using the max_labels_count parameter in your script’s indicator() or strategy() declaration statement.
Parameters:
txt (string) : New label text.
y_position (float) : New price of the label position.
label_size (string) : Possible values: size.auto, size.tiny, size.small, size.normal, size.large, size.huge. Optional. Default value is `size.small`.
label_color (color) : New label border and arrow color. Optional. Default value is `color.blue`.
txt_color (color) : New text color. Optional. Default value is `color.white`.
Returns: void
label_on_last_bar(txt, y_position, label_size, label_color, txt_color, txt_align)
Prints one label at last bar to show text.
Parameters:
txt (string) : New label text.
y_position (float) : New price of the label position.
label_size (string) : Possible values: size.auto, size.tiny, size.small, size.normal, size.large, size.huge. Optional. Default value is `size.large`.
label_color (color) : New label border and arrow color. Optional. Default value is `color.blue`.
txt_color (color) : New text color. Optional. Default value is `color.white`.
txt_align (string) : Label text alignment. Optional. Possible values: text.align_left, text.align_center, text.align_right. Default value is `text.align_center`.
Returns: void
table_symbol_informations(table_position, table_color, text_color)
Prints a table to show all the Symbol information, including its function names.
Parameters:
table_position (string) : Position of the table. Optional. Possible values are: position.top_left, position.top_center, position.top_right, position.middle_left, position.middle_center, position.middle_right, position.bottom_left, position.bottom_center, position.bottom_right. Default value is `position.middle_right`.
table_color (color) : The background color of the table. Optional. The default is `color.yellow`.
text_color (color) : The color of the text. Optional. The default is `color.black`.
Returns: void
table_array_float(array_float, table_columns, table_rows, table_position, table_color, txt_color, txt_size)
Prints a table to show float values of an array.
Parameters:
array_float (float ) : The array that will be showed.
table_columns (int)
table_rows (int) : The number of rows to show the values.
table_position (string) : Position of the table. Optional. Possible values are: position.top_left, position.top_center, position.top_right, position.middle_left, position.middle_center, position.middle_right, position.bottom_left, position.bottom_center, position.bottom_right. Default value is `position.bottom_center`.
table_color (color) : The background color of the table. Optional. By default there is no color.
txt_color (color)
txt_size (string) : Possible values: size.auto, size.tiny, size.small, size.normal, size.large, size.huge. Optional. Default value is `size.normal`.
Returns: void
table_array_int(array_float, table_columns, table_rows, table_position, table_color, txt_color, txt_size)
Prints a table to show int values of an array.
Parameters:
array_float (int ) : The array that will be showed.
table_columns (int)
table_rows (int) : The number of rows to show the values.
table_position (string) : Position of the table. Optional. Possible values are: position.top_left, position.top_center, position.top_right, position.middle_left, position.middle_center, position.middle_right, position.bottom_left, position.bottom_center, position.bottom_right. Default value is `position.bottom_center`.
table_color (color) : The background color of the table. Optional. By default there is no color.
txt_color (color)
txt_size (string) : Possible values: size.auto, size.tiny, size.small, size.normal, size.large, size.huge. Optional. Default value is `size.normal`.
Returns: void

RSI Overbought/Oversold + Divergence Indicator (new)//@version=5
indicator('CryptoSignalScanner - RSI Overbought/Oversold + Divergence Indicator (new)',
//---------------------------------------------------------------------------------------------------------------------------------
//--- Define Colors ---------------------------------------------------------------------------------------------------------------
//---------------------------------------------------------------------------------------------------------------------------------
vWhite = #FFFFFF
vViolet = #C77DF3
vIndigo = #8A2BE2
vBlue = #009CDF
vGreen = #5EBD3E
vYellow = #FFB900
vRed = #E23838
longColor = color.green
shortColor = color.red
textColor = color.white
bullishColor = color.rgb(38,166,154,0) //Used in the display table
bearishColor = color.rgb(239,83,79,0) //Used in the display table
nomatchColor = color.silver //Used in the display table
//---------------------------------------------------------------------------------------------------------------------------------------------------------------------
//--- Functions--------------------------------------------------------------------------------------------------------------------------------------------------------
//---------------------------------------------------------------------------------------------------------------------------------------------------------------------
TF2txt(TF) =>
switch TF
"S" => "RSI 1s:"
"5S" => "RSI 5s:"
"10S" => "RSI 10s:"
"15S" => "RSI 15s:"
"30S" => "RSI 30s"
"1" => "RSI 1m:"
"3" => "RSI 3m:"
"5" => "RSI 5m:"
"15" => "RSI 15m:"
"30" => "RSI 30m"
"45" => "RSI 45m"
"60" => "RSI 1h:"
"120" => "RSI 2h:"
"180" => "RSI 3h:"
"240" => "RSI 4h:"
"480" => "RSI 8h:"
"D" => "RSI 1D:"
"1D" => "RSI 1D:"
"2D" => "RSI 2D:"
"3D" => "RSI 2D:"
"3D" => "RSI 3W:"
"W" => "RSI 1W:"
"1W" => "RSI 1W:"
"M" => "RSI 1M:"
"1M" => "RSI 1M:"
"3M" => "RSI 3M:"
"6M" => "RSI 6M:"
"12M" => "RSI 12M:"
//---------------------------------------------------------------------------------------------------------------------------------------------------------------------
//--- Show/Hide Settings ----------------------------------------------------------------------------------------------------------------------------------------------
//---------------------------------------------------------------------------------------------------------------------------------------------------------------------
rsiShowInput = input(true, title='Show RSI', group='Show/Hide Settings')
maShowInput = input(false, title='Show MA', group='Show/Hide Settings')
showRSIMAInput = input(true, title='Show RSIMA Cloud', group='Show/Hide Settings')
rsiBandShowInput = input(true, title='Show Oversold/Overbought Lines', group='Show/Hide Settings')
rsiBandExtShowInput = input(true, title='Show Oversold/Overbought Extended Lines', group='Show/Hide Settings')
rsiHighlightShowInput = input(true, title='Show Oversold/Overbought Highlight Lines', group='Show/Hide Settings')
DivergenceShowInput = input(true, title='Show RSI Divergence Labels', group='Show/Hide Settings')
//---------------------------------------------------------------------------------------------------------------------------------------------------------------------
//--- Table Settings --------------------------------------------------------------------------------------------------------------------------------------------------
//---------------------------------------------------------------------------------------------------------------------------------------------------------------------
rsiShowTable = input(true, title='Show RSI Table Information box', group="RSI Table Settings")
rsiTablePosition = input.string(title='Location', defval='middle_right', options= , group="RSI Table Settings", inline='1')
rsiTextSize = input.string(title=' Size', defval='small', options= , group="RSI Table Settings", inline='1')
rsiShowTF1 = input(true, title='Show TimeFrame1', group="RSI Table Settings", inline='tf1')
rsiTF1 = input.timeframe("15", title=" Time", group="RSI Table Settings", inline='tf1')
rsiShowTF2 = input(true, title='Show TimeFrame2', group="RSI Table Settings", inline='tf2')
rsiTF2 = input.timeframe("60", title=" Time", group="RSI Table Settings", inline='tf2')
rsiShowTF3 = input(true, title='Show TimeFrame3', group="RSI Table Settings", inline='tf3')
rsiTF3 = input.timeframe("240", title=" Time", group="RSI Table Settings", inline='tf3')
rsiShowTF4 = input(true, title='Show TimeFrame4', group="RSI Table Settings", inline='tf4')
rsiTF4 = input.timeframe("D", title=" Time", group="RSI Table Settings", inline='tf4')
rsiShowHist = input(true, title='Show RSI Historical Columns', group="RSI Table Settings", tooltip='Show the information of the 2 previous closed candles')
//---------------------------------------------------------------------------------------------------------------------------------------------------------------------
//--- RSI Input Settings ----------------------------------------------------------------------------------------------------------------------------------------------
//---------------------------------------------------------------------------------------------------------------------------------------------------------------------
rsiSourceInput = input.source(close, 'Source', group='RSI Settings')
rsiLengthInput = input.int(14, minval=1, title='RSI Length', group='RSI Settings', tooltip='Here we set the RSI lenght')
rsiColorInput = input.color(#26a69a, title="RSI Color", group='RSI Settings')
rsimaColorInput = input.color(#ef534f, title="RSIMA Color", group='RSI Settings')
rsiBandColorInput = input.color(#787B86, title="RSI Band Color", group='RSI Settings')
rsiUpperBandExtInput = input.int(title='RSI Overbought Extended Line', defval=80, minval=50, maxval=100, group='RSI Settings')
rsiUpperBandInput = input.int(title='RSI Overbought Line', defval=70, minval=50, maxval=100, group='RSI Settings')
rsiLowerBandInput = input.int(title='RSI Oversold Line', defval=30, minval=0, maxval=50, group='RSI Settings')
rsiLowerBandExtInput = input.int(title='RSI Oversold Extended Line', defval=20, minval=0, maxval=50, group='RSI Settings')
//---------------------------------------------------------------------------------------------------------------------------------------------------------------------
//--- MA Input Settings -----------------------------------------------------------------------------------------------------------------------------------------------
//---------------------------------------------------------------------------------------------------------------------------------------------------------------------
maTypeInput = input.string("EMA", title="MA Type", options= , group="MA Settings")
maLengthInput = input.int(14, title="MA Length", group="MA Settings")
maColorInput = input.color(color.yellow, title="MA Color", group='MA Settings') //#7E57C2
//---------------------------------------------------------------------------------------------------------------------------------------------------------------------
//--- Divergence Input Settings ---------------------------------------------------------------------------------------------------------------------------------------
//---------------------------------------------------------------------------------------------------------------------------------------------------------------------
lbrInput = input(title="Pivot Lookback Right", defval=2, group='RSI Divergence Settings')
lblInput = input(title="Pivot Lookback Left", defval=2, group='RSI Divergence Settings')
lbRangeMaxInput = input(title="Max of Lookback Range", defval=10, group='RSI Divergence Settings')
lbRangeMinInput = input(title="Min of Lookback Range", defval=2, group='RSI Divergence Settings')
plotBullInput = input(title="Plot Bullish", defval=true, group='RSI Divergence Settings')
plotHiddenBullInput = input(title="Plot Hidden Bullish", defval=true, group='RSI Divergence Settings')
plotBearInput = input(title="Plot Bearish", defval=true, group='RSI Divergence Settings')
plotHiddenBearInput = input(title="Plot Hidden Bearish", defval=true, group='RSI Divergence Settings')
//---------------------------------------------------------------------------------------------------------------------------------------------------------------------
//--- RSI Calculation -------------------------------------------------------------------------------------------------------------------------------------------------
//---------------------------------------------------------------------------------------------------------------------------------------------------------------------
rsi = ta.rsi(rsiSourceInput, rsiLengthInput)
rsiprevious = rsi
= request.security(syminfo.tickerid, rsiTF1, [rsi, rsi , rsi ], lookahead=barmerge.lookahead_on)
= request.security(syminfo.tickerid, rsiTF2, [rsi, rsi , rsi ], lookahead=barmerge.lookahead_on)
= request.security(syminfo.tickerid, rsiTF3, [rsi, rsi , rsi ], lookahead=barmerge.lookahead_on)
= request.security(syminfo.tickerid, rsiTF4, [rsi, rsi , rsi ], lookahead=barmerge.lookahead_on)
//---------------------------------------------------------------------------------------------------------------------------------------------------------------------
//--- MA Calculation -------------------------------------------------------------------------------------------------------------------------------------------------
//---------------------------------------------------------------------------------------------------------------------------------------------------------------------
ma(source, length, type) =>
switch type
"SMA" => ta.sma(source, length)
"Bollinger Bands" => ta.sma(source, length)
"EMA" => ta.ema(source, length)
"SMMA (RMA)" => ta.rma(source, length)
"WMA" => ta.wma(source, length)
"VWMA" => ta.vwma(source, length)
rsiMA = ma(rsi, maLengthInput, maTypeInput)
rsiMAPrevious = rsiMA
//---------------------------------------------------------------------------------------------------------------------------------------------------------------------
//--- Stoch RSI Settings + Calculation --------------------------------------------------------------------------------------------------------------------------------
//---------------------------------------------------------------------------------------------------------------------------------------------------------------------
showStochRSI = input(false, title="Show Stochastic RSI", group='Stochastic RSI Settings')
smoothK = input.int(title="Stochastic K", defval=3, minval=1, maxval=10, group='Stochastic RSI Settings')
smoothD = input.int(title="Stochastic D", defval=4, minval=1, maxval=10, group='Stochastic RSI Settings')
lengthRSI = input.int(title="Stochastic RSI Lenght", defval=14, minval=1, group='Stochastic RSI Settings')
lengthStoch = input.int(title="Stochastic Lenght", defval=14, minval=1, group='Stochastic RSI Settings')
colorK = input.color(color.rgb(41,98,255,0), title="K Color", group='Stochastic RSI Settings', inline="1")
colorD = input.color(color.rgb(205,109,0,0), title="D Color", group='Stochastic RSI Settings', inline="1")
StochRSI = ta.rsi(rsiSourceInput, lengthRSI)
k = ta.sma(ta.stoch(StochRSI, StochRSI, StochRSI, lengthStoch), smoothK) //Blue Line
d = ta.sma(k, smoothD) //Red Line
//---------------------------------------------------------------------------------------------------------------------------------------------------------------------
//--- Divergence Settings ------------------------------------------------------------------------------------------------------------------------------------------
//---------------------------------------------------------------------------------------------------------------------------------------------------------------------
bearColor = color.red
bullColor = color.green
hiddenBullColor = color.new(color.green, 50)
hiddenBearColor = color.new(color.red, 50)
//textColor = color.white
noneColor = color.new(color.white, 100)
osc = rsi
plFound = na(ta.pivotlow(osc, lblInput, lbrInput)) ? false : true
phFound = na(ta.pivothigh(osc, lblInput, lbrInput)) ? false : true
_inRange(cond) =>
bars = ta.barssince(cond == true)
lbRangeMinInput <= bars and bars <= lbRangeMaxInput
//---------------------------------------------------------------------------------------------------------------------------------------------------------------------
//--- Define Plot & Line Colors ---------------------------------------------------------------------------------------------------------------------------------------
//---------------------------------------------------------------------------------------------------------------------------------------------------------------------
rsiColor = rsi >= rsiMA ? rsiColorInput : rsimaColorInput
//---------------------------------------------------------------------------------------------------------------------------------------------------------------------
//--- Plot Lines ------------------------------------------------------------------------------------------------------------------------------------------------------
//---------------------------------------------------------------------------------------------------------------------------------------------------------------------
// Create a horizontal line at a specific price level
myLine = line.new(bar_index , 75, bar_index, 75, color = color.rgb(187, 14, 14), width = 2)
bottom = line.new(bar_index , 50, bar_index, 50, color = color.rgb(223, 226, 28), width = 2)
mymainLine = line.new(bar_index , 60, bar_index, 60, color = color.rgb(13, 154, 10), width = 3)
hline(50, title='RSI Baseline', color=color.new(rsiBandColorInput, 50), linestyle=hline.style_solid, editable=false)
hline(rsiBandExtShowInput ? rsiUpperBandExtInput : na, title='RSI Upper Band', color=color.new(rsiBandColorInput, 10), linestyle=hline.style_dashed, editable=false)
hline(rsiBandShowInput ? rsiUpperBandInput : na, title='RSI Upper Band', color=color.new(rsiBandColorInput, 10), linestyle=hline.style_dashed, editable=false)
hline(rsiBandShowInput ? rsiLowerBandInput : na, title='RSI Upper Band', color=color.new(rsiBandColorInput, 10), linestyle=hline.style_dashed, editable=false)
hline(rsiBandExtShowInput ? rsiLowerBandExtInput : na, title='RSI Upper Band', color=color.new(rsiBandColorInput, 10), linestyle=hline.style_dashed, editable=false)
bgcolor(rsiHighlightShowInput ? rsi >= rsiUpperBandExtInput ? color.new(rsiColorInput, 70) : na : na, title="Show Extended Oversold Highlight", editable=false)
bgcolor(rsiHighlightShowInput ? rsi >= rsiUpperBandInput ? rsi < rsiUpperBandExtInput ? color.new(#64ffda, 90) : na : na: na, title="Show Overbought Highlight", editable=false)
bgcolor(rsiHighlightShowInput ? rsi <= rsiLowerBandInput ? rsi > rsiLowerBandExtInput ? color.new(#F43E32, 90) : na : na : na, title="Show Extended Oversold Highlight", editable=false)
bgcolor(rsiHighlightShowInput ? rsi <= rsiLowerBandInput ? color.new(rsimaColorInput, 70) : na : na, title="Show Oversold Highlight", editable=false)
maPlot = plot(maShowInput ? rsiMA : na, title='MA', color=color.new(maColorInput,0), linewidth=1)
rsiMAPlot = plot(showRSIMAInput ? rsiMA : na, title="RSI EMA", color=color.new(rsimaColorInput,0), editable=false, display=display.none)
rsiPlot = plot(rsiShowInput ? rsi : na, title='RSI', color=color.new(rsiColor,0), linewidth=1)
fill(rsiPlot, rsiMAPlot, color=color.new(rsiColor, 60), title="RSIMA Cloud")
plot(showStochRSI ? k : na, title='Stochastic K', color=colorK, linewidth=1)
plot(showStochRSI ? d : na, title='Stochastic D', color=colorD, linewidth=1)
//---------------------------------------------------------------------------------------------------------------------------------------------------------------------
//--- Plot Divergence -------------------------------------------------------------------------------------------------------------------------------------------------
//---------------------------------------------------------------------------------------------------------------------------------------------------------------------
// Regular Bullish
// Osc: Higher Low
oscHL = osc > ta.valuewhen(plFound, osc , 1) and _inRange(plFound )
// Price: Lower Low
priceLL = low < ta.valuewhen(plFound, low , 1)
bullCond = plotBullInput and priceLL and oscHL and plFound
plot(
plFound ? osc : na,
offset=-lbrInput,
title="Regular Bullish",
linewidth=2,
color=(bullCond ? bullColor : noneColor)
)
plotshape(
DivergenceShowInput ? bullCond ? osc : na : na,
offset=-lbrInput,
title="Regular Bullish Label",
text=" Bull ",
style=shape.labelup,
location=location.absolute,
color=bullColor,
textcolor=textColor
)
//------------------------------------------------------------------------------
// Hidden Bullish
// Osc: Lower Low
oscLL = osc < ta.valuewhen(plFound, osc , 1) and _inRange(plFound )
// Price: Higher Low
priceHL = low > ta.valuewhen(plFound, low , 1)
hiddenBullCond = plotHiddenBullInput and priceHL and oscLL and plFound
plot(
plFound ? osc : na,
offset=-lbrInput,
title="Hidden Bullish",
linewidth=2,
color=(hiddenBullCond ? hiddenBullColor : noneColor)
)
plotshape(
DivergenceShowInput ? hiddenBullCond ? osc : na : na,
offset=-lbrInput,
title="Hidden Bullish Label",
text=" H Bull ",
style=shape.labelup,
location=location.absolute,
color=bullColor,
textcolor=textColor
)
//------------------------------------------------------------------------------
// Regular Bearish
// Osc: Lower High
oscLH = osc < ta.valuewhen(phFound, osc , 1) and _inRange(phFound )
// Price: Higher High
priceHH = high > ta.valuewhen(phFound, high , 1)
bearCond = plotBearInput and priceHH and oscLH and phFound
plot(
phFound ? osc : na,
offset=-lbrInput,
title="Regular Bearish",
linewidth=2,
color=(bearCond ? bearColor : noneColor)
)
plotshape(
DivergenceShowInput ? bearCond ? osc : na : na,
offset=-lbrInput,
title="Regular Bearish Label",
text=" Bear ",
style=shape.labeldown,
location=location.absolute,
color=bearColor,
textcolor=textColor
)
//------------------------------------------------------------------------------
// Hidden Bearish
// Osc: Higher High
oscHH = osc > ta.valuewhen(phFound, osc , 1) and _inRange(phFound )
// Price: Lower High
priceLH = high < ta.valuewhen(phFound, high , 1)
hiddenBearCond = plotHiddenBearInput and priceLH and oscHH and phFound
plot(
phFound ? osc : na,
offset=-lbrInput,
title="Hidden Bearish",
linewidth=2,
color=(hiddenBearCond ? hiddenBearColor : noneColor)
)
plotshape(
DivergenceShowInput ? hiddenBearCond ? osc : na : na,
offset=-lbrInput,
title="Hidden Bearish Label",
text=" H Bear ",
style=shape.labeldown,
location=location.absolute,
color=bearColor,
textcolor=textColor
)
//---------------------------------------------------------------------------------------------------------------------------------------------------------------------
//--- Check RSI Lineup ------------------------------------------------------------------------------------------------------------------------------------------------
//---------------------------------------------------------------------------------------------------------------------------------------------------------------------
bullTF = rsi > rsi and rsi > rsi
bearTF = rsi < rsi and rsi < rsi
bullTF1 = rsi1 > rsi1_1 and rsi1_1 > rsi1_2
bearTF1 = rsi1 < rsi1_1 and rsi1_1 < rsi1_2
bullTF2 = rsi2 > rsi2_1 and rsi2_1 > rsi2_2
bearTF2 = rsi2 < rsi2_1 and rsi2_1 < rsi2_2
bullTF3 = rsi3 > rsi3_1 and rsi3_1 > rsi3_2
bearTF3 = rsi3 < rsi3_1 and rsi3_1 < rsi3_2
bullTF4 = rsi4 > rsi4_1 and rsi4_1 > rsi4_2
bearTF4 = rsi4 < rsi4_1 and rsi4_1 < rsi4_2
bbTxt(bull,bear) =>
bull ? "BULLISH" : bear ? "BEARISCH" : 'NO LINEUP'
bbColor(bull,bear) =>
bull ? bullishColor : bear ? bearishColor : nomatchColor
newTC(tBox, col, row, txt, width, txtColor, bgColor, txtHA, txtSize) =>
table.cell(table_id=tBox,column=col, row=row, text=txt, width=width,text_color=txtColor,bgcolor=bgColor, text_halign=txtHA, text_size=txtSize)
//---------------------------------------------------------------------------------------------------------------------------------------------------------------------
//--- Define RSI Table Setting ----------------------------------------------------------------------------------------------------------------------------------------
//---------------------------------------------------------------------------------------------------------------------------------------------------------------------
width_c0 = 0
width_c1 = 0
if rsiShowTable
var tBox = table.new(position=rsiTablePosition, columns=5, rows=6, bgcolor=color.rgb(18,22,33,50), frame_color=color.black, frame_width=1, border_color=color.black, border_width=1)
newTC(tBox, 0,1,"RSI Current",width_c0,color.orange,color.rgb(0,0,0,100),'right',rsiTextSize)
newTC(tBox, 1,1,str.format(" {0,number,#.##} ", rsi),width_c0,vWhite,rsi < 50 ? bearishColor:bullishColor,'left',rsiTextSize)
newTC(tBox, 4,1,bbTxt(bullTF, bearTF),width_c0,vWhite,bbColor(bullTF, bearTF),'center',rsiTextSize)
if rsiShowHist
newTC(tBox, 2,1,str.format(" {0,number,#.##} ", rsi ),width_c0,vWhite,rsi < 50 ? bearishColor:bullishColor,'left',rsiTextSize)
newTC(tBox, 3,1,str.format(" {0,number,#.##} ", rsi ),width_c0,vWhite,rsi < 50 ? bearishColor:bullishColor,'left',rsiTextSize)
if rsiShowTF1
newTC(tBox, 0,2,TF2txt(rsiTF1),width_c0,vWhite,color.rgb(0,0,0,100),'right',rsiTextSize)
newTC(tBox, 1,2,str.format(" {0,number,#.##} ", rsi1),width_c0,vWhite,rsi1 < 50 ? bearishColor:bullishColor,'left',rsiTextSize)
newTC(tBox, 4,2,bbTxt(bullTF1, bearTF1),width_c0,vWhite,bbColor(bullTF1,bearTF1),'center',rsiTextSize)
if rsiShowHist
newTC(tBox, 2,2,str.format(" {0,number,#.##} ", rsi1_1),width_c0,vWhite,rsi1_1 < 50 ? bearishColor:bullishColor,'left',rsiTextSize)
newTC(tBox, 3,2,str.format(" {0,number,#.##} ", rsi1_2),width_c0,vWhite,rsi1_2 < 50 ? bearishColor:bullishColor,'left',rsiTextSize)
if rsiShowTF2
newTC(tBox, 0,3,TF2txt(rsiTF2),width_c0,vWhite,color.rgb(0,0,0,100),'right',rsiTextSize)
newTC(tBox, 1,3,str.format(" {0,number,#.##} ", rsi2),width_c0,vWhite,rsi2 < 50 ? bearishColor:bullishColor,'left',rsiTextSize)
newTC(tBox, 4,3,bbTxt(bullTF2, bearTF2),width_c0,vWhite,bbColor(bullTF2,bearTF2),'center',rsiTextSize)
if rsiShowHist
newTC(tBox, 2,3,str.format(" {0,number,#.##} ", rsi2_1),width_c0,vWhite,rsi2_1 < 50 ? bearishColor:bullishColor,'left',rsiTextSize)
newTC(tBox, 3,3,str.format(" {0,number,#.##} ", rsi2_2),width_c0,vWhite,rsi2_2 < 50 ? bearishColor:bullishColor,'left',rsiTextSize)
if rsiShowTF3
newTC(tBox, 0,4,TF2txt(rsiTF3),width_c0,vWhite,color.rgb(0,0,0,100),'right',rsiTextSize)
newTC(tBox, 1,4,str.format(" {0,number,#.##} ", rsi3),width_c0,vWhite,rsi3 < 50 ? bearishColor:bullishColor,'left',rsiTextSize)
newTC(tBox, 4,4,bbTxt(bullTF3, bearTF3),width_c0,vWhite,bbColor(bullTF3,bearTF3),'center',rsiTextSize)
if rsiShowHist
newTC(tBox, 2,4,str.format(" {0,number,#.##} ", rsi3_1),width_c0,vWhite,rsi3_1 < 50 ? bearishColor:bullishColor,'left',rsiTextSize)
newTC(tBox, 3,4,str.format(" {0,number,#.##} ", rsi3_2),width_c0,vWhite,rsi3_2 < 50 ? bearishColor:bullishColor,'left',rsiTextSize)
if rsiShowTF4
newTC(tBox, 0,5,TF2txt(rsiTF4),width_c0,vWhite,color.rgb(0,0,0,100),'right',rsiTextSize)
newTC(tBox, 1,5,str.format(" {0,number,#.##} ", rsi4),width_c0,vWhite,rsi4 < 50 ? bearishColor:bullishColor,'left',rsiTextSize)
newTC(tBox, 4,5,bbTxt(bullTF4, bearTF4),width_c0,vWhite,bbColor(bullTF4,bearTF4),'center',rsiTextSize)
if rsiShowHist
newTC(tBox, 2,5,str.format(" {0,number,#.##} ", rsi4_1),width_c0,vWhite,rsi4_1 < 50 ? bearishColor:bullishColor,'left',rsiTextSize)
newTC(tBox, 3,5,str.format(" {0,number,#.##} ", rsi4_2),width_c0,vWhite,rsi4_2 < 50 ? bearishColor:bullishColor,'left',rsiTextSize)
//------------------------------------------------------
//--- Alerts -------------------------------------------
//------------------------------------------------------

PseudoPlotLibrary "PseudoPlot"
PseudoPlot: behave like plot and fill using polyline
This library enables line plotting by polyline like plot() and fill().
The core of polyline() is array of chart.point array, polyline() is called in its method.
Moreover, plotarea() makes a box in main chart, plotting data within the box is enabled.
It works so slowy to manage array of chart.point, so limit the target to visible area of the chart.
Due to polyline specifications, na and expression can not be used for colors.
1. pseudoplot
pseudoplot() behaves like plot().
//use plot()
plot(close)
//use pseudoplot()
pseudoplot(close)
Pseudoplot has label. Label is enabled when title argument is set.
In the example bellow, "close value" label is shown with line.
The label is shown at right of the line when recent bar is visible.
It is shown at 15% from the left of visible area when recent bar is not visible.
Just set "" if you don't need label.
//use plot()
plot(close,"close value")
//use pseudoplot
pseudoplot(close, "close value")
Arguments are designed in an order as similar as possible to plot.
plot(series, title, color, linewidth, style, trackprice, histbase, offset, join, editable, show_last, display, format, precision, force_overlay) → plot
pseudoplot(series, title, ,linecolor ,linewidth, linestyle, labelbg, labeltext, labelsize, shorttitle, format, xpos_from_left, overlay) → pseudo_plot
2. pseudofill
pseudofill() behaves like fill().
The label is shown(text only) at right of the line when recent bar is visible.
It is shown at 10% from the left of visible area when recent bar is not visible.
Just set "" if you don't need label.
//use plot() and fill()
p1=plot(open)
p2=plot(close)
fill(p1,p2)
//use pseudofill()
pseudofill(open,close)
Arguments are designed in an order as similar as possible to fill.
fill(hline1, hline2, color, title, editable, fillgaps, display) → void
pseudofill(series1, series2, fillcolor, title, linecolor, linewidth, linestyle, labeltext, labelsize, shorttitle, format, xpos_from_left, overlay) → pseudo_plot
3. plotarea and its methods
plotarea() makes a box in main chart. You can set the box position to top or bottom, and
the box height in percentage of the range of visible high and low prices.
x-coordinate of the box is from chart.left_visible_bar_time to chart.right_visible_bar_time,
y-coordinate is highest and lowest price of visible bars.
pseudoplot() and pseudofill() work as method of plotarea(box).
Usage is almost same as the function version, just set min and max value, y-coodinate is remapped automatically.
hline() is also available. The y-coordinate of hline is specified as a percentage from the bottom.
plotarea() and its associated methods are overlay=true as default.
Depending on the drawing order of the objects, plot may become invisible, so the bgcolor of plotarea should be na or tranceparent.
//1. make a plotarea
// bgcolor should be na or transparent color.
area=plotarea("bottom",30,"plotarea",bgcolor=na)
//2. plot in a plotarea
//(min=0, max=100 is omitted as it is the default.)
area.pseudoplot(ta.rsi(close,14))
//3. draw hlines
area.hline(30,linestyle="dotted",linewidth=2)
area.hline(70,linestyle="dotted",linewidth=2)
4. Data structure and sub methods
Array management is most imporant part of using polyline.
I don't know the proper way to handle array, so it is managed by array and array as intermediate data.
(type xy_arrays to manage bar_time and price as independent arrays.)
method cparray() pack arrays to array, when array includes both chart.left_visible_bar_time and chart.right_visible_bar.time.
Calling polyline is implemented as methods of array of chart.point.
Method creates polyline object if array is not empty.
method polyline(linecolor, linewidth, linestyle, overlay) → series polyline
method polyline_fill(fillcolor, linecolor, linewidth, linestyle, overlay) → series polyline
Also calling label is implemented as methods of array of chart.point.
Method creates label ofject if array is not empty.
Label is located at right edge of the chart when recent bar is visible, located at left side when recent bar is invisible.
label(title, labelbg, labeltext, labelsize, format, shorttitle, xpos_from_left, overlay) → series label
label_for_fill(title, labeltext, labelsize, format, shorttitle, xpos_from_left, overlay) → series label
visible_xyInit(series)
make arrays of visible x(bar_time) and y(price/value).
Parameters:
series (float) : (float) series variable
Returns: (xy_arrays)
method remap(this, bottom, top, min, max)
Namespace types: xy_arrays
Parameters:
this (xy_arrays)
bottom (float) : (float) bottom price to ajust.
top (float) : (float) top price to ajust.
min (float) : (float) min of src value.
max (float) : (float) max of src value.
Returns: (xy_arrays)
method polyline(this, linecolor, linewidth, linestyle, overlay)
Namespace types: array
Parameters:
this (array)
linecolor (color) : (color) color of polyline.
linewidth (int) : (int) width of polyline.
linestyle (string) : (string) linestyle of polyline. default is line.style_solid("solid"), others line.style_dashed("dashed"), line.style_dotted("dotted").
overlay (bool) : (bool) force_overlay of polyline. default is false.
Returns: (polyline)
method polyline_fill(this, fillcolor, linecolor, linewidth, linestyle, overlay)
Namespace types: array
Parameters:
this (array)
fillcolor (color)
linecolor (color) : (color) color of polyline.
linewidth (int) : (int) width of polyline.
linestyle (string) : (string) linestyle of polyline. default is line.style_solid("solid"), others line.style_dashed("dashed"), line.style_dotted("dotted").
overlay (bool) : (bool) force_overlay of polyline. default is false.
Returns: (polyline)
method label(this, title, labelbg, labeltext, labelsize, format, shorttitle, xpos_from_left, overlay)
Namespace types: array
Parameters:
this (array)
title (string) : (string) label text.
labelbg (color) : (color) color of label bg.
labeltext (color) : (color) color of label text.
labelsize (int) : (int) size of label.
format (string) : (string) textformat of label. default is text.format_none("none"). others text.format_bold("bold"), text.format_italic("italic"), text.format_bold+text.format_italic("bold+italic").
shorttitle (string) : (string) another label text for recent bar is not visible.
xpos_from_left (int) : (int) another label x-position(percentage from left of chart width), when recent bar is not visible. default is 15%.
overlay (bool) : (bool) force_overlay of label. default is false.
Returns: (label)
method label_for_fill(this, title, labeltext, labelsize, format, shorttitle, xpos_from_left, overlay)
Namespace types: array
Parameters:
this (array)
title (string) : (string) label text.
labeltext (color) : (color) color of label text.
labelsize (int) : (int) size of label.
format (string) : (string) textformat of label. default is text.format_none("none"). others text.format_bold("bold"), text.format_italic("italic"), text.format_bold+text.format_italic("bold+italic").
shorttitle (string) : (string) another label text for recent bar is not visible.
xpos_from_left (int) : (int) another label x-position(percentage from left of chart width), when recent bar is not visible. default is 10%.
overlay (bool) : (bool) force_overlay of label. default is false.
Returns: (label)
pseudoplot(series, title, linecolor, linewidth, linestyle, labelbg, labeltext, labelsize, shorttitle, format, xpos_from_left, overlay)
polyline like plot with label
Parameters:
series (float) : (float) series variable to plot.
title (string) : (string) title if need label. default value is ""(disable label).
linecolor (color) : (color) color of line.
linewidth (int) : (int) width of line.
linestyle (string) : (string) style of plotting line. default is "solid", others "dashed", "dotted".
labelbg (color) : (color) color of label bg.
labeltext (color) : (color) color of label text.
labelsize (int) : (int) size of label text.
shorttitle (string) : (string) another label text for recent bar is not visible.
format (string) : (string) textformat of label. default is text.format_none("none"). others text.format_bold("bold"), text.format_italic("italic"), text.format_bold+text.format_italic("bold+italic").
xpos_from_left (int) : (int) another label x-position(percentage from left of chart width), when recent bar is not visible. default is 15%.
overlay (bool) : (bool) force_overlay of polyline and label.
Returns: (pseudo_plot)
method pseudoplot(this, series, title, linecolor, linewidth, linestyle, labelbg, labeltext, labelsize, shorttitle, format, xpos_from_left, min, max, overlay)
Namespace types: series box
Parameters:
this (box)
series (float) : (float) series variable to plot.
title (string) : (string) title if need label. default value is ""(disable label).
linecolor (color) : (color) color of line.
linewidth (int) : (int) width of line.
linestyle (string) : (string) style of plotting line. default is "solid", others "dashed", "dotted".
labelbg (color) : (color) color of label bg.
labeltext (color) : (color) color of label text.
labelsize (int) : (int) size of label text.
shorttitle (string) : (string) another label text for recent bar is not visible.
format (string) : (string) textformat of label. default is text.format_none("none"). others text.format_bold("bold"), text.format_italic("italic"), text.format_bold+text.format_italic("bold+italic").
xpos_from_left (int) : (int) another label x-position(percentage from left of chart width), when recent bar is not visible. default is 15%.
min (float)
max (float)
overlay (bool) : (bool) force_overlay of polyline and label.
Returns: (pseudo_plot)
pseudofill(series1, series2, fillcolor, title, linecolor, linewidth, linestyle, labeltext, labelsize, shorttitle, format, xpos_from_left, overlay)
fill by polyline
Parameters:
series1 (float) : (float) series variable to plot.
series2 (float) : (float) series variable to plot.
fillcolor (color) : (color) color of fill.
title (string)
linecolor (color) : (color) color of line.
linewidth (int) : (int) width of line.
linestyle (string) : (string) style of plotting line. default is "solid", others "dashed", "dotted".
labeltext (color)
labelsize (int)
shorttitle (string)
format (string) : (string) textformat of label. default is text.format_none("none"). others text.format_bold("bold"), text.format_italic("italic"), text.format_bold+text.format_italic("bold+italic").
xpos_from_left (int) : (int) another label x-position(percentage from left of chart width), when recent bar is not visible. default is 15%.
overlay (bool) : (bool) force_overlay of polyline and label.
Returns: (pseudoplot)
method pseudofill(this, series1, series2, fillcolor, title, linecolor, linewidth, linestyle, labeltext, labelsize, shorttitle, format, xpos_from_left, min, max, overlay)
Namespace types: series box
Parameters:
this (box)
series1 (float) : (float) series variable to plot.
series2 (float) : (float) series variable to plot.
fillcolor (color) : (color) color of fill.
title (string)
linecolor (color) : (color) color of line.
linewidth (int) : (int) width of line.
linestyle (string) : (string) style of plotting line. default is "solid", others "dashed", "dotted".
labeltext (color)
labelsize (int)
shorttitle (string)
format (string) : (string) textformat of label. default is text.format_none("none"). others text.format_bold("bold"), text.format_italic("italic"), text.format_bold+text.format_italic("bold+italic").
xpos_from_left (int) : (int) another label x-position(percentage from left of chart width), when recent bar is not visible. default is 15%.
min (float)
max (float)
overlay (bool) : (bool) force_overlay of polyline and label.
Returns: (pseudo_plot)
plotarea(pos, height, title, bordercolor, borderwidth, bgcolor, textsize, textcolor, format, overlay)
subplot area in main chart
Parameters:
pos (string) : (string) position of subplot area, bottom or top.
height (int) : (float) percentage of visible chart heght.
title (string) : (string) text of area box.
bordercolor (color) : (color) color of border.
borderwidth (int) : (int) width of border.
bgcolor (color) : (string) color of area bg.
textsize (int)
textcolor (color)
format (string)
overlay (bool) : (bool) force_overlay of polyline and label.
Returns: (box)
method hline(this, ypos_from_bottom, linecolor, linestyle, linewidth, overlay)
Namespace types: series box
Parameters:
this (box)
ypos_from_bottom (float) : (float) percentage of box height from the bottom of box.(bottom is 0%, top is 100%).
linecolor (color) : (color) color of line.
linestyle (string) : (string) style of line.
linewidth (int) : (int) width of line.
overlay (bool) : (bool) force_overlay of polyline and label.
Returns: (line)
pseudo_plot
polyline and label.
Fields:
p (series polyline)
l (series label)
xy_arrays
x(bartime) and y(price or value) arrays.
Fields:
t (array)
p (array)

ICT FVG & Swing Detector Basic by Trader Riaz//@version=6
indicator("ICT FVG & Swing Detector Basic by Trader Riaz", overlay=true)
// Display toggles for Bullish FVGs
show_bull_fvg = input.bool(true, "Show Bullish FVGs?")
// Input settings for Bullish FVGs
fvg_bull_count = input.int(1, "Number of Bullish FVGs to show", minval=1)
// Color settings for Bullish FVGs
bullish_fvg_color = input.color(color.green, "Bullish FVG Color")
// Bullish FVG Extend Options
bull_fvg_extendGroup = "Bullish FVG Extend Options"
bull_fvg_extendOption = input.string("Default", "Bullish FVG Extend Option", options= , group=bull_fvg_extendGroup)
bull_fvg_extendCandles = input.int(8, "Bullish FVG Extend Candles (Limited Only)", minval=1, maxval=100, step=1, group=bull_fvg_extendGroup)
// Display toggles for Bearish FVGs
show_bear_fvg = input.bool(true, "Show Bearish FVGs?")
// Input settings for Bearish FVGs
fvg_bear_count = input.int(1, "Number of Bearish FVGs to show", minval=1)
// Color settings for Bearish FVGs
bearish_fvg_color = input.color(color.red, "Bearish FVG Color")
// Bearish FVG Extend Options
bear_fvg_extendGroup = "Bearish FVG Extend Options"
bear_fvg_extendOption = input.string("Default", "Bearish FVG Extend Option", options= , group=bear_fvg_extendGroup)
bear_fvg_extendCandles = input.int(8, "Bearish FVG Extend Candles (Limited Only)", minval=1, maxval=100, step=1, group=bear_fvg_extendGroup)
// Display toggles for Swing Highs
show_swing_high = input.bool(true, "Show Swing Highs?")
// Input settings for Swing Highs
swing_high_count = input.int(2, "Number of Swing Highs to show", minval=1)
// Color settings for Swing Highs
swing_high_color = input.color(color.green, "Swing High Line & Label Color")
// Swing High Extend Options
swing_high_extendGroup = "Swing High Extend Options"
swing_high_extendOption = input.string("Default", "Swing High Extend Option", options= , group=swing_high_extendGroup)
swing_high_extendCandles = input.int(8, "Swing High Extend Candles (Limited Only)", minval=1, maxval=100, step=1, group=swing_high_extendGroup)
// Display toggles for Swing Lows
show_swing_low = input.bool(true, "Show Swing Lows?")
// Input settings for Swing Lows
swing_low_count = input.int(2, "Number of Swing Lows to show", minval=1)
// Color settings for Swing Lows
swing_low_color = input.color(color.red, "Swing Low Line & Label Color")
// Swing Low Extend Options
swing_low_extendGroup = "Swing Low Extend Options"
swing_low_extendOption = input.string("Default", "Swing Low Extend Option", options= , group=swing_low_extendGroup)
swing_low_extendCandles = input.int(8, "Swing Low Extend Candles (Limited Only)", minval=1, maxval=100, step=1, group=swing_low_extendGroup)
// Target Settings
showNextTarget = input.bool(true, "Show Next Target")
nextTargetHighColor = input.color(color.red, "Next Target High Color")
nextTargetLowColor = input.color(color.red, "Next Target Low Color")
// === Time Calculation ===
// Calculate one bar duration in milliseconds
barDuration = time - time
// Define reasonable extension period (4 bars into future)
extensionPeriod = barDuration * 4
// Arrays to store values with timestamps
var bull_fvg_data = array.new(0)
var bear_fvg_data = array.new(0)
var swing_high_data = array.new(0)
var swing_low_data = array.new(0)
var bull_fvg_labels = array.new(0)
var bear_fvg_labels = array.new(0)
var swing_high_labels = array.new(0)
var swing_low_labels = array.new(0)
var bull_fvg_midlines = array.new(0)
var bear_fvg_midlines = array.new(0)
var bull_fvg_tops = array.new(0)
var bull_fvg_bottoms = array.new(0)
var bear_fvg_tops = array.new(0)
var bear_fvg_bottoms = array.new(0)
// Get the last bar index
last_bar = last_bar_index + 3
// Function to determine right boundary based on extend option
get_right_boundary(option, extend_candles, default_right) =>
if option == "None"
bar_index - 2
else if option == "Limited"
bar_index - 2 + extend_candles
else
default_right
// Bullish FVG Detection
if high < low and show_bull_fvg
right_bar = get_right_boundary(bull_fvg_extendOption, bull_fvg_extendCandles, last_bar)
new_box = box.new(left=bar_index-2,
top=low,
right=right_bar,
bottom=high ,
bgcolor=color.new(bullish_fvg_color, 90),
border_color=bullish_fvg_color)
bull_mid = (low + high ) / 2
new_midline = line.new(bar_index-2, bull_mid, right_bar, bull_mid,
color=color.new(bullish_fvg_color, 50),
style=line.style_dashed)
new_label = label.new(right_bar-1, bull_mid, "Bullish FVG",
color=color.new(bullish_fvg_color, 100),
textcolor=bullish_fvg_color,
style=label.style_none,
textalign=text.align_right,
size=size.small)
array.unshift(bull_fvg_data, new_box)
array.unshift(bull_fvg_midlines, new_midline)
array.unshift(bull_fvg_labels, new_label)
array.unshift(bull_fvg_tops, low)
array.unshift(bull_fvg_bottoms, high )
if array.size(bull_fvg_data) > fvg_bull_count
box.delete(array.pop(bull_fvg_data))
line.delete(array.pop(bull_fvg_midlines))
label.delete(array.pop(bull_fvg_labels))
array.pop(bull_fvg_tops)
array.pop(bull_fvg_bottoms)
// Bearish FVG Detection
if low > high and show_bear_fvg
right_bar = get_right_boundary(bear_fvg_extendOption, bear_fvg_extendCandles, last_bar)
new_box = box.new(left=bar_index-2,
top=low ,
right=right_bar,
bottom=high,
bgcolor=color.new(bearish_fvg_color, 90),
border_color=bearish_fvg_color)
bear_mid = (low + high) / 2
new_midline = line.new(bar_index-2, bear_mid, right_bar, bear_mid,
color=color.new(bearish_fvg_color, 50),
style=line.style_dashed)
new_label = label.new(right_bar-1, bear_mid, "Bearish FVG",
color=color.new(bearish_fvg_color, 100),
textcolor=bearish_fvg_color,
style=label.style_none,
textalign=text.align_right,
size=size.small)
array.unshift(bear_fvg_data, new_box)
array.unshift(bear_fvg_midlines, new_midline)
array.unshift(bear_fvg_labels, new_label)
array.unshift(bear_fvg_tops, low )
array.unshift(bear_fvg_bottoms, high)
if array.size(bear_fvg_data) > fvg_bear_count
box.delete(array.pop(bear_fvg_data))
line.delete(array.pop(bear_fvg_midlines))
label.delete(array.pop(bear_fvg_labels))
array.pop(bear_fvg_tops)
array.pop(bear_fvg_bottoms)
// Swing High Detection
is_swing_high = high < high and high > high
if is_swing_high and show_swing_high
right_bar = get_right_boundary(swing_high_extendOption, swing_high_extendCandles, last_bar + 3)
new_line = line.new(bar_index - 1, high , right_bar, high ,
color=swing_high_color)
new_label = label.new(right_bar, high , "Swing High",
color=color.new(color.white, 30),
style=label.style_label_left,
textcolor=swing_high_color,
size=size.tiny)
array.unshift(swing_high_data, new_line)
array.unshift(swing_high_labels, new_label)
if array.size(swing_high_data) > swing_high_count
line.delete(array.pop(swing_high_data))
label.delete(array.pop(swing_high_labels))
// Swing Low Detection
is_swing_low = low > low and low < low
if is_swing_low and show_swing_low
right_bar = get_right_boundary(swing_low_extendOption, swing_low_extendCandles, last_bar + 3)
new_line = line.new(bar_index -1, low , right_bar, low ,
color=swing_low_color)
new_label = label.new(right_bar, low , "Swing Low",
color=color.new(color.white, 30),
style=label.style_label_left,
textcolor=swing_low_color,
size=size.tiny)
array.unshift(swing_low_data, new_line)
array.unshift(swing_low_labels, new_label)
if array.size(swing_low_data) > swing_low_count
line.delete(array.pop(swing_low_data))
label.delete(array.pop(swing_low_labels))
// Clean up if toggles are turned off
if not show_bull_fvg and array.size(bull_fvg_data) > 0
for i = 0 to array.size(bull_fvg_data) - 1
box.delete(array.get(bull_fvg_data, i))
line.delete(array.get(bull_fvg_midlines, i))
label.delete(array.get(bull_fvg_labels, i))
array.clear(bull_fvg_data)
array.clear(bull_fvg_midlines)
array.clear(bull_fvg_labels)
array.clear(bull_fvg_tops)
array.clear(bull_fvg_bottoms)
if not show_bear_fvg and array.size(bear_fvg_data) > 0
for i = 0 to array.size(bear_fvg_data) - 1
box.delete(array.get(bear_fvg_data, i))
line.delete(array.get(bear_fvg_midlines, i))
label.delete(array.get(bear_fvg_labels, i))
array.clear(bear_fvg_data)
array.clear(bear_fvg_midlines)
array.clear(bear_fvg_labels)
array.clear(bear_fvg_tops)
array.clear(bear_fvg_bottoms)
// === Swing High/Low Detection ===
var float swingHighs = array.new()
var int swingHighTimes = array.new()
var float swingLows = array.new()
var int swingLowTimes = array.new()
var line swingHighLines = array.new()
var label swingHighLabels = array.new()
var line swingLowLines = array.new()
var label swingLowLabels = array.new()
isSwingHigh = high > high and high > high
isSwingLow = low < low and low < low
if isSwingHigh
array.unshift(swingHighs, high )
array.unshift(swingHighTimes, time )
if isSwingLow
array.unshift(swingLows, low )
array.unshift(swingLowTimes, time )
// === Next Target Detection ===
var line currentTargetLine = na
var label currentTargetLabel = na
if showNextTarget
if not na(currentTargetLine)
line.delete(currentTargetLine)
if not na(currentTargetLabel)
label.delete(currentTargetLabel)
priceRising = close > open
priceFalling = close < open
// Use slightly longer extension for targets
targetExtension = barDuration * 8
if priceRising and array.size(swingHighs) > 0
for i = 0 to array.size(swingHighs) - 1
target = array.get(swingHighs, i)
targetTime = array.get(swingHighTimes, i)
if target > close
currentTargetLine := line.new(
x1=targetTime, y1=target,
x2=time + targetExtension, y2=target,
color=nextTargetHighColor, width=2,
style=line.style_dashed,
xloc=xloc.bar_time)
currentTargetLabel := label.new(
x=time + targetExtension, y=target,
text="Potential Target", size=size.tiny,
style=label.style_label_left,
color=nextTargetHighColor,
textcolor=color.white,
xloc=xloc.bar_time)
break
else if priceFalling and array.size(swingLows) > 0
for i = 0 to array.size(swingLows) - 1
target = array.get(swingLows, i)
targetTime = array.get(swingLowTimes, i)
if target < close
currentTargetLine := line.new(
x1=targetTime, y1=target,
x2=time + targetExtension, y2=target,
color=nextTargetLowColor, width=2,
style=line.style_dashed,
xloc=xloc.bar_time)
currentTargetLabel := label.new(
x=time + targetExtension, y=target,
text="Potential Target", size=size.tiny,
style=label.style_label_left,
color=nextTargetLowColor,
textcolor=color.white,
xloc=xloc.bar_time)
break

Universal Ratio Trend Matrix [InvestorUnknown]The Universal Ratio Trend Matrix is designed for trend analysis on asset/asset ratios, supporting up to 40 different assets. Its primary purpose is to help identify which assets are outperforming others within a selection, providing a broad overview of market trends through a matrix of ratios. The indicator automatically expands the matrix based on the number of assets chosen, simplifying the process of comparing multiple assets in terms of performance.
Key features include the ability to choose from a narrow selection of indicators to perform the ratio trend analysis, allowing users to apply well-defined metrics to their comparison.
Drawback: Due to the computational intensity involved in calculating ratios across many assets, the indicator has a limitation related to loading speed. TradingView has time limits for calculations, and for users on the basic (free) plan, this could result in frequent errors due to exceeded time limits. To use the indicator effectively, users with any paid plans should run it on timeframes higher than 8h (the lowest timeframe on which it managed to load with 40 assets), as lower timeframes may not reliably load.
Indicators:
RSI_raw: Simple function to calculate the Relative Strength Index (RSI) of a source (asset price).
RSI_sma: Calculates RSI followed by a Simple Moving Average (SMA).
RSI_ema: Calculates RSI followed by an Exponential Moving Average (EMA).
CCI: Calculates the Commodity Channel Index (CCI).
Fisher: Implements the Fisher Transform to normalize prices.
Utility Functions:
f_remove_exchange_name: Strips the exchange name from asset tickers (e.g., "INDEX:BTCUSD" to "BTCUSD").
f_remove_exchange_name(simple string name) =>
string parts = str.split(name, ":")
string result = array.size(parts) > 1 ? array.get(parts, 1) : name
result
f_get_price: Retrieves the closing price of a given asset ticker using request.security().
f_constant_src: Checks if the source data is constant by comparing multiple consecutive values.
Inputs:
General settings allow users to select the number of tickers for analysis (used_assets) and choose the trend indicator (RSI, CCI, Fisher, etc.).
Table settings customize how trend scores are displayed in terms of text size, header visibility, highlighting options, and top-performing asset identification.
The script includes inputs for up to 40 assets, allowing the user to select various cryptocurrencies (e.g., BTCUSD, ETHUSD, SOLUSD) or other assets for trend analysis.
Price Arrays:
Price values for each asset are stored in variables (price_a1 to price_a40) initialized as na. These prices are updated only for the number of assets specified by the user (used_assets).
Trend scores for each asset are stored in separate arrays
// declare price variables as "na"
var float price_a1 = na, var float price_a2 = na, var float price_a3 = na, var float price_a4 = na, var float price_a5 = na
var float price_a6 = na, var float price_a7 = na, var float price_a8 = na, var float price_a9 = na, var float price_a10 = na
var float price_a11 = na, var float price_a12 = na, var float price_a13 = na, var float price_a14 = na, var float price_a15 = na
var float price_a16 = na, var float price_a17 = na, var float price_a18 = na, var float price_a19 = na, var float price_a20 = na
var float price_a21 = na, var float price_a22 = na, var float price_a23 = na, var float price_a24 = na, var float price_a25 = na
var float price_a26 = na, var float price_a27 = na, var float price_a28 = na, var float price_a29 = na, var float price_a30 = na
var float price_a31 = na, var float price_a32 = na, var float price_a33 = na, var float price_a34 = na, var float price_a35 = na
var float price_a36 = na, var float price_a37 = na, var float price_a38 = na, var float price_a39 = na, var float price_a40 = na
// create "empty" arrays to store trend scores
var a1_array = array.new_int(40, 0), var a2_array = array.new_int(40, 0), var a3_array = array.new_int(40, 0), var a4_array = array.new_int(40, 0)
var a5_array = array.new_int(40, 0), var a6_array = array.new_int(40, 0), var a7_array = array.new_int(40, 0), var a8_array = array.new_int(40, 0)
var a9_array = array.new_int(40, 0), var a10_array = array.new_int(40, 0), var a11_array = array.new_int(40, 0), var a12_array = array.new_int(40, 0)
var a13_array = array.new_int(40, 0), var a14_array = array.new_int(40, 0), var a15_array = array.new_int(40, 0), var a16_array = array.new_int(40, 0)
var a17_array = array.new_int(40, 0), var a18_array = array.new_int(40, 0), var a19_array = array.new_int(40, 0), var a20_array = array.new_int(40, 0)
var a21_array = array.new_int(40, 0), var a22_array = array.new_int(40, 0), var a23_array = array.new_int(40, 0), var a24_array = array.new_int(40, 0)
var a25_array = array.new_int(40, 0), var a26_array = array.new_int(40, 0), var a27_array = array.new_int(40, 0), var a28_array = array.new_int(40, 0)
var a29_array = array.new_int(40, 0), var a30_array = array.new_int(40, 0), var a31_array = array.new_int(40, 0), var a32_array = array.new_int(40, 0)
var a33_array = array.new_int(40, 0), var a34_array = array.new_int(40, 0), var a35_array = array.new_int(40, 0), var a36_array = array.new_int(40, 0)
var a37_array = array.new_int(40, 0), var a38_array = array.new_int(40, 0), var a39_array = array.new_int(40, 0), var a40_array = array.new_int(40, 0)
f_get_price(simple string ticker) =>
request.security(ticker, "", close)
// Prices for each USED asset
f_get_asset_price(asset_number, ticker) =>
if (used_assets >= asset_number)
f_get_price(ticker)
else
na
// overwrite empty variables with the prices if "used_assets" is greater or equal to the asset number
if barstate.isconfirmed // use barstate.isconfirmed to avoid "na prices" and calculation errors that result in empty cells in the table
price_a1 := f_get_asset_price(1, asset1), price_a2 := f_get_asset_price(2, asset2), price_a3 := f_get_asset_price(3, asset3), price_a4 := f_get_asset_price(4, asset4)
price_a5 := f_get_asset_price(5, asset5), price_a6 := f_get_asset_price(6, asset6), price_a7 := f_get_asset_price(7, asset7), price_a8 := f_get_asset_price(8, asset8)
price_a9 := f_get_asset_price(9, asset9), price_a10 := f_get_asset_price(10, asset10), price_a11 := f_get_asset_price(11, asset11), price_a12 := f_get_asset_price(12, asset12)
price_a13 := f_get_asset_price(13, asset13), price_a14 := f_get_asset_price(14, asset14), price_a15 := f_get_asset_price(15, asset15), price_a16 := f_get_asset_price(16, asset16)
price_a17 := f_get_asset_price(17, asset17), price_a18 := f_get_asset_price(18, asset18), price_a19 := f_get_asset_price(19, asset19), price_a20 := f_get_asset_price(20, asset20)
price_a21 := f_get_asset_price(21, asset21), price_a22 := f_get_asset_price(22, asset22), price_a23 := f_get_asset_price(23, asset23), price_a24 := f_get_asset_price(24, asset24)
price_a25 := f_get_asset_price(25, asset25), price_a26 := f_get_asset_price(26, asset26), price_a27 := f_get_asset_price(27, asset27), price_a28 := f_get_asset_price(28, asset28)
price_a29 := f_get_asset_price(29, asset29), price_a30 := f_get_asset_price(30, asset30), price_a31 := f_get_asset_price(31, asset31), price_a32 := f_get_asset_price(32, asset32)
price_a33 := f_get_asset_price(33, asset33), price_a34 := f_get_asset_price(34, asset34), price_a35 := f_get_asset_price(35, asset35), price_a36 := f_get_asset_price(36, asset36)
price_a37 := f_get_asset_price(37, asset37), price_a38 := f_get_asset_price(38, asset38), price_a39 := f_get_asset_price(39, asset39), price_a40 := f_get_asset_price(40, asset40)
Universal Indicator Calculation (f_calc_score):
This function allows switching between different trend indicators (RSI, CCI, Fisher) for flexibility.
It uses a switch-case structure to calculate the indicator score, where a positive trend is denoted by 1 and a negative trend by 0. Each indicator has its own logic to determine whether the asset is trending up or down.
// use switch to allow "universality" in indicator selection
f_calc_score(source, trend_indicator, int_1, int_2) =>
int score = na
if (not f_constant_src(source)) and source > 0.0 // Skip if you are using the same assets for ratio (for example BTC/BTC)
x = switch trend_indicator
"RSI (Raw)" => RSI_raw(source, int_1)
"RSI (SMA)" => RSI_sma(source, int_1, int_2)
"RSI (EMA)" => RSI_ema(source, int_1, int_2)
"CCI" => CCI(source, int_1)
"Fisher" => Fisher(source, int_1)
y = switch trend_indicator
"RSI (Raw)" => x > 50 ? 1 : 0
"RSI (SMA)" => x > 50 ? 1 : 0
"RSI (EMA)" => x > 50 ? 1 : 0
"CCI" => x > 0 ? 1 : 0
"Fisher" => x > x ? 1 : 0
score := y
else
score := 0
score
Array Setting Function (f_array_set):
This function populates an array with scores calculated for each asset based on a base price (p_base) divided by the prices of the individual assets.
It processes multiple assets (up to 40), calling the f_calc_score function for each.
// function to set values into the arrays
f_array_set(a_array, p_base) =>
array.set(a_array, 0, f_calc_score(p_base / price_a1, trend_indicator, int_1, int_2))
array.set(a_array, 1, f_calc_score(p_base / price_a2, trend_indicator, int_1, int_2))
array.set(a_array, 2, f_calc_score(p_base / price_a3, trend_indicator, int_1, int_2))
array.set(a_array, 3, f_calc_score(p_base / price_a4, trend_indicator, int_1, int_2))
array.set(a_array, 4, f_calc_score(p_base / price_a5, trend_indicator, int_1, int_2))
array.set(a_array, 5, f_calc_score(p_base / price_a6, trend_indicator, int_1, int_2))
array.set(a_array, 6, f_calc_score(p_base / price_a7, trend_indicator, int_1, int_2))
array.set(a_array, 7, f_calc_score(p_base / price_a8, trend_indicator, int_1, int_2))
array.set(a_array, 8, f_calc_score(p_base / price_a9, trend_indicator, int_1, int_2))
array.set(a_array, 9, f_calc_score(p_base / price_a10, trend_indicator, int_1, int_2))
array.set(a_array, 10, f_calc_score(p_base / price_a11, trend_indicator, int_1, int_2))
array.set(a_array, 11, f_calc_score(p_base / price_a12, trend_indicator, int_1, int_2))
array.set(a_array, 12, f_calc_score(p_base / price_a13, trend_indicator, int_1, int_2))
array.set(a_array, 13, f_calc_score(p_base / price_a14, trend_indicator, int_1, int_2))
array.set(a_array, 14, f_calc_score(p_base / price_a15, trend_indicator, int_1, int_2))
array.set(a_array, 15, f_calc_score(p_base / price_a16, trend_indicator, int_1, int_2))
array.set(a_array, 16, f_calc_score(p_base / price_a17, trend_indicator, int_1, int_2))
array.set(a_array, 17, f_calc_score(p_base / price_a18, trend_indicator, int_1, int_2))
array.set(a_array, 18, f_calc_score(p_base / price_a19, trend_indicator, int_1, int_2))
array.set(a_array, 19, f_calc_score(p_base / price_a20, trend_indicator, int_1, int_2))
array.set(a_array, 20, f_calc_score(p_base / price_a21, trend_indicator, int_1, int_2))
array.set(a_array, 21, f_calc_score(p_base / price_a22, trend_indicator, int_1, int_2))
array.set(a_array, 22, f_calc_score(p_base / price_a23, trend_indicator, int_1, int_2))
array.set(a_array, 23, f_calc_score(p_base / price_a24, trend_indicator, int_1, int_2))
array.set(a_array, 24, f_calc_score(p_base / price_a25, trend_indicator, int_1, int_2))
array.set(a_array, 25, f_calc_score(p_base / price_a26, trend_indicator, int_1, int_2))
array.set(a_array, 26, f_calc_score(p_base / price_a27, trend_indicator, int_1, int_2))
array.set(a_array, 27, f_calc_score(p_base / price_a28, trend_indicator, int_1, int_2))
array.set(a_array, 28, f_calc_score(p_base / price_a29, trend_indicator, int_1, int_2))
array.set(a_array, 29, f_calc_score(p_base / price_a30, trend_indicator, int_1, int_2))
array.set(a_array, 30, f_calc_score(p_base / price_a31, trend_indicator, int_1, int_2))
array.set(a_array, 31, f_calc_score(p_base / price_a32, trend_indicator, int_1, int_2))
array.set(a_array, 32, f_calc_score(p_base / price_a33, trend_indicator, int_1, int_2))
array.set(a_array, 33, f_calc_score(p_base / price_a34, trend_indicator, int_1, int_2))
array.set(a_array, 34, f_calc_score(p_base / price_a35, trend_indicator, int_1, int_2))
array.set(a_array, 35, f_calc_score(p_base / price_a36, trend_indicator, int_1, int_2))
array.set(a_array, 36, f_calc_score(p_base / price_a37, trend_indicator, int_1, int_2))
array.set(a_array, 37, f_calc_score(p_base / price_a38, trend_indicator, int_1, int_2))
array.set(a_array, 38, f_calc_score(p_base / price_a39, trend_indicator, int_1, int_2))
array.set(a_array, 39, f_calc_score(p_base / price_a40, trend_indicator, int_1, int_2))
a_array
Conditional Array Setting (f_arrayset):
This function checks if the number of used assets is greater than or equal to a specified number before populating the arrays.
// only set values into arrays for USED assets
f_arrayset(asset_number, a_array, p_base) =>
if (used_assets >= asset_number)
f_array_set(a_array, p_base)
else
na
Main Logic
The main logic initializes arrays to store scores for each asset. Each array corresponds to one asset's performance score.
Setting Trend Values: The code calls f_arrayset for each asset, populating the respective arrays with calculated scores based on the asset prices.
Combining Arrays: A combined_array is created to hold all the scores from individual asset arrays. This array facilitates further analysis, allowing for an overview of the performance scores of all assets at once.
// create a combined array (work-around since pinescript doesn't support having array of arrays)
var combined_array = array.new_int(40 * 40, 0)
if barstate.islast
for i = 0 to 39
array.set(combined_array, i, array.get(a1_array, i))
array.set(combined_array, i + (40 * 1), array.get(a2_array, i))
array.set(combined_array, i + (40 * 2), array.get(a3_array, i))
array.set(combined_array, i + (40 * 3), array.get(a4_array, i))
array.set(combined_array, i + (40 * 4), array.get(a5_array, i))
array.set(combined_array, i + (40 * 5), array.get(a6_array, i))
array.set(combined_array, i + (40 * 6), array.get(a7_array, i))
array.set(combined_array, i + (40 * 7), array.get(a8_array, i))
array.set(combined_array, i + (40 * 8), array.get(a9_array, i))
array.set(combined_array, i + (40 * 9), array.get(a10_array, i))
array.set(combined_array, i + (40 * 10), array.get(a11_array, i))
array.set(combined_array, i + (40 * 11), array.get(a12_array, i))
array.set(combined_array, i + (40 * 12), array.get(a13_array, i))
array.set(combined_array, i + (40 * 13), array.get(a14_array, i))
array.set(combined_array, i + (40 * 14), array.get(a15_array, i))
array.set(combined_array, i + (40 * 15), array.get(a16_array, i))
array.set(combined_array, i + (40 * 16), array.get(a17_array, i))
array.set(combined_array, i + (40 * 17), array.get(a18_array, i))
array.set(combined_array, i + (40 * 18), array.get(a19_array, i))
array.set(combined_array, i + (40 * 19), array.get(a20_array, i))
array.set(combined_array, i + (40 * 20), array.get(a21_array, i))
array.set(combined_array, i + (40 * 21), array.get(a22_array, i))
array.set(combined_array, i + (40 * 22), array.get(a23_array, i))
array.set(combined_array, i + (40 * 23), array.get(a24_array, i))
array.set(combined_array, i + (40 * 24), array.get(a25_array, i))
array.set(combined_array, i + (40 * 25), array.get(a26_array, i))
array.set(combined_array, i + (40 * 26), array.get(a27_array, i))
array.set(combined_array, i + (40 * 27), array.get(a28_array, i))
array.set(combined_array, i + (40 * 28), array.get(a29_array, i))
array.set(combined_array, i + (40 * 29), array.get(a30_array, i))
array.set(combined_array, i + (40 * 30), array.get(a31_array, i))
array.set(combined_array, i + (40 * 31), array.get(a32_array, i))
array.set(combined_array, i + (40 * 32), array.get(a33_array, i))
array.set(combined_array, i + (40 * 33), array.get(a34_array, i))
array.set(combined_array, i + (40 * 34), array.get(a35_array, i))
array.set(combined_array, i + (40 * 35), array.get(a36_array, i))
array.set(combined_array, i + (40 * 36), array.get(a37_array, i))
array.set(combined_array, i + (40 * 37), array.get(a38_array, i))
array.set(combined_array, i + (40 * 38), array.get(a39_array, i))
array.set(combined_array, i + (40 * 39), array.get(a40_array, i))
Calculating Sums: A separate array_sums is created to store the total score for each asset by summing the values of their respective score arrays. This allows for easy comparison of overall performance.
Ranking Assets: The final part of the code ranks the assets based on their total scores stored in array_sums. It assigns a rank to each asset, where the asset with the highest score receives the highest rank.
// create array for asset RANK based on array.sum
var ranks = array.new_int(used_assets, 0)
// for loop that calculates the rank of each asset
if barstate.islast
for i = 0 to (used_assets - 1)
int rank = 1
for x = 0 to (used_assets - 1)
if i != x
if array.get(array_sums, i) < array.get(array_sums, x)
rank := rank + 1
array.set(ranks, i, rank)
Dynamic Table Creation
Initialization: The table is initialized with a base structure that includes headers for asset names, scores, and ranks. The headers are set to remain constant, ensuring clarity for users as they interpret the displayed data.
Data Population: As scores are calculated for each asset, the corresponding values are dynamically inserted into the table. This is achieved through a loop that iterates over the scores and ranks stored in the combined_array and array_sums, respectively.
Automatic Extending Mechanism
Variable Asset Count: The code checks the number of assets defined by the user. Instead of hardcoding the number of rows in the table, it uses a variable to determine the extent of the data that needs to be displayed. This allows the table to expand or contract based on the number of assets being analyzed.
Dynamic Row Generation: Within the loop that populates the table, the code appends new rows for each asset based on the current asset count. The structure of each row includes the asset name, its score, and its rank, ensuring that the table remains consistent regardless of how many assets are involved.
// Automatically extending table based on the number of used assets
var table table = table.new(position.bottom_center, 50, 50, color.new(color.black, 100), color.white, 3, color.white, 1)
if barstate.islast
if not hide_head
table.cell(table, 0, 0, "Universal Ratio Trend Matrix", text_color = color.white, bgcolor = #010c3b, text_size = fontSize)
table.merge_cells(table, 0, 0, used_assets + 3, 0)
if not hide_inps
table.cell(table, 0, 1,
text = "Inputs: You are using " + str.tostring(trend_indicator) + ", which takes: " + str.tostring(f_get_input(trend_indicator)),
text_color = color.white, text_size = fontSize), table.merge_cells(table, 0, 1, used_assets + 3, 1)
table.cell(table, 0, 2, "Assets", text_color = color.white, text_size = fontSize, bgcolor = #010c3b)
for x = 0 to (used_assets - 1)
table.cell(table, x + 1, 2, text = str.tostring(array.get(assets, x)), text_color = color.white, bgcolor = #010c3b, text_size = fontSize)
table.cell(table, 0, x + 3, text = str.tostring(array.get(assets, x)), text_color = color.white, bgcolor = f_asset_col(array.get(ranks, x)), text_size = fontSize)
for r = 0 to (used_assets - 1)
for c = 0 to (used_assets - 1)
table.cell(table, c + 1, r + 3, text = str.tostring(array.get(combined_array, c + (r * 40))),
text_color = hl_type == "Text" ? f_get_col(array.get(combined_array, c + (r * 40))) : color.white, text_size = fontSize,
bgcolor = hl_type == "Background" ? f_get_col(array.get(combined_array, c + (r * 40))) : na)
for x = 0 to (used_assets - 1)
table.cell(table, x + 1, x + 3, "", bgcolor = #010c3b)
table.cell(table, used_assets + 1, 2, "", bgcolor = #010c3b)
for x = 0 to (used_assets - 1)
table.cell(table, used_assets + 1, x + 3, "==>", text_color = color.white)
table.cell(table, used_assets + 2, 2, "SUM", text_color = color.white, text_size = fontSize, bgcolor = #010c3b)
table.cell(table, used_assets + 3, 2, "RANK", text_color = color.white, text_size = fontSize, bgcolor = #010c3b)
for x = 0 to (used_assets - 1)
table.cell(table, used_assets + 2, x + 3,
text = str.tostring(array.get(array_sums, x)),
text_color = color.white, text_size = fontSize,
bgcolor = f_highlight_sum(array.get(array_sums, x), array.get(ranks, x)))
table.cell(table, used_assets + 3, x + 3,
text = str.tostring(array.get(ranks, x)),
text_color = color.white, text_size = fontSize,
bgcolor = f_highlight_rank(array.get(ranks, x)))

Checklist By TradeINskiChecklist By TradeINski
First Things First
This indicator is a supporting tool for trading momentum burst that is 2 Lynch setup by stock bee aka Pradeep Bonde.
Disclaimer: This indicator will not give any buy or sell signal. This is just a supporting tool to improve efficiency in my trading.
Apply Indicators and then open indicator settings and read the following simultaneously to understand better.
Default color settings are best suited for light themes. Which is also my personal preference.
Users can change most of the default options in settings according to their personal preference in settings.
When we open settings we can see 3 tabs that are {Inputs tab} {Style tab} {Visibility tab} each tab have its own options, Understand and use it accordingly.
Indicator will be only visible in the Daily time frame as its primary TF is daily. In the lower time frame nothing is plotted.
An indicator is plotted on an existing plane and overlaid on the existing plane.
Contents
My Checklist Lynch
Table Header Settings
Position
Size
Text Color
Background Color
“ON/OFF” Header “Text Box” “Info”
Table Content
Text Color
Background Color
“ON/OFF” R (1 - 10) “Text Box” T (1 - 10) “Text Box”
My Checklist - 2Lynch
This is the checklist I use while placing the trade just to make use of not missing anything based on predefined rules of the setup I trade.
2 - The stock should not be Up more than 2 days in a row, Minor movement can be acceptable.
L - The stock price movement should be linear, validation of established momentum
Y - Young trend in preference 1 - 3rd breakout from base
N - Narrow Range or -ve day before breakout
C - Consolidation should be narrow, linear and low volume. No more than one 4% breakdown.
H - The candle should close near high or at least 20% within when entered.
Table Headers Settings
Position - “Drop Down” with 9 different options which are self explanatory. Users can change the position of the table as per their preference.
Size - “Drop Down” with 6 different options which are self explanatory. Users can change the size of all the text printed in the table as per their preference.
Text Color - “Default Color is White” This setting is specifically only for header text. And users can change the text color of the header as per their preference.
Background Color - “Default Color is Blue” This setting is specifically only for header
background color. Users can change the background color of the header as per their preference.
“ON/OFF” Header “Text Box” “Info”
“Check Mark” - To show or hide the header that is “ON/OFF”.
“Header” - Heading of the table.
“Text Box” - Users can input as per their preference.
“Info” - Info symbol that shows short form and important note that is (Max 50 characteristics for all text boxes) .
Table Content
Text Color - “Default Color is White” This setting is specifically for table texts. And users can change the text color of the all content table texts as per their preference.
Background Color - “Default Color is black” This setting is specifically for content table texts background color. Users can change the background color of the header as per their preference.
“ON/OFF” R (1 - 10) “Text Box” T (1 - 10) “Text Box”
“Check Mark” - To show or hide the complete Row. Users have options and can change as per their preferences.
R (1-10) - “R” stands for Row and (1-10) is Number of rows available for users to enter text. Users have 10 different options.
“Text Box” - Place to enter text that users want to print on column 1 of the table.
T (1-10) - “T” stands for table and (1-10) is Number of text boxes available for users to enter text. Users have 10 different options.
“Text Box” - Place to enter text that users want to print on column 2 of the table.
