PriceFormatLibrary for automatically converting price values to formatted strings
matching the same format that TradingView uses to display open/high/low/close prices on the chart.
█ OVERVIEW
This library is intended for Pine Coders who are authors of scripts that display numbers onto a user's charts. Typically, 𝚜𝚝𝚛.𝚝𝚘𝚜𝚝𝚛𝚒𝚗𝚐() would be used to convert a number into a string which can be displayed in a label / box / table, but this only works well for values that are formatted as a simple decimal number. The purpose of this library is to provide an easy way to create a formatted string for values which use other types of formats besides the decimal format.
The main functions exported by this library are:
𝚏𝚘𝚛𝚖𝚊𝚝𝙿𝚛𝚒𝚌𝚎() - creates a formatted string from a price value
𝚖𝚎𝚊𝚜𝚞𝚛𝚎𝙿𝚛𝚒𝚌𝚎𝙲𝚑𝚊𝚗𝚐𝚎() - creates a formatted string from the distance between two prices
𝚝𝚘𝚜𝚝𝚛𝚒𝚗𝚐() - an alternative to the built-in 𝚜𝚝𝚛.𝚝𝚘𝚜𝚝𝚛𝚒𝚗𝚐(𝚟𝚊𝚕𝚞𝚎, 𝚏𝚘𝚛𝚖𝚊𝚝)
This library also exports some auxiliary functions which are used under the hood of the previously mentioned functions, but can also be useful to Pine Coders that need fine-tuned control for customized formatting of numeric values:
Functions that determine information about the current chart:
𝚒𝚜𝙵𝚛𝚊𝚌𝚝𝚒𝚘𝚗𝚊𝚕𝙵𝚘𝚛𝚖𝚊𝚝(), 𝚒𝚜𝚅𝚘𝚕𝚞𝚖𝚎𝙵𝚘𝚛𝚖𝚊𝚝(), 𝚒𝚜𝙿𝚎𝚛𝚌𝚎𝚗𝚝𝚊𝚐𝚎𝙵𝚘𝚛𝚖𝚊𝚝(), 𝚒𝚜𝙳𝚎𝚌𝚒𝚖𝚊𝚕𝙵𝚘𝚛𝚖𝚊𝚝(), 𝚒𝚜𝙿𝚒𝚙𝚜𝙵𝚘𝚛𝚖𝚊𝚝()
Functions that convert a 𝚏𝚕𝚘𝚊𝚝 value to a formatted string:
𝚊𝚜𝙳𝚎𝚌𝚒𝚖𝚊𝚕(), 𝚊𝚜𝙿𝚒𝚙𝚜(), 𝚊𝚜𝙵𝚛𝚊𝚌𝚝𝚒𝚘𝚗𝚊𝚕(), 𝚊𝚜𝚅𝚘𝚕𝚞𝚖𝚎()
█ EXAMPLES
• Simple Example
This example shows the simplest way to utilize this library.
//@version=6
indicator("Simple Example")
import n00btraders/PriceFormat/1
var table t = table.new(position.middle_right, 2, 1, bgcolor = color.new(color.blue, 90), force_overlay = true)
if barstate.isfirst
table.cell(t, 0, 0, "Current Price: ", text_color = color.black, text_size = 40)
table.cell(t, 1, 0, text_color = color.blue, text_size = 40)
if barstate.islast
string lastPrice = close.formatPrice() // Simple, easy way to format price
table.cell_set_text(t, 1, 0, lastPrice)
• Complex Example
This example calls all of the main functions and uses their optional arguments.
//@version=6
indicator("Complex Example")
import n00btraders/PriceFormat/1
// Enum values that can be used as optional arguments
precision = input.enum(PriceFormat.Precision.DEFAULT)
language = input.enum(PriceFormat.Language.ENGLISH)
// Main library functions used to create formatted strings
string formattedOpen = open.formatPrice(precision, language, allowPips = true)
string rawOpenPrice = PriceFormat.tostring(open, format.price)
string formattedClose = close.formatPrice(precision, language, allowPips = true)
string rawClosePrice = PriceFormat.tostring(close, format.price)
= PriceFormat.measurePriceChange(open, close, precision, language, allowPips = true)
// Labels to display formatted values on chart
string prices = str.format("Open: {0} ({1})\n\nClose: {2} ({3})", formattedOpen, rawOpenPrice, formattedClose, rawClosePrice)
string change = str.format("Change (close - open):\n\n{0} / {1}", distance, ticks)
label.new(chart.point.now(high), prices, yloc = yloc.abovebar, textalign = text.align_left, force_overlay = true)
label.new(chart.point.now(low), change, yloc = yloc.belowbar, style = label.style_label_up, force_overlay = true)
█ NOTES
• Function Descriptions
The library source code uses Markdown for the exported functions. Hover over a function/method call in the Pine Editor to display formatted, detailed information about the function/method.
• Precision Settings
The Precision option in the chart settings can change the format of how prices are displayed on the chart. Since the user's selected choice cannot be known through any Pine built-in variable, this library provides a 𝙿𝚛𝚎𝚌𝚒𝚜𝚒𝚘𝚗 enum that can be used as an optional script input for the user to specify their selected choice.
• Language Settings
The Language option in the user menu can change the decimal/grouping separators in the prices that are displayed on the chart. Since the user's selected choice cannot be known through any Pine built-in variable, this library provides a 𝙻𝚊𝚗𝚐𝚞𝚊𝚐𝚎 enum that can be used as an optional script input for the user to specify their selected choice.
█ EXPORTED FUNCTIONS
method formatPrice(price, precision, language, allowPips)
Formats a price value to match how it would be displayed on the user's current chart.
Namespace types: series float, simple float, input float, const float
Parameters:
price (float) : The value to format.
precision (series Precision) : A Precision.* enum value.
language (series Language) : A Language.* enum value.
allowPips (simple bool) : Whether to allow decimal numbers to display as pips.
Returns: Automatically formatted price string.
measurePriceChange(startPrice, endPrice, precision, language, allowPips)
Measures a change in price in terms of both distance and ticks.
Parameters:
startPrice (float) : The starting price.
endPrice (float) : The ending price.
precision (series Precision) : A Precision.* enum value.
language (series Language) : A Language.* enum value.
allowPips (simple bool) : Whether to allow decimal numbers to display as pips.
Returns: A tuple of formatted strings: .
method tostring(value, format)
Alternative to the Pine `str.tostring(value, format)` built-in function.
Namespace types: series float, simple float, input float, const float
Parameters:
value (float) : (series float) The value to format.
format (string) : (series string) The format string.
Returns: String in the specified format.
isFractionalFormat()
Determines if the default behavior of the chart's price scale is to use a fractional format.
Returns: True if the chart can display prices in fractional format.
isVolumeFormat()
Determines if the default behavior of the chart's price scale is to display prices as volume.
Returns: True if the chart can display prices as volume.
isPercentageFormat()
Determines if the default behavior of the chart's price scale is to display percentages.
Returns: True if the chart can display prices as percentages.
isDecimalFormat()
Determines if the default behavior of the chart's price scale is to use a decimal format.
Returns: True if the chart can display prices in decimal format.
isPipsFormat()
Determines if the current symbol's prices can be displayed as pips.
Returns: True if the chart can display prices as pips.
method asDecimal(value, precision, minTick, decimalSeparator, groupingSeparator, eNotation)
Converts a number to a string in decimal format.
Namespace types: series float, simple float, input float, const float
Parameters:
value (float) : The value to format.
precision (int) : Number of decimal places.
minTick (float) : Minimum tick size.
decimalSeparator (string) : The decimal separator.
groupingSeparator (string) : The thousands separator, aka digit group separator.
eNotation (bool) : Whether the result should use E notation.
Returns: String in decimal format.
method asPips(value, priceScale, minMove, minMove2, decimalSeparator, groupingSeparator)
Converts a number to a string in decimal format with the last digit replaced by a superscript.
Namespace types: series float, simple float, input float, const float
Parameters:
value (float) : The value to format.
priceScale (int) : Price scale.
minMove (int) : Min move.
minMove2 (int) : Min move 2.
decimalSeparator (string) : The decimal separator.
groupingSeparator (string) : The thousands separator, aka digit group separator.
Returns: String in decimal format with an emphasis on the pip value.
method asFractional(value, priceScale, minMove, minMove2, fractionalSeparator1, fractionalSeparator2)
Converts a number to a string in fractional format.
Namespace types: series float, simple float, input float, const float
Parameters:
value (float) : The value to format.
priceScale (int) : Price scale.
minMove (int) : Min move.
minMove2 (int) : Min move 2.
fractionalSeparator1 (string) : The primary fractional separator.
fractionalSeparator2 (string) : The secondary fractional separator.
Returns: String in fractional format.
method asVolume(value, precision, minTick, decimalSeparator, groupingSeparator, spacing)
Converts a number to a string in volume format.
Namespace types: series float, simple float, input float, const float
Parameters:
value (float) : The value to format.
precision (int) : Maximum number of decimal places.
minTick (float) : Minimum tick size.
decimalSeparator (string) : The decimal separator.
groupingSeparator (string) : The thousands separator, aka digit group separator.
spacing (string) : The whitespace separator.
Returns: String in volume format.
חפש סקריפטים עבור "text"

Pinescript - Common Label & Line Array Functions Library by RRBPinescript - Common Label & Line Array Functions Library by RagingRocketBull 2021
Version 1.0
This script provides a library of common array functions for arrays of label and line objects with live testing of all functions.
Using this library you can easily create, update, delete, join label/line object arrays, and get/set properties of individual label/line object array items.
You can find the full list of supported label/line array functions below.
There are several libraries:
- Common String Functions Library
- Standard Array Functions Library
- Common Fixed Type Array Functions Library
- Common Label & Line Array Functions Library
- Common Variable Type Array Functions Library
Features:
- 30 array functions in categories create/update/delete/join/get/set with support for both label/line objects (45+ including all implementations)
- Create, Update label/line object arrays from list/array params
- GET/SET properties of individual label/line array items by index
- Join label/line objects/arrays into a single string for output
- Supports User Input of x,y coords of 5 different types: abs/rel/rel%/inc/inc% list/array, auto transforms x,y input into list/array based on type, base and xloc, translates rel into abs bar indexes
- Supports User Input of lists with shortened names of string properties, auto expands all standard string properties to their full names for use in functions
- Live Output for all/selected functions based on User Input. Test any function for possible errors you may encounter before using in script.
- Output filters: hide all excluded and show only allowed functions using a list of function names
- Output Panel customization options: set custom style, color, text size, and line spacing
Usage:
- select create function - create label/line arrays from lists or arrays (optional). Doesn't affect the update functions. The only change in output should be function name regardless of the selected implementation.
- specify num_objects for both label/line arrays (default is 7)
- specify common anchor point settings x,y base/type for both label/line arrays and GET/SET items in Common Settings
- fill lists with items to use as inputs for create label/line array functions in Create Label/Line Arrays section
- specify label/line array item index and properties to SET in corresponding sections
- select label/line SET function to see the changes applied live
Code Structure:
- translate x,y depending on x,y type, base and xloc as specified in UI (required for all functions)
- expand all shortened standard property names to full names (required for create/update* from arrays and set* functions, not needed for create/update* from lists) to prevent errors in label.new and line.new
- create param arrays from string lists (required for create/update* from arrays and set* functions, not needed for create/update* from lists)
- create label/line array from string lists (property names are auto expanded) or param arrays (requires already expanded properties)
- update entire label/line array or
- get/set label/line array item properties by index
Transforming/Expanding Input values:
- for this script to work on any chart regardless of price/scale, all x*,y* are specified as % increase relative to x0,y0 base levels by default, but user can enter abs x,price values specific for that chart if necessary.
- all lists can be empty, contain 1 or several items, have the same/different lengths. Array Length = min(min(len(list*)), mum_objects) is used to create label/line objects. Missing list items are replaced with default property values.
- when a list contains only 1 item it is duplicated (label name/tooltip is also auto incremented) to match the calculated Array Length
- since this script processes user input, all x,y values must be translated to abs bar indexes before passing them to functions. Your script may provide all data internally and doesn't require this step.
- at first int x, float y arrays are created from user string lists, transformed as described below and returned as x,y arrays.
- translated x,y arrays can then be passed to create from arrays function or can be converted back to x,y string lists for the create from lists function if necessary.
- all translation logic is separated from create/update/set functions for the following reasons:
- to avoid redundant code/dependency on ext functions/reduce local scopes and to be able to translate everything only once in one place - should be faster
- to simplify internal logic of all functions
- because your script may provide all data internally without user input and won't need the translation step
- there are 5 types available for both x,y: abs, rel, rel%, inc, inc%. In addition to that, x can be: bar index or time, y is always price.
- abs - absolute bar index/time from start bar0 (x) or price (y) from 0, is >= 0
- rel - relative bar index/time from cur bar n (x) or price from y0 base level, is >= 0
- rel% - relative % increase of bar index/time (x) or price (y) from corresponding base level (x0 or y0), can be <=> 0
- inc - relative increment (step) for each new level of bar index/time (x) or price (y) from corresponding base level (x0 or y0), can be <=> 0
- inc% - relative % increment (% step) for each new level of bar index/time (x) or price (y) from corresponding base level (x0 or y0), can be <=> 0
- x base level >= 0
- y base level can be 0 (empty) or open, close, high, low of cur bar
- single item x1_list = "50" translates into:
- for x type abs: "50, 50, 50 ..." num_objects times regardless of xloc => x = 50
- for x type rel: "50, 50, 50 ... " num_objects times => x = x_base + 50
- for x type rel%: "50%, 50%, 50% ... " num_objects times => x_base * (1 + 0.5)
- for x type inc: "0, 50, 100 ... " num_objects times => x_base + 50 * i
- for x type inc%: "0%, 50%, 100% ... " num_objects times => x_base * (1 + 0.5 * i)
- when xloc = xloc.bar_index each rel*/inc* value in the above list is then subtracted from n: n - x to convert rel to abs bar index, values of abs type are not affected
- x1_list = "0, 50, 100, ..." of type rel is the same as "50" of type inc
- x1_list = "50, 50, 50, ..." of type abs/rel/rel% produces a sequence of the same values and can be shortened to just "50"
- single item y1_list = "2" translates into (ragardless of yloc):
- for y type abs: "2, 2, 2 ..." num_objects times => y = 2
- for y type rel: "2, 2, 2 ... " num_objects times => y = y_base + 2
- for y type rel%: "2%, 2%, 2% ... " num_objects times => y = y_base * (1 + 0.02)
- for y type inc: "0, 2, 4 ... " num_objects times => y = y_base + 2 * i
- for y type inc%: "0%, 2%, 4% ... " num_objects times => y = y_base * (1 + 0.02 * i)
- when yloc != yloc.price all calculated values above are simply ignored
- y1_list = "0, 2, 4" of type rel% is the same as "2" with type inc%
- y1_list = "2, 2, 2" of type abs/rel/rel% produces a sequence of the same values and can be shortened to just "2"
- you can enter shortened property names in lists. To lookup supported shortened names use corresponding dropdowns in Set Label/Line Array Item Properties sections
- all shortened standard property names must be expanded to full names (required for create/update* from arrays and set* functions, not needed for create/update* from lists) to prevent errors in label.new and line.new
- examples of shortened property names that can be used in lists: bar_index, large, solid, label_right, white, left, left, price
- expanded to their corresponding full names: xloc.bar_index, size.large, line.style_solid, label.style_label_right, color.white, text.align_left, extend.left, yloc.price
- all expanding logic is separated from create/update* from arrays and set* functions for the same reasons as above, and because param arrays already have different types, implying the use of final values.
- all expanding logic is included in the create/update* from lists functions because it seemed more natural to process string lists from user input directly inside the function, since they are already strings.
Creating Label/Line Objects:
- use study max_lines_count and max_labels_count params to increase the max number of label/line objects to 500 (+3) if necessary. Default number of label/line objects is 50 (+3)
- all functions use standard param sequence from methods in reference, except style always comes before colors.
- standard label/line.get* functions only return a few properties, you can't read style, color, width etc.
- label.new(na, na, "") will still create a label with x = n-301, y = NaN, text = "" because max default scope for a var is 300 bars back.
- there are 2 types of color na, label color requires color(na) instead of color_na to prevent error. text_color and line_color can be color_na
- for line to be visible both x1, x2 ends must be visible on screen, also when y1 == y2 => abs(x1 - x2) >= 2 bars => line is visible
- xloc.bar_index line uses abs x1, x2 indexes and can only be within 0 and n ends, where n <= 5000 bars (free accounts) or 10000 bars (paid accounts) limit, can't be plotted into the future
- xloc.bar_time line uses abs x1, x2 times, can't go past bar0 time but can continue past cur bar time into the future, doesn't have a length limit in bars.
- xloc.bar_time line with length = exact number of bars can be plotted only within bar0 and cur bar, can't be plotted into the future reliably because of future gaps due to sessions on some charts
- xloc.bar_index line can't be created on bar 0 with fixed length value because there's only 1 bar of horiz length
- it can be created on cur bar using fixed length x < n <= 5000 or
- created on bar0 using na and then assigned final x* values on cur bar using set_x*
- created on bar0 using n - fixed_length x and then updated on cur bar using set_x*, where n <= 5000
- default orientation of lines (for style_arrow* and extend) is from left to right (from bar 50 to bar 0), it reverses when x1 and x2 are swapped
- price is a function, not a line object property
Variable Type Arrays:
- you can't create an if/function that returns var type value/array - compiler uses strict types and doesn't allow that
- however you can assign array of any type to another array of any type creating an arr pointer of invalid type that must be reassigned to a matching array type before used in any expression to prevent error
- create_any_array2 uses this loophole to return an int_arr pointer of a var type array
- this works for all array types defined with/without var keyword and doesn't work for string arrays defined with var keyword for some reason
- you can't do this with var type vars, only var type arrays because arrays are pointers passed by reference, while vars are actual values passed by value.
- you can only pass a var type value/array param to a function if all functions inside support every type - otherwise error
- alternatively values of every type must be passed simultaneously and processed separately by corresponding if branches/functions supporting these particular types returning a common single type result
- get_var_types solves this problem by generating a list of dummy values of every possible type including the source type, tricking the compiler into allowing a single valid branch to execute without error, while ignoring all dummy results
Notes:
- uses Pinescript v3 Compatibility Framework
- uses Common String Functions Library, Common Fixed Type Array Functions Library, Common Variable Type Array Functions Library
- has to be a separate script to reduce the number of local scopes/compiled file size, can't be merged with another library.
- lets you live test all label/line array functions for errors. If you see an error - change params in UI
- if you see "Loop too long" error - hide/unhide or reattach the script
- if you see "Chart references too many candles" error - change x type or value between abs/rel*. This can happen on charts with 5000+ bars when a rel bar index x is passed to label.new or line.new instead of abs bar index n - x
- create/update_label/line_array* use string lists, while create/update_label/line_array_from_arrays* use array params to create label/line arrays. "from_lists" is dropped to shorten the names of the most commonly used functions.
- create_label/line_array2,4 are preferable, 5,6 are listed for pure demonstration purposes only - don't use them, they don't improve anything but dramatically increase local scopes/compiled file size
- for this reason you would mainly be using create/update_label/line_array2,4 for list params or create/update_label/line_array_from_arrays2 for array params
- all update functions are executed after each create as proof of work and can be disabled. Only create functions are required. Use update functions when necessary - when list/array params are changed by your script.
- both lists and array item properties use the same x,y_type, x,y_base from common settings
- doesn't use pagination, a single str contains all output
- why is this so complicated? What are all these functions for?
- this script merges standard label/line object methods with standard array functions to create a powerful set of label/line object array functions to simplify manipulation of these arrays.
- this library also extends the functionality of Common Variable Type Array Functions Library providing support for label/line types in var type array functions (any_to_str6, join_any_array5)
- creating arrays from either lists or arrays adds a level of flexibility that comes with complexity. It's very likely that in your script you'd have to deal with both string lists as input, and arrays internally, once everything is converted.
- processing user input, allowing customization and targeting for any chart adds a whole new layer of complexity, all inputs must be translated and expanded before used in functions.
- different function implementations can increase/reduce local scopes and compiled file size. Select a version that best suits your needs. Creating complex scripts often requires rewriting your code multiple times to fit the limits, every line matters.
P.S. Don't rely too much on labels, for too often they are fables.
List of functions*:
* - functions from other libraries are not listed
1. Join Functions
Labels
- join_label_object(label_, d1, d2)
- join_label_array(arr, d1, d2)
- join_label_array2(arr, d1, d2, d3)
Lines
- join_line_object(line_, d1, d2)
- join_line_array(arr, d1, d2)
- join_line_array2(arr, d1, d2, d3)
Any Type
- any_to_str6(arr, index, type)
- join_any_array4(arr, d1, d2, type)
- join_any_array5(arr, d, type)
2. GET/SET Functions
Labels
- label_array_get_text(arr, index)
- label_array_get_xy(arr, index)
- label_array_get_fields(arr, index)
- label_array_set_text(arr, index, str)
- label_array_set_xy(arr, index, x, y)
- label_array_set_fields(arr, index, x, y, str)
- label_array_set_all_fields(arr, index, x, y, str, xloc, yloc, label_style, label_color, text_color, text_size, text_align, tooltip)
- label_array_set_all_fields2(arr, index, x, y, str, xloc, yloc, label_style, label_color, text_color, text_size, text_align, tooltip)
Lines
- line_array_get_price(arr, index, bar)
- line_array_get_xy(arr, index)
- line_array_get_fields(arr, index)
- line_array_set_text(arr, index, width)
- line_array_set_xy(arr, index, x1, y1, x2, y2)
- line_array_set_fields(arr, index, x1, y1, x2, y2, width)
- line_array_set_all_fields(arr, index, x1, y1, x2, y2, xloc, extend, line_style, line_color, width)
- line_array_set_all_fields2(arr, index, x1, y1, x2, y2, xloc, extend, line_style, line_color, width)
3. Create/Update/Delete Functions
Labels
- delete_label_array(label_arr)
- create_label_array(list1, list2, list3, list4, list5, d)
- create_label_array2(x_list, y_list, str_list, xloc_list, yloc_list, style_list, color1_list, color2_list, size_list, align_list, tooltip_list, d)
- create_label_array3(x_list, y_list, str_list, xloc_list, yloc_list, style_list, color1_list, color2_list, size_list, align_list, tooltip_list, d)
- create_label_array4(x_list, y_list, str_list, xloc_list, yloc_list, style_list, color1_list, color2_list, size_list, align_list, tooltip_list, d)
- create_label_array5(x_list, y_list, str_list, xloc_list, yloc_list, style_list, color1_list, color2_list, size_list, align_list, tooltip_list, d)
- create_label_array6(x_list, y_list, str_list, xloc_list, yloc_list, style_list, color1_list, color2_list, size_list, align_list, tooltip_list, d)
- update_label_array2(label_arr, x_list, y_list, str_list, xloc_list, yloc_list, style_list, color1_list, color2_list, size_list, align_list, tooltip_list, d)
- update_label_array4(label_arr, x_list, y_list, str_list, xloc_list, yloc_list, style_list, color1_list, color2_list, size_list, align_list, tooltip_list, d)
- create_label_array_from_arrays2(x_arr, y_arr, str_arr, xloc_arr, yloc_arr, style_arr, color1_arr, color2_arr, size_arr, align_arr, tooltip_arr, d)
- create_label_array_from_arrays4(x_arr, y_arr, str_arr, xloc_arr, yloc_arr, style_arr, color1_arr, color2_arr, size_arr, align_arr, tooltip_arr, d)
- update_label_array_from_arrays2(label_arr, x_arr, y_arr, str_arr, xloc_arr, yloc_arr, style_arr, color1_arr, color2_arr, size_arr, align_arr, tooltip_arr, d)
Lines
- delete_line_array(line_arr)
- create_line_array(list1, list2, list3, list4, list5, list6, d)
- create_line_array2(x1_list, y1_list, x2_list, y2_list, xloc_list, extend_list, style_list, color_list, width_list, d)
- create_line_array3(x1_list, y1_list, x2_list, y2_list, xloc_list, extend_list, style_list, color_list, width_list, d)
- create_line_array4(x1_list, y1_list, x2_list, y2_list, xloc_list, extend_list, style_list, color_list, width_list, d)
- create_line_array5(x1_list, y1_list, x2_list, y2_list, xloc_list, extend_list, style_list, color_list, width_list, d)
- create_line_array6(x1_list, y1_list, x2_list, y2_list, xloc_list, extend_list, style_list, color_list, width_list, d)
- update_line_array2(line_arr, x1_list, y1_list, x2_list, y2_list, xloc_list, extend_list, style_list, color_list, width_list, d)
- update_line_array4(line_arr, x1_list, y1_list, x2_list, y2_list, xloc_list, extend_list, style_list, color_list, width_list, d)
- create_line_array_from_arrays2(x1_arr, y1_arr, x2_arr, y2_arr, xloc_arr, extend_arr, style_arr, color_arr, width_arr, d)
- update_line_array_from_arrays2(line_arr, x1_arr, y1_arr, x2_arr, y2_arr, xloc_arr, extend_arr, style_arr, color_arr, width_arr, d)

Sav Fx Dynamic P & D°//@version=5
indicator("Sav Fx Dynamic P & D°", overlay = true, max_boxes_count = 50, max_labels_count = 2, max_lines_count = 10)
// Global Settings (visible)
customLineColor = input.color(#000000, "True Open", group = "Global Settings")
// Input for custom sessionTypeText size and width
sessionTypeTextSize = input.string("small", "Session Type Text Size", options= , group="Text Settings")
// On/Off switches for each open line
show90MinuteCycleOpen = input.bool(true, "90 Minute Cycle Open", group="Open Lines")
showTrueNewYorkOpen = input.bool(true, "True New York Open", group="Open Lines")
showTrueDayOpen = input.bool(true, "True Day Open", group="Open Lines")
showTrueWeekOpen = input.bool(true, "True Week Open", group="Open Lines")
showTrueMonthOpen = input.bool(false, "True Month Open", group="Open Lines")
IsTime(h, m, timezone) =>
not na(time) and hour(time, timezone) == h and minute(time, timezone) == m
IsSession(sess, timezone) =>
not na(time(timeframe.period, sess, timezone))
is6_00Session = IsSession("0600-0730", "America/New_York")
is7_30Session = IsSession("0730-0900", "America/New_York")
is9_00Session = IsSession("0900-1030", "America/New_York")
is10_30Session = IsSession("1030-1200", "America/New_York")
var MOPLine = line.new(na, na, na, na, color = customLineColor, width = 1, style = line.style_dashed)
var MOPLabel = label.new(na, na, text = "True Day Open", color = color.rgb(120, 123, 134, 100), textcolor = customLineColor, size = size.small, style = label.style_label_left)
var float trueDayOpen = na
if showTrueDayOpen
if IsTime(0, 0, "America/New_York")
line.set_xy1(MOPLine, bar_index, open)
line.set_xy2(MOPLine, bar_index, open)
label.set_xy(MOPLabel, bar_index, open)
trueDayOpen := open
if barstate.islast
line.set_x2(MOPLine, bar_index + 20)
label.set_x(MOPLabel, bar_index + 20)
else
line.delete(MOPLine)
label.delete(MOPLabel)
var NYTrueOpenLine = line.new(na, na, na, na, color = customLineColor, width = 1, style = line.style_dashed)
var NYTrueOpenLabel = label.new(na, na, text = "True New York Open", color = color.rgb(105, 130, 218, 100), textcolor = customLineColor, size = size.small, style = label.style_label_left)
var float NYTrueOpen = na
if showTrueNewYorkOpen
if IsTime(1, 30, "America/New_York") or IsTime(7, 30, "America/New_York") or IsTime(13, 30, "America/New_York")
line.set_xy1(NYTrueOpenLine, bar_index, open)
line.set_xy2(NYTrueOpenLine, bar_index, open)
label.set_xy(NYTrueOpenLabel, bar_index, open)
NYTrueOpen := open
if IsTime(1, 30, "America/New_York")
label.set_text(NYTrueOpenLabel, "True London Open")
if IsTime(7, 30, "America/New_York")
label.set_text(NYTrueOpenLabel, "True New York Open")
if IsTime(13, 30, "America/New_York")
label.set_text(NYTrueOpenLabel, "True PM Session Open")
if barstate.islast
line.set_x2(NYTrueOpenLine, bar_index + 20)
label.set_x(NYTrueOpenLabel, bar_index + 20)
else
line.delete(NYTrueOpenLine)
label.delete(NYTrueOpenLabel)
var lookahead_bars = 20
var MondayLine = line.new(na, na, na, na, color = customLineColor, width = 1, style = line.style_dashed)
var MondayLabel = label.new(na, na, text = timeframe.isintraday and timeframe.multiplier >= 5 ? "True week Open" : "", color = #9b27b000, textcolor = customLineColor, size = size.small, style = label.style_label_left)
if showTrueWeekOpen
if dayofweek == dayofweek.monday and IsTime(18, 0, "America/New_York")
line.set_xy1(MondayLine, bar_index, close)
line.set_xy2(MondayLine, bar_index, close)
label.set_xy(MondayLabel, bar_index, close)
if barstate.islast
line.set_x2(MondayLine, bar_index + lookahead_bars)
label.set_x(MondayLabel, bar_index + lookahead_bars)
else
line.delete(MondayLine)
label.delete(MondayLabel)
var ninetyMinuteCycleLine = line.new(na, na, na, na, color = customLineColor, width = 1, style = line.style_dashed)
var ninetyMinuteCycleLabel = label.new(na, na, text = "90 Minute Cycle True Open", color = #4caf4f00, textcolor = customLineColor, size = size.small, style = label.style_label_left)
if show90MinuteCycleOpen
if IsTime(3, 23, "America/New_York") or IsTime(9, 23, "America/New_York") or IsTime(15, 23, "America/New_York")
line.set_xy1(ninetyMinuteCycleLine, bar_index, open)
line.set_xy2(ninetyMinuteCycleLine, bar_index, open)
label.set_xy(ninetyMinuteCycleLabel, bar_index, open)
if IsTime(3, 23, "America/New_York")
label.set_text(ninetyMinuteCycleLabel, "03:23 Cycle True Open")
if IsTime(9, 23, "America/New_York")
label.set_text(ninetyMinuteCycleLabel, "09:23 Cycle True Open")
if IsTime(15, 23, "America/New_York")
label.set_text(ninetyMinuteCycleLabel, "15:23 Cycle True Open")
if barstate.islast
line.set_x2(ninetyMinuteCycleLine, bar_index + lookahead_bars)
label.set_x(ninetyMinuteCycleLabel, bar_index + lookahead_bars)
else
line.delete(ninetyMinuteCycleLine)
label.delete(ninetyMinuteCycleLabel)
var monthOpenLine = line.new(na, na, na, na, color = customLineColor, width = 1, style = line.style_dashed)
var monthOpenLabel = label.new(na, na, text = "True Month Open", color = #ff990000, textcolor = customLineColor, size = size.small, style = label.style_label_left)
isSecondWeekSunday = dayofweek == dayofweek.sunday and (dayofmonth >= 8 and dayofmonth <= 14)
if showTrueMonthOpen
if isSecondWeekSunday and IsTime(18,0, "America/New_York")
line.set_xy1(monthOpenLine, bar_index, close)
line.set_xy2(monthOpenLine, bar_index + lookahead_bars, close)
label.set_xy(monthOpenLabel, bar_index, close)
if barstate.islast
line.set_x2(monthOpenLine, bar_index + lookahead_bars)
label.set_x(monthOpenLabel, bar_index + lookahead_bars)
else
line.delete(monthOpenLine)
label.delete(monthOpenLabel)
directionalBias = "N/A"
if is6_00Session or is7_30Session or is9_00Session or is10_30Session
directionalBias := open > NYTrueOpen ? "Bullish" : "Bearish"
var directionalBiasLabel = label.new(na, na, text = "Directional Bias: " + directionalBias, color = na, textcolor = customLineColor, size = size.normal, style = label.style_label_left)
if barstate.islast
label.set_x(directionalBiasLabel, bar_index + lookahead_bars)
label.set_text(directionalBiasLabel, "Directional Bias: " + directionalBias)
var float WeekOpen = na
if dayofweek == dayofweek.monday and IsTime(18, 0, "America/New_York")
WeekOpen := close
if showTrueWeekOpen
line.set_xy1(MondayLine, bar_index, close)
line.set_xy2(MondayLine, bar_index, close)
label.set_xy(MondayLabel, bar_index, close)
// New table for static session type display
var sessionTable = table.new(position.bottom_right, 1, 1, bgcolor = #b9b9bab8)
// Update the table.cell function call
if barstate.islast and not na(trueDayOpen) and not na(NYTrueOpen) and not na(WeekOpen)
var string sessionTypeText = syminfo.ticker + " Dead Zone"
var color sessionColor = color.rgb(126, 126, 126, 65)
// Check conditions and set session type text and color accordingly
if close < trueDayOpen and close < NYTrueOpen and close < WeekOpen
sessionTypeText := syminfo.ticker + " Week Discount"
sessionColor := #ba4b4b59
else if close > trueDayOpen and close > NYTrueOpen and close > WeekOpen
sessionTypeText := syminfo.ticker + " Week Premium"
sessionColor := #4b56ba5a
else if close < trueDayOpen and close < NYTrueOpen and close > WeekOpen
sessionTypeText := syminfo.ticker + " Day Discount & Week Dead Zone"
sessionColor := #ba4b4b59
else if close > trueDayOpen and close > NYTrueOpen and close < WeekOpen
sessionTypeText := syminfo.ticker + " Day premium & Week Dead Zone"
sessionColor := #4b56ba5a
// Using only size input for session type text
table.cell(sessionTable, 0, 0, sessionTypeText, bgcolor = sessionColor, text_color = color.black, text_size = sessionTypeTextSize)

loggerLibrary "logger"
◼ Overview
A dual logging library for developers. Tradingview lacks logging capability. This library provides logging while developing your scripts and is to be used by developers when developing and debugging their scripts.
Using this library would potentially slow down you scripts. Hence, use this for debugging only. Once your code is as you would like it to be, remove the logging code.
◼︎ Usage (Console):
Console = A sleek single cell logging with a limit of 4096 characters. When you dont need a large logging capability.
//@version=5
indicator("demo.Console", overlay=true)
plot(na)
import GETpacman/logger/1 as logger
var console = logger.log.new()
console.init() // init() should be called as first line after variable declaration
console.FrameColor:=color.green
console.log('\n')
console.log('\n')
console.log('Hello World')
console.log('\n')
console.log('\n')
console.ShowStatusBar:=true
console.StatusBarAtBottom:=true
console.FrameColor:=color.blue //settings can be changed anytime before show method is called. Even twice. The last call will set the final value
console.ShowHeader:=false //this wont throw error but is not used for console
console.show(position=position.bottom_right) //this should be the last line of your code, after all methods and settings have been dealt with.
◼︎ Usage (Logx):
Logx = Multiple columns logging with a limit of 4096 characters each message. When you need to log large number of messages.
//@version=5
indicator("demo.Logx", overlay=true)
plot(na)
import GETpacman/logger/1 as logger
var logx = logger.log.new()
logx.init() // init() should be called as first line after variable declaration
logx.FrameColor:=color.green
logx.log('\n')
logx.log('\n')
logx.log('Hello World')
logx.log('\n')
logx.log('\n')
logx.ShowStatusBar:=true
logx.StatusBarAtBottom:=true
logx.ShowQ3:=false
logx.ShowQ4:=false
logx.ShowQ5:=false
logx.ShowQ6:=false
logx.FrameColor:=color.olive //settings can be changed anytime before show method is called. Even twice. The last call will set the final value
logx.show(position=position.top_right) //this should be the last line of your code, after all methods and settings have been dealt with.
◼︎ Fields (with default settings)
▶︎ IsConsole = True Log will act as Console if true, otherwise it will act as Logx
▶︎ ShowHeader = True (Log only) Will show a header at top or bottom of logx.
▶︎ HeaderAtTop = True (Log only) Will show the header at the top, or bottom if false, if ShowHeader is true.
▶︎ ShowStatusBar = True Will show a status bar at the bottom
▶︎ StatusBarAtBottom = True Will show the status bar at the bottom, or top if false, if ShowHeader is true.
▶︎ ShowMetaStatus = True Will show the meta info within status bar (Current Bar, characters left in console, Paging On Every Bar, Console dumped data etc)
▶︎ ShowBarIndex = True Logx will show column for Bar Index when the message was logged. Console will add Bar index at the front of logged messages
▶︎ ShowDateTime = True Logx will show column for Date/Time passed with the logged message logged. Console will add Date/Time at the front of logged messages
▶︎ ShowLogLevels = True Logx will show column for Log levels corresponding to error codes. Console will log levels in the status bar
▶︎ ReplaceWithErrorCodes = True (Log only) Logx will show error codes instead of log levels, if ShowLogLevels is switched on
▶︎ RestrictLevelsToKey7 = True Log levels will be restricted to Ley 7 codes - TRACE, DEBUG, INFO, WARNING, ERROR, CRITICAL, FATAL
▶︎ ShowQ1 = True (Log only) Show the column for Q1
▶︎ ShowQ2 = True (Log only) Show the column for Q2
▶︎ ShowQ3 = True (Log only) Show the column for Q3
▶︎ ShowQ4 = True (Log only) Show the column for Q4
▶︎ ShowQ5 = True (Log only) Show the column for Q5
▶︎ ShowQ6 = True (Log only) Show the column for Q6
▶︎ ColorText = True Log/Console will color text as per error codes
▶︎ HighlightText = True Log/Console will highlight text (like denoting) as per error codes
▶︎ AutoMerge = True (Log only) Merge the queues towards the right if there is no data in those queues.
▶︎ PageOnEveryBar = True Clear data from previous bars on each new bar, in conjuction with PageHistory setting.
▶︎ MoveLogUp = True Move log in up direction. Setting to false will push logs down.
▶︎ MarkNewBar = True On each change of bar, add a marker to show the bar has changed
▶︎ PrefixLogLevel = True (Console only) Prefix all messages with the log level corresponding to error code.
▶︎ MinWidth = 40 Set the minimum width needed to be seen. Prevents logx/console shrinking below these number of characters.
▶︎ TabSizeQ1 = 0 If set to more than one, the messages on Q1 or Console messages will indent by this size based on error code (Max 4 used)
▶︎ TabSizeQ2 = 0 If set to more than one, the messages on Q2 will indent by this size based on error code (Max 4 used)
▶︎ TabSizeQ3 = 0 If set to more than one, the messages on Q2 will indent by this size based on error code (Max 4 used)
▶︎ TabSizeQ4 = 0 If set to more than one, the messages on Q2 will indent by this size based on error code (Max 4 used)
▶︎ TabSizeQ5 = 0 If set to more than one, the messages on Q2 will indent by this size based on error code (Max 4 used)
▶︎ TabSizeQ6 = 0 If set to more than one, the messages on Q2 will indent by this size based on error code (Max 4 used)
▶︎ PageHistory = 0 Used with PageOnEveryBar. Determines how many historial pages to keep.
▶︎ HeaderQbarIndex = 'Bar#' (Logx only) The header to show for Bar Index
▶︎ HeaderQdateTime = 'Date' (Logx only) The header to show for Date/Time
▶︎ HeaderQerrorCode = 'eCode' (Logx only) The header to show for Error Codes
▶︎ HeaderQlogLevel = 'State' (Logx only) The header to show for Log Level
▶︎ HeaderQ1 = 'h.Q1' (Logx only) The header to show for Q1
▶︎ HeaderQ2 = 'h.Q2' (Logx only) The header to show for Q2
▶︎ HeaderQ3 = 'h.Q3' (Logx only) The header to show for Q3
▶︎ HeaderQ4 = 'h.Q4' (Logx only) The header to show for Q4
▶︎ HeaderQ5 = 'h.Q5' (Logx only) The header to show for Q5
▶︎ HeaderQ6 = 'h.Q6' (Logx only) The header to show for Q6
▶︎ Status = '' Set the status to this text.
▶︎ HeaderColor Set the color for the header
▶︎ HeaderColorBG Set the background color for the header
▶︎ StatusColor Set the color for the status bar
▶︎ StatusColorBG Set the background color for the status bar
▶︎ TextColor Set the color for the text used without error code or code 0.
▶︎ TextColorBG Set the background color for the text used without error code or code 0.
▶︎ FrameColor Set the color for the frame around Logx/Console
▶︎ FrameSize = 1 Set the size of the frame around Logx/Console
▶︎ CellBorderSize = 0 Set the size of the border around cells.
▶︎ CellBorderColor Set the color for the border around cells within Logx/Console
▶︎ SeparatorColor = gray Set the color of separate in between Console/Logx Attachment
◼︎ Methods (summary)
● init ▶︎ Initialise the log
● log ▶︎ Log the messages. Use method show to display the messages
● page ▶︎ Clear messages from previous bar while logging messages on this bar.
● show ▶︎ Shows a table displaying the logged messages
● clear ▶︎ Clears the log of all messages
● resize ▶︎ Resizes the log. If size is for reduction then oldest messages are lost first.
● turnPage ▶︎ When called, all messages marked with previous page, or from start are cleared
● dateTimeFormat ▶︎ Sets the date time format to be used when displaying date/time info.
● resetTextColor ▶︎ Reset Text Color to library default
● resetTextBGcolor ▶︎ Reset Text BG Color to library default
● resetHeaderColor ▶︎ Reset Header Color to library default
● resetHeaderBGcolor ▶︎ Reset Header BG Color to library default
● resetStatusColor ▶︎ Reset Status Color to library default
● resetStatusBGcolor ▶︎ Reset Status BG Color to library default
● setColors ▶︎ Sets the colors to be used for corresponding error codes
● setColorsBG ▶︎ Sets the background colors to be used for corresponding error codes. If not match of error code, then text color used.
● setColorsHC ▶︎ Sets the highlight colors to be used for corresponding error codes.If not match of error code, then text bg color used.
● resetColors ▶︎ Reset the colors to library default (Total 36, not including error code 0)
● resetColorsBG ▶︎ Reset the background colors to library default
● resetColorsHC ▶︎ Reset the highlight colors to library default
● setLevelNames ▶︎ Set the log level names to be used for corresponding error codes. If not match of error code, then empty string used.
● resetLevelNames ▶︎ Reset the log level names to library default. (Total 36) 1=TRACE, 2=DEBUG, 3=INFO, 4=WARNING, 5=ERROR, 6=CRITICAL, 7=FATAL
● attach ▶︎ Attaches a console to an existing Logx, allowing to have dual logging system independent of each other
● detach ▶︎ Detaches an already attached console from Logx
method clear(this)
Clears all the queue, including bar_index and time queues, of existing messages
Namespace types: log
Parameters:
this (log)
method resize(this, rows)
Resizes the message queues. If size is decreased then removes the oldest messages
Namespace types: log
Parameters:
this (log)
rows (int) : The new size needed for the queues. Default value is 40.
method dateTimeFormat(this, format)
Re/set the date time format used for displaying date and time. Default resets to dd.MMM.yy HH:mm
Namespace types: log
Parameters:
this (log)
format (string)
method resetTextColor(this)
Resets the text color of the log to library default.
Namespace types: log
Parameters:
this (log)
method resetTextColorBG(this)
Resets the background color of the log to library default.
Namespace types: log
Parameters:
this (log)
method resetHeaderColor(this)
Resets the color used for Headers, to library default.
Namespace types: log
Parameters:
this (log)
method resetHeaderColorBG(this)
Resets the background color used for Headers, to library default.
Namespace types: log
Parameters:
this (log)
method resetStatusColor(this)
Resets the text color of the status row, to library default.
Namespace types: log
Parameters:
this (log)
method resetStatusColorBG(this)
Resets the background color of the status row, to library default.
Namespace types: log
Parameters:
this (log)
method resetFrameColor(this)
Resets the color used for the frame around the log table, to library default.
Namespace types: log
Parameters:
this (log)
method resetColorsHC(this)
Resets the color used for the highlighting when Highlight Text option is used, to library default
Namespace types: log
Parameters:
this (log)
method resetColorsBG(this)
Resets the background color used for setting the background color, when the Color Text option is used, to library default
Namespace types: log
Parameters:
this (log)
method resetColors(this)
Resets the color used for respective error codes, when the Color Text option is used, to library default
Namespace types: log
Parameters:
this (log)
method setColors(this, c)
Sets the colors corresponding to error codes
Index 0 of input array c is color is reserved for future use.
Index 1 of input array c is color for debug code 1.
Index 2 of input array c is color for debug code 2.
There are 2 modes of coloring
1 . Using the Foreground color
2 . Using the Foreground color as background color and a white/black/gray color as foreground color
This is denoting or highlighting. Which effectively puts the foreground color as background color
Namespace types: log
Parameters:
this (log)
c (color ) : Array of colors to be used for corresponding error codes. If the corresponding code is not found, then text color is used
method setColorsHC(this, c)
Sets the highlight colors corresponding to error codes
Index 0 of input array c is color is reserved for future use.
Index 1 of input array c is color for debug code 1.
Index 2 of input array c is color for debug code 2.
There are 2 modes of coloring
1 . Using the Foreground color
2 . Using the Foreground color as background color and a white/black/gray color as foreground color
This is denoting or highlighting. Which effectively puts the foreground color as background color
Namespace types: log
Parameters:
this (log)
c (color ) : Array of highlight colors to be used for corresponding error codes. If the corresponding code is not found, then text color BG is used
method setColorsBG(this, c)
Sets the highlight colors corresponding to debug codes
Index 0 of input array c is color is reserved for future use.
Index 1 of input array c is color for debug code 1.
Index 2 of input array c is color for debug code 2.
There are 2 modes of coloring
1 . Using the Foreground color
2 . Using the Foreground color as background color and a white/black/gray color as foreground color
This is denoting or highlighting. Which effectively puts the foreground color as background color
Namespace types: log
Parameters:
this (log)
c (color ) : Array of background colors to be used for corresponding error codes. If the corresponding code is not found, then text color BG is used
method resetLevelNames(this, prefix, suffix)
Resets the log level names used for corresponding error codes
With prefix/suffix, the default Level name will be like => prefix + Code + suffix
Namespace types: log
Parameters:
this (log)
prefix (string) : Prefix to use when resetting level names
suffix (string) : Suffix to use when resetting level names
method setLevelNames(this, names)
Resets the log level names used for corresponding error codes
Index 0 of input array names is reserved for future use.
Index 1 of input array names is name used for error code 1.
Index 2 of input array names is name used for error code 2.
Namespace types: log
Parameters:
this (log)
names (string ) : Array of log level names be used for corresponding error codes. If the corresponding code is not found, then an empty string is used
method init(this, rows, isConsole)
Sets up data for logging. It consists of 6 separate message queues, and 3 additional queues for bar index, time and log level/error code. Do not directly alter the contents, as library could break.
Namespace types: log
Parameters:
this (log)
rows (int) : Log size, excluding the header/status. Default value is 50.
isConsole (bool) : Whether to init the log as console or logx. True= as console, False = as Logx. Default is true, hence init as console.
method log(this, ec, m1, m2, m3, m4, m5, m6, tv, log)
Logs messages to the queues , including, time/date, bar_index, and error code
Namespace types: log
Parameters:
this (log)
ec (int) : Error/Code to be assigned.
m1 (string) : Message needed to be logged to Q1, or for console.
m2 (string) : Message needed to be logged to Q2. Not used/ignored when in console mode
m3 (string) : Message needed to be logged to Q3. Not used/ignored when in console mode
m4 (string) : Message needed to be logged to Q4. Not used/ignored when in console mode
m5 (string) : Message needed to be logged to Q5. Not used/ignored when in console mode
m6 (string) : Message needed to be logged to Q6. Not used/ignored when in console mode
tv (int) : Time to be used. Default value is time, which logs the start time of bar.
log (bool) : Whether to log the message or not. Default is true.
method page(this, ec, m1, m2, m3, m4, m5, m6, tv, page)
Logs messages to the queues , including, time/date, bar_index, and error code. All messages from previous bars are cleared
Namespace types: log
Parameters:
this (log)
ec (int) : Error/Code to be assigned.
m1 (string) : Message needed to be logged to Q1, or for console.
m2 (string) : Message needed to be logged to Q2. Not used/ignored when in console mode
m3 (string) : Message needed to be logged to Q3. Not used/ignored when in console mode
m4 (string) : Message needed to be logged to Q4. Not used/ignored when in console mode
m5 (string) : Message needed to be logged to Q5. Not used/ignored when in console mode
m6 (string) : Message needed to be logged to Q6. Not used/ignored when in console mode
tv (int) : Time to be used. Default value is time, which logs the start time of bar.
page (bool) : Whether to log the message or not. Default is true.
method turnPage(this, turn)
Set the messages to be on a new page, clearing messages from previous page.
This is not dependent on PageHisotry option, as this method simply just clears all the messages, like turning old pages to a new page.
Namespace types: log
Parameters:
this (log)
turn (bool)
method show(this, position, hhalign, hvalign, hsize, thalign, tvalign, tsize, show, attach)
Display Message Q, Index Q, Time Q, and Log Levels
All options for postion/alignment accept TV values, such as position.bottom_right, text.align_left, size.auto etc.
Namespace types: log
Parameters:
this (log)
position (string) : Position of the table used for displaying the messages. Default is Bottom Right.
hhalign (string) : Horizontal alignment of Header columns
hvalign (string) : Vertical alignment of Header columns
hsize (string) : Size of Header text Options
thalign (string) : Horizontal alignment of all messages
tvalign (string) : Vertical alignment of all messages
tsize (string) : Size of text across the table
show (bool) : Whether to display the logs or not. Default is true.
attach (log) : Console that has been attached via attach method. If na then console will not be shown
method attach(this, attach, position)
Attaches a console to Logx, or moves already attached console around Logx
All options for position/alignment accept TV values, such as position.bottom_right, text.align_left, size.auto etc.
Namespace types: log
Parameters:
this (log)
attach (log) : Console object that has been previously attached.
position (string) : Position of Console in relation to Logx. Can be Top, Right, Bottom, Left. Default is Bottom. If unknown specified then defaults to bottom.
method detach(this, attach)
Detaches the attached console from Logx.
All options for position/alignment accept TV values, such as position.bottom_right, text.align_left, size.auto etc.
Namespace types: log
Parameters:
this (log)
attach (log) : Console object that has been previously attached.
drawingutilsLibrary "drawingutils"
methods used in my scripts for some basic and customized drawings and arrays.
method line(this, p1, p2, lineColor, style, width, xloc, extend)
Draws line and adds to the array
Namespace types: array
Parameters:
this (array) : array to which the created line needs to be added
p1 (chart.point) : point1 of the line
p2 (chart.point) : point2 of the line
lineColor (color) : line color
style (string) : line style
width (int) : line width
xloc (string) : xloc.bar_index or xloc.bar_time
extend (string) : default is extend.none
Returns: line created
method label(this, p, txt, tooltip, xloc, yloc, color, style, textcolor, size, textalign)
Draws label and adds to the array
Namespace types: array
Parameters:
this (array) : array to which the created label needs to be added
p (chart.point) : point at which the label needs to be drawn
txt (string) : label text
tooltip (string) : tooltip text
xloc (string) : xloc value - xloc.bar_index or xloc.bar_time
yloc (string) : y location of the label
color (color) : label color
style (string) : label style
textcolor (color) : label text color
size (string) : Size of the label
textalign (string) : text alignment
Returns: label created
method linefill(this, ln1, ln2, fillColor, transparency)
Draws linefill and adds to array
Namespace types: array
Parameters:
this (array) : array to which the created linefill needs to be added
ln1 (line) : line1 of the fill
ln2 (line) : line2 of the fill
fillColor (color) : fill Color
transparency (int) : fill transparency
Returns: linefill created
draw_labelled_line(target, lblText, linecolor, labelcolor, index, highlight, linesArray, labelsArray, highlightSize, tinySize, yloc, textalign)
Draws labelled line
Parameters:
target (float) : target price
lblText (string) : label text
linecolor (color) : line color
labelcolor (color) : label color
index (int) : index to calculate the distance offset
highlight (bool) : highlight true/false
linesArray (array) : array of lines where the created line is added
labelsArray (array) : array of labels where the created label is added
highlightSize (string) : Size of highlighted text
tinySize (string) : size of non highlighted text
yloc (string) : y location
textalign (string) : text alignment
Returns: void
draw_labelled_box(y1, y2, labelColor, labelText, index, boxArray, labelArray, borderColor, borderStyle, borderWidth, textAlign, highlight, highLightLabel)
Draws custom labelled box
Parameters:
y1 (float) : price 1 of the box
y2 (float) : price 2 of the box
labelColor (color) : label color
labelText (string) : label text
index (int) : index to calculate the offset distance
boxArray (array) : box array to which the box needs to be added
labelArray (array) : label array to which the label needs to be added
borderColor (color) : border color
borderStyle (string) : border style
borderWidth (int) : border width
textAlign (string) : text align of the label
highlight (bool) : highlight label text
highLightLabel (bool) : highlight label size
Returns: void

PRO Trade Manager//@version=5
indicator("PRO Trade Manager", shorttitle="PRO Trade Manager", overlay=false)
// ============================================================================
// INPUTS
//This code and all related materials are the exclusive property of Trade Confident LLC. Any reproduction, distribution, modification, or unauthorized use of this code, in whole or in part, is strictly prohibited without the express written consent of Trade Confident LLC. Violations may result in civil and/or criminal penalties to the fullest extent of the law.
// © Trade Confident LLC. All rights reserved.
// ============================================================================
// Moving Average Settings
maLength = input.int(15, "Signal Strength", minval=1, tooltip="Length of the moving average to measure deviation from (lower = more sensitive)")
maType = "SMA" // Fixed to SMA, no longer user-selectable
// Deviation Settings
deviationLength = input.int(20, "Deviation Period", minval=1, tooltip="Lookback period for standard deviation calculation")
// Signal Frequency dropdown - controls both upper and lower thresholds
signalFrequency = input.string("More/Good Accuracy", "Signal Frequency", options= ,
tooltip="Normal/Highest Accuracy = ±2.0 StdDev | More/Good Accuracy = ±1.5 StdDev | Most/Moderate Accuracy = ±1.0 StdDev")
// Set thresholds based on selected frequency
upperThreshold = signalFrequency == "Most/Moderate Accuracy" ? 1.0 : signalFrequency == "More/Good Accuracy" ? 1.5 : 2.0
lowerThreshold = signalFrequency == "Most/Moderate Accuracy" ? -1.0 : signalFrequency == "More/Good Accuracy" ? -1.5 : -2.0
// Continuation Signal Settings
atrMultiplier = input.float(2.0, "TP/DCA Market Breakout Detection", minval=0, step=0.5, tooltip="Number of ATR moves required to trigger continuation signals (Set to 0 to disable)")
// Visual Settings
showMA = false // MA display removed from settings
showSignals = input.bool(true, "Show Alert Signals", tooltip="Show visual signals when price is overextended")
// ============================================================================
// CALCULATIONS
// ============================================================================
// Calculate Moving Average based on type
ma = switch maType
"SMA" => ta.sma(close, maLength)
"EMA" => ta.ema(close, maLength)
"WMA" => ta.wma(close, maLength)
"VWMA" => ta.vwma(close, maLength)
=> ta.sma(close, maLength)
// Calculate deviation from MA
deviation = close - ma
// Calculate standard deviation
stdDev = ta.stdev(close, deviationLength)
// Calculate number of standard deviations away from MA
deviationScore = stdDev != 0 ? deviation / stdDev : 0
// Smooth the deviation score slightly for cleaner signals
smoothedDeviation = ta.ema(deviationScore, 3)
// ============================================================================
// SIGNALS
// ============================================================================
// Overextended conditions
overextendedHigh = smoothedDeviation >= upperThreshold
overextendedLow = smoothedDeviation <= lowerThreshold
// Signal triggers (crossing into overextended territory)
bullishSignal = ta.crossunder(smoothedDeviation, lowerThreshold)
bearishSignal = ta.crossover(smoothedDeviation, upperThreshold)
// Track if we're in bright histogram zones
isBrightGreen = smoothedDeviation <= lowerThreshold
isBrightRed = smoothedDeviation >= upperThreshold
// Track if we were in bright zone on previous bar
wasBrightGreen = smoothedDeviation <= lowerThreshold
wasBrightRed = smoothedDeviation >= upperThreshold
// Detect oscillator turning up after bright green (buy signal)
// Trigger if we were in bright green and oscillator turns up, even if no longer bright green
oscillatorTurningUp = smoothedDeviation > smoothedDeviation
buySignal = barstate.isconfirmed and wasBrightGreen and oscillatorTurningUp and smoothedDeviation <= smoothedDeviation
// Detect oscillator turning down after bright red (sell signal)
// Trigger if we were in bright red and oscillator turns down, even if no longer bright red
oscillatorTurningDown = smoothedDeviation < smoothedDeviation
sellSignal = barstate.isconfirmed and wasBrightRed and oscillatorTurningDown and smoothedDeviation >= smoothedDeviation
// ============================================================================
// ATR-BASED CONTINUATION SIGNALS
// ============================================================================
// Calculate ATR for distance measurement
atrLength = 14
atr = ta.atr(atrLength)
// Track price levels when ANY sell or buy signal occurs (original or continuation)
var float lastSellPrice = na
var float lastBuyPrice = na
// Initialize tracking on original signals
if sellSignal
lastSellPrice := close
if buySignal
lastBuyPrice := close
// Continuation Sell Signal: Price moved up by ATR multiplier from last red dot
// Disabled when atrMultiplier is set to 0
continuationSell = atrMultiplier > 0 and barstate.isconfirmed and not na(lastSellPrice) and close >= lastSellPrice + (atrMultiplier * atr)
// Continuation Buy Signal: Price moved down by ATR multiplier from last green dot
// Disabled when atrMultiplier is set to 0
continuationBuy = atrMultiplier > 0 and barstate.isconfirmed and not na(lastBuyPrice) and close <= lastBuyPrice - (atrMultiplier * atr)
// Update reference prices when continuation signals trigger (reset the 3 ATR counter)
if continuationSell
lastSellPrice := close
if continuationBuy
lastBuyPrice := close
// Combine original and continuation signals for plotting
allBuySignals = buySignal or continuationBuy
allSellSignals = sellSignal or continuationSell
// Track if a signal occurred to keep it visible on dashboard
// Signals trigger at barstate.isconfirmed (bar close)
var bool showBuyOnDashboard = false
var bool showSellOnDashboard = false
// Update dashboard flags immediately when signals occur
if allBuySignals
showBuyOnDashboard := true
showSellOnDashboard := false
else if allSellSignals
showSellOnDashboard := true
showBuyOnDashboard := false
else if barstate.isconfirmed
// Reset flags on bar close if no new signal
showBuyOnDashboard := false
showSellOnDashboard := false
// ============================================================================
// PLOTTING
// ============================================================================
// Professional color scheme
var color colorBullish = #00C853 // Professional green
var color colorBearish = #FF1744 // Professional red
var color colorNeutral = #2962FF // Professional blue
var color colorGrid = #363A45 // Dark gray for lines
var color colorBackground = #1E222D // Chart background
// Dynamic line color based on value
lineColor = smoothedDeviation > upperThreshold ? colorBearish :
smoothedDeviation < lowerThreshold ? colorBullish :
smoothedDeviation > 0 ? color.new(colorBearish, 50) :
color.new(colorBullish, 50)
// Plot the deviation oscillator with dynamic coloring
plot(smoothedDeviation, "Deviation Score", color=lineColor, linewidth=2)
// Plot zero line
hline(0, "Zero Line", color=color.new(colorGrid, 0), linestyle=hline.style_solid, linewidth=1)
// Subtle fill for overextended zones (without visible threshold lines)
upperLine = hline(upperThreshold, "Upper Threshold", color=color.new(color.gray, 100), linestyle=hline.style_dashed, linewidth=1)
lowerLine = hline(lowerThreshold, "Lower Threshold", color=color.new(color.gray, 100), linestyle=hline.style_dashed, linewidth=1)
fill(upperLine, hline(3), color=color.new(colorBearish, 95), title="Overextended High Zone")
fill(lowerLine, hline(-3), color=color.new(colorBullish, 95), title="Overextended Low Zone")
// Histogram style visualization (optional alternative)
histogramColor = smoothedDeviation >= upperThreshold ? color.new(colorBearish, 20) :
smoothedDeviation <= lowerThreshold ? color.new(colorBullish, 20) :
smoothedDeviation > 0 ? color.new(colorBearish, 80) :
color.new(colorBullish, 80)
plot(smoothedDeviation, "Histogram", color=histogramColor, style=plot.style_histogram, linewidth=3)
// ============================================================================
// BUY/SELL SIGNAL MARKERS
// ============================================================================
// Plot buy signals at -3.5 level (includes both initial and extended signals)
plot(allBuySignals ? -3.5 : na, title="Buy Signal", style=plot.style_circles,
color=color.new(colorBullish, 0), linewidth=4)
// Plot sell signals at 3.5 level (includes both initial and extended signals)
plot(allSellSignals ? 3.5 : na, title="Sell Signal", style=plot.style_circles,
color=color.new(colorBearish, 0), linewidth=4)
// ============================================================================
// ALERTS - SIMPLIFIED TO ONLY TWO ALERTS
// ============================================================================
// Alert 1: Long Entry/Short TP - fires on ANY green dot (original or continuation)
alertcondition(allBuySignals, "Long Entry/Short TP", "Long Entry/Short TP")
// Alert 2: Long TP/Short Entry - fires on ANY red dot (original or continuation)
alertcondition(allSellSignals, "Long TP/Short Entry", "Long TP/Short Entry")
// ============================================================================
// DATA DISPLAY
// ============================================================================
// Create a professional table for current readings
var color tableBgColor = #1a2332 // Dark blue background
var table infoTable = table.new(position.middle_right, 2, 2, border_width=1,
border_color=color.new(#2962FF, 30),
frame_width=1,
frame_color=color.new(#2962FF, 30))
if barstate.islast
// Determine status
statusText = overextendedHigh ? "OVEREXTENDED ↓" :
overextendedLow ? "OVEREXTENDED ↑" :
smoothedDeviation > 0 ? "Buyers In Control" : "Sellers In Control"
statusColor = overextendedHigh ? color.new(colorBearish, 0) :
overextendedLow ? color.new(colorBullish, 0) :
color.white
// Background color for status cell
statusBgColor = color.new(tableBgColor, 0)
// Status Row
table.cell(infoTable, 0, 0, "Status",
bgcolor=color.new(tableBgColor, 0),
text_color=color.white,
text_size=size.normal)
table.cell(infoTable, 1, 0, statusText,
bgcolor=statusBgColor,
text_color=statusColor,
text_size=size.normal)
// Signal Row - always show
table.cell(infoTable, 0, 1, "Signal",
bgcolor=color.new(tableBgColor, 0),
text_color=color.white,
text_size=size.normal)
// Show signal if flags are set (will stay visible during the bar)
if showBuyOnDashboard or showSellOnDashboard
// Green dot (buy signal) = "Long Entry/Short TP" with arrow up, white text on green background
// Red dot (sell signal) = "Long TP/Short Entry" with arrow down, white text on red background
signalText = showBuyOnDashboard ? "↑ Long Entry/Short TP" : "↓ Long TP/Short Entry"
signalColor = showBuyOnDashboard ? color.new(colorBullish, 0) : color.new(colorBearish, 0)
table.cell(infoTable, 1, 1, signalText,
bgcolor=signalColor,
text_color=color.white,
text_size=size.normal)
else
table.cell(infoTable, 1, 1, "Watching...",
bgcolor=color.new(tableBgColor, 0),
text_color=color.new(color.white, 60),
text_size=size.normal)

Markov Chain [3D] | FractalystWhat exactly is a Markov Chain?
This indicator uses a Markov Chain model to analyze, quantify, and visualize the transitions between market regimes (Bull, Bear, Neutral) on your chart. It dynamically detects these regimes in real-time, calculates transition probabilities, and displays them as animated 3D spheres and arrows, giving traders intuitive insight into current and future market conditions.
How does a Markov Chain work, and how should I read this spheres-and-arrows diagram?
Think of three weather modes: Sunny, Rainy, Cloudy.
Each sphere is one mode. The loop on a sphere means “stay the same next step” (e.g., Sunny again tomorrow).
The arrows leaving a sphere show where things usually go next if they change (e.g., Sunny moving to Cloudy).
Some paths matter more than others. A more prominent loop means the current mode tends to persist. A more prominent outgoing arrow means a change to that destination is the usual next step.
Direction isn’t symmetric: moving Sunny→Cloudy can behave differently than Cloudy→Sunny.
Now relabel the spheres to markets: Bull, Bear, Neutral.
Spheres: market regimes (uptrend, downtrend, range).
Self‑loop: tendency for the current regime to continue on the next bar.
Arrows: the most common next regime if a switch happens.
How to read: Start at the sphere that matches current bar state. If the loop stands out, expect continuation. If one outgoing path stands out, that switch is the typical next step. Opposite directions can differ (Bear→Neutral doesn’t have to match Neutral→Bear).
What states and transitions are shown?
The three market states visualized are:
Bullish (Bull): Upward or strong-market regime.
Bearish (Bear): Downward or weak-market regime.
Neutral: Sideways or range-bound regime.
Bidirectional animated arrows and probability labels show how likely the market is to move from one regime to another (e.g., Bull → Bear or Neutral → Bull).
How does the regime detection system work?
You can use either built-in price returns (based on adaptive Z-score normalization) or supply three custom indicators (such as volume, oscillators, etc.).
Values are statistically normalized (Z-scored) over a configurable lookback period.
The normalized outputs are classified into Bull, Bear, or Neutral zones.
If using three indicators, their regime signals are averaged and smoothed for robustness.
How are transition probabilities calculated?
On every confirmed bar, the algorithm tracks the sequence of detected market states, then builds a rolling window of transitions.
The code maintains a transition count matrix for all regime pairs (e.g., Bull → Bear).
Transition probabilities are extracted for each possible state change using Laplace smoothing for numerical stability, and frequently updated in real-time.
What is unique about the visualization?
3D animated spheres represent each regime and change visually when active.
Animated, bidirectional arrows reveal transition probabilities and allow you to see both dominant and less likely regime flows.
Particles (moving dots) animate along the arrows, enhancing the perception of regime flow direction and speed.
All elements dynamically update with each new price bar, providing a live market map in an intuitive, engaging format.
Can I use custom indicators for regime classification?
Yes! Enable the "Custom Indicators" switch and select any three chart series as inputs. These will be normalized and combined (each with equal weight), broadening the regime classification beyond just price-based movement.
What does the “Lookback Period” control?
Lookback Period (default: 100) sets how much historical data builds the probability matrix. Shorter periods adapt faster to regime changes but may be noisier. Longer periods are more stable but slower to adapt.
How is this different from a Hidden Markov Model (HMM)?
It sets the window for both regime detection and probability calculations. Lower values make the system more reactive, but potentially noisier. Higher values smooth estimates and make the system more robust.
How is this Markov Chain different from a Hidden Markov Model (HMM)?
Markov Chain (as here): All market regimes (Bull, Bear, Neutral) are directly observable on the chart. The transition matrix is built from actual detected regimes, keeping the model simple and interpretable.
Hidden Markov Model: The actual regimes are unobservable ("hidden") and must be inferred from market output or indicator "emissions" using statistical learning algorithms. HMMs are more complex, can capture more subtle structure, but are harder to visualize and require additional machine learning steps for training.
A standard Markov Chain models transitions between observable states using a simple transition matrix, while a Hidden Markov Model assumes the true states are hidden (latent) and must be inferred from observable “emissions” like price or volume data. In practical terms, a Markov Chain is transparent and easier to implement and interpret; an HMM is more expressive but requires statistical inference to estimate hidden states from data.
Markov Chain: states are observable; you directly count or estimate transition probabilities between visible states. This makes it simpler, faster, and easier to validate and tune.
HMM: states are hidden; you only observe emissions generated by those latent states. Learning involves machine learning/statistical algorithms (commonly Baum–Welch/EM for training and Viterbi for decoding) to infer both the transition dynamics and the most likely hidden state sequence from data.
How does the indicator avoid “repainting” or look-ahead bias?
All regime changes and matrix updates happen only on confirmed (closed) bars, so no future data is leaked, ensuring reliable real-time operation.
Are there practical tuning tips?
Tune the Lookback Period for your asset/timeframe: shorter for fast markets, longer for stability.
Use custom indicators if your asset has unique regime drivers.
Watch for rapid changes in transition probabilities as early warning of a possible regime shift.
Who is this indicator for?
Quants and quantitative researchers exploring probabilistic market modeling, especially those interested in regime-switching dynamics and Markov models.
Programmers and system developers who need a probabilistic regime filter for systematic and algorithmic backtesting:
The Markov Chain indicator is ideally suited for programmatic integration via its bias output (1 = Bull, 0 = Neutral, -1 = Bear).
Although the visualization is engaging, the core output is designed for automated, rules-based workflows—not for discretionary/manual trading decisions.
Developers can connect the indicator’s output directly to their Pine Script logic (using input.source()), allowing rapid and robust backtesting of regime-based strategies.
It acts as a plug-and-play regime filter: simply plug the bias output into your entry/exit logic, and you have a scientifically robust, probabilistically-derived signal for filtering, timing, position sizing, or risk regimes.
The MC's output is intentionally "trinary" (1/0/-1), focusing on clear regime states for unambiguous decision-making in code. If you require nuanced, multi-probability or soft-label state vectors, consider expanding the indicator or stacking it with a probability-weighted logic layer in your scripting.
Because it avoids subjectivity, this approach is optimal for systematic quants, algo developers building backtested, repeatable strategies based on probabilistic regime analysis.
What's the mathematical foundation behind this?
The mathematical foundation behind this Markov Chain indicator—and probabilistic regime detection in finance—draws from two principal models: the (standard) Markov Chain and the Hidden Markov Model (HMM).
How to use this indicator programmatically?
The Markov Chain indicator automatically exports a bias value (+1 for Bullish, -1 for Bearish, 0 for Neutral) as a plot visible in the Data Window. This allows you to integrate its regime signal into your own scripts and strategies for backtesting, automation, or live trading.
Step-by-Step Integration with Pine Script (input.source)
Add the Markov Chain indicator to your chart.
This must be done first, since your custom script will "pull" the bias signal from the indicator's plot.
In your strategy, create an input using input.source()
Example:
//@version=5
strategy("MC Bias Strategy Example")
mcBias = input.source(close, "MC Bias Source")
After saving, go to your script’s settings. For the “MC Bias Source” input, select the plot/output of the Markov Chain indicator (typically its bias plot).
Use the bias in your trading logic
Example (long only on Bull, flat otherwise):
if mcBias == 1
strategy.entry("Long", strategy.long)
else
strategy.close("Long")
For more advanced workflows, combine mcBias with additional filters or trailing stops.
How does this work behind-the-scenes?
TradingView’s input.source() lets you use any plot from another indicator as a real-time, “live” data feed in your own script (source).
The selected bias signal is available to your Pine code as a variable, enabling logical decisions based on regime (trend-following, mean-reversion, etc.).
This enables powerful strategy modularity : decouple regime detection from entry/exit logic, allowing fast experimentation without rewriting core signal code.
Integrating 45+ Indicators with Your Markov Chain — How & Why
The Enhanced Custom Indicators Export script exports a massive suite of over 45 technical indicators—ranging from classic momentum (RSI, MACD, Stochastic, etc.) to trend, volume, volatility, and oscillator tools—all pre-calculated, centered/scaled, and available as plots.
// Enhanced Custom Indicators Export - 45 Technical Indicators
// Comprehensive technical analysis suite for advanced market regime detection
//@version=6
indicator('Enhanced Custom Indicators Export | Fractalyst', shorttitle='Enhanced CI Export', overlay=false, scale=scale.right, max_labels_count=500, max_lines_count=500)
// |----- Input Parameters -----| //
momentum_group = "Momentum Indicators"
trend_group = "Trend Indicators"
volume_group = "Volume Indicators"
volatility_group = "Volatility Indicators"
oscillator_group = "Oscillator Indicators"
display_group = "Display Settings"
// Common lengths
length_14 = input.int(14, "Standard Length (14)", minval=1, maxval=100, group=momentum_group)
length_20 = input.int(20, "Medium Length (20)", minval=1, maxval=200, group=trend_group)
length_50 = input.int(50, "Long Length (50)", minval=1, maxval=200, group=trend_group)
// Display options
show_table = input.bool(true, "Show Values Table", group=display_group)
table_size = input.string("Small", "Table Size", options= , group=display_group)
// |----- MOMENTUM INDICATORS (15 indicators) -----| //
// 1. RSI (Relative Strength Index)
rsi_14 = ta.rsi(close, length_14)
rsi_centered = rsi_14 - 50
// 2. Stochastic Oscillator
stoch_k = ta.stoch(close, high, low, length_14)
stoch_d = ta.sma(stoch_k, 3)
stoch_centered = stoch_k - 50
// 3. Williams %R
williams_r = ta.stoch(close, high, low, length_14) - 100
// 4. MACD (Moving Average Convergence Divergence)
= ta.macd(close, 12, 26, 9)
// 5. Momentum (Rate of Change)
momentum = ta.mom(close, length_14)
momentum_pct = (momentum / close ) * 100
// 6. Rate of Change (ROC)
roc = ta.roc(close, length_14)
// 7. Commodity Channel Index (CCI)
cci = ta.cci(close, length_20)
// 8. Money Flow Index (MFI)
mfi = ta.mfi(close, length_14)
mfi_centered = mfi - 50
// 9. Awesome Oscillator (AO)
ao = ta.sma(hl2, 5) - ta.sma(hl2, 34)
// 10. Accelerator Oscillator (AC)
ac = ao - ta.sma(ao, 5)
// 11. Chande Momentum Oscillator (CMO)
cmo = ta.cmo(close, length_14)
// 12. Detrended Price Oscillator (DPO)
dpo = close - ta.sma(close, length_20)
// 13. Price Oscillator (PPO)
ppo = ta.sma(close, 12) - ta.sma(close, 26)
ppo_pct = (ppo / ta.sma(close, 26)) * 100
// 14. TRIX
trix_ema1 = ta.ema(close, length_14)
trix_ema2 = ta.ema(trix_ema1, length_14)
trix_ema3 = ta.ema(trix_ema2, length_14)
trix = ta.roc(trix_ema3, 1) * 10000
// 15. Klinger Oscillator
klinger = ta.ema(volume * (high + low + close) / 3, 34) - ta.ema(volume * (high + low + close) / 3, 55)
// 16. Fisher Transform
fisher_hl2 = 0.5 * (hl2 - ta.lowest(hl2, 10)) / (ta.highest(hl2, 10) - ta.lowest(hl2, 10)) - 0.25
fisher = 0.5 * math.log((1 + fisher_hl2) / (1 - fisher_hl2))
// 17. Stochastic RSI
stoch_rsi = ta.stoch(rsi_14, rsi_14, rsi_14, length_14)
stoch_rsi_centered = stoch_rsi - 50
// 18. Relative Vigor Index (RVI)
rvi_num = ta.swma(close - open)
rvi_den = ta.swma(high - low)
rvi = rvi_den != 0 ? rvi_num / rvi_den : 0
// 19. Balance of Power (BOP)
bop = (close - open) / (high - low)
// |----- TREND INDICATORS (10 indicators) -----| //
// 20. Simple Moving Average Momentum
sma_20 = ta.sma(close, length_20)
sma_momentum = ((close - sma_20) / sma_20) * 100
// 21. Exponential Moving Average Momentum
ema_20 = ta.ema(close, length_20)
ema_momentum = ((close - ema_20) / ema_20) * 100
// 22. Parabolic SAR
sar = ta.sar(0.02, 0.02, 0.2)
sar_trend = close > sar ? 1 : -1
// 23. Linear Regression Slope
lr_slope = ta.linreg(close, length_20, 0) - ta.linreg(close, length_20, 1)
// 24. Moving Average Convergence (MAC)
mac = ta.sma(close, 10) - ta.sma(close, 30)
// 25. Trend Intensity Index (TII)
tii_sum = 0.0
for i = 1 to length_20
tii_sum += close > close ? 1 : 0
tii = (tii_sum / length_20) * 100
// 26. Ichimoku Cloud Components
ichimoku_tenkan = (ta.highest(high, 9) + ta.lowest(low, 9)) / 2
ichimoku_kijun = (ta.highest(high, 26) + ta.lowest(low, 26)) / 2
ichimoku_signal = ichimoku_tenkan > ichimoku_kijun ? 1 : -1
// 27. MESA Adaptive Moving Average (MAMA)
mama_alpha = 2.0 / (length_20 + 1)
mama = ta.ema(close, length_20)
mama_momentum = ((close - mama) / mama) * 100
// 28. Zero Lag Exponential Moving Average (ZLEMA)
zlema_lag = math.round((length_20 - 1) / 2)
zlema_data = close + (close - close )
zlema = ta.ema(zlema_data, length_20)
zlema_momentum = ((close - zlema) / zlema) * 100
// |----- VOLUME INDICATORS (6 indicators) -----| //
// 29. On-Balance Volume (OBV)
obv = ta.obv
// 30. Volume Rate of Change (VROC)
vroc = ta.roc(volume, length_14)
// 31. Price Volume Trend (PVT)
pvt = ta.pvt
// 32. Negative Volume Index (NVI)
nvi = 0.0
nvi := volume < volume ? nvi + ((close - close ) / close ) * nvi : nvi
// 33. Positive Volume Index (PVI)
pvi = 0.0
pvi := volume > volume ? pvi + ((close - close ) / close ) * pvi : pvi
// 34. Volume Oscillator
vol_osc = ta.sma(volume, 5) - ta.sma(volume, 10)
// 35. Ease of Movement (EOM)
eom_distance = high - low
eom_box_height = volume / 1000000
eom = eom_box_height != 0 ? eom_distance / eom_box_height : 0
eom_sma = ta.sma(eom, length_14)
// 36. Force Index
force_index = volume * (close - close )
force_index_sma = ta.sma(force_index, length_14)
// |----- VOLATILITY INDICATORS (10 indicators) -----| //
// 37. Average True Range (ATR)
atr = ta.atr(length_14)
atr_pct = (atr / close) * 100
// 38. Bollinger Bands Position
bb_basis = ta.sma(close, length_20)
bb_dev = 2.0 * ta.stdev(close, length_20)
bb_upper = bb_basis + bb_dev
bb_lower = bb_basis - bb_dev
bb_position = bb_dev != 0 ? (close - bb_basis) / bb_dev : 0
bb_width = bb_dev != 0 ? (bb_upper - bb_lower) / bb_basis * 100 : 0
// 39. Keltner Channels Position
kc_basis = ta.ema(close, length_20)
kc_range = ta.ema(ta.tr, length_20)
kc_upper = kc_basis + (2.0 * kc_range)
kc_lower = kc_basis - (2.0 * kc_range)
kc_position = kc_range != 0 ? (close - kc_basis) / kc_range : 0
// 40. Donchian Channels Position
dc_upper = ta.highest(high, length_20)
dc_lower = ta.lowest(low, length_20)
dc_basis = (dc_upper + dc_lower) / 2
dc_position = (dc_upper - dc_lower) != 0 ? (close - dc_basis) / (dc_upper - dc_lower) : 0
// 41. Standard Deviation
std_dev = ta.stdev(close, length_20)
std_dev_pct = (std_dev / close) * 100
// 42. Relative Volatility Index (RVI)
rvi_up = ta.stdev(close > close ? close : 0, length_14)
rvi_down = ta.stdev(close < close ? close : 0, length_14)
rvi_total = rvi_up + rvi_down
rvi_volatility = rvi_total != 0 ? (rvi_up / rvi_total) * 100 : 50
// 43. Historical Volatility
hv_returns = math.log(close / close )
hv = ta.stdev(hv_returns, length_20) * math.sqrt(252) * 100
// 44. Garman-Klass Volatility
gk_vol = math.log(high/low) * math.log(high/low) - (2*math.log(2)-1) * math.log(close/open) * math.log(close/open)
gk_volatility = math.sqrt(ta.sma(gk_vol, length_20)) * 100
// 45. Parkinson Volatility
park_vol = math.log(high/low) * math.log(high/low)
parkinson = math.sqrt(ta.sma(park_vol, length_20) / (4 * math.log(2))) * 100
// 46. Rogers-Satchell Volatility
rs_vol = math.log(high/close) * math.log(high/open) + math.log(low/close) * math.log(low/open)
rogers_satchell = math.sqrt(ta.sma(rs_vol, length_20)) * 100
// |----- OSCILLATOR INDICATORS (5 indicators) -----| //
// 47. Elder Ray Index
elder_bull = high - ta.ema(close, 13)
elder_bear = low - ta.ema(close, 13)
elder_power = elder_bull + elder_bear
// 48. Schaff Trend Cycle (STC)
stc_macd = ta.ema(close, 23) - ta.ema(close, 50)
stc_k = ta.stoch(stc_macd, stc_macd, stc_macd, 10)
stc_d = ta.ema(stc_k, 3)
stc = ta.stoch(stc_d, stc_d, stc_d, 10)
// 49. Coppock Curve
coppock_roc1 = ta.roc(close, 14)
coppock_roc2 = ta.roc(close, 11)
coppock = ta.wma(coppock_roc1 + coppock_roc2, 10)
// 50. Know Sure Thing (KST)
kst_roc1 = ta.roc(close, 10)
kst_roc2 = ta.roc(close, 15)
kst_roc3 = ta.roc(close, 20)
kst_roc4 = ta.roc(close, 30)
kst = ta.sma(kst_roc1, 10) + 2*ta.sma(kst_roc2, 10) + 3*ta.sma(kst_roc3, 10) + 4*ta.sma(kst_roc4, 15)
// 51. Percentage Price Oscillator (PPO)
ppo_line = ((ta.ema(close, 12) - ta.ema(close, 26)) / ta.ema(close, 26)) * 100
ppo_signal = ta.ema(ppo_line, 9)
ppo_histogram = ppo_line - ppo_signal
// |----- PLOT MAIN INDICATORS -----| //
// Plot key momentum indicators
plot(rsi_centered, title="01_RSI_Centered", color=color.purple, linewidth=1)
plot(stoch_centered, title="02_Stoch_Centered", color=color.blue, linewidth=1)
plot(williams_r, title="03_Williams_R", color=color.red, linewidth=1)
plot(macd_histogram, title="04_MACD_Histogram", color=color.orange, linewidth=1)
plot(cci, title="05_CCI", color=color.green, linewidth=1)
// Plot trend indicators
plot(sma_momentum, title="06_SMA_Momentum", color=color.navy, linewidth=1)
plot(ema_momentum, title="07_EMA_Momentum", color=color.maroon, linewidth=1)
plot(sar_trend, title="08_SAR_Trend", color=color.teal, linewidth=1)
plot(lr_slope, title="09_LR_Slope", color=color.lime, linewidth=1)
plot(mac, title="10_MAC", color=color.fuchsia, linewidth=1)
// Plot volatility indicators
plot(atr_pct, title="11_ATR_Pct", color=color.yellow, linewidth=1)
plot(bb_position, title="12_BB_Position", color=color.aqua, linewidth=1)
plot(kc_position, title="13_KC_Position", color=color.olive, linewidth=1)
plot(std_dev_pct, title="14_StdDev_Pct", color=color.silver, linewidth=1)
plot(bb_width, title="15_BB_Width", color=color.gray, linewidth=1)
// Plot volume indicators
plot(vroc, title="16_VROC", color=color.blue, linewidth=1)
plot(eom_sma, title="17_EOM", color=color.red, linewidth=1)
plot(vol_osc, title="18_Vol_Osc", color=color.green, linewidth=1)
plot(force_index_sma, title="19_Force_Index", color=color.orange, linewidth=1)
plot(obv, title="20_OBV", color=color.purple, linewidth=1)
// Plot additional oscillators
plot(ao, title="21_Awesome_Osc", color=color.navy, linewidth=1)
plot(cmo, title="22_CMO", color=color.maroon, linewidth=1)
plot(dpo, title="23_DPO", color=color.teal, linewidth=1)
plot(trix, title="24_TRIX", color=color.lime, linewidth=1)
plot(fisher, title="25_Fisher", color=color.fuchsia, linewidth=1)
// Plot more momentum indicators
plot(mfi_centered, title="26_MFI_Centered", color=color.yellow, linewidth=1)
plot(ac, title="27_AC", color=color.aqua, linewidth=1)
plot(ppo_pct, title="28_PPO_Pct", color=color.olive, linewidth=1)
plot(stoch_rsi_centered, title="29_StochRSI_Centered", color=color.silver, linewidth=1)
plot(klinger, title="30_Klinger", color=color.gray, linewidth=1)
// Plot trend continuation
plot(tii, title="31_TII", color=color.blue, linewidth=1)
plot(ichimoku_signal, title="32_Ichimoku_Signal", color=color.red, linewidth=1)
plot(mama_momentum, title="33_MAMA_Momentum", color=color.green, linewidth=1)
plot(zlema_momentum, title="34_ZLEMA_Momentum", color=color.orange, linewidth=1)
plot(bop, title="35_BOP", color=color.purple, linewidth=1)
// Plot volume continuation
plot(nvi, title="36_NVI", color=color.navy, linewidth=1)
plot(pvi, title="37_PVI", color=color.maroon, linewidth=1)
plot(momentum_pct, title="38_Momentum_Pct", color=color.teal, linewidth=1)
plot(roc, title="39_ROC", color=color.lime, linewidth=1)
plot(rvi, title="40_RVI", color=color.fuchsia, linewidth=1)
// Plot volatility continuation
plot(dc_position, title="41_DC_Position", color=color.yellow, linewidth=1)
plot(rvi_volatility, title="42_RVI_Volatility", color=color.aqua, linewidth=1)
plot(hv, title="43_Historical_Vol", color=color.olive, linewidth=1)
plot(gk_volatility, title="44_GK_Volatility", color=color.silver, linewidth=1)
plot(parkinson, title="45_Parkinson_Vol", color=color.gray, linewidth=1)
// Plot final oscillators
plot(rogers_satchell, title="46_RS_Volatility", color=color.blue, linewidth=1)
plot(elder_power, title="47_Elder_Power", color=color.red, linewidth=1)
plot(stc, title="48_STC", color=color.green, linewidth=1)
plot(coppock, title="49_Coppock", color=color.orange, linewidth=1)
plot(kst, title="50_KST", color=color.purple, linewidth=1)
// Plot final indicators
plot(ppo_histogram, title="51_PPO_Histogram", color=color.navy, linewidth=1)
plot(pvt, title="52_PVT", color=color.maroon, linewidth=1)
// |----- Reference Lines -----| //
hline(0, "Zero Line", color=color.gray, linestyle=hline.style_dashed, linewidth=1)
hline(50, "Midline", color=color.gray, linestyle=hline.style_dotted, linewidth=1)
hline(-50, "Lower Midline", color=color.gray, linestyle=hline.style_dotted, linewidth=1)
hline(25, "Upper Threshold", color=color.gray, linestyle=hline.style_dotted, linewidth=1)
hline(-25, "Lower Threshold", color=color.gray, linestyle=hline.style_dotted, linewidth=1)
// |----- Enhanced Information Table -----| //
if show_table and barstate.islast
table_position = position.top_right
table_text_size = table_size == "Tiny" ? size.tiny : table_size == "Small" ? size.small : size.normal
var table info_table = table.new(table_position, 3, 18, bgcolor=color.new(color.white, 85), border_width=1, border_color=color.gray)
// Headers
table.cell(info_table, 0, 0, 'Category', text_color=color.black, text_size=table_text_size, bgcolor=color.new(color.blue, 70))
table.cell(info_table, 1, 0, 'Indicator', text_color=color.black, text_size=table_text_size, bgcolor=color.new(color.blue, 70))
table.cell(info_table, 2, 0, 'Value', text_color=color.black, text_size=table_text_size, bgcolor=color.new(color.blue, 70))
// Key Momentum Indicators
table.cell(info_table, 0, 1, 'MOMENTUM', text_color=color.purple, text_size=table_text_size, bgcolor=color.new(color.purple, 90))
table.cell(info_table, 1, 1, 'RSI Centered', text_color=color.purple, text_size=table_text_size)
table.cell(info_table, 2, 1, str.tostring(rsi_centered, '0.00'), text_color=color.purple, text_size=table_text_size)
table.cell(info_table, 0, 2, '', text_color=color.blue, text_size=table_text_size)
table.cell(info_table, 1, 2, 'Stoch Centered', text_color=color.blue, text_size=table_text_size)
table.cell(info_table, 2, 2, str.tostring(stoch_centered, '0.00'), text_color=color.blue, text_size=table_text_size)
table.cell(info_table, 0, 3, '', text_color=color.red, text_size=table_text_size)
table.cell(info_table, 1, 3, 'Williams %R', text_color=color.red, text_size=table_text_size)
table.cell(info_table, 2, 3, str.tostring(williams_r, '0.00'), text_color=color.red, text_size=table_text_size)
table.cell(info_table, 0, 4, '', text_color=color.orange, text_size=table_text_size)
table.cell(info_table, 1, 4, 'MACD Histogram', text_color=color.orange, text_size=table_text_size)
table.cell(info_table, 2, 4, str.tostring(macd_histogram, '0.000'), text_color=color.orange, text_size=table_text_size)
table.cell(info_table, 0, 5, '', text_color=color.green, text_size=table_text_size)
table.cell(info_table, 1, 5, 'CCI', text_color=color.green, text_size=table_text_size)
table.cell(info_table, 2, 5, str.tostring(cci, '0.00'), text_color=color.green, text_size=table_text_size)
// Key Trend Indicators
table.cell(info_table, 0, 6, 'TREND', text_color=color.navy, text_size=table_text_size, bgcolor=color.new(color.navy, 90))
table.cell(info_table, 1, 6, 'SMA Momentum %', text_color=color.navy, text_size=table_text_size)
table.cell(info_table, 2, 6, str.tostring(sma_momentum, '0.00'), text_color=color.navy, text_size=table_text_size)
table.cell(info_table, 0, 7, '', text_color=color.maroon, text_size=table_text_size)
table.cell(info_table, 1, 7, 'EMA Momentum %', text_color=color.maroon, text_size=table_text_size)
table.cell(info_table, 2, 7, str.tostring(ema_momentum, '0.00'), text_color=color.maroon, text_size=table_text_size)
table.cell(info_table, 0, 8, '', text_color=color.teal, text_size=table_text_size)
table.cell(info_table, 1, 8, 'SAR Trend', text_color=color.teal, text_size=table_text_size)
table.cell(info_table, 2, 8, str.tostring(sar_trend, '0'), text_color=color.teal, text_size=table_text_size)
table.cell(info_table, 0, 9, '', text_color=color.lime, text_size=table_text_size)
table.cell(info_table, 1, 9, 'Linear Regression', text_color=color.lime, text_size=table_text_size)
table.cell(info_table, 2, 9, str.tostring(lr_slope, '0.000'), text_color=color.lime, text_size=table_text_size)
// Key Volatility Indicators
table.cell(info_table, 0, 10, 'VOLATILITY', text_color=color.yellow, text_size=table_text_size, bgcolor=color.new(color.yellow, 90))
table.cell(info_table, 1, 10, 'ATR %', text_color=color.yellow, text_size=table_text_size)
table.cell(info_table, 2, 10, str.tostring(atr_pct, '0.00'), text_color=color.yellow, text_size=table_text_size)
table.cell(info_table, 0, 11, '', text_color=color.aqua, text_size=table_text_size)
table.cell(info_table, 1, 11, 'BB Position', text_color=color.aqua, text_size=table_text_size)
table.cell(info_table, 2, 11, str.tostring(bb_position, '0.00'), text_color=color.aqua, text_size=table_text_size)
table.cell(info_table, 0, 12, '', text_color=color.olive, text_size=table_text_size)
table.cell(info_table, 1, 12, 'KC Position', text_color=color.olive, text_size=table_text_size)
table.cell(info_table, 2, 12, str.tostring(kc_position, '0.00'), text_color=color.olive, text_size=table_text_size)
// Key Volume Indicators
table.cell(info_table, 0, 13, 'VOLUME', text_color=color.blue, text_size=table_text_size, bgcolor=color.new(color.blue, 90))
table.cell(info_table, 1, 13, 'Volume ROC', text_color=color.blue, text_size=table_text_size)
table.cell(info_table, 2, 13, str.tostring(vroc, '0.00'), text_color=color.blue, text_size=table_text_size)
table.cell(info_table, 0, 14, '', text_color=color.red, text_size=table_text_size)
table.cell(info_table, 1, 14, 'EOM', text_color=color.red, text_size=table_text_size)
table.cell(info_table, 2, 14, str.tostring(eom_sma, '0.000'), text_color=color.red, text_size=table_text_size)
// Key Oscillators
table.cell(info_table, 0, 15, 'OSCILLATORS', text_color=color.purple, text_size=table_text_size, bgcolor=color.new(color.purple, 90))
table.cell(info_table, 1, 15, 'Awesome Osc', text_color=color.blue, text_size=table_text_size)
table.cell(info_table, 2, 15, str.tostring(ao, '0.000'), text_color=color.blue, text_size=table_text_size)
table.cell(info_table, 0, 16, '', text_color=color.red, text_size=table_text_size)
table.cell(info_table, 1, 16, 'Fisher Transform', text_color=color.red, text_size=table_text_size)
table.cell(info_table, 2, 16, str.tostring(fisher, '0.000'), text_color=color.red, text_size=table_text_size)
// Summary Statistics
table.cell(info_table, 0, 17, 'SUMMARY', text_color=color.black, text_size=table_text_size, bgcolor=color.new(color.gray, 70))
table.cell(info_table, 1, 17, 'Total Indicators: 52', text_color=color.black, text_size=table_text_size)
regime_color = rsi_centered > 10 ? color.green : rsi_centered < -10 ? color.red : color.gray
regime_text = rsi_centered > 10 ? "BULLISH" : rsi_centered < -10 ? "BEARISH" : "NEUTRAL"
table.cell(info_table, 2, 17, regime_text, text_color=regime_color, text_size=table_text_size)
This makes it the perfect “indicator backbone” for quantitative and systematic traders who want to prototype, combine, and test new regime detection models—especially in combination with the Markov Chain indicator.
How to use this script with the Markov Chain for research and backtesting:
Add the Enhanced Indicator Export to your chart.
Every calculated indicator is available as an individual data stream.
Connect the indicator(s) you want as custom input(s) to the Markov Chain’s “Custom Indicators” option.
In the Markov Chain indicator’s settings, turn ON the custom indicator mode.
For each of the three custom indicator inputs, select the exported plot from the Enhanced Export script—the menu lists all 45+ signals by name.
This creates a powerful, modular regime-detection engine where you can mix-and-match momentum, trend, volume, or custom combinations for advanced filtering.
Backtest regime logic directly.
Once you’ve connected your chosen indicators, the Markov Chain script performs regime detection (Bull/Neutral/Bear) based on your selected features—not just price returns.
The regime detection is robust, automatically normalized (using Z-score), and outputs bias (1, -1, 0) for plug-and-play integration.
Export the regime bias for programmatic use.
As described above, use input.source() in your Pine Script strategy or system and link the bias output.
You can now filter signals, control trade direction/size, or design pairs-trading that respect true, indicator-driven market regimes.
With this framework, you’re not limited to static or simplistic regime filters. You can rigorously define, test, and refine what “market regime” means for your strategies—using the technical features that matter most to you.
Optimize your signal generation by backtesting across a universe of meaningful indicator blends.
Enhance risk management with objective, real-time regime boundaries.
Accelerate your research: iterate quickly, swap indicator components, and see results with minimal code changes.
Automate multi-asset or pairs-trading by integrating regime context directly into strategy logic.
Add both scripts to your chart, connect your preferred features, and start investigating your best regime-based trades—entirely within the TradingView ecosystem.
References & Further Reading
Ang, A., & Bekaert, G. (2002). “Regime Switches in Interest Rates.” Journal of Business & Economic Statistics, 20(2), 163–182.
Hamilton, J. D. (1989). “A New Approach to the Economic Analysis of Nonstationary Time Series and the Business Cycle.” Econometrica, 57(2), 357–384.
Markov, A. A. (1906). "Extension of the Limit Theorems of Probability Theory to a Sum of Variables Connected in a Chain." The Notes of the Imperial Academy of Sciences of St. Petersburg.
Guidolin, M., & Timmermann, A. (2007). “Asset Allocation under Multivariate Regime Switching.” Journal of Economic Dynamics and Control, 31(11), 3503–3544.
Murphy, J. J. (1999). Technical Analysis of the Financial Markets. New York Institute of Finance.
Brock, W., Lakonishok, J., & LeBaron, B. (1992). “Simple Technical Trading Rules and the Stochastic Properties of Stock Returns.” Journal of Finance, 47(5), 1731–1764.
Zucchini, W., MacDonald, I. L., & Langrock, R. (2017). Hidden Markov Models for Time Series: An Introduction Using R (2nd ed.). Chapman and Hall/CRC.
On Quantitative Finance and Markov Models:
Lo, A. W., & Hasanhodzic, J. (2009). The Heretics of Finance: Conversations with Leading Practitioners of Technical Analysis. Bloomberg Press.
Patterson, S. (2016). The Man Who Solved the Market: How Jim Simons Launched the Quant Revolution. Penguin Press.
TradingView Pine Script Documentation: www.tradingview.com
TradingView Blog: “Use an Input From Another Indicator With Your Strategy” www.tradingview.com
GeeksforGeeks: “What is the Difference Between Markov Chains and Hidden Markov Models?” www.geeksforgeeks.org
What makes this indicator original and unique?
- On‑chart, real‑time Markov. The chain is drawn directly on your chart. You see the current regime, its tendency to stay (self‑loop), and the usual next step (arrows) as bars confirm.
- Source‑agnostic by design. The engine runs on any series you select via input.source() — price, your own oscillator, a composite score, anything you compute in the script.
- Automatic normalization + regime mapping. Different inputs live on different scales. The script standardizes your chosen source and maps it into clear regimes (e.g., Bull / Bear / Neutral) without you micromanaging thresholds each time.
- Rolling, bar‑by‑bar learning. Transition tendencies are computed from a rolling window of confirmed bars. What you see is exactly what the market did in that window.
- Fast experimentation. Switch the source, adjust the window, and the Markov view updates instantly. It’s a rapid way to test ideas and feel regime persistence/switch behavior.
Integrate your own signals (using input.source())
- In settings, choose the Source . This is powered by input.source() .
- Feed it price, an indicator you compute inside the script, or a custom composite series.
- The script will automatically normalize that series and process it through the Markov engine, mapping it to regimes and updating the on‑chart spheres/arrows in real time.
Credits:
Deep gratitude to @RicardoSantos for both the foundational Markov chain processing engine and inspiring open-source contributions, which made advanced probabilistic market modeling accessible to the TradingView community.
Special thanks to @Alien_Algorithms for the innovative and visually stunning 3D sphere logic that powers the indicator’s animated, regime-based visualization.
Disclaimer
This tool summarizes recent behavior. It is not financial advice and not a guarantee of future results.

easytableLibrary "easytable"
Create tables easily, with minimal code
▦ FEATURES ▦
█ Create tables █ JSON To Table █ Change Colors █ Array to Rows/Columns █ Pre-Styles █ Change Text Size █ Delete Rows/Columns █ Blink Cells
indentify_table_id() Identifies all tables ID number in each cell(0,0).
get_table_by_id(id_number) Get table object by ID number.
Parameters:
id_number : (int) ID number of the table to fetch.
Returns: table.
change_cells_color(table_object, cells_color, start_column, end_column, start_row, end_row) Change cells background colors.
Parameters:
table_object : (table) table object to be changed.
cells_color : (color) Cells color.
start_column : (int) Start column.
end_column : (int) End column.
start_row : (int) Start Row.
end_row : (int) End Row to change.
Returns: Void.
change_cells_text_color(table_object, text_color, start_column, end_column, start_row, end_row) Change cells text colors.
Parameters:
table_object : (table) table object to be changed.
text_color : (color) Text color.
start_column : (int) Start column.
end_column : (int) End column.
start_row : (int) Start Row.
end_row : (int) End Row.
Returns: Void.
change_all_table_text_color(table_object, text_color, table_column_size, table_row_size) Change All table text color.
Parameters:
table_object : (table) table object to be changed.
text_color : (color) Text color.
table_column_size : (int) Size of the table columns.
table_row_size : (int) Size of the table rows.
Returns: Void.
change_table_size(table_object, n_of_columns, n_of_rows, tbl_size) Change table size.
Parameters:
table_object : (table) table object to be changed.
n_of_columns : (int) Size of the table columns.
n_of_rows : (int) Size of the table rows.
tbl_size : (string) size of the table.
Returns: Void.
change_cells_text_size(text_size, start_column, end_column, start_row, end_row, table_id) Change table cells text size .
Parameters:
text_size : (string) Text size.
start_column : (int) Start column.
end_column : (int)(optional) End column.
start_row : (int)(optional) Start Row.
end_row : (int)(optional) End Row.
table_id : (int)(optional) Number of the ID of the table.
Returns: Void.
table_delete_row(table_object, table_column_size, start_row, end_row) Delete specified rows from table.
Parameters:
table_object : (table) table object to be changed.
table_column_size : (int) Table columns max size.
start_row : (int) Start row to delete.
end_row : (int)(optional) End row to delete (optional — Assumes start_row value).
Returns: Void.
table_delete_column(table_object, table_row_size, start_column, end_column) Delete specified columns from table.
Parameters:
table_object : (table) table object to be changed.
table_row_size : (int) Table rows max size.
start_column : (int) Start column to delete.
end_column : (int)(optional) End column to delete (optional — Assumes start_column value).
Returns: Void.
array_to_table_column_auto(column_to_insert, array_to_insert, table_id) Insert string array to table column without passing table object.
Parameters:
column_to_insert : (int) Column to be inserted.
array_to_insert : (string array) Start column to delete.
table_id : (int)(optional) Number of the ID of the table.
Returns: Void.
array_to_table_row_auto(row_to_insert, array_to_insert, table_id) Insert string array to table row without passing table object.
Parameters:
row_to_insert : (int) Column to be inserted.
array_to_insert : (string array) Start column to delete.
table_id : (int)(optional) Number of the ID of the table.
Returns: Void.
array_to_table_row(table_object, row_to_insert, array_to_insert) Insert string array to table row by passing table object.
Parameters:
table_object : (table) table object to be changed.
row_to_insert : (int) Row to be inserted.
array_to_insert : (string array) Start column to delete.
Returns: Void.
array_to_table_column(table_object, column_to_insert, array_to_insert) Insert string array to table column by passing table object.
Parameters:
table_object : (table) table object to be changed.
column_to_insert : (int) Column to be inserted.
array_to_insert : (string array) Start column to delete.
Returns: Void.
blink_cell(cell_column, cell_row, c_color, blink_interval_ms, table_id) Changes cell color at set intervals (blink).
Parameters:
cell_column : (int) Cell column position.
cell_row : (int) Cell row position.
c_color : (color) Color to blink.
blink_interval_ms : (int)(opt) Interval in milliseconds.
table_id : (int)(opt) Table ID number.
change_table_style(table_object, number_of_columns, number_of_rows, color) Changes table pre-style by selecting a pre-style number.
Parameters:
table_object : (table) table object to be changed.
number_of_columns : (int) Table column size.
number_of_rows : (int) Table row size.
color : 1 (color) Color of .
Returns: Void.
create_table_clean(n_of_columns, n_of_rows, position) Create a simple(blank) table without any styling.
Parameters:
n_of_columns : (int) Numbers of columns in the table.
n_of_rows : (int) Number of rows in the table.
position : (string) table position.
Returns: table object.
create_table_with_style(n_of_columns, n_of_rows, style_number, position) Create table with a pre-set style.
Parameters:
n_of_columns : (int) Numbers of columns in the table.
n_of_rows : (int) Number of rows in the table.
style_number : (int) Style number.
position : (string) table position.
Returns: table object.
json_to_table(raw_json) Create table based on input raw json string.
Parameters:
raw_json : (int) Raw json string.
Returns: table object.
json_example() Example function that display a table based on a json
example_create_table()
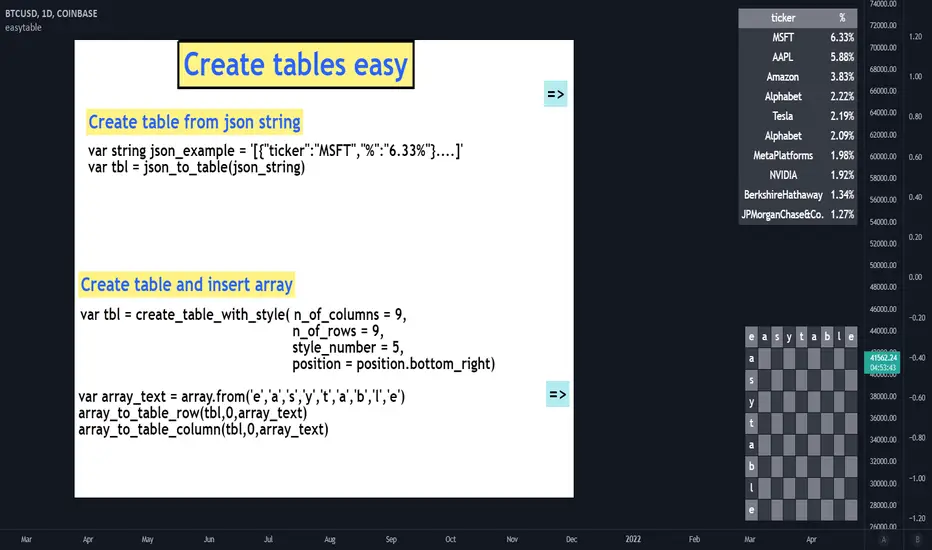
visualizationLibrary "visualization"
method tagLine(message, priceLevel, showCondition, labelPosition, labelSize, offsetX, textColor, bgColor, lineWidth, lineStyle)
Creates a textLabel with line at specified price level
Namespace types: series string, simple string, input string, const string
Parameters:
message (string) : Text to display in the textLabel. If starts with '$', price included. Empty = no textLabel
priceLevel (float) : Price level for textLabel and line positioning
showCondition (bool) : Condition to display the textLabel and line
labelPosition (string) : Label position ("above", "below")
labelSize (string) : Label size
offsetX (int) : X-axis offset for textLabel and line
textColor (color) : Text color
bgColor (color) : Background color
lineWidth (int) : Line width
lineStyle (string) : Line style
Returns: void
textLabel(message, showCondition, position, textColor)
Creates dynamic labels with optional arrows
Parameters:
message (string) : Message to show (prefix with "!" to hide arrow)
showCondition (bool) : Display condition
position (string) : Label position ("above", "below")
textColor (color) : Text color
Returns: void
box(showCondition, topValue, bottomValue, barsBack, borderColor, bgColor)
Creates a box around price range
Parameters:
showCondition (bool) : Condition to draw the box
topValue (float) : Optional custom top value
bottomValue (float) : Optional custom bottom value
barsBack (int) : Number of bars to look back
borderColor (color) : Box border color
bgColor (color) : Box background color
Returns: box Box object

ST -Dashboard Volume MTF , [Sese04]User Guide: ST - Dashboard Volume MTF
Introduction
This script displays a multi-timeframe (MTF) volume dashboard, tracking buy and sell volumes and the moving averages of volume. It is designed for traders using ICT (Inner Circle Trader) and SMC (Smart Money Concepts) to quickly visualize market dynamics across multiple timeframes.
Settings and Features
📌 User Inputs
Customizable settings allow traders to adjust the dashboard display and volume moving averages.
Volume Display per Timeframe
show_vol_1m: Show volume for 1-minute chart.
show_vol_5m: Show volume for 5-minute chart.
show_vol_15m: Show volume for 15-minute chart.
show_vol_1h: Show volume for 1-hour chart.
show_vol_4h: Show volume for 4-hour chart.
show_vol_1d: Show volume for 1-day chart.
Volume Moving Average Settings
ma_length_short: Length of the short-term moving average (default 5 periods).
ma_length_long: Length of the long-term moving average (default 14 periods).
Dashboard Customization
dashboard_position: Dashboard position (Bottom Right, Bottom Left, Top Right, Top Left).
text_color: Text color for the dashboard.
text_size: Text size (small, normal, large).
How the Script Works
🔹 1. Calculating Buy and Sell Volume
The calculate_buy_sell function separates buy and sell volume based on the candle's open and close price:
If the closing price is higher than the opening price → Buy volume 📈.
If the closing price is lower or equal to the opening price → Sell volume 📉.
🔹 2. Retrieving Volume Data Across Multiple Timeframes
The function get_volumes collects buy and sell volume data for different timeframes using request.security().
The available timeframes are: 1m, 5m, 15m, 1h, 4h, and 1d.
🔹 3. Calculating Volume Moving Averages
The script uses ta.sma() to compute moving averages for volume trends:
ma_vol_short: Short-term moving average (e.g., 5 periods).
ma_vol_long: Long-term moving average (e.g., 14 periods).
🔹 4. Creating and Displaying the Dashboard
A table (table.new()) is generated at the last bar (barstate.islast) to display the volume data:
A title “📊 Volume Dashboard (Buy vs Sell)” in purple.
Column headers:
TIMEFRAME (e.g., 1M, 5M, 15M, 1H, 4H, 1D).
BUY VOLUME (dark blue).
SELL VOLUME (dark red).
Buy and Sell Volume values are displayed in their respective cells for easy reading.
How to Use This Script on TradingView?
Adding the Script
Open TradingView.
Go to Pine Editor and paste the script.
Click "Add to Chart".
Configuring the Settings
Open the indicator settings.
Enable/disable the desired timeframes.
Adjust the moving average lengths if necessary.
Interpreting the Data
Increasing buy volume across timeframes may indicate bullish momentum.
Rising sell volume suggests a bearish reversal.
Crossovers of volume moving averages can help detect market shifts.
Conclusion
This script is a powerful tool for analyzing volume dynamics across multiple timeframes. It provides a quick overview of the balance between buyers and sellers, essential for ICT scalping and liquidity-based trading.
🚀 Pro Tip: Combine this dashboard with other SMC indicators (engulfing candles, pivot points) to refine your trading decisions.

Smart Money Concepts by WeloTradesThe "Smart Money Concepts by WeloTrades" indicator is designed to offer traders a comprehensive tool that integrates multiple advanced features to aid in market analysis. By combining order blocks, liquidity levels, fair value gaps, trendlines, and market structure analysis, the indicator provides a holistic approach to understanding market dynamics and making informed trading decisions.
Components and Their Integration:
Order Blocks and Breaker Blocks Detection
Functionality: Order blocks represent areas where significant buying or selling occurred, creating potential support or resistance zones. Breaker blocks signal potential reversals.
Integration: By detecting and visualizing these blocks, the indicator helps traders identify key levels where price might react, aiding in entry and exit decisions. The customizable settings allow traders to adjust the visibility and parameters to suit their specific trading strategy.
Liquidity Levels Analysis
Functionality: Liquidity levels indicate zones where significant price movements can occur due to the presence of large orders. These are areas where smart money might be executing trades.
Integration: By tracking these high-probability liquidity areas, traders can anticipate potential price movements. Customizable display limits and mitigation strategies ensure that the information is tailored to the trader’s needs, providing precise and actionable insights.
Fair Value Gaps (FVG)
Functionality: Fair value gaps highlight areas where there is an imbalance between buyers and sellers. These gaps often represent potential trading opportunities.
Integration: The ability to identify and analyze FVGs helps traders spot potential entries based on market inefficiencies. The touch and break detection functionalities provide further refinement, enhancing the precision of trading signals.
Trendlines
Functionality: Trendlines help in identifying the direction of the market and potential reversal points. The additional trendline adds a layer of confirmation for breaks or retests.
Integration: Automatically drawn trendlines assist traders in visualizing market trends and making decisions about potential entries and exits. The additional trendline for stronger confirmation reduces the risk of false signals, providing more reliable trading opportunities.
Market Structure Analysis
Functionality: Understanding market structure is crucial for identifying key support and resistance levels and overall market dynamics. This component displays internal, external, and composite market structures.
Integration: By automatically highlighting shifts in market structure, the indicator helps traders recognize important levels and potential changes in market direction. This analysis is critical for strategic planning and execution in trading.
Customizable Alerts
Functionality: Alerts ensure that traders do not miss significant market events, such as the formation or breach of order blocks, liquidity levels, and trendline interactions.
Integration: Customizable alerts enhance the user experience by providing timely notifications of key events. This feature ensures that traders can act quickly and efficiently, leveraging the insights provided by the indicator.
Interactive Visualization
Functionality: Customizable visual aspects of the indicator allow traders to tailor the display to their preferences and trading style.
Integration: This feature enhances user engagement and usability, making it easier for traders to interpret the data and make informed decisions. Personalization options like colors, styles, and display formats improve the overall effectiveness of the indicator.
How Components Work Together
Comprehensive Market Analysis
Each component of the indicator addresses a different aspect of market analysis. Order blocks and liquidity levels highlight potential support and resistance zones, while fair value gaps and trendlines provide additional context for potential entries and exits. Market structure analysis ties everything together by offering a broad view of market dynamics.
Synergistic Insights
The integration of multiple features allows for cross-validation of trading signals. For instance, an order block coinciding with a high-probability liquidity level and a fair value gap can provide a stronger signal than any of these features alone. This synergy enhances the reliability of the insights and trading signals generated by the indicator.
Enhanced Decision Making
By combining these advanced features into a single tool, traders are equipped with a powerful resource for making informed decisions. The customizable alerts and interactive visualization further support this by ensuring that traders can act quickly on the insights provided.
Order Blocks ( OB) & Breaker Blocks (BB) Visuals:
📝 OB Input Settings
📊 Timeframe #1
TF #1🕑: Enable or disable Timeframe 1.
What it is: A boolean input to toggle the use of the first timeframe.
What it does: Enables or disables Timeframe 1 for the OB settings.
How to use it: Check or uncheck the box to enable or disable.
📊 Timeframe 1 Selection
Timeframe #1🕑: Select the timeframe for Timeframe 1.
What it is: A dropdown to select the desired timeframe.
What it does: Sets the timeframe for Timeframe 1.
How to use it: Choose a timeframe from the dropdown list.
📊 Timeframe #2
TF #2🕑: Enable or disable Timeframe 2.
What it is: A boolean input to toggle the use of the second timeframe.
What it does: Enables or disables Timeframe 2 for the OB settings.
How to use it: Check or uncheck the box to enable or disable.
📊 Timeframe 2 Selection
Timeframe #2🕑: Select the timeframe for Timeframe 2.
What it is: A dropdown to select the desired timeframe.
What it does: Sets the timeframe for Timeframe 2.
How to use it: Choose a timeframe from the dropdown list.
Additional Info: Higher TF Chart & Lower TF Setting / Lower TF Chart & Higher TF Setting.
📏 Show OBs
OB (Length)📏: Toggle the display of Order Blocks.
What it is: A boolean input to enable or disable the display of Order Blocks.
What it does: Shows or hides Order Blocks based on the selected swing length.
How to use it: Check or uncheck the box to enable or disable.
📏 Swing Length Option
Swing Length Option: Select the swing length option.
What it is: A dropdown to choose between SHORT, MID, LONG, or CUSTOM.
What it does: Sets the length of swings for Order Blocks.
How to use it: Choose an option from the dropdown.
Additional Info: Default lengths are SHORT=10, MID=28, LONG=50.
🔧 Custom Swing Length
🔧custom: Specify a custom swing length.
What it is: An integer input for setting a custom swing length.
What it does: Overrides the default swing lengths if set to CUSTOM.
How to use it: Enter a custom integer value (only shown when CUSTOM is selected).
📛 Show BBs
BB (Method)📛: Toggle the display of Breaker Blocks.
What it is: A boolean input to enable or disable the display of Breaker Blocks.
What it does: Shows or hides Breaker Blocks.
How to use it: Check or uncheck the box to enable or disable.
📛 OB End Method
OB End Method: Select the method for determining the end of a Breaker Block.
What it is: A dropdown to choose between Wick and Close.
What it does: Sets the criteria for when a Breaker Block is considered mitigated.
How to use it: Choose an option from the dropdown.
Additional Info: Wicks: OB is mitigated when the price wicks through the OB Level. Close: OB is mitigated when the closing price is within the OB Level.
🔍 Max Bullish Zones
🔍Max Bullish: Set the maximum number of Bullish Order Blocks to display.
What it is: A dropdown to select the maximum number of Bullish Order Blocks.
What it does: Limits the number of Bullish Order Blocks shown on the chart.
How to use it: Choose a value from the dropdown (1-10).
🔍 Max Bearish Zones
🔍Max Bearish: Set the maximum number of Bearish Order Blocks to display.
What it is: A dropdown to select the maximum number of Bearish Order Blocks.
What it does: Limits the number of Bearish Order Blocks shown on the chart.
How to use it: Choose a value from the dropdown (1-10).
🟩 Bullish OB Color
Bullish OB Color: Set the color for Bullish Order Blocks.
What it is: A color picker to set the color of Bullish Order Blocks.
What it does: Changes the color of Bullish Order Blocks on the chart.
How to use it: Select a color from the color picker.
🟥 Bearish OB Color
Bearish OB Color: Set the color for Bearish Order Blocks.
What it is: A color picker to set the color of Bearish Order Blocks.
What it does: Changes the color of Bearish Order Blocks on the chart.
How to use it: Select a color from the color picker.
🔧 OB & BB Range
↔ OB & BB Range: Select the range option for OB and BB.
What it is: A dropdown to choose between RANGE and CUSTOM.
What it does: Sets how far the OB or BB should extend.
How to use it: Choose an option from the dropdown.
Additional Info: RANGE = Current price, CUSTOM = Adjustable Range.
🔧 Custom OB & BB Range
🔧Custom: Specify a custom range for OB and BB.
What it is: An integer input for setting a custom range.
What it does: Defines how far the OB or BB should go, based on a custom value.
How to use it: Enter a custom integer value (range: 1000-500000).
💬 Text Options
💬Text Options: Set text size and color for OB and BB.
What it is: A dropdown to select text size and a color picker to choose text color.
What it does: Changes the size and color of the text displayed for OB and BB.
How to use it: Select a size from the dropdown and a color from the color picker.
💬 Show Timeframe OB
Text: Toggle to display the timeframe of OB.
What it is: A boolean input to show or hide the timeframe text for OB.
What it does: Displays the timeframe information for Order Blocks on the chart.
How to use it: Check or uncheck the box to enable or disable.
💬 Show Volume
Volume: Toggle to display the volume of OB.
What it is: A boolean input to show or hide the volume information for Order Blocks.
What it does: Displays the volume information for Order Blocks on the chart.
How to use it: Check or uncheck the box to enable or disable.
Additional Info:
What it represents: The volume displayed represents the total trading volume that occurred during the formation of the Order Block. This can indicate the level of participation or interest in that price level.
How it's calculated: The volume is the sum of all traded volumes within the candles that form the Order Block.
What it means: Higher volume at an Order Block level may suggest stronger support or resistance. It shows the amount of trading activity and can be an indicator of the potential strength or validity of the Order Block.
Why it's shown: To give traders an idea of the market participation and to help assess the strength of the Order Block.
💬 Show Percentage
%: Toggle to display the percentage of OB.
What it is: A boolean input to show or hide the percentage information for Order Blocks.
What it does: Displays the percentage information for Order Blocks on the chart.
How to use it: Check or uncheck the box to enable or disable.
Additional Info:
What it represents: The percentage displayed usually represents the proportion of price movement relative to the Order Block.
How it's calculated: This can be the percentage move from the start to the end of the Order Block or the retracement level that price has reached relative to the Order Block's range.
What it means: It helps traders understand the extent of price movement within the Order Block and can indicate the significance of the price level.
Why it's shown: To provide a clearer understanding of the price dynamics and the importance of the Order Block within the overall price movement.
Additional Information
Volume Example: If an Order Block forms over three candles with volumes of 100, 150, and 200, the total volume displayed for that Order Block would be 450.
Percentage Example: If the price moves from 100 to 110 within an Order Block, and the total range of the Order Block is from 100 to 120, the percentage shown might be 50% (since the price has moved halfway through the Order Block's range).
Liquidity Levels visuals:
📊 Liquidity Levels Input Settings
📊 Current Timeframe
TF #1🕑: Enable or disable the current timeframe.
What it is: A boolean input to toggle the use of the current timeframe.
What it does: Enables or disables the display of liquidity levels for the current timeframe.
How to use it: Check or uncheck the box to enable or disable.
📊 Higher Timeframe
Higher Timeframe: Select the higher timeframe for liquidity levels.
What it is: A dropdown to select the desired higher timeframe.
What it does: Sets the higher timeframe for liquidity levels.
How to use it: Choose a timeframe from the dropdown list.
📏 Liquidity Length Option
📏Liquidity Length: Select the length for liquidity levels.
What it is: A dropdown to choose between SHORT, MID, LONG, or CUSTOM.
What it does: Sets the length of swings for liquidity levels.
How to use it: Choose an option from the dropdown.
Additional Info: Default lengths are SHORT=10, MID=28, LONG=50.
🔧 Custom Liquidity Length
🔧custom: Specify a custom length for liquidity levels.
What it is: An integer input for setting a custom swing length.
What it does: Overrides the default liquidity lengths if set to CUSTOM.
How to use it: Enter a custom integer value (only shown when CUSTOM is selected).
📛 Mitigation Method
📛Mitigation (Method): Select the method for determining the mitigation of liquidity levels.
What it is: A dropdown to choose between Close and Wick.
What it does: Sets the criteria for when a liquidity level is considered mitigated.
How to use it: Choose an option from the dropdown.
Additional Info:
Wick: Level is mitigated when the price wicks through the level.
Close: Level is mitigated when the closing price is within the level.
📛 Display Mitigated Levels
-: Select to display or hide mitigated levels.
What it is: A dropdown to choose between Remove and Show.
What it does: Displays or hides mitigated liquidity levels.
How to use it: Choose an option from the dropdown.
Additional Info:
Remove: Hide mitigated levels.
Show: Display mitigated levels.
🔍 Max Buy Side Liquidity
🔍Max Buy Side Liquidity: Set the maximum number of Buy Side Liquidity Levels to display.
What it is: An integer input to set the maximum number of Buy Side Liquidity Levels.
What it does: Limits the number of Buy Side Liquidity Levels shown on the chart.
How to use it: Enter a value between 0 and 50.
🟦 Buy Side Liquidity Color
Buy Side Liquidity Color: Set the color for Buy Side Liquidity Levels.
What it is: A color picker to set the color of Buy Side Liquidity Levels.
What it does: Changes the color of Buy Side Liquidity Levels on the chart.
How to use it: Select a color from the color picker.
Additional Info:
Tooltip: Set the maximum number of Buy Side Liquidity Levels to display. Default: 5, Min: 1, Max: 50.
If liquidity levels are not displayed as expected, try increasing the max count.
🔍 Max Sell Side Liquidity
🔍Max Sell Side Liquidity: Set the maximum number of Sell Side Liquidity Levels to display.
What it is: An integer input to set the maximum number of Sell Side Liquidity Levels.
What it does: Limits the number of Sell Side Liquidity Levels shown on the chart.
How to use it: Enter a value between 0 and 50.
🟥 Sell Side Liquidity Color
Sell Side Liquidity Color: Set the color for Sell Side Liquidity Levels.
What it is: A color picker to set the color of Sell Side Liquidity Levels.
What it does: Changes the color of Sell Side Liquidity Levels on the chart.
How to use it: Select a color from the color picker.
Additional Info:
Tooltip: Set the maximum number of Sell Side Liquidity Levels to display. Default: 5, Min: 1, Max: 50.
If liquidity levels are not displayed as expected, try increasing the max count.
✂ Box Style (Height)
✂ Box Style (↕): Set the box height style for liquidity levels.
What it is: A float input to set the height of the boxes.
What it does: Adjusts the height of the boxes displaying liquidity levels.
How to use it: Enter a value between -50 and 50.
Additional Info: Default value is -5.
📏 Box Length
b: Set the box length of liquidity levels.
What it is: An integer input to set the length of the boxes.
What it does: Adjusts the length of the boxes displaying liquidity levels.
How to use it: Enter a value between 0 and 500.
Additional Info: Default value is 20.
⏭ Extend Liquidity Levels
Extend ⏭: Toggle to extend liquidity levels beyond the current range.
What it is: A boolean input to enable or disable the extension of liquidity levels.
What it does: Extends liquidity levels beyond their default range.
How to use it: Check or uncheck the box to enable or disable.
Additional Info: Extend liquidity levels beyond the current range.
💬 Text Options
💬 Text Options: Set text size and color for liquidity levels.
What it is: A dropdown to select text size and a color picker to choose text color.
What it does: Changes the size and color of the text displayed for liquidity levels.
How to use it: Select a size from the dropdown and a color from the color picker.
💬 Show Text
Text: Toggle to display text for liquidity levels.
What it is: A boolean input to show or hide the text for liquidity levels.
What it does: Displays the text information for liquidity levels on the chart.
How to use it: Check or uncheck the box to enable or disable.
💬 Show Volume
Volume: Toggle to display the volume of liquidity levels.
What it is: A boolean input to show or hide the volume information for liquidity levels.
What it does: Displays the volume information for liquidity levels on the chart.
How to use it: Check or uncheck the box to enable or disable.
Additional Info:
What it represents: The volume displayed represents the total trading volume that occurred during the formation of the liquidity level. This can indicate the level of participation or interest in that price level.
How it's calculated: The volume is the sum of all traded volumes within the candles that form the liquidity level.
What it means: Higher volume at a liquidity level may suggest stronger support or resistance. It shows the amount of trading activity and can be an indicator of the potential strength or validity of the liquidity level.
Why it's shown: To give traders an idea of the market participation and to help assess the strength of the liquidity level.
💬 Show Percentage
%: Toggle to display the percentage of liquidity levels.
What it is: A boolean input to show or hide the percentage information for liquidity levels.
What it does: Displays the percentage information for liquidity levels on the chart.
How to use it: Check or uncheck the box to enable or disable.
Additional Info:
What it represents: The percentage displayed usually represents the proportion of price movement relative to the liquidity level.
How it's calculated: This can be the percentage move from the start to the end of the liquidity level or the retracement level that price has reached relative to the liquidity level's range.
What it means: It helps traders understand the extent of price movement within the liquidity level and can indicate the significance of the price level.
Why it's shown: To provide a clearer understanding of the price dynamics and the importance of the liquidity level within the overall price movement.
Fair Value Gaps visuals:
📊 Fair Value Gaps Input Settings
📊 Show FVG
TF #1🕑: Enable or disable Fair Value Gaps for Timeframe 1.
What it is: A boolean input to toggle the display of Fair Value Gaps.
What it does: Shows or hides Fair Value Gaps on the chart.
How to use it: Check or uncheck the box to enable or disable.
📊 Select Timeframe
Timeframe: Select the timeframe for Fair Value Gaps.
What it is: A dropdown to select the desired timeframe.
What it does: Sets the timeframe for Fair Value Gaps.
How to use it: Choose a timeframe from the dropdown list.
Additional Info: Higher TF Chart & Lower TF Setting or Lower TF Chart & Higher TF Setting.
📛 FVG Break Method
📛FVG Break (Method): Select the method for determining when an FVG is mitigated.
What it is: A dropdown to choose between Touch, Wicks, Close, or Average.
What it does: Sets the criteria for when a Fair Value Gap is considered mitigated.
How to use it: Choose an option from the dropdown.
Additional Info:
Touch: FVG is mitigated when the price touches the gap.
Wicks: FVG is mitigated when the price wicks through the gap.
Close: FVG is mitigated when the closing price is within the gap.
Average: FVG is mitigated when the average price (average of high and low) is within the gap.
📛 Show Mitigated FVG
show: Toggle to display mitigated FVGs.
What it is: A boolean input to show or hide mitigated Fair Value Gaps.
What it does: Displays or hides mitigated Fair Value Gaps.
How to use it: Check or uncheck the box to enable or disable.
📛 Fill FVG
Fill: Toggle to fill Fair Value Gaps.
What it is: A boolean input to fill the Fair Value Gaps with color.
What it does: Adds a color fill to the Fair Value Gaps.
How to use it: Check or uncheck the box to enable or disable.
📛 Shade FVG
Shade: Toggle to shade Fair Value Gaps.
What it is: A boolean input to shade the Fair Value Gaps.
What it does: Adds a shade effect to the Fair Value Gaps.
How to use it: Check or uncheck the box to enable or disable.
Additional Info: Select the method to break FVGs and toggle the visibility of FVG Breaks (fill FVG and/or shade FVG).
🔍 Max Bullish FVG
🔍Max Bullish FVG: Set the maximum number of Bullish Fair Value Gaps to display.
What it is: An integer input to set the maximum number of Bullish Fair Value Gaps.
What it does: Limits the number of Bullish Fair Value Gaps shown on the chart.
How to use it: Enter a value between 0 and 50.
🔍 Max Bearish FVG
🔍Max Bearish FVG: Set the maximum number of Bearish Fair Value Gaps to display.
What it is: An integer input to set the maximum number of Bearish Fair Value Gaps.
What it does: Limits the number of Bearish Fair Value Gaps shown on the chart.
How to use it: Enter a value between 0 and 50.
🟥 Bearish FVG Color
Bearish FVG Color: Set the color for Bearish Fair Value Gaps.
What it is: A color picker to set the color of Bearish Fair Value Gaps.
What it does: Changes the color of Bearish Fair Value Gaps on the chart.
How to use it: Select a color from the color picker.
Additional Info:
Tooltip: Set the maximum number of Bearish Fair Value Gaps to display. Default: 5, Min: 1, Max: 50.
If Fair Value Gaps are not displayed as expected, try increasing the max count.
🟦 Bullish FVG Color
Bullish FVG Color: Set the color for Bullish Fair Value Gaps.
What it is: A color picker to set the color of Bullish Fair Value Gaps.
What it does: Changes the color of Bullish Fair Value Gaps on the chart.
How to use it: Select a color from the color picker.
Additional Info:
Tooltip: Set the maximum number of Bullish Fair Value Gaps to display. Default: 5, Min: 1, Max: 50.
If Fair Value Gaps are not displayed as expected, try increasing the max count.
📏 FVG Range
↔ FVG Range: Set the range for Fair Value Gaps.
What it is: An integer input to set the range of the Fair Value Gaps.
What it does: Adjusts the range of the Fair Value Gaps displayed.
How to use it: Enter a value between 0 and 100.
Additional Info: Adjustable length only works when both RANGE & EXTEND display OFF. Range=current price, Extend=Full Range.
⏭ Extend FVG
Extend⏭: Toggle to extend Fair Value Gaps beyond the current range.
What it is: A boolean input to enable or disable the extension of Fair Value Gaps.
What it does: Extends Fair Value Gaps beyond their default range.
How to use it: Check or uncheck the box to enable or disable.
⏯ FVG Range
Range⏯: Toggle the range of Fair Value Gaps.
What it is: A boolean input to enable or disable the range display for Fair Value Gaps.
What it does: Sets the range of Fair Value Gaps displayed.
How to use it: Check or uncheck the box to enable or disable.
↕ Max Width
↕ Max Width: Set the maximum width of Fair Value Gaps.
What it is: A float input to set the maximum width of Fair Value Gaps.
What it does: Limits the width of Fair Value Gaps as a percentage of the price range.
How to use it: Enter a value between 0 and 5.0.
Additional Info: FVGs wider than this value will be ignored.
♻ Filter FVG
Filter FVG ♻: Toggle to filter out small Fair Value Gaps.
What it is: A boolean input to filter out small Fair Value Gaps.
What it does: Ignores Fair Value Gaps smaller than the specified max width.
How to use it: Check or uncheck the box to enable or disable.
➖ Mid Line Style
➖Mid Line Style: Select the style of the mid line for Fair Value Gaps.
What it is: A dropdown to choose between Solid, Dashed, or Dotted.
What it does: Sets the style of the mid line within Fair Value Gaps.
How to use it: Choose an option from the dropdown.
🎨 Mid Line Color
Mid Line Color: Set the color for the mid line within Fair Value Gaps.
What it is: A color picker to set the color of the mid line.
What it does: Changes the color of the mid line within Fair Value Gaps.
How to use it: Select a color from the color picker.
Additional Information
Mitigation Methods: Each method (Touch, Wicks, Close, Average) provides different criteria for when a Fair Value Gap is considered mitigated, helping traders to understand the dynamics of price movements within gaps.
Volume and Percentage: Displaying volume and percentage information for Fair Value Gaps helps traders gauge the strength and significance of these gaps in relation to trading activity and price movements.
Trendlines visuals:
📊 Trendlines Input Settings
📊 Show Trendlines
Trendlines & Trendlines Difference(%) ↕: Enable or disable trendlines and set the percentage difference from the first trendline.
What it is: A boolean input to toggle the display of trendlines.
What it does: Shows or hides trendlines on the chart and allows setting a percentage difference from the first trendline.
How to use it: Check or uncheck the box to enable or disable.
Additional Info: The percentage difference determines the distance of the second trendline from the first one.
📏 Trendline Length Option
📏Trendline Length: Select the length for trendlines.
What it is: A dropdown to choose between SHORT, MID, LONG, or CUSTOM.
What it does: Sets the length of trendlines.
How to use it: Choose an option from the dropdown.
Additional Info: Default lengths are SHORT=50, MID=100, LONG=200.
🔧 Custom Trendline Length
🔧custom: Specify a custom length for trendlines.
What it is: An integer input for setting a custom trendline length.
What it does: Overrides the default trendline lengths if set to CUSTOM.
How to use it: Enter a custom integer value (only shown when CUSTOM is selected).
🔍 Max Bearish Trendlines
🔍Max Trendlines Bearish: Set the maximum number of bearish trendlines to display.
What it is: A dropdown to select the maximum number of bearish trendlines.
What it does: Limits the number of bearish trendlines shown on the chart.
How to use it: Choose a value from the dropdown (2-20).
🟩 Bearish Trendline Color
Bearish Trendline Color: Set the color for bearish trendlines.
What it is: A color picker to set the color of bearish trendlines.
What it does: Changes the color of bearish trendlines on the chart.
How to use it: Select a color from the color picker.
Additional Info: Adjust to control how many bearish trendlines are displayed.
🔍 Max Bullish Trendlines
🔍Max Trendlines Bullish: Set the maximum number of bullish trendlines to display.
What it is: A dropdown to select the maximum number of bullish trendlines.
What it does: Limits the number of bullish trendlines shown on the chart.
How to use it: Choose a value from the dropdown (2-20).
🟥 Bullish Trendline Color
Bullish Trendline Color: Set the color for bullish trendlines.
What it is: A color picker to set the color of bullish trendlines.
What it does: Changes the color of bullish trendlines on the chart.
How to use it: Select a color from the color picker.
Additional Info: Adjust to control how many bullish trendlines are displayed.
📐 Degrees Text
📐Degrees ° (💬 Size): Enable or disable degrees text and set its size and color.
What it is: A boolean input to show or hide the degrees text for trendlines.
What it does: Displays the degrees text for trendlines.
How to use it: Check or uncheck the box to enable or disable.
📏 Text Size for Degrees
Text Size: Set the text size for degrees on trendlines.
What it is: A dropdown to select the size of the degrees text.
What it does: Changes the size of the degrees text displayed for trendlines.
How to use it: Choose a size from the dropdown (XS, S, M, L, XL).
🎨 Degrees Text Color
Degrees Text Color: Set the color for the degrees text on trendlines.
What it is: A color picker to set the color of the degrees text.
What it does: Changes the color of the degrees text on the chart.
How to use it: Select a color from the color picker.
♻ Filter Degrees
♻ Filter Degrees °: Enable or disable angle filtering and set the angle range.
What it is: A boolean input to filter trendlines by their angle.
What it does: Shows only trendlines within a specified angle range.
How to use it: Check or uncheck the box to enable or disable.
Additional Info: Angles outside this range will be filtered out.
🔢 Angle Range
Angle Range: Set the angle range for filtering trendlines.
What it is: Two float inputs to set the minimum and maximum angle for trendlines.
What it does: Defines the range of angles for which trendlines will be shown.
How to use it: Enter values for the minimum and maximum angles.
➖ Line Style
➖Style #1 & #2: Select the style of the primary and secondary trendlines.
What it is: Two dropdowns to choose between Solid, Dashed, or Dotted for the trendlines.
What it does: Sets the style of the primary and secondary trendlines.
How to use it: Choose a style from each dropdown.
📏 Line Thickness
: Set the thickness for the trendlines.
What it is: An integer input to set the thickness of the trendlines.
What it does: Adjusts the thickness of the trendlines displayed on the chart.
How to use it: Enter a value between 1 and 5.
Additional Information
Trendline Percentage Difference: Setting a percentage difference helps in analyzing the relative position and angle of trendlines.
Filtering by Angle: This feature allows focusing on trendlines within a specific angle range, enhancing the clarity of trend analysis.
BOS & CHOCH Market Structure visuals:
📊 BOS & CHOCH Market Structure Input Settings
📏 Market Structure Length Option
📏Market Structure: Select the market structure length option.
What it is: A dropdown to choose between INTERNAL, EXTERNAL, ALL, CUSTOM, or NONE.
What it does: Sets the type of market structure to be displayed.
How to use it: Choose an option from the dropdown.
Additional Info:
INTERNAL: Only internal structure.
EXTERNAL: Only external structure.
ALL: Both internal and external structures.
CUSTOM: Custom lengths.
NONE: No structure.
🔧 Custom Internal Length
🔧Custom Internal: Specify a custom length for internal market structure.
What it is: An integer input for setting a custom internal length.
What it does: Defines the length of internal market structures if CUSTOM is selected.
How to use it: Enter a custom integer value (only shown when CUSTOM is selected).
💬 Internal Label Size
💬Internal Label Size: Set the label size for internal market structures.
What it is: A dropdown to select the size of the labels.
What it does: Changes the size of the labels for internal market structures.
How to use it: Choose a size from the dropdown (XS, S, M, L, XL).
🟩 Internal Bullish Color
Internal Bullish Color: Set the color for bullish internal market structures.
What it is: A color picker to set the color of bullish internal market structures.
What it does: Changes the color of bullish internal market structures on the chart.
How to use it: Select a color from the color picker.
🟥 Internal Bearish Color
Internal Bearish Color: Set the color for bearish internal market structures.
What it is: A color picker to set the color of bearish internal market structures.
What it does: Changes the color of bearish internal market structures on the chart.
How to use it: Select a color from the color picker.
🔧 Custom External Length
🔧Custom External: Specify a custom length for external market structure.
What it is: An integer input for setting a custom external length.
What it does: Defines the length of external market structures if CUSTOM is selected.
How to use it: Enter a custom integer value (only shown when CUSTOM is selected).
💬 External Label Size
💬External Label Size: Set the label size for external market structures.
What it is: A dropdown to select the size of the labels.
What it does: Changes the size of the labels for external market structures.
How to use it: Choose a size from the dropdown (XS, S, M, L, XL).
🟩 External Bullish Color
External Bullish Color: Set the color for bullish external market structures.
What it is: A color picker to set the color of bullish external market structures.
What it does: Changes the color of bullish external market structures on the chart.
How to use it: Select a color from the color picker.
🟥 External Bearish Color
External Bearish Color: Set the color for bearish external market structures.
What it is: A color picker to set the color of bearish external market structures.
What it does: Changes the color of bearish external market structures on the chart.
How to use it: Select a color from the color picker.
📐 Show Equal Highs and Lows
EQL & EQH📐: Toggle visibility for equal highs and lows.
What it is: A boolean input to show or hide equal highs and lows.
What it does: Displays or hides equal highs and lows on the chart.
How to use it: Check or uncheck the box to enable or disable.
📏 Equal Highs and Lows Threshold
Equal Highs and Lows Threshold: Set the threshold for equal highs and lows.
What it is: A float input to set the threshold for equal highs and lows.
What it does: Defines the range within which highs and lows are considered equal.
How to use it: Enter a value between 0 and 10.
💬 Label Size for Equal Highs and Lows
💬Label Size for Equal Highs and Lows: Set the label size for equal highs and lows.
What it is: A dropdown to select the size of the labels.
What it does: Changes the size of the labels for equal highs and lows.
How to use it: Choose a size from the dropdown (XS, S, M, L, XL).
🟩 Bullish Color for Equal Highs and Lows
Bullish Color for Equal Highs and Lows: Set the color for bullish equal highs and lows.
What it is: A color picker to set the color of bullish equal highs and lows.
What it does: Changes the color of bullish equal highs and lows on the chart.
How to use it: Select a color from the color picker.
🟥 Bearish Color for Equal Highs and Lows
Bearish Color for Equal Highs and Lows: Set the color for bearish equal highs and lows.
What it is: A color picker to set the color of bearish equal highs and lows.
What it does: Changes the color of bearish equal highs and lows on the chart.
How to use it: Select a color from the color picker.
📏 Show Swing Points
Swing Points📏: Toggle visibility for swing points.
What it is: A boolean input to show or hide swing points.
What it does: Displays or hides swing points on the chart.
How to use it: Check or uncheck the box to enable or disable.
📏 Swing Points Length Option
Swing Points Length Option: Select the length for swing points.
What it is: A dropdown to choose between SHORT, MID, LONG, or CUSTOM.
What it does: Sets the length of swing points.
How to use it: Choose an option from the dropdown.
Additional Info: Default lengths are SHORT=10, MID=28, LONG=50.
💬 Swing Points Label Size
💬Swing Points Label Size: Set the label size for swing points.
What it is: A dropdown to select the size of the labels.
What it does: Changes the size of the labels for swing points.
How to use it: Choose a size from the dropdown (XS, S, M, L, XL).
🎨 Swing Points Color
Swing Points Color: Set the color for swing points.
What it is: A color picker to set the color of swing points.
What it does: Changes the color of swing points on the chart.
How to use it: Select a color from the color picker.
🔧 Custom Swing Points Length
🔧Custom Swings: Specify a custom length for swing points.
What it is: An integer input for setting a custom length for swing points.
What it does: Defines the length of swing points if CUSTOM is selected.
How to use it: Enter a custom integer value (only shown when CUSTOM is selected).
Additional Information
Market Structure Types: Understanding internal and external structures helps in analyzing different market behaviors.
Equal Highs and Lows: This feature identifies areas where price action is balanced, which can be significant for trading strategies.
Swing Points: Highlighting swing points aids in recognizing significant market reversals or continuations.
Benefits
Enhance your trading strategy by visualizing smart money's influence on price movements.
Make informed decisions with real-time data on significant market structures.
Reduce manual analysis with automated detection of key trading signals.
Ideal For
Traders looking for an edge in forex, equities, and cryptocurrency markets by understanding the underlying forces driving market dynamics.
Acknowledgements
Special thanks to these amazing creators for inspiration and their creations:
I want to thank these amazing creators for creating there amazing indicators , that inspired me and also gave me a head start by making this indicator! Without their amazing indicators it wouldn't be possible!
Flux Charts: Volumized Order Blocks
LuxAlgo: Trend Lines
UAlgo: Fair Value Gaps (FVG)
By Leviathan: Market Structure
Sonarlab: Liquidity Levels
Note
Remember to always backtest the indicator first before integrating it into your strategy! For any questions about the indicator, please feel free to ask for assistance.

LabelManagementLabel management with fluent configuration, change tracking, and named registry
LabelManagement is a Pine Script library for creating and managing dynamic chart labels. Built with a fluent-style API , it simplifies label creation, styling, positioning, and content updates through method chaining and centralized control.
Manage 'sticky' labels easily across bars with expressive, readable code that reduces clutter and improves code clarity.
Example usage:
// Close label – to the right of the last bar
labels.get("close")
.style(label.style_label_left)
.bgColor(color.gray)
.xy(bar_index, close)
.textValue("C: " + str.tostring(close, "#.##"))
.textColor(color.white)
.tooltip("This is the close price")
.apply()
Key features:
Fluent API – Build and update labels using a chainable configuration flow
Named label registry – Access and manage labels by name, e.g., "entry", "stop", "target"
Change tracking – Update only when necessary to reduce redraws
Deferred application – Apply all changes in one efficient operation
Centralized control – Works well in modular or multi-label environments
This library is designed for Pine developers who want more control and less boilerplate when managing visual elements on the chart.
method clone(this)
Creates a new LabelConfig by copying all properties from this instance
Namespace types: LabelConfig
Parameters:
this (LabelConfig) : (LabelConfig) The LabelConfig instance
Returns: (LabelConfig) New LabelConfig instance with identical properties
method applyTo(this, target)
Applies configuration to specified label (required parameter)
Namespace types: LabelConfig
Parameters:
this (LabelConfig) : (LabelConfig) The LabelConfig instance
target (label) : (label) Label to apply config to
Returns: (LabelConfig) Self-reference for method chaining
method update(this, updates)
Creates a new LabelUpdater with change tracking for this label
Namespace types: series label
Parameters:
this (label) : (label) The label instance
updates (LabelConfig) : (LabelConfig) Optional existing config to apply and reuse (if provided, applies to label first)
Returns: (LabelUpdater) New LabelUpdater with blank configs for change tracking
method x(this, value)
Sets the X coordinate with change tracking (fluent interface)
Namespace types: LabelUpdater
Parameters:
this (LabelUpdater) : (LabelUpdater) The LabelUpdater instance
value (int) : (int) New X coordinate
Returns: (LabelUpdater) Self-reference for method chaining
method y(this, value)
Sets the Y coordinate with change tracking (fluent interface)
Namespace types: LabelUpdater
Parameters:
this (LabelUpdater) : (LabelUpdater) The LabelUpdater instance
value (float) : (float) New Y coordinate
Returns: (LabelUpdater) Self-reference for method chaining
method xy(this, x, y)
Sets both X and Y coordinates with change tracking (fluent interface)
Namespace types: LabelUpdater
Parameters:
this (LabelUpdater) : (LabelUpdater) The LabelUpdater instance
x (int) : (int) New X coordinate
y (float) : (float) New Y coordinate
Returns: (LabelUpdater) Self-reference for method chaining
method textValue(this, value)
Sets the text content with change tracking (fluent interface)
Namespace types: LabelUpdater
Parameters:
this (LabelUpdater) : (LabelUpdater) The LabelUpdater instance
value (string) : (string) New text content
Returns: (LabelUpdater) Self-reference for method chaining
method textColor(this, value)
Sets the text color with change tracking (fluent interface)
Namespace types: LabelUpdater
Parameters:
this (LabelUpdater) : (LabelUpdater) The LabelUpdater instance
value (color) : (color) New text color
Returns: (LabelUpdater) Self-reference for method chaining
method textSize(this, value)
Sets the text size with change tracking (fluent interface)
Namespace types: LabelUpdater
Parameters:
this (LabelUpdater) : (LabelUpdater) The LabelUpdater instance
value (string) : (string) New text size
Returns: (LabelUpdater) Self-reference for method chaining
method bgColor(this, value)
Sets the background color with change tracking (fluent interface)
Namespace types: LabelUpdater
Parameters:
this (LabelUpdater) : (LabelUpdater) The LabelUpdater instance
value (color) : (color) New background color
Returns: (LabelUpdater) Self-reference for method chaining
method style(this, value)
Sets the label style with change tracking (fluent interface)
Namespace types: LabelUpdater
Parameters:
this (LabelUpdater) : (LabelUpdater) The LabelUpdater instance
value (string) : (string) New style
Returns: (LabelUpdater) Self-reference for method chaining
method yloc(this, value)
Sets the Y location mode with change tracking (fluent interface)
Namespace types: LabelUpdater
Parameters:
this (LabelUpdater) : (LabelUpdater) The LabelUpdater instance
value (string) : (string) New yloc
Returns: (LabelUpdater) Self-reference for method chaining
method xloc(this, value)
Sets the X location mode with change tracking (fluent interface)
Namespace types: LabelUpdater
Parameters:
this (LabelUpdater) : (LabelUpdater) The LabelUpdater instance
value (string) : (string) New xloc
Returns: (LabelUpdater) Self-reference for method chaining
method tooltip(this, value)
Sets the tooltip content with change tracking (fluent interface)
Namespace types: LabelUpdater
Parameters:
this (LabelUpdater) : (LabelUpdater) The LabelUpdater instance
value (string) : (string) New tooltip content
Returns: (LabelUpdater) Self-reference for method chaining
method size(this, value)
Sets the text size with change tracking (fluent interface) - alias for textSize
Namespace types: LabelUpdater
Parameters:
this (LabelUpdater) : (LabelUpdater) The LabelUpdater instance
value (string) : (string) New text size
Returns: (LabelUpdater) Self-reference for method chaining
method size(this)
Gets the count of registered labels
Namespace types: LabelManager
Parameters:
this (LabelManager) : (LabelManager) The LabelManager instance
Returns: (int) Number of labels in the registry
method apply(this)
Applies pending changes to linked label and updates tracking
Namespace types: LabelUpdater
Parameters:
this (LabelUpdater) : (LabelUpdater) The LabelUpdater instance
Returns: (LabelUpdater) Self-reference for method chaining
method get(this, name)
Gets or creates a LabelUpdater for the specified name
Namespace types: LabelManager
Parameters:
this (LabelManager) : (LabelManager) The LabelManager instance
name (string) : (string) Unique identifier for the label
Returns: (LabelUpdater) Existing or newly created LabelUpdater for the name
method has(this, name)
Checks if a label with the specified name exists
Namespace types: LabelManager
Parameters:
this (LabelManager) : (LabelManager) The LabelManager instance
name (string) : (string) Name to check for existence
Returns: (bool) True if label exists, false otherwise
method remove(this, name)
Removes a label from the registry and deletes the underlying Pine Script label
Namespace types: LabelManager
Parameters:
this (LabelManager) : (LabelManager) The LabelManager instance
name (string) : (string) Name of the label to remove
Returns: (LabelManager) Self-reference for method chaining
method clear(this)
Removes all labels from registry and deletes all underlying Pine Script labels
Namespace types: LabelManager
Parameters:
this (LabelManager) : (LabelManager) The LabelManager instance
Returns: (LabelManager) Self-reference for method chaining
newManager()
Creates a new LabelManager with empty registry
Returns: (LabelManager) New LabelManager instance ready for use
LabelConfig
LabelConfig Configuration object for label appearance and positioning
Fields:
x (series int) : (series int) X-coordinate (na = unchanged)
y (series float) : (series float) Y-coordinate (na = unchanged)
style (series string) : (series string) Label style (na = unchanged)
yloc (series string) : (series string) Y-location type (na = unchanged)
xloc (series string) : (series string) X-location type (na = unchanged)
bgColor (series color) : (series color) Background color (na = unchanged)
textValue (series string) : (series string) Label text content (na = unchanged)
textSize (series string) : (series string) Text size (na = unchanged)
textColor (series color) : (series color) Text color (na = unchanged)
tooltip (series string) : (series string) Tooltip text (na = unchanged)
LabelUpdater
LabelUpdater Smart label updater with change tracking and minimal updates
Fields:
label (series label) : (label) Reference to the label being updated
latest (LabelConfig) : (LabelConfig) Current known state of the label
updates (LabelConfig) : (LabelConfig) Pending changes to apply
LabelManager
LabelManager Central registry for managing named labels with automatic creation
Fields:
registry (map) : (map) Internal storage mapping names to LabelUpdater instances
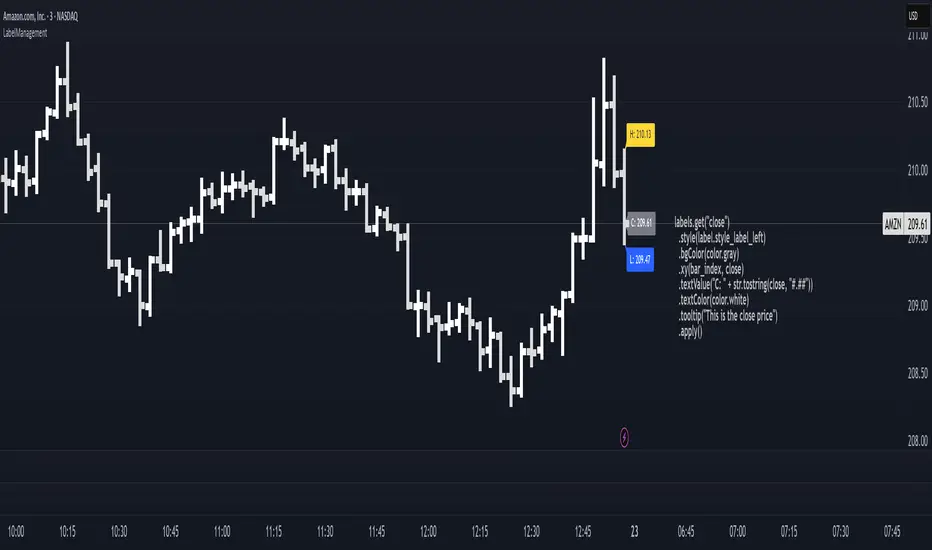
Casa_TableLibrary "Casa_Table"
A powerful library for creating customizable tables from data arrays and matrices.
Features flexible formatting options including:
- Multiple function implementations for different levels of control
- Consistent column counts required across matrix rows
- Matching dimensions needed for color arrays/matrices
- Cell spanning capabilities across rows/columns
- Rich examples demonstrating proper data structure setup
The library makes it easy to transform your data into professional-looking
tables while maintaining full control over their visual appearance.
floatArrayToCellArray(floatArray)
Helper function that converts a float array to a Cell array so it can be rendered with the fromArray function
Parameters:
floatArray (array) : (array) the float array to convert to a Cell array.
Returns: array The Cell array to return.
stringArrayToCellArray(stringArray)
Helper function that converts a string array to a Cell array so it can be rendered with the fromArray function
Parameters:
stringArray (array) : (array) the array to convert to a Cell array.
Returns: array The Cell array to return.
floatMatrixToCellMatrix(floatMatrix)
Helper function that converts a float matrix to a Cell matrix so it can be rendered with the fromMatrix function
Parameters:
floatMatrix (matrix) : (matrix) the float matrix to convert to a string matrix.
Returns: matrix The Cell matrix to render.
stringMatrixToCellMatrix(stringMatrix)
Helper function that converts a string matrix to a Cell matrix so it can be rendered with the fromMatrix function
Parameters:
stringMatrix (matrix) : (matrix) the string matrix to convert to a Cell matrix.
Returns: matrix The Cell matrix to return.
fromMatrix(CellMatrix, position, verticalOffset, transposeTable, textSize, borderWidth, tableNumRows, blankCellText)
Takes a CellMatrix and renders it as a table.
Parameters:
CellMatrix (matrix) : (matrix) The Cells to be rendered in a table
position (string) : (string) Optional. The position of the table. Defaults to position.top_right
verticalOffset (int) : (int) Optional. The vertical offset of the table from the top or bottom of the chart. Defaults to 0.
transposeTable (bool) : (bool) Optional. Will transpose all of the data in the matrices before rendering. Defaults to false.
textSize (string) : (string) Optional. The size of text to render in the table. Defaults to size.small.
borderWidth (int) : (int) Optional. The width of the border between table cells. Defaults to 2.
tableNumRows (int) : (int) Optional. The number of rows in the table. Not required, defaults to the number of rows in the provided matrix. If your matrix will have a variable number of rows, you must provide the max number of rows or the function will error when it attempts to set a cell value on a row that the table hadn't accounted for when it was defined.
blankCellText (string) : (string) Optional. Text to use cells when adding blank rows for vertical offsetting.
fromMatrix(dataMatrix, position, verticalOffset, transposeTable, textSize, borderWidth, tableNumRows, blankCellText)
Renders a float matrix as a table.
Parameters:
dataMatrix (matrix) : (matrix_float) The data to be rendered in a table
position (string) : (string) Optional. The position of the table. Defaults to position.top_right
verticalOffset (int) : (int) Optional. The vertical offset of the table from the top or bottom of the chart. Defaults to 0.
transposeTable (bool) : (bool) Optional. Will transpose all of the data in the matrices before rendering. Defaults to false.
textSize (string) : (string) Optional. The size of text to render in the table. Defaults to size.small.
borderWidth (int) : (int) Optional. The width of the border between table cells. Defaults to 2.
tableNumRows (int) : (int) Optional. The number of rows in the table. Not required, defaults to the number of rows in the provided matrix. If your matrix will have a variable number of rows, you must provide the max number of rows or the function will error when it attempts to set a cell value on a row that the table hadn't accounted for when it was defined.
blankCellText (string) : (string) Optional. Text to use cells when adding blank rows for vertical offsetting.
fromMatrix(dataMatrix, position, verticalOffset, transposeTable, textSize, borderWidth, tableNumRows, blankCellText)
Renders a string matrix as a table.
Parameters:
dataMatrix (matrix) : (matrix_string) The data to be rendered in a table
position (string) : (string) Optional. The position of the table. Defaults to position.top_right
verticalOffset (int) : (int) Optional. The vertical offset of the table from the top or bottom of the chart. Defaults to 0.
transposeTable (bool) : (bool) Optional. Will transpose all of the data in the matrices before rendering. Defaults to false.
textSize (string) : (string) Optional. The size of text to render in the table. Defaults to size.small.
borderWidth (int) : (int) Optional. The width of the border between table cells. Defaults to 2.
tableNumRows (int) : (int) Optional. The number of rows in the table. Not required, defaults to the number of rows in the provided matrix. If your matrix will have a variable number of rows, you must provide the max number of rows or the function will error when it attempts to set a cell value on a row that the table hadn't accounted for when it was defined.
blankCellText (string) : (string) Optional. Text to use cells when adding blank rows for vertical offsetting.
fromArray(dataArray, position, verticalOffset, transposeTable, textSize, borderWidth, blankCellText)
Renders a Cell array as a table.
Parameters:
dataArray (array) : (array) The data to be rendered in a table
position (string) : (string) Optional. The position of the table. Defaults to position.top_right
verticalOffset (int) : (int) Optional. The vertical offset of the table from the top or bottom of the chart. Defaults to 0.
transposeTable (bool) : (bool) Optional. Will transpose all of the data in the matrices before rendering. Defaults to false.
textSize (string) : (string) Optional. The size of text to render in the table. Defaults to size.small.
borderWidth (int) : (int) Optional. The width of the border between table cells. Defaults to 2.
blankCellText (string) : (string) Optional. Text to use cells when adding blank rows for vertical offsetting.
fromArray(dataArray, position, verticalOffset, transposeTable, textSize, borderWidth, blankCellText)
Renders a string array as a table.
Parameters:
dataArray (array) : (array_string) The data to be rendered in a table
position (string) : (string) Optional. The position of the table. Defaults to position.top_right
verticalOffset (int) : (int) Optional. The vertical offset of the table from the top or bottom of the chart. Defaults to 0.
transposeTable (bool) : (bool) Optional. Will transpose all of the data in the matrices before rendering. Defaults to false.
textSize (string) : (string) Optional. The size of text to render in the table. Defaults to size.small.
borderWidth (int) : (int) Optional. The width of the border between table cells. Defaults to 2.
blankCellText (string) : (string) Optional. Text to use cells when adding blank rows for vertical offsetting.
fromArray(dataArray, position, verticalOffset, transposeTable, textSize, borderWidth, blankCellText)
Renders a float array as a table.
Parameters:
dataArray (array) : (array_float) The data to be rendered in a table
position (string) : (string) Optional. The position of the table. Defaults to position.top_right
verticalOffset (int) : (int) Optional. The vertical offset of the table from the top or bottom of the chart. Defaults to 0.
transposeTable (bool) : (bool) Optional. Will transpose all of the data in the matrices before rendering. Defaults to false.
textSize (string) : (string) Optional. The size of text to render in the table. Defaults to size.small.
borderWidth (int) : (int) Optional. The width of the border between table cells. Defaults to 2.
blankCellText (string) : (string) Optional. Text to use cells when adding blank rows for vertical offsetting.
debug(message, position)
Renders a debug message in a table at the desired location on screen.
Parameters:
message (string) : (string) The message to render.
position (string) : (string) Optional. The position of the debug message. Defaults to position.middle_right.
Cell
Type for each cell's content and appearance
Fields:
content (series string)
bgColor (series color)
textColor (series color)
align (series string)
colspan (series int)
rowspan (series int)
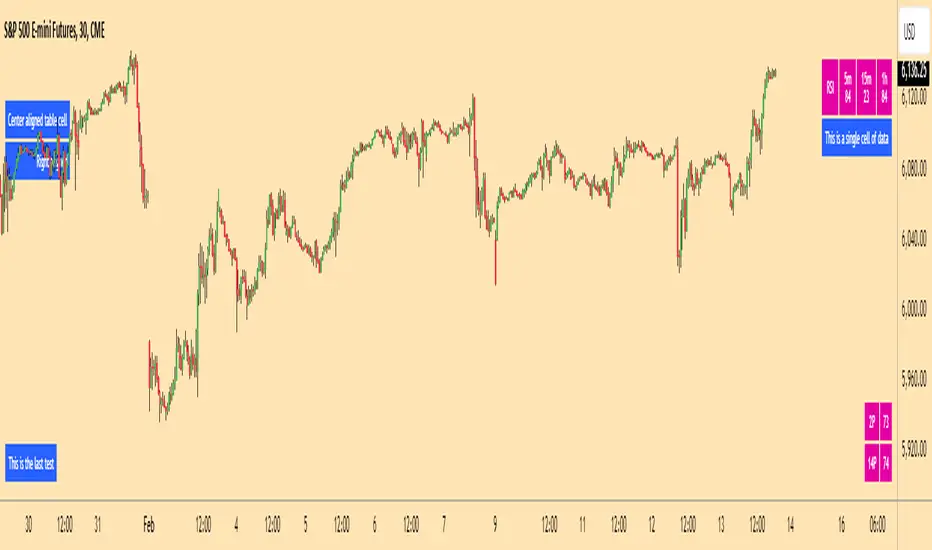
Delta Flow Profile [LuxAlgo]The Delta Flow Profile is a charting tool that tracks and visualizes money flow and the difference between buying and selling pressure accumulated within multiple price ranges over a specified period. It reveals the relationship between an asset's price and traders' willingness to buy or sell, helping traders identify significant price levels and analyze market activity.
The Normalized Profile displays the percentage of money flow at each price level relative to the maximum money flow level, enabling traders to easily compare levels and understand the relative importance of each price point in the context of overall trading activity.
🔶 USAGE
The Delta Flow Profile is made of two principal components with different usability, each one of them described in the sub-sections below.
🔹 Money Flow Profile
The Money Flow Profile illustrates the total buying and selling activity at different price ranges. By analyzing this profile, users can identify key price zones with substantial buying or selling pressure. These zones can often act as potential support or resistance.
The rows of the Money Flow Profile represent the trading activity at specific price ranges over a given period.
A normalized profile is included to compare each zone relative to the peak money flow using a percentage, with 100% indicating that a price range is the one with the highest accumulated money flow.
🔹 Delta Profile
The Delta Profile assesses the dominant sentiment (buying or selling) from volume delta at different price levels to gauge market sentiment and potential reversals.
Delta Profile rows with more significant buying or selling volume indicate dominance from one side of the market in that specific price area. Price coming back to that area might indicate willingness from a dominant side to further accumulate orders within it, potentially causing price to follow the direction established by this dominant side afterward.
The volume delta is determined from the user-selected Polarity Method, with "Bar Polarity" using candle sentiment to determine if a bar associated volume is buying or selling volume, and "Bar Buying/Selling Pressure" making use of the high/low price to obtain more precise results.
🔹 Level of Significance
Users can quickly highlight the price levels with the highest recorded money flow activity through the included "Level of Significance". Various display methods are included:
Developing: Show the price level with the highest recorded money flow activity spanning over the indicator calculation interval.
Level: Show the price level with the highest recorded money flow activity.
Row: Show the price zone with the highest recorded money flow activity.
These levels/zones can be used as potential support/resistance points and can serve as a reference of where prices might go next for market participants to accumulate orders.
🔶 SETTINGS
The script offers a range of customizable settings to tailor the analysis to your trading needs.
🔹 Calculation Settings
Money Flow Profile: Toggles the visibility of the Money Flow Profile.
Normalized: Toggles the visibility of the Normalized Profile.
Sentiment Profile: Toggles the visibility of the Sentiment Profile.
Polarity Method: Choose between Bar Polarity or Bar Buying/Selling Pressure to calculate the Sentiment Profile.
Level of Significance: Toggles the visibility of the level of significance line/zone.
Lookback Length / Fixed Range: Sets the lookback length.
Number of Rows: Specify how many rows each profile histogram will have.
🔹 Display Settings
Profile Width %: Alters the width of the rows in the histogram, relative to the profile length.
Profile Horizontal Offset: Enables moving the profile on the horizontal axis.
Profile Text: Toggles the visibility of profile texts, and alters the size of the text. Setting to Auto will keep the text within the box limits.
Currency: Extends the profile text with the traded currency.
Profile Price Levels: Toggles the visibility of the profile price levels.
🔶 RELATED SCRIPTS
Money-Flow-Profile
Volume-Profile-with-Node-Detection

TableLibrary "Table"
This library provides an easy way to convert arrays and matrixes of data into tables. There are a few different implementations of each function so you can get more or less control over the appearance of the tables. The basic rule of thumb is that all matrix rows must have the same number of columns, and if you are providing multiple arrays/matrixes to specify additional colors (background/text), they must have the same number of rows/columns as the data array. Finally, you do have the option of spanning cells across rows or columns with some special syntax in the data cell. Look at the examples to see how the arrays and matrixes need to be built before they can be used by the functions.
floatArrayToCellArray(floatArray)
Helper function that converts a float array to a Cell array so it can be rendered with the fromArray function
Parameters:
floatArray (float ) : (array) the float array to convert to a Cell array.
Returns: array The Cell array to return.
stringArrayToCellArray(stringArray)
Helper function that converts a string array to a Cell array so it can be rendered with the fromArray function
Parameters:
stringArray (string ) : (array) the array to convert to a Cell array.
Returns: array The Cell array to return.
floatMatrixToCellMatrix(floatMatrix)
Helper function that converts a float matrix to a Cell matrix so it can be rendered with the fromMatrix function
Parameters:
floatMatrix (matrix) : (matrix) the float matrix to convert to a string matrix.
Returns: matrix The Cell matrix to render.
stringMatrixToCellMatrix(stringMatrix)
Helper function that converts a string matrix to a Cell matrix so it can be rendered with the fromMatrix function
Parameters:
stringMatrix (matrix) : (matrix) the string matrix to convert to a Cell matrix.
Returns: matrix The Cell matrix to return.
fromMatrix(CellMatrix, position, verticalOffset, transposeTable, textSize, borderWidth, tableNumRows, blankCellText)
Takes a CellMatrix and renders it as a table.
Parameters:
CellMatrix (matrix) : (matrix) The Cells to be rendered in a table
position (string) : (string) Optional. The position of the table. Defaults to position.top_right
verticalOffset (int) : (int) Optional. The vertical offset of the table from the top or bottom of the chart. Defaults to 0.
transposeTable (bool) : (bool) Optional. Will transpose all of the data in the matrices before rendering. Defaults to false.
textSize (string) : (string) Optional. The size of text to render in the table. Defaults to size.small.
borderWidth (int) : (int) Optional. The width of the border between table cells. Defaults to 2.
tableNumRows (int) : (int) Optional. The number of rows in the table. Not required, defaults to the number of rows in the provided matrix. If your matrix will have a variable number of rows, you must provide the max number of rows or the function will error when it attempts to set a cell value on a row that the table hadn't accounted for when it was defined.
blankCellText (string) : (string) Optional. Text to use cells when adding blank rows for vertical offsetting.
fromMatrix(dataMatrix, position, verticalOffset, transposeTable, textSize, borderWidth, tableNumRows, blankCellText)
Renders a float matrix as a table.
Parameters:
dataMatrix (matrix) : (matrix_float) The data to be rendered in a table
position (string) : (string) Optional. The position of the table. Defaults to position.top_right
verticalOffset (int) : (int) Optional. The vertical offset of the table from the top or bottom of the chart. Defaults to 0.
transposeTable (bool) : (bool) Optional. Will transpose all of the data in the matrices before rendering. Defaults to false.
textSize (string) : (string) Optional. The size of text to render in the table. Defaults to size.small.
borderWidth (int) : (int) Optional. The width of the border between table cells. Defaults to 2.
tableNumRows (int) : (int) Optional. The number of rows in the table. Not required, defaults to the number of rows in the provided matrix. If your matrix will have a variable number of rows, you must provide the max number of rows or the function will error when it attempts to set a cell value on a row that the table hadn't accounted for when it was defined.
blankCellText (string) : (string) Optional. Text to use cells when adding blank rows for vertical offsetting.
fromMatrix(dataMatrix, position, verticalOffset, transposeTable, textSize, borderWidth, tableNumRows, blankCellText)
Renders a string matrix as a table.
Parameters:
dataMatrix (matrix) : (matrix_string) The data to be rendered in a table
position (string) : (string) Optional. The position of the table. Defaults to position.top_right
verticalOffset (int) : (int) Optional. The vertical offset of the table from the top or bottom of the chart. Defaults to 0.
transposeTable (bool) : (bool) Optional. Will transpose all of the data in the matrices before rendering. Defaults to false.
textSize (string) : (string) Optional. The size of text to render in the table. Defaults to size.small.
borderWidth (int) : (int) Optional. The width of the border between table cells. Defaults to 2.
tableNumRows (int) : (int) Optional. The number of rows in the table. Not required, defaults to the number of rows in the provided matrix. If your matrix will have a variable number of rows, you must provide the max number of rows or the function will error when it attempts to set a cell value on a row that the table hadn't accounted for when it was defined.
blankCellText (string) : (string) Optional. Text to use cells when adding blank rows for vertical offsetting.
fromArray(dataArray, position, verticalOffset, transposeTable, textSize, borderWidth, blankCellText)
Renders a Cell array as a table.
Parameters:
dataArray (Cell ) : (array) The data to be rendered in a table
position (string) : (string) Optional. The position of the table. Defaults to position.top_right
verticalOffset (int) : (int) Optional. The vertical offset of the table from the top or bottom of the chart. Defaults to 0.
transposeTable (bool) : (bool) Optional. Will transpose all of the data in the matrices before rendering. Defaults to false.
textSize (string) : (string) Optional. The size of text to render in the table. Defaults to size.small.
borderWidth (int) : (int) Optional. The width of the border between table cells. Defaults to 2.
blankCellText (string) : (string) Optional. Text to use cells when adding blank rows for vertical offsetting.
fromArray(dataArray, position, verticalOffset, transposeTable, textSize, borderWidth, blankCellText)
Renders a string array as a table.
Parameters:
dataArray (string ) : (array_string) The data to be rendered in a table
position (string) : (string) Optional. The position of the table. Defaults to position.top_right
verticalOffset (int) : (int) Optional. The vertical offset of the table from the top or bottom of the chart. Defaults to 0.
transposeTable (bool) : (bool) Optional. Will transpose all of the data in the matrices before rendering. Defaults to false.
textSize (string) : (string) Optional. The size of text to render in the table. Defaults to size.small.
borderWidth (int) : (int) Optional. The width of the border between table cells. Defaults to 2.
blankCellText (string) : (string) Optional. Text to use cells when adding blank rows for vertical offsetting.
fromArray(dataArray, position, verticalOffset, transposeTable, textSize, borderWidth, blankCellText)
Renders a float array as a table.
Parameters:
dataArray (float ) : (array_float) The data to be rendered in a table
position (string) : (string) Optional. The position of the table. Defaults to position.top_right
verticalOffset (int) : (int) Optional. The vertical offset of the table from the top or bottom of the chart. Defaults to 0.
transposeTable (bool) : (bool) Optional. Will transpose all of the data in the matrices before rendering. Defaults to false.
textSize (string) : (string) Optional. The size of text to render in the table. Defaults to size.small.
borderWidth (int) : (int) Optional. The width of the border between table cells. Defaults to 2.
blankCellText (string) : (string) Optional. Text to use cells when adding blank rows for vertical offsetting.
debug(message, position)
Renders a debug message in a table at the desired location on screen.
Parameters:
message (string) : (string) The message to render.
position (string) : (string) Optional. The position of the debug message. Defaults to position.middle_right.
Cell
Type for each cell's content and appearance
Fields:
content (series string)
bgColor (series color)
textColor (series color)
align (series string)
colspan (series int)
rowspan (series int)

Scoopy StacksWaffle Around Multiple
(Open, High, Low, Close) Stacks On
Pre/Post Market & (Daily, Weekly,
Monthly, Yearly) Sessions With
Meticulous Columns, Rows, Tooltips,
Colors, Custom Ideas, and Alerts.
Sessions Use Two Step Incremental Values
Default Value: (1) Shows Two Previous
(O, H, L, C); Increasing Value Swaps
Sessions With Next Two Stacks.
⬛️ KEY WORDS:
🟢 Crossover | 🔴 Crossunder
📗 High | 📕 Low
📔 Open | 📓 Close
🥇 First Idea | 🥈 Second Idea
🥉 Third Idea | 🎖️ Fourth Idea
🟥 ALERTS:
Default Option: (Per Bar)
Alerts Once Conditions Are Met
(Bar Close) Alerts When Bar Closes
Default Option: (Reg)
Alerts During Regular Market
Trading Hours, (0930-1600)
(Ext) Alerts During Extended
Market Hours, (1600-0930)
(24/7) Alerts All Day
Optional Preferences:
Regular Alerts - Stocks
Extended Alerts - Futures
24/7 Alerts - Crypto
🟧 STACKS:
Default Value: (1)
Incremental Stack Value, Increasing Value
Swaps Sessions With the Next Two Stacks
(✓) Swap Stacks?
Pre/Post Market High/Lows,
1-2 Day High/Lows, 1-2 Week High/Lows,
1-2 Month High/Lows, 1-2 Year High/Lows
( ) Swap Stacks?
Pre/Post Market Open/Close,
1-2 Day Open/Close, 1-2 Week Open/Close,
1-2 Month Open/Close, 1-2 Year Open/Close
🟨 EXAMPLES:
Default Stack:
🟢 | 📗 Pre Market High (PRE) | 4600.00
🔴 | 📕 Post Market Low (POST) | 420.00
Optional: (Open)
🟢 | 📔 Post Market Open (POST) | 4400.00
Optional: (Close)
🔴 | 📓 Pre Market Close (PRE) | 430.00
Default Stack Value: (1)
🔴 | 📗 1 Day High (1DH) | 460.00
Next Stack Value: (3)
🟢 | 📕 4 Day Low (4DL) | 420.00
Optional: (Open)
🔴 | 📔 2 Day Open (2DO) | 440.00
Optional: (Close)
🟢 | 📓 3 Day Close (3DC) | 430.00
Default Stack Value: (5)
🟢 | 📗 5 Week High (5WH) | 460.00
Next Stack Value: (7)
🔴 | 📕 8 Week Low (8WL) | 420.00
Optional: (Open)
🔴 | 📔 7 Week Open (7WO) | 4400.00
Optional: (Close)
🟢 | 📓 6 Week Close (6WC) | 430.00
Default Stack Value: (9)
🔴 | 📗 9 Month High (9MH) | 460.00
Next Stack Value: (11)
🟢 | 📕 12 Month Low (12ML) | 420.00
Optional: (Open)
🟢 | 📔 11 Month Open (11MO) | 4400.00
Optional: (Close)
🔴 | 📓 10 Month Close (10MC) | 430.00
Default Stack Value: (13)
🟢 | 📗 13 Year High (13YH) | 460.00
Next Stack Value: (15)
🟢 | 📕 16 Year Low (16YL) | 420.00
Optional: (Open)
🔴 | 📔 15 Year Open (15YO) | 4400.00
Optional: (Close)
🔴 | 📓 14 Year Close (14YC) | 430.00
🟩 TABLES:
Default Value: (1)
Moves Table Up, Down, Left, or Right
Based on Second Default Value
First Default Value: (Top Right)
Sets Table Placement, Middle Center
Allows Table To Move In All Directions
Second Default Value: (Default)
Fixed Table Position, Switching Values
Moves Direction of the Table
🟦 IDEAS:
(✓) Show Ideas?
Shows Four Ideas With Custom Texts
and Values; Ideas Are Based Around
Post-It Note Reminders with Alerts
Suggestions For Text Ideas:
Take Profit, Stop Loss, Trim, Hold,
Long, Short, Bounce Spot, Retest,
Chop, Support, Resistance, Buy, Sell
🟪 EXAMPLES:
Default Value: (5)
Shows the Custom Table Value For
Sorted Table Positions and Alerts
Default Text: (🥇)
Shown On First Table Cell and
Message Appearing On Alerts
Alert Shows: 🟢 | 🥇 | 5.00
Default Value: (10)
Shows the Custom Table Value For
Sorted Table Positions and Alerts
Default Text: (🥈)
Shown On Second Table Cell and
Message Appearing On Alerts
Alert Shows: 🔴 | 🥈 | 10.00
Default Value: (50)
Shows the Custom Table Value For
Sorted Table Positions and Alerts
Default Text: (🥉)
Shown On Third Table Cell and
Message Appearing On Alerts
Alert Shows: 🟢 | 🥉 | 50.00
Default Value: (100)
Shows the Custom Table Value For
Sorted Table Positions and Alerts
Default Text: (🎖️)
Shown On Fourth Table Cell and
Message Appearing On Alerts
Alert Shows: 🔴 | 🎖️ | 100.00
⬛️ REFERENCES:
Pre-market Highs & Lows on regular
trading hours (RTH) chart
By Twingall
Previous Day Week Highs & Lows
By Sbtnc
Screener for 40+ instruments
By QuantNomad
Daily Weekly Monthly Yearly Opens
By Meliksah55

@tk · fractal emas█ OVERVIEW
This script is an indicator that plots short, medium and long moving averages for multiple fractals. This script was based on sharks EMAs by rlvs indicator, that plots multiple rays for each fractals into the chart. The main feature of this indicator is the customizability. The calculation itself is simple as moving average.
█ MOTIVATION
The trader can customize all aspects of the plotted data. The text size, extended line length, the moving average type — exponential, simple, etc... — the length of fractal rays, line style, line width and visibility. To keep minimalist, this indicator simplifies the logic of line colors based on the purpose of each moving averages. To prevent overnoise the chart with multiple lines with multiple colors for each fractal timefraes, the trader needs to keep in mind that the all lines with the "short" moving average color for example, will represents the short moving averages lines for all fractals. This logic is applied for medium and long moving averages either.
█ CONCEPT
The trading concept to use this indicator is to make entries on uptrend or downtrend pullbacks when the asset price reaches the short, medium or long moving averages price levels. But this strategy don't works alone. It needs to be aligned together with others indicators like RSI, Chart Patterns, Support and Resistance, and so on... Even more confluences that you have, bigger are your chances to increase the probability for a successful trade. So, don't use this indicator alone. Compose a trading strategy and use it to improve your analysis.
█ CUSTOMIZATION
This indicator allows the trader to customize the following settings:
GENERAL
Text size
Changes the font size of the labels to improve accessibility.
Type: string
Options: `tiny`, `small`, `normal`, `large`.
Default: `small`
SHORT
Type
Select the Short Moving Average calculation type.
Type: string
Options: `EMA`, `SMA`, `HMA`, `VWMA`, `WMA`.
Default: `EMA`
Length
Changes the base length for the Short Moving Average calculation.
Type: int
Default: 12
Source
Changes the base source for the Short Moving Average calculation.
Type: float
Default: close
Color
The base color that will represent the Short Moving Average.
Type: color
Default: color.rgb(255, 235, 59) (yellow)
Fractal Style
The fractal ray line style.
Type: string
Options: `dotted`, `dashed`, `solid`.
Default: `dotted`
Fractal Width
The fractal ray line width.
Type: string
Options: `1px`, `2px`, `3px`, `4px`.
Default: `1px`
Fractal Ray Length
The fractal ray line length.
Type: int
Default: 12
MEDIUM
Type
Select the Medium Moving Average calculation type.
Type: string
Options: `EMA`, `SMA`, `HMA`, `VWMA`, `WMA`.
Default: `EMA`
Length
Changes the base length for the Medium Moving Average calculation.
Type: int
Default: 26
Source
Changes the base source for the Medium Moving Average calculation.
Type: float
Default: close
Color
The base color that will represent the Short Moving Average.
Type: color
Default: color.rgb(0, 230, 118) (lime)
Fractal Style
The fractal ray line style.
Type: string
Options: `dotted`, `dashed`, `solid`.
Default: `dotted`
Fractal Width
The fractal ray line width.
Type: string
Options: `1px`, `2px`, `3px`, `4px`.
Default: `1px`
Fractal Ray Length
The fractal ray line length.
Type: int
Default: 12
LONG
Type
Select the Long Moving Average calculation type.
Type: string
Options: `EMA`, `SMA`, `HMA`, `VWMA`, `WMA`.
Default: `EMA`
Length
Changes the base length for the Long Moving Average calculation.
Type: int
Default: 200
Source
Changes the base source for the Long Moving Average calculation.
Type: float
Default: close
Color
The base color that will represent the Short Moving Average.
Type: color
Default: color.rgb(255, 82, 82) (red)
Fractal Style
The fractal ray line style.
Type: string
Options: `dotted`, `dashed`, `solid`.
Default: `dotted`
Fractal Width
The fractal ray line width.
Type: string
Options: `1px`, `2px`, `3px`, `4px`.
Default: `1px`
Fractal Ray Length
The fractal ray line length.
Type: int
Default: 12
VISIBILITY
Show Fractal Rays · (Short)
Shows short moving average fractal rays.
Type: bool
Default: true
Show Fractal Rays · (Medium)
Shows short moving average fractal rays.
Type: bool
Default: true
Show Fractal Rays · (Long)
Shows short moving average fractal rays.
Type: bool
Default: true
█ FUNCTIONS
The script contains the following functions:
`fn_labelizeTimeFrame`
Labelize timeframe period in minutes and hours.
Parameters:
tf: (string) Timeframe period to be labelized.
Returns: (string) Labelized timeframe string.
`fn_builtInLineStyle`
Converts simple string to built-in line style variable value.
Parameters:
lineStyle: (string) The line style simple string.
Returns: (string) Built-in line style string value.
`fn_builtInLineWidth`
Converts simple pixel string to line width number value.
Parameters:
lineWidth: (string) The line width pixel simple string.
Returns: (string) Built-in line width number value.
`fn_requestFractal`
Requests fractal data based on `period` given an expression.
Parameters:
period: (string) The period timeframe of fractal.
expression: (series float) The expression to retrieve data from fractal.
Returns: (mixed) A result determined by `expression`.
`fn_plotRay`
Plots line after chart bars.
Parameters:
y: (float) Y axis line position.
label: (string) Label to be ploted after line.
color: (color) Line and label color.
length: (int) Line length.
show: (bool) Flag to display the line. (default: `true`)
lineStyle: (string) Line style to be applied. (default: `line.style_dotted`)
lineWidth: (int) Line width. (default: `1`)
Returns: void
`fn_plotEmaRay`
Plots moving average line for a specific period.
Parameters:
period: (simple string) Period of fractal to retrieve
expression: (series float) The expression to retrieve data from fractal.
color: (color) Line and label color.
length: (int) Line length. (default: `12`)
show: (bool) Flag to display the line. (default: `true`)
lineStyle: (string) Line style to be applied. (default: `line.style_dotted`)
lineWidth: (string) Line width. (default: `1px`)
Returns: void
`fn_plotExtendedEmaRay`
Draws extended line for current timeframe moving average.
Parameters:
coordY: (float) Extended line Y axis position.
textValue: (simple string) Extended line label text.
textColor: (color) Extended line text color.
length: (int) Extended length. (default: `5`)
Returns: void

FrizBugLibrary "FrizBug"
Debug Tools | Pinescript Debugging Tool Kit
All in one Debugger - the benefit of wrapper functions to simply wrap variables or outputs and have the code still execute the same. Perfect for Debugging on Pine
str(inp)
Overloaded tostring like Function for all type+including Object Variables will also do arrays and matricies of all Types
Parameters:
inp : All types
Returns: string
print_label(str, x_offset, y, barstate, style, color, textcolor, text_align, size)
Label Helper Function - only needs the Str input to work
Parameters:
str :
x_offset : offset from last bar + or -
y : price of label
barstate : barstate built in variable
style : label style settin7
color : color setting
textcolor : textcolor
text_align : text align setting
size : text_sise
Returns: label
init()
initializes the database arrays
Returns: tuple | 2 matrix (1 matrix is varip(live) the other is reagular var (Bar))
update(log, live, live_console, log_console, live_lbl, log_lbl)
Put at the very end of your code / This updates all of the consoles
Parameters:
log : This matrix is the one used for Bar updates
live : This matrix is the one used for Real Time updates
live_console : on_offs for the consoles and lbls - call in the update function
log_console : on_offs for the consoles and lbls - call in the update function
live_lbl : on_offs for the consoles and lbls - call in the update function
log_lbl : on_offs for the consoles and lbls - call in the update function
Returns: void
log(log, inp, str_label, off, rows, index_cols, bars_back)
Function Will push to the Console offset to the right of Current bar, This is the main Console - it has 2 Feeds left and right (changeable)"
Parameters:
log : Matrix - Log or Live
inp : All types
str_label : (optional) This input will label it on the feed
off : Useful for when you don't want to remove the function"
rows : when printing or logging a matrix this will shorten the output will show last # of rows"
index_cols : When printing or logging a array or matrix this will shorten the array or the columns of a matrix by the #"
bars_back : Adjustment for Bars Back - Default is 1 (0 for barstate.islast)"
Returns: inp - all types (The log and print functions can be used as wrapper functions see usage below for examples)
Print(log, str_label, off, bars_back)
Function can be used to send information to a label style Console, Can be used as a wrapper function, Similar to str.format use with str()
Parameters:
log :
str_label : (optional) Can be used to label Data sent to the Console
off : Useful for when you don't want to remove the function
bars_back : Adjustment for Bars Back - Default is 1 (0 for barstate.islast)
Returns: string
print(inp, str_label, off, bars_back)
This Function can be used to send information to a label style Console, Can be used as a wrapper function, Overload print function
Parameters:
inp : All types
str_label : string (optional) Can be used to label Data sent to the Console
off : Useful for when you don't want to remove the function
bars_back : Adjustment for Bars Back - Default is 1 (0 for barstate.islast)
Returns: inp - all types (The log and print functions can be used as wrapper functions see usage below for examples)
Credits:
@kaigouthro - for the font library
@RicardoSantos - for the concept I used to make this
Thanks!
Use cases at the bottom
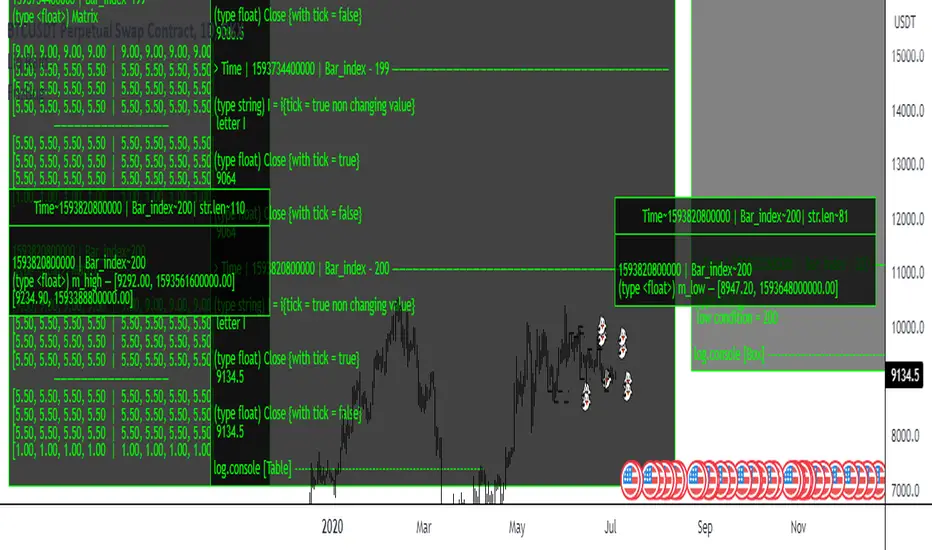
HARRISH DADE//@version=5
strategy("Nifty 15m ORB + 20 EMA + Volume - Signals Fixed", overlay=true,
initial_capital=100000, default_qty_type=strategy.percent_of_equity, default_qty_value=25,
process_orders_on_close=true)
// 15-minute timeframe check
if timeframe.period != "15"
runtime.error("Use this strategy on 15 minute timeframe only")
// ORB 9:15–9:30 High/Low
var float orbHigh = na
var float orbLow = na
newDay = ta.change(time("D")) != 0
if newDay
orbHigh := na
orbLow := na
sessStart = 0915
sessEnd = 0930
hhmm = hour * 100 + minute
inORB = hhmm >= sessStart and hhmm < sessEnd
if inORB
orbHigh := na(orbHigh) ? high : math.max(orbHigh, high)
orbLow := na(orbLow) ? low : math.min(orbLow, low)
// Plot ORB levels
plot(orbHigh, "ORB High", color=color.new(color.green, 0), linewidth=2)
plot(orbLow, "ORB Low", color=color.new(color.red, 0), linewidth=2)
// Trend filter - 20 EMA
emaLen = input.int(20, "EMA Length", minval=1)
ema20 = ta.ema(close, emaLen)
upTrend = close > ema20
dnTrend = close < ema20
plot(ema20, "EMA 20", color=color.orange, linewidth=2)
// Volume filter - Adaptive
volLen = input.int(20, "Volume MA Length", minval=1)
avgVol = ta.sma(volume, volLen)
volMult = input.float(1.5, "Volume Multiplier", step=0.1)
enoughVol = volume >= (avgVol * volMult)
// ORB complete check
orbLocked = not na(orbHigh) and not na(orbLow) and not inORB
// Entry conditions (for strategy)
longCond = orbLocked and ta.crossover(close, orbHigh) and upTrend and enoughVol
shortCond = orbLocked and ta.crossunder(close, orbLow) and dnTrend and enoughVol
// Risk Management
targetPts = input.float(40.0, "Target Points", step=1.0)
slPts = input.float(25.0, "Stoploss Points", step=1.0)
// STRATEGY ENTRIES
if longCond and strategy.position_size == 0
strategy.entry("LONG", strategy.long)
if shortCond and strategy.position_size == 0
strategy.entry("SHORT", strategy.short)
// STRATEGY EXITS
if strategy.position_size > 0
strategy.exit("LONG EXIT", from_entry="LONG",
limit=strategy.position_avg_price + targetPts,
stop=strategy.position_avg_price - slPts)
if strategy.position_size < 0
strategy.exit("SHORT EXIT", from_entry="SHORT",
limit=strategy.position_avg_price - targetPts,
stop=strategy.position_avg_price + slPts)
// **FIXED BUY/SELL SIGNALS** - No barstate.isconfirmed, direct conditions
plotshape(longCond, title="BUY", style=shape.triangleup, location=location.belowbar,
color=color.new(color.lime, 0), size=size.large, text="BUY", textcolor=color.white)
plotshape(shortCond, title="SELL", style=shape.triangledown, location=location.abovebar,
color=color.new(color.red, 0), size=size.large, text="SELL", textcolor=color.white)
// Debug table - shows if conditions met
if barstate.islast
var table debugTable = table.new(position.top_right, 2, 6, bgcolor=color.white, border_width=1)
table.cell(debugTable, 0, 0, "Condition", text_color=color.black, bgcolor=color.gray)
table.cell(debugTable, 1, 0, "Status", text_color=color.black, bgcolor=color.gray)
table.cell(debugTable, 0, 1, "ORB Locked", text_color=color.black)
table.cell(debugTable, 1, 1, str.tostring(orbLocked), text_color=orbLocked ? color.green : color.red)
table.cell(debugTable, 0, 2, "UpTrend", text_color=color.black)
table.cell(debugTable, 1, 2, str.tostring(upTrend), text_color=upTrend ? color.green : color.red)
table.cell(debugTable, 0, 3, "Enough Vol", text_color=color.black)
table.cell(debugTable, 1, 3, str.tostring(enoughVol), text_color=enoughVol ? color.green : color.red)
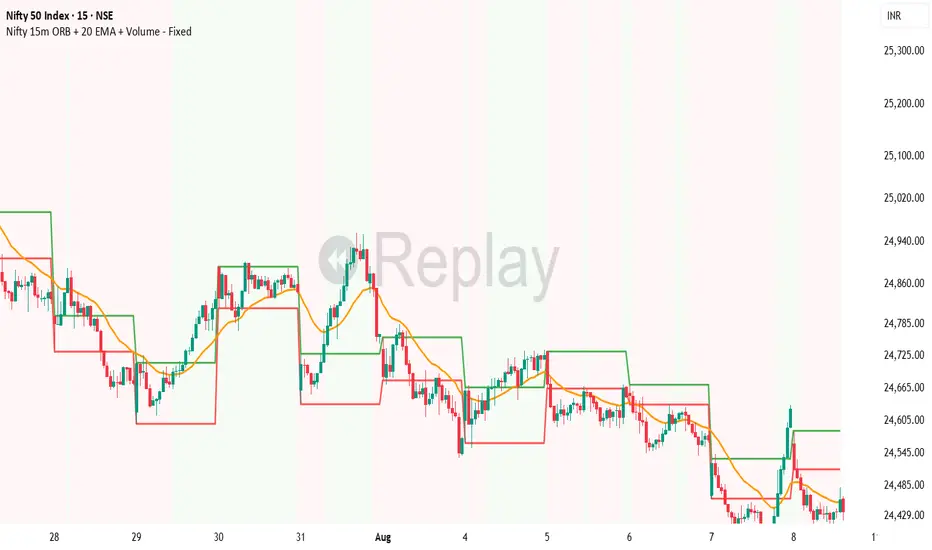
TimeLibraryLibrary "TimeLibrary"
TODO: add library description here
Line_Type_Control(Type)
Line_Type_Control: This function changes between common line types options available are "Solid","Dashed","Dotted"
Parameters:
Type (string) : : The string to choose the line type from
Returns: Line_Type : returns the pine script equivalent of the string input
Text_Size_Switch(Text_Size)
Text_Size_Switch : This function changes between common text sizes options are "Normal", "Tiny", "Small", "Large", "Huge", "Auto"
Parameters:
Text_Size (string) : : The string to choose the text type from
Returns: Text_Type : returns the pine script equivalent of the string input
TF(TF_Period, TF_Multip)
TF generates a string representation of a time frame based on the provided time frame unit (`TF_Period`) and multiplier (`TF_Multip`).
Parameters:
TF_Period (simple string)
TF_Multip (simple int)
Returns: A string that represents the time frame in Pine Script format, depending on the `TF_Period`:
- For "Minute", it returns the multiplier as a string (e.g., "5" for 5 minutes).
- For "Hour", it returns the equivalent number of minutes (e.g., "120" for 2 hours).
- For "Day", it appends "D" to the multiplier (e.g., "2D" for 2 days).
- For "Week", it appends "W" to the multiplier (e.g., "1W" for 1 week).
- For "Month", it appends "M" to the multiplier (e.g., "3M" for 3 months).
If none of these cases match, it returns the current chart's time frame.
TF_Display(Chart_as_Timeframe, TF_Period, TF_Multip)
TF_Display generates a string representation of a time frame based on user-defined inputs or the current chart's time frame settings.
Parameters:
Chart_as_Timeframe (bool) : (bool): Determines whether to use the current chart's time frame or a custom time frame.
TF_Period` (string): The time frame unit (e.g., "Minute", "Hour", "Day", "Week", "Month").
TF_Multip` (int): The multiplier for the time frame (e.g., 15 for 15 minutes, 2 for 2 days).
TF_Period (string)
TF_Multip (int)
Returns: If `Chart_as_Timeframe` is `false`, the function returns a time frame string based on the provided `TF_Period` and `TF_Multip` values (e.g., "5Min", "2D").
If `Chart_as_Timeframe` is `true`, the function determines the current chart's time frame and returns it as a string:
For minute-based time frames, it returns the number of minutes with "Min" (e.g., "15Min") unless it's an exact hour, in which case it returns the hour (e.g., "1H").
For daily, weekly, and monthly time frames, it returns the multiplier with the appropriate unit (e.g., "1D" for daily, "1W" for weekly, "1M" for monthly).
MTF_MS_Display(Chart_as_Timeframe, TF_Period, TF_Multip, Swing_Length)
MTF_MS_Display This function calculates and returns a modified swing length value based on the selected time frame and current chart's time frame.
Parameters:
Chart_as_Timeframe (bool)
TF_Period (string)
TF_Multip (int)
Swing_Length (int)
HTF_Structure_Control(Chart_as_Timeframe, Show_Only_On_Lower_Timeframes, TF_Period, TF_Multip)
Parameters:
Chart_as_Timeframe (bool)
Show_Only_On_Lower_Timeframes (bool)
TF_Period (string)
TF_Multip (int)

BoxLine_LibLibrary "BoxLine_Lib"
personal Library for line and box built in functions
lineXY(x)
get x1,y1,x2,y2 in a tuple
Parameters:
x : TODO: line
Returns: tuple of x1,y1,x2,y2
line(x)
Create line with only the y1 value(when line == na) or all
when line != na set x1,y1,x2,y2 individually just 1 or all
- use just the line value to set the x2 to current bar or time will set to time
- will auto pick xloc.bar_index or xloc.bar_time if not used
Parameters:
x : (line line,int x1,float y1,int x2,float y2,
string xloc,string extend,color color,string style,int width)
Returns: Line
boxXY(x)
get left,top,right,bottom in a tuple
Parameters:
x : box
Returns: tuple of left,top,right,bottom
box(x)
Create line with only the top,bottom value(when line == na) or all
when box != na set left,top,right,bottom individually just 1 or all
- use just the box value to set the right to current bar or time will set to time
- if right is above a number that a bar_index wouldnt be
Parameters:
x : box box,int left,float top,int right,
float bottom,color border_color, int border_width,
string border_style,string extend,string xloc,
color bgcolor,string text,string text_size, color text_color,
string text_halign,string text_valign,string text_wrap)
Returns: TODO: Box
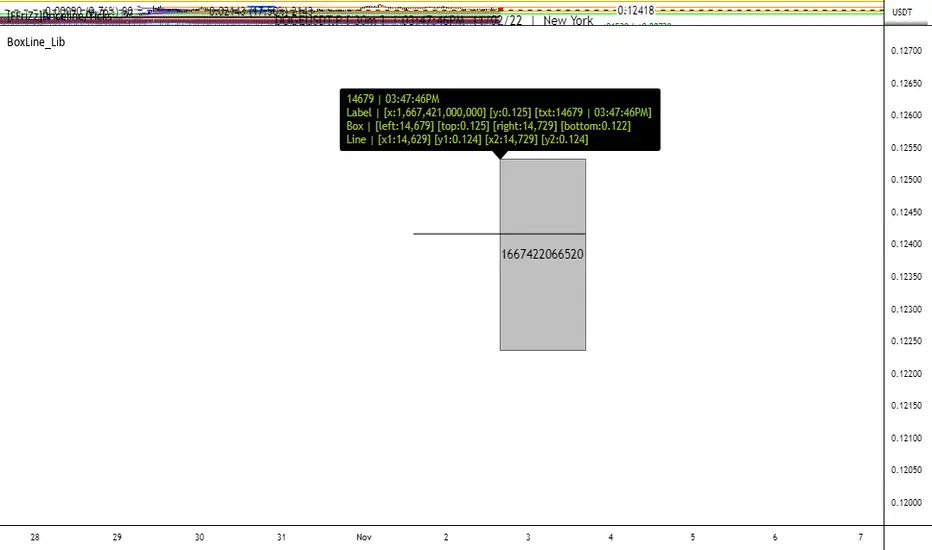
Mars Signals - Ultimate Institutional Suite v3.0(Joker)Comprehensive Trading Manual
Mars Signals – Ultimate Institutional Suite v3.0 (Joker)
## Chapter 1 – Philosophy & System Architecture
This script is not a simple “buy/sell” indicator.
Mars Signals – UIS v3.0 (Joker) is designed as an institutional-style analytical assistant that layers several methodologies into a single, coherent framework.
The system is built on four core pillars:
1. Smart Money Concepts (SMC)
- Detection of Order Blocks (professional demand/supply zones).
- Detection of Fair Value Gaps (FVGs) (price imbalances).
2. Smart DCA Strategy
- Combination of RSI and Bollinger Bands
- Identifies statistically discounted zones for scaling into spot positions or exiting shorts.
3. Volume Profile (Visible Range Simulation)
- Distribution of volume by price, not by time.
- Identification of POC (Point of Control) and high-/low-volume areas.
4. Wyckoff Helper – Spring
- Detection of bear traps, liquidity grabs, and sharp bullish reversals.
All four pillars feed into a Confluence Engine (Scoring System).
The final output is presented in the Dashboard, with a clear, human-readable signal:
- STRONG LONG 🚀
- WEAK LONG ↗
- NEUTRAL / WAIT
- WEAK SHORT ↘
- STRONG SHORT 🩸
This allows the trader to see *how many* and *which* layers of the system support a bullish or bearish bias at any given time.
## Chapter 2 – Settings Overview
### 2.1 General & Dashboard Group
- Show Dashboard Panel (`show_dash`)
Turns the dashboard table in the corner of the chart ON/OFF.
- Show Signal Recommendation (`show_rec`)
- If enabled, the textual signal (STRONG LONG, WEAK SHORT, etc.) is displayed.
- If disabled, you only see feature status (ON/OFF) and the current price.
- Dashboard Position (`dash_pos`)
Determines where the dashboard appears on the chart:
- `Top Right`
- `Bottom Right`
- `Top Left`
### 2.2 Smart Money (SMC) Group
- Enable SMC Strategy (`show_smc`)
Globally enables or disables the Order Block and FVG logic.
- Order Block Pivot Lookback (`ob_period`)
Main parameter for detecting key pivot highs/lows (swing points).
- Default value: 5
- Concept:
A bar is considered a pivot low if its low is lower than the lows of the previous 5 and the next 5 bars.
Similarly, a pivot high has a high higher than the previous 5 and the next 5 bars.
These pivots are used as anchors for Order Blocks.
- Increasing `ob_period`:
- Fewer levels.
- But levels tend to be more significant and reliable.
- In highly volatile markets (major news, war events, FOMC, etc.),
using values 7–10 is recommended to filter out weak levels.
- Show Fair Value Gaps (`show_fvg`)
Enables/disables the drawing of FVG zones (imbalances).
- Bullish OB Color (`c_ob_bull`)
- Color of Bullish Order Blocks (Demand Zones).
- Default: semi-transparent green (transparency ≈ 80).
- Bearish OB Color (`c_ob_bear`)
- Color of Bearish Order Blocks (Supply Zones).
- Default: semi-transparent red.
- Bullish FVG Color (`c_fvg_bull`)
- Color of Bullish FVG (upward imbalance), typically yellow.
- Bearish FVG Color (`c_fvg_bear`)
- Color of Bearish FVG (downward imbalance), typically purple.
### 2.3 Smart DCA Strategy Group
- Enable DCA Zones (`show_dca`)
Enables the Smart DCA logic and visual labels.
- RSI Length (`rsi_len`)
Lookback period for RSI (default: 14).
- Shorter → more sensitive, more noise.
- Longer → fewer signals, higher reliability.
- Bollinger Bands Length (`bb_len`)
Moving average period for Bollinger Bands (default: 20).
- BB Multiplier (`bb_mult`)
Standard deviation multiplier for Bollinger Bands (default: 2.0).
- For extremely volatile markets, values like 2.5–3.0 can be used so that only extreme deviations trigger a DCA signal.
### 2.4 Volume Profile (Visible Range Sim) Group
- Show Volume Profile (`show_vp`)
Enables the simulated Volume Profile bars on the right side of the chart.
- Volume Lookback Bars (`vp_lookback`)
Number of bars used to compute the Volume Profile (default: 150).
- Higher values → broader historical context, heavier computation.
- Row Count (`vp_rows`)
Number of vertical price segments (rows) to divide the total price range into (default: 30).
- Width (%) (`vp_width`)
Relative width of each volume bar as a percentage.
In the code, bar widths are scaled relative to the row with the maximum volume.
> Technical note: Volume Profile calculations are executed only on the last bar (`barstate.islast`) to keep the script performant even on higher timeframes.
### 2.5 Wyckoff Helper Group
- Show Wyckoff Events (`show_wyc`)
Enables detection and plotting of Wyckoff Spring events.
- Volume MA Length (`vol_ma_len`)
Length of the moving average on volume.
A bar is considered to have Ultra Volume if its volume is more than 2× the volume MA.
## Chapter 3 – Smart Money Strategy (Order Blocks & FVG)
### 3.1 What Is an Order Block?
An Order Block (OB) represents the footprint of large institutional orders:
- Bullish Order Block (Demand Zone)
The last selling region (bearish candle/cluster) before a strong upward move.
- Bearish Order Block (Supply Zone)
The last buying region (bullish candle/cluster) before a strong downward move.
Institutions and large players place heavy orders in these regions. Typical price behavior:
- Price moves away from the zone.
- Later returns to the same zone to fill unfilled orders.
- Then continues the larger trend.
In the script:
- If `pl` (pivot low) forms → a Bullish OB is created.
- If `ph` (pivot high) forms → a Bearish OB is created.
The box is drawn:
- From `bar_index ` to `bar_index`.
- Between `low ` and `high `.
- `extend=extend.right` extends the OB into the future, so it acts as a dynamic support/resistance zone.
- Only the last 4 OB boxes are kept to avoid clutter.
### 3.2 Order Block Color Guide
- Semi-transparent Green (`c_ob_bull`)
- Represents a Bullish Order Block (Demand Zone).
- Interpretation: a price region with a high probability of bullish reaction.
- Semi-transparent Red (`c_ob_bear`)
- Represents a Bearish Order Block (Supply Zone).
- Interpretation: a price region with a high probability of bearish reaction.
Overlap (Multiple OBs in the Same Area)
When two or more Order Blocks overlap:
- The shared area appears visually denser/stronger.
- This suggests higher order density.
- Such zones can be treated as high-priority levels for entries, exits, and stop-loss placement.
### 3.3 Demand/Supply Logic in the Scoring Engine
is_in_demand = low <= ta.lowest(low, 20)
is_in_supply = high >= ta.highest(high, 20)
- If current price is near the lowest lows of the last 20 bars, it is considered in a Demand Zone → positive impact on score.
- If current price is near the highest highs of the last 20 bars, it is considered in a Supply Zone → negative impact on score.
This logic complements Order Blocks and helps the Dashboard distinguish whether:
- Market is currently in a statistically cheap (long-friendly) area, or
- In a statistically expensive (short-friendly) area.
### 3.4 Fair Value Gaps (FVG)
#### Concept
When the market moves aggressively:
- Some price levels are skipped and never traded.
- A gap between wicks/shadows of consecutive candles appears.
- These regions are called Fair Value Gaps (FVGs) or Imbalances.
The market generally “dislikes” imbalance and often:
- Returns to these zones in the future.
- Fills the gap (rebalance).
- Then resumes its dominant direction.
#### Implementation in the Code
Bullish FVG (Yellow)
fvg_bull_cond = show_smc and show_fvg and low > high and close > high
if fvg_bull_cond
box.new(bar_index , high , bar_index, low, ...)
Core condition:
`low > high ` → the current low is above the high of two bars ago; the space between them is an untraded gap.
Bearish FVG (Purple)
fvg_bear_cond = show_smc and show_fvg and high < low and close < low
if fvg_bear_cond
box.new(bar_index , low , bar_index, high, ...)
Core condition:
`high < low ` → the current high is below the low of two bars ago; again a price gap exists.
#### FVG Color Guide
- Transparent Yellow (`c_fvg_bull`) – Bullish FVG
Often acts like a magnet for price:
- Price tends to retrace into this zone,
- Fill the imbalance,
- And then continue higher.
- Transparent Purple (`c_fvg_bear`) – Bearish FVG
Price tends to:
- Retrace upward into the purple area,
- Fill the imbalance,
- And then resume downward movement.
#### Trading with FVGs
- FVGs are *not* standalone entry signals.
They are best used as:
- Targets (take-profit zones), or
- Reaction areas where you expect a pause or reversal.
Examples:
- If you are long, a bearish FVG above is often an excellent take-profit zone.
- If you are short, a bullish FVG below is often a good cover/exit zone.
### 3.5 Core SMC Trading Templates
#### Reversal Long
1. Price trades down into a green Order Block (Demand Zone).
2. A bullish confirmation candle (Close > Open) forms inside or just above the OB.
3. If this zone is close to or aligned with a bullish FVG (yellow), the signal is reinforced.
4. Entry:
- At the close of the confirmation candle, or
- Using a limit order near the upper boundary of the OB.
5. Stop-loss:
- Slightly below the OB.
- If the OB is broken decisively and price consolidates below it, the zone loses validity.
6. Targets:
- The next FVG,
- Or the next red Order Block (Supply Zone) above.
#### Reversal Short
The mirror scenario:
- Price rallies into a red Order Block (Supply).
- A bearish confirmation candle forms (Close < Open).
- FVG/premium structure above can act as a confluence.
- Stop-loss goes above the OB.
- Targets: lower FVGs or subsequent green OBs below.
## Chapter 4 – Smart DCA Strategy (RSI + Bollinger Bands)
### 4.1 Smart DCA Concept
- Classic DCA = buying at fixed time intervals regardless of price.
- Smart DCA = scaling in only when:
- Price is statistically cheaper than usual, and
- The market is in a clear oversold condition.
Code logic:
rsi_val = ta.rsi(close, rsi_len)
= ta.bb(close, bb_len, bb_mult)
dca_buy = show_dca and rsi_val < 30 and close < bb_lower
dca_sell = show_dca and rsi_val > 70 and close > bb_upper
Conditions:
- DCA Buy – Smart Scale-In Zone
- RSI < 30 → oversold.
- Close < lower Bollinger Band → price has broken below its typical volatility envelope.
- DCA Sell – Overbought/Distribution Zone
- RSI > 70 → overbought.
- Close > upper Bollinger Band → price is extended far above the mean.
### 4.2 Visual Representation on the Chart
- Green “DCA” Label Below Candle
- Shape: `labelup`.
- Color: lime background, white text.
- Meaning: statistically attractive level for laddered spot entries or short exits.
- Red “SELL” Label Above Candle
- Warning that the market is in an extended, overbought condition.
- Suitable for profit-taking on longs or considering short entries (with proper confluence and risk management).
- Light Green Background (`bgcolor`)
- When `dca_buy` is true, the candle background turns very light green (high transparency).
- This helps visually identify DCA Zones across the chart at a glance.
### 4.3 Practical Use in Trading
#### Spot Trading
Used to build a better average entry price:
- Every time a DCA label appears, allocate a fixed portion of capital (e.g., 2–5%).
- Combining DCA signals with:
- Green OBs (Demand Zones), and/or
- The Volume Profile POC
makes the zone structurally more important.
#### Futures Trading
- Longs
- Use DCA Buy signals as low-risk zones for opening or adding to longs when:
- Price is inside a green OB, or
- The Dashboard already leans LONG.
- Shorts
- Use DCA Sell signals as:
- Exit zones for longs, or
- Areas to initiate shorts with stops above structural highs.
## Chapter 5 – Volume Profile (Visible Range Simulation)
### 5.1 Concept
Traditional volume (histogram under the chart) shows volume over time.
Volume Profile shows volume by price level:
- At which prices has the highest trading activity occurred?
- Where did buyers and sellers agree the most (High Volume Nodes – HVNs)?
- Where did price move quickly due to low participation (Low Volume Nodes – LVNs)?
### 5.2 Implementation in the Script
Executed only when `show_vp` is enabled and on the last bar:
1. The last `vp_lookback` bars (default 150) are processed.
2. The minimum low and maximum high over this window define the price range.
3. This price range is divided into `vp_rows` segments (e.g., 30 rows).
4. For each row:
- All bars are scanned.
- If the mid-price `(high + low ) / 2` falls inside a row, that bar’s volume is added to the row total.
5. The row with the greatest volume is stored as `max_vol_idx` (the POC row).
6. For each row, a volume box is drawn on the right side of the chart.
### 5.3 Color Scheme
- Semi-transparent Orange
- The row with the maximum volume – the Point of Control (POC).
- Represents the strongest support/resistance level from a volume perspective.
- Semi-transparent Blue
- Other volume rows.
- The taller the bar → the higher the volume → the stronger the interest at that price band.
### 5.4 Trading Applications
- If price is above POC and retraces back into it:
→ POC often acts as support, suitable for long setups.
- If price is below POC and rallies into it:
→ POC often acts as resistance, suitable for short setups or profit-taking.
HVNs (Tall Blue Bars)
- Represent areas of equilibrium where the market has spent time and traded heavily.
- Price tends to consolidate here before choosing a direction.
LVNs (Short or Nearly Empty Bars)
- Represent low participation zones.
- Price often moves quickly through these areas – useful for targeting fast moves.
## Chapter 6 – Wyckoff Helper – Spring
### 6.1 Spring Concept
In the Wyckoff framework:
- A Spring is a false break of support.
- The market briefly trades below a well-defined support level, triggers stop losses,
then sharply reverses upward as institutional buyers absorb liquidity.
This movement:
- Clears out weak hands (retail sellers).
- Provides large players with liquidity to enter long positions.
- Often initiates a new uptrend.
### 6.2 Code Logic
Conditions for a Spring:
1. The current low is lower than the lowest low of the previous 50 bars
→ apparent break of a long-standing support.
2. The bar closes bullish (Close > Open)
→ the breakdown was rejected.
3. Volume is significantly elevated:
→ `volume > 2 × volume_MA` (Ultra Volume).
When all conditions are met and `show_wyc` is enabled:
- A pink diamond is plotted below the bar,
- With the label “Spring” – one of the strongest long signals in this system.
### 6.3 Trading Use
- After a valid Spring, markets frequently enter a meaningful bullish phase.
- The highest quality setups occur when:
- The Spring forms inside a green Order Block, and
- Near or on the Volume Profile POC.
Entries:
- At the close of the Spring bar, or
- On the first pullback into the mid-range of the Spring candle.
Stop-loss:
- Slightly below the Spring’s lowest point (wick low plus a small buffer).
## Chapter 7 – Confluence Engine & Dashboard
### 7.1 Scoring Logic
For each bar, the script:
1. Resets `score` to 0.
2. Adjusts the score based on different signals.
SMC Contribution
if show_smc
if is_in_demand
score += 1
if is_in_supply
score -= 1
- Being in Demand → `+1`
- Being in Supply → `-1`
DCA Contribution
if show_dca
if dca_buy
score += 2
if dca_sell
score -= 2
- DCA Buy → `+2` (strong, statistically driven long signal)
- DCA Sell → `-2`
Wyckoff Spring Contribution
if show_wyc
if wyc_spring
score += 2
- Spring → `+2` (entry of strong money)
### 7.2 Mapping Score to Dashboard Signal
- score ≥ 2 → STRONG LONG 🚀
Multiple bullish conditions aligned.
- score = 1 → WEAK LONG ↗
Some bullish bias, but only one layer clearly positive.
- score = 0 → NEUTRAL / WAIT
Rough balance between buying and selling forces; staying flat is usually preferable.
- score = -1 → WEAK SHORT ↘
Mild bearish bias, suited for cautious or short-term plays.
- score ≤ -2 → STRONG SHORT 🩸
Convergence of several bearish signals.
### 7.3 Dashboard Structure
The dashboard is a two-column table:
- Row 0
- Column 0: `"Mars Signals"` – black background, white text.
- Column 1: `"UIS v3.0"` – black background, yellow text.
- Row 1
- Column 0: `"Price:"` (light grey background).
- Column 1: current closing price (`close`) with a semi-transparent blue background.
- Row 2
- Column 0: `"SMC:"`
- Column 1:
- `"ON"` (green) if `show_smc = true`
- `"OFF"` (grey) otherwise.
- Row 3
- Column 0: `"DCA:"`
- Column 1:
- `"ON"` (green) if `show_dca = true`
- `"OFF"` (grey) otherwise.
- Row 4
- Column 0: `"Signal:"`
- Column 1: signal text (`status_txt`) with background color `status_col`
(green, red, teal, maroon, etc.)
- If `show_rec = false`, these cells are cleared.
## Chapter 8 – Visual Legend (Colors, Shapes & Actions)
For quick reading inside TradingView, the visual elements are described line by line instead of a table.
Chart Element: Green Box
Color / Shape: Transparent green rectangle
Core Meaning: Bullish Order Block (Demand Zone)
Suggested Trader Response: Look for longs, Smart DCA adds, closing or reducing shorts.
Chart Element: Red Box
Color / Shape: Transparent red rectangle
Core Meaning: Bearish Order Block (Supply Zone)
Suggested Trader Response: Look for shorts, or take profit on existing longs.
Chart Element: Yellow Area
Color / Shape: Transparent yellow zone
Core Meaning: Bullish FVG / upside imbalance
Suggested Trader Response: Short take-profit zone or expected rebalance area.
Chart Element: Purple Area
Color / Shape: Transparent purple zone
Core Meaning: Bearish FVG / downside imbalance
Suggested Trader Response: Long take-profit zone or temporary supply region.
Chart Element: Green "DCA" Label
Color / Shape: Green label with white text, plotted below the candle
Core Meaning: Smart ladder-in buy zone, DCA buy opportunity
Suggested Trader Response: Spot DCA entry, partial short exit.
Chart Element: Red "SELL" Label
Color / Shape: Red label with white text, plotted above the candle
Core Meaning: Overbought / distribution zone
Suggested Trader Response: Take profit on longs, consider initiating shorts.
Chart Element: Light Green Background (bgcolor)
Color / Shape: Very transparent light-green background behind bars
Core Meaning: Active DCA Buy zone
Suggested Trader Response: Treat as a discount zone on the chart.
Chart Element: Orange Bar on Right
Color / Shape: Transparent orange horizontal bar in the volume profile
Core Meaning: POC – price with highest traded volume
Suggested Trader Response: Strong support or resistance; key reference level.
Chart Element: Blue Bars on Right
Color / Shape: Transparent blue horizontal bars in the volume profile
Core Meaning: Other volume levels, showing high-volume and low-volume nodes
Suggested Trader Response: Use to identify balance zones (HVN) and fast-move corridors (LVN).
Chart Element: Pink "Spring" Diamond
Color / Shape: Pink diamond with white text below the candle
Core Meaning: Wyckoff Spring – liquidity grab and potential major bullish reversal
Suggested Trader Response: One of the strongest long signals in the suite; look for high-quality long setups with tight risk.
Chart Element: STRONG LONG in Dashboard
Color / Shape: Green background, white text in the Signal row
Core Meaning: Multiple bullish layers in confluence
Suggested Trader Response: Consider initiating or increasing longs with strict risk management.
Chart Element: STRONG SHORT in Dashboard
Color / Shape: Red background, white text in the Signal row
Core Meaning: Multiple bearish layers in confluence
Suggested Trader Response: Consider initiating or increasing shorts with a logical, well-placed stop.
## Chapter 9 – Timeframe-Based Trading Playbook
### 9.1 Timeframe Selection
- Scalping
- Timeframes: 1M, 5M, 15M
- Objective: fast intraday moves (minutes to a few hours).
- Recommendation: focus on SMC + Wyckoff.
Smart DCA on very low timeframes may introduce excessive noise.
- Day Trading
- Timeframes: 15M, 1H, 4H
- Provides a good balance between signal quality and frequency.
- Recommendation: use the full stack – SMC + DCA + Volume Profile + Wyckoff + Dashboard.
- Swing Trading & Position Investing
- Timeframes: Daily, Weekly
- Emphasis on Smart DCA + Volume Profile.
- SMC and Wyckoff are used mainly to fine-tune swing entries within larger trends.
### 9.2 Scenario A – Scalping Long
Example: 5-Minute Chart
1. Price is declining into a green OB (Bullish Demand).
2. A candle with a long lower wick and bullish close (Pin Bar / Rejection) forms inside the OB.
3. A Spring diamond appears below the same candle → very strong confluence.
4. The Dashboard shows at least WEAK LONG ↗, ideally STRONG LONG 🚀.
5. Entry:
- On the close of the confirmation candle, or
- On the first pullback into the mid-range of that candle.
6. Stop-loss:
- Slightly below the OB.
7. Targets:
- Nearby bearish FVG above, and/or
- The next red OB.
### 9.3 Scenario B – Day-Trading Short
Recommended Timeframes: 1H or 4H
1. The market completes a strong impulsive move upward.
2. Price enters a red Order Block (Supply).
3. In the same zone, a purple FVG appears or remains unfilled.
4. On a lower timeframe (e.g., 15M), RSI enters overbought territory and a DCA Sell signal appears.
5. The main timeframe Dashboard (1H) shows WEAK SHORT ↘ or STRONG SHORT 🩸.
Trade Plan
- Open a short near the upper boundary of the red OB.
- Place the stop above the OB or above the last swing high.
- Targets:
- A yellow FVG lower on the chart, and/or
- The next green OB (Demand) below.
### 9.4 Scenario C – Swing / Investment with Smart DCA
Timeframes: Daily / Weekly
1. On the daily or weekly chart, each time a green “DCA” label appears:
- Allocate a fixed fraction of your capital (e.g., 3–5%) to that asset.
2. Check whether this DCA zone aligns with the orange POC of the Volume Profile:
- If yes → the quality of the entry zone is significantly higher.
3. If the DCA signal sits inside a daily green OB, the probability of a medium-term bottom increases.
4. Always build the position laddered, never all-in at a single price.
Exits for investors:
- Near weekly red OBs or large purple FVG zones.
- Ideally via partial profit-taking rather than closing 100% at once.
### 9.5 Case Study 1 – BTCUSDT (15-Minute)
- Context: Price has sold off down towards 65,000 USD.
- A green OB had previously formed at that level.
- Near the lower boundary of this OB, a partially filled yellow FVG is present.
- As price returns to this region, a Spring appears.
- The Dashboard shifts from NEUTRAL / WAIT to WEAK LONG ↗.
Plan
- Enter a long near the OB low.
- Place stop below the Spring low.
- First target: a purple FVG around 66,200.
- Second (optional) target: the first red OB above that level.
### 9.6 Case Study 2 – Meme Coin (PEPE – 4H)
- After a strong pump, price enters a corrective phase.
- On the 4H chart, RSI drops below 30; price breaks below the lower Bollinger Band → a DCA label prints.
- The Volume Profile shows the POC at approximately the same level.
- The Dashboard displays STRONG LONG 🚀.
Plan
- Execute laddered buys in the combined DCA + POC zone.
- Place a protective stop below the last significant swing low.
- Target: an expected 20–30% upside move towards the next red OB or purple FVG.
## Chapter 10 – Risk Management, Psychology & Advanced Tuning
### 10.1 Risk Management
No signal, regardless of its strength, replaces risk control.
Recommendations:
- In futures, do not expose more than 1–3% of account equity to risk per trade.
- Adjust leverage to the volatility of the instrument (lower leverage for highly volatile altcoins).
- Place stop-losses in zones where the idea is clearly invalidated:
- Below/above the relevant Order Block or Spring, not randomly in the middle of the structure.
### 10.2 Market-Specific Parameter Tuning
- Calmer Markets (e.g., major FX pairs)
- `ob_period`: 3–5.
- `bb_mult`: 2.0 is usually sufficient.
- Highly Volatile Markets (Crypto, news-driven assets)
- `ob_period`: 7–10 to highlight only the most robust OBs.
- `bb_mult`: 2.5–3.0 so that only extreme deviations trigger DCA.
- `vol_ma_len`: increase (e.g., to ~30) so that Spring triggers only on truly exceptional
volume spikes.
### 10.3 Trading Psychology
- STRONG LONG 🚀 does not mean “risk-free”.
It means the probability of a successful long, given the model’s logic, is higher than average.
- Treat Mars Signals as a confirmation and context system, not a full replacement for your own decision-making.
- Example of disciplined thinking:
- The Dashboard prints STRONG LONG,
- But price is simultaneously testing a multi-month macro resistance or a major negative news event is imminent,
- In such cases, trade smaller, widen stops appropriately, or skip the trade.
## Chapter 11 – Technical Notes & FAQ
### 11.1 Does the Script Repaint?
- Order Blocks and Springs are based on completed pivot structures and confirmed candles.
- Until a pivot is confirmed, an OB does not exist; after confirmation, behavior is stable under classic SMC assumptions.
- The script is designed to be structurally consistent rather than repainting signals arbitrarily.
### 11.2 Computational Load of Volume Profile
- On the last bar, the script processes up to `vp_lookback` bars × `vp_rows` rows.
- On very low timeframes with heavy zooming, this can become demanding.
- If you experience performance issues:
- Reduce `vp_lookback` or `vp_rows`, or
- Temporarily disable Volume Profile (`show_vp = false`).
### 11.3 Multi-Timeframe Behavior
- This version of the script is not internally multi-timeframe.
All logic (OB, DCA, Spring, Volume Profile) is computed on the active timeframe only.
- Practical workflow:
- Analyze overall structure and key zones on higher timeframes (4H / Daily).
- Use lower timeframes (15M / 1H) with the same tool for timing entries and exits.
## Conclusion
Mars Signals – Ultimate Institutional Suite v3.0 (Joker) is a multi-layer trading framework that unifies:
- Price structure (Order Blocks & FVG),
- Statistical behavior (Smart DCA via RSI + Bollinger),
- Volume distribution by price (Volume Profile with POC, HVN, LVN),
- Liquidity events (Wyckoff Spring),
into a single, coherent system driven by a transparent Confluence Scoring Engine.
The final output is presented in clear, actionable language:
> STRONG LONG / WEAK LONG / NEUTRAL / WEAK SHORT / STRONG SHORT
The system is designed to support professional decision-making, not to replace it.
Used together with strict risk management and disciplined execution,
Mars Signals – UIS v3.0 (Joker) can serve as a central reference manual and operational guide
for your trading workflow, from scalping to swing and investment positioning.

DrawingMethodsLibrary "DrawingMethods"
tostring(this, sortKeys, sortOrder, includeKeys)
Converts DrawingTypes/Point object to string representation
Parameters:
this : DrawingTypes/Point object
sortKeys : If set to true, string output is sorted by keys.
sortOrder : Applicable only if sortKeys is set to true. Positive number will sort them in ascending order whreas negative numer will sort them in descending order. Passing 0 will not sort the keys
includeKeys : Array of string containing selective keys. Optional parmaeter. If not provided, all the keys are considered
Returns: string representation of DrawingTypes/Point
tostring(this, sortKeys, sortOrder, includeKeys)
Converts DrawingTypes/LineProperties object to string representation
Parameters:
this : DrawingTypes/LineProperties object
sortKeys : If set to true, string output is sorted by keys.
sortOrder : Applicable only if sortKeys is set to true. Positive number will sort them in ascending order whreas negative numer will sort them in descending order. Passing 0 will not sort the keys
includeKeys : Array of string containing selective keys. Optional parmaeter. If not provided, all the keys are considered
Returns: string representation of DrawingTypes/LineProperties
tostring(this, sortKeys, sortOrder, includeKeys)
Converts DrawingTypes/Line object to string representation
Parameters:
this : DrawingTypes/Line object
sortKeys : If set to true, string output is sorted by keys.
sortOrder : Applicable only if sortKeys is set to true. Positive number will sort them in ascending order whreas negative numer will sort them in descending order. Passing 0 will not sort the keys
includeKeys : Array of string containing selective keys. Optional parmaeter. If not provided, all the keys are considered
Returns: string representation of DrawingTypes/Line
tostring(this, sortKeys, sortOrder, includeKeys)
Converts DrawingTypes/LabelProperties object to string representation
Parameters:
this : DrawingTypes/LabelProperties object
sortKeys : If set to true, string output is sorted by keys.
sortOrder : Applicable only if sortKeys is set to true. Positive number will sort them in ascending order whreas negative numer will sort them in descending order. Passing 0 will not sort the keys
includeKeys : Array of string containing selective keys. Optional parmaeter. If not provided, all the keys are considered
Returns: string representation of DrawingTypes/LabelProperties
tostring(this, sortKeys, sortOrder, includeKeys)
Converts DrawingTypes/Label object to string representation
Parameters:
this : DrawingTypes/Label object
sortKeys : If set to true, string output is sorted by keys.
sortOrder : Applicable only if sortKeys is set to true. Positive number will sort them in ascending order whreas negative numer will sort them in descending order. Passing 0 will not sort the keys
includeKeys : Array of string containing selective keys. Optional parmaeter. If not provided, all the keys are considered
Returns: string representation of DrawingTypes/Label
tostring(this, sortKeys, sortOrder, includeKeys)
Converts DrawingTypes/Linefill object to string representation
Parameters:
this : DrawingTypes/Linefill object
sortKeys : If set to true, string output is sorted by keys.
sortOrder : Applicable only if sortKeys is set to true. Positive number will sort them in ascending order whreas negative numer will sort them in descending order. Passing 0 will not sort the keys
includeKeys : Array of string containing selective keys. Optional parmaeter. If not provided, all the keys are considered
Returns: string representation of DrawingTypes/Linefill
tostring(this, sortKeys, sortOrder, includeKeys)
Converts DrawingTypes/BoxProperties object to string representation
Parameters:
this : DrawingTypes/BoxProperties object
sortKeys : If set to true, string output is sorted by keys.
sortOrder : Applicable only if sortKeys is set to true. Positive number will sort them in ascending order whreas negative numer will sort them in descending order. Passing 0 will not sort the keys
includeKeys : Array of string containing selective keys. Optional parmaeter. If not provided, all the keys are considered
Returns: string representation of DrawingTypes/BoxProperties
tostring(this, sortKeys, sortOrder, includeKeys)
Converts DrawingTypes/BoxText object to string representation
Parameters:
this : DrawingTypes/BoxText object
sortKeys : If set to true, string output is sorted by keys.
sortOrder : Applicable only if sortKeys is set to true. Positive number will sort them in ascending order whreas negative numer will sort them in descending order. Passing 0 will not sort the keys
includeKeys : Array of string containing selective keys. Optional parmaeter. If not provided, all the keys are considered
Returns: string representation of DrawingTypes/BoxText
tostring(this, sortKeys, sortOrder, includeKeys)
Converts DrawingTypes/Box object to string representation
Parameters:
this : DrawingTypes/Box object
sortKeys : If set to true, string output is sorted by keys.
sortOrder : Applicable only if sortKeys is set to true. Positive number will sort them in ascending order whreas negative numer will sort them in descending order. Passing 0 will not sort the keys
includeKeys : Array of string containing selective keys. Optional parmaeter. If not provided, all the keys are considered
Returns: string representation of DrawingTypes/Box
delete(this)
Deletes line from DrawingTypes/Line object
Parameters:
this : DrawingTypes/Line object
Returns: Line object deleted
delete(this)
Deletes label from DrawingTypes/Label object
Parameters:
this : DrawingTypes/Label object
Returns: Label object deleted
delete(this)
Deletes Linefill from DrawingTypes/Linefill object
Parameters:
this : DrawingTypes/Linefill object
Returns: Linefill object deleted
delete(this)
Deletes box from DrawingTypes/Box object
Parameters:
this : DrawingTypes/Box object
Returns: DrawingTypes/Box object deleted
delete(this)
Deletes lines from array of DrawingTypes/Line objects
Parameters:
this : Array of DrawingTypes/Line objects
Returns: Array of DrawingTypes/Line objects
delete(this)
Deletes labels from array of DrawingTypes/Label objects
Parameters:
this : Array of DrawingTypes/Label objects
Returns: Array of DrawingTypes/Label objects
delete(this)
Deletes linefill from array of DrawingTypes/Linefill objects
Parameters:
this : Array of DrawingTypes/Linefill objects
Returns: Array of DrawingTypes/Linefill objects
delete(this)
Deletes boxes from array of DrawingTypes/Box objects
Parameters:
this : Array of DrawingTypes/Box objects
Returns: Array of DrawingTypes/Box objects
clear(this)
clear items from array of DrawingTypes/Line while deleting underlying objects
Parameters:
this : array
Returns: void
clear(this)
clear items from array of DrawingTypes/Label while deleting underlying objects
Parameters:
this : array
Returns: void
clear(this)
clear items from array of DrawingTypes/Linefill while deleting underlying objects
Parameters:
this : array
Returns: void
clear(this)
clear items from array of DrawingTypes/Box while deleting underlying objects
Parameters:
this : array
Returns: void
draw(this)
Creates line from DrawingTypes/Line object
Parameters:
this : DrawingTypes/Line object
Returns: line created from DrawingTypes/Line object
draw(this)
Creates lines from array of DrawingTypes/Line objects
Parameters:
this : Array of DrawingTypes/Line objects
Returns: Array of DrawingTypes/Line objects
draw(this)
Creates label from DrawingTypes/Label object
Parameters:
this : DrawingTypes/Label object
Returns: label created from DrawingTypes/Label object
draw(this)
Creates labels from array of DrawingTypes/Label objects
Parameters:
this : Array of DrawingTypes/Label objects
Returns: Array of DrawingTypes/Label objects
draw(this)
Creates linefill object from DrawingTypes/Linefill
Parameters:
this : DrawingTypes/Linefill objects
Returns: linefill object created
draw(this)
Creates linefill objects from array of DrawingTypes/Linefill objects
Parameters:
this : Array of DrawingTypes/Linefill objects
Returns: Array of DrawingTypes/Linefill used for creating linefills
draw(this)
Creates box from DrawingTypes/Box object
Parameters:
this : DrawingTypes/Box object
Returns: box created from DrawingTypes/Box object
draw(this)
Creates labels from array of DrawingTypes/Label objects
Parameters:
this : Array of DrawingTypes/Label objects
Returns: Array of DrawingTypes/Label objects
createLabel(this, lblText, tooltip, properties)
Creates DrawingTypes/Label object from DrawingTypes/Point
Parameters:
this : DrawingTypes/Point object
lblText : Label text
tooltip : Tooltip text. Default is na
properties : DrawingTypes/LabelProperties object. Default is na - meaning default values are used.
Returns: DrawingTypes/Label object
createLine(this, other, properties)
Creates DrawingTypes/Line object from one DrawingTypes/Point to other
Parameters:
this : First DrawingTypes/Point object
other : Second DrawingTypes/Point object
properties : DrawingTypes/LineProperties object. Default set to na - meaning default values are used.
Returns: DrawingTypes/Line object
createLinefill(this, other, fillColor, transparency)
Creates DrawingTypes/Linefill object from DrawingTypes/Line object to other DrawingTypes/Line object
Parameters:
this : First DrawingTypes/Line object
other : Other DrawingTypes/Line object
fillColor : fill color of linefill. Default is color.blue
transparency : fill transparency for linefill. Default is 80
Returns: Array of DrawingTypes/Linefill object
createBox(this, other, properties, textProperties)
Creates DrawingTypes/Box object from one DrawingTypes/Point to other
Parameters:
this : First DrawingTypes/Point object
other : Second DrawingTypes/Point object
properties : DrawingTypes/BoxProperties object. Default set to na - meaning default values are used.
textProperties : DrawingTypes/BoxText object. Default is na - meaning no text will be drawn
Returns: DrawingTypes/Box object
createBox(this, properties, textProperties)
Creates DrawingTypes/Box object from DrawingTypes/Line as diagonal line
Parameters:
this : Diagonal DrawingTypes/PoLineint object
properties : DrawingTypes/BoxProperties object. Default set to na - meaning default values are used.
textProperties : DrawingTypes/BoxText object. Default is na - meaning no text will be drawn
Returns: DrawingTypes/Box object