RSI < 25 + Price Below 200 SMA (4H) - Text Signal
Price below 200MA on 4hr chart
RSI is below 25 ovsersold
Start buying small positions at every signal
Eventually price will capture the 200MA on 4hr
This will work great for NVDA, AAPL, MSFT, NFLX, PANW, AMZN, PLTR, CRWD and META.
Good for swing trading based on price action, RSI oversold and reversal
Add more on the Pin bar candles on 4hr time frame once the price is oversold.
חפש סקריפטים עבור "text"

MFI Volume Profile [Kodexius]The MFI Volume Profile indicator blends a classic volume profile with the Money Flow Index so you can see not only where volume traded, but also how strong the buying or selling pressure was at those prices. Instead of showing a simple horizontal histogram of volume, this tool adds a money flow dimension and turns the profile into a price volume momentum heat map.
The script scans a user controlled lookback window and builds a set of price levels between the lowest and highest price in that period. For every bar inside that window, its volume is distributed across the price levels that the bar actually touched, and that volume is combined with the bar’s MFI value. This creates a volume weighted average MFI for each price level, so every row of the profile knows both how much volume traded there and what the typical money flow condition was when that volume appeared.
On the chart, the indicator plots a stack of horizontal boxes to the right of current price. The length of each box represents the relative amount of volume at that price, while the color represents the average MFI there. Levels with stronger positive money flow will lean toward warmer shades, and levels with weaker or negative money flow will lean toward cooler or more neutral shades inside the configured MFI band. Each row is also labeled in the format Volume , so you can instantly read the exact volume and money flow value at that level instead of guessing.
This gives you a detailed map of where the market really cared about price, and whether that interest came with strong inflow or outflow. It can help you spot areas of accumulation, distribution, absorption, or exhaustion, and it does so in a compact visual that sits next to price without cluttering the candles themselves.
Features
Combined volume profile and MFI weighting
The indicator builds a volume profile over a user selected lookback and enriches each price row with a volume weighted average MFI. This lets you study both participation and money flow at the same price level.
Volume distributed across the bar price range
For every bar in the window, volume is not assigned to a single price. Instead, it is proportionally distributed across all price rows between the bar low and bar high. This creates a smoother and more realistic profile of where trading actually happened.
MFI based color gradient between 30 and 70
Each price row is colored according to its average MFI. The gradient is anchored between MFI values of 30 and 70, which covers typical oversold, neutral and overbought zones. This makes strong demand or distribution areas easier to spot visually.
Configurable structure resolution and depth
Main user inputs are the lookback length, the number of rows, the width of the profile in bars, and the label text size. You can quickly switch between coarse profiles for a big picture and higher resolution profiles for detailed structure.
Numeric labels with volume and MFI per row
Every box is labeled with the total volume at that level and the average MFI for that level, in the format Volume . This gives you exact values while still keeping the visual profile clean and compact.
Calculations
Money Flow Index calculation
currentMfi is calculated once using ta.mfi(hlc3, mfiLen) as usual,
Creation of the profileBins array
The script creates an array named profileBins that will hold one VPBin element per price row.
Each VPBin contains
volume which is the total volume accumulated at that price row
mfiProduct which is the sum of volume multiplied by MFI for that row
The loop;
for i = 0 to rowCount - 1 by 1
array.push(profileBins, VPBin.new(0.0, 0.0))
pre allocates a clean structure with zero values for all rows.
Finding highest and lowest price across the lookback
The script starts from the current bar high and low, then walks backward through the lookback window
for i = 0 to lookback - 1 by 1
highestPrice := math.max(highestPrice, high )
lowestPrice := math.min(lowestPrice, low )
After this loop, highestPrice and lowestPrice define the full price range covered by the chosen lookback.
Price range and step size for rows
The code computes
float rangePrice = highestPrice - lowestPrice
rangePrice := rangePrice == 0 ? syminfo.mintick : rangePrice
float step = rangePrice / rowCount
rangePrice is the total height of the profile in price terms. If the range is zero, the script replaces it with the minimum tick size for the symbol. Then step is the price height of each row. This step size is used to map any price into a row index.
Processing each bar in the lookback
For every bar index i inside the lookback, the script checks that currentMfi is not missing. If it is valid, it reads the bar high, low, volume and MFI
float barTop = high
float barBottom = low
float barVol = volume
float barMfi = currentMfi
Mapping bar prices to bin indices
The bar high and low are converted into row indices using the known lowestPrice and step
int indexTop = math.floor((barTop - lowestPrice) / step)
int indexBottom = math.floor((barBottom - lowestPrice) / step)
Then the indices are clamped into valid bounds so they stay between zero and rowCount - 1. This ensures that every bar contributes only inside the profile range
Splitting bar volume across all covered bins
Once the top and bottom indices are known, the script calculates how many rows the bar spans
int coveredBins = indexTop - indexBottom + 1
float volPerBin = barVol / coveredBins
float mfiPerBin = volPerBin * barMfi
Here the total bar volume is divided equally across all rows that the bar touches. For each of those rows, the same fraction of volume and volume times MFI is used.
Accumulating into each VPBin
Finally, a nested loop iterates from indexBottom to indexTop and updates the corresponding VPBin
for k = indexBottom to indexTop by 1
VPBin binData = array.get(profileBins, k)
binData.volume := binData.volume + volPerBin
binData.mfiProduct := binData.mfiProduct + mfiPerBin
Over all bars in the lookback window, each row builds up
total volume at that price range
total volume times MFI at that price range
Later, during the drawing stage, the script computes
avgMfi = bin.mfiProduct / bin.volume
for each row. This is the volume weighted average MFI used both for coloring the box and for the numeric MFI value shown in the label Volume .

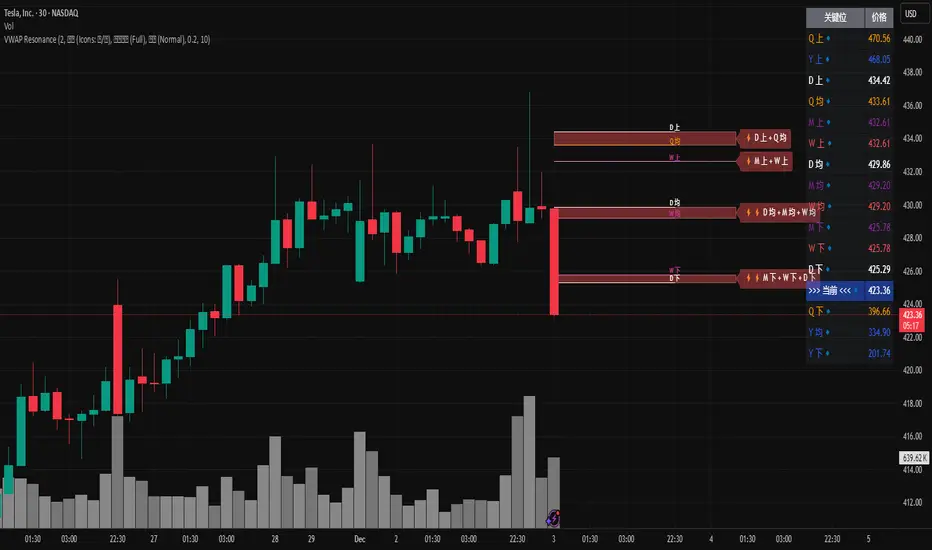
MTF VWAP Resonance [By Testeded]📈 MTF VWAP Resonance Hunter
(多级别 VWAP 共振捕猎者 - 终极版)
🇬🇧 English Description
1. Design Philosophy: The Institutional Edge
While typical indicators measure simple price action, VWAP (Volume Weighted Average Price) measures Value and Institutional Cost.
Professional traders and algorithms anchor their decisions to time-based benchmarks: Daily, Weekly, Monthly, and Quarterly. When prices return to these levels, they are testing the average cost basis of the market participants from that period.
The Logic of "Multi-Level Resonance" (MTF): A single VWAP line can be broken. However, when the Daily VWAP, Weekly Upper Band, and Quarterly Basis all overlap at the exact same price level, a "Market Consensus" is formed. This tool uses a background algorithm to detect these overlaps across 6 Timeframes (4H to Year) and visualizes them as "Resonance Boxes" instead of cluttering your chart with lines.
2. Key Features
⚓ Anchored VWAP Engine: Calculates VWAP + Standard Deviation Bands for 4H, Daily, Weekly, Monthly, Quarterly, and Yearly cycles simultaneously.
⚡ Smart Resonance Radar: Automatically detects when levels from different timeframes cluster together.
2-Line Confluence: ⚡ (Watch)
3-Line Confluence: ⚡⚡ (Strong)
4+ Line Confluence: ⚡⚡⚡ (Iron Wall)
🧘 Visual Modes (Zen / Focus):
Full Mode: Shows lines, dashboard, and resonance boxes.
Focus Mode: Hides lines, keeps dashboard and boxes.
Zen Mode: Hides EVERYTHING except the Resonance Boxes. Pure price action.
🏢 The Quarterly Line: Specifically designed to track the Quarterly VWAP, a critical level for institutional rebalancing and earnings cycles.
🎨 Customizable UI: Adjustable table text size (Small to Huge) and display styles.
3. How to Trade
Identify the Wall: Look for Red Boxes (Resistance) or Green Boxes (Support) with high star ratings (⚡⚡).
Read the Dashboard: Check the label (e.g., Q VWAP + W Lower). This tells you exactly who is defending this level (e.g., "Quarterly Buyers defending cost").
Sniper Entry: Wait for price to touch the Resonance Box. These levels often trigger sharp reversals or major breakouts.
🇨🇳 中文说明 (Chinese Description)
1. 设计哲学:多级别的全局视角
布林带反映的是波动率,而 VWAP(成交量加权平均价) 反映的是**“真金白银的持仓成本”**。
机构交易者和算法通常会锚定特定的时间周期进行交易:日内、周线、月线以及季度线。 “多级别共振”的逻辑: 单一周期的 VWAP 很容易失效。但是,当 日线 VWAP、周线上轨 和 季度线成本 在同一个价格位置重叠时,意味着短线、中线和长线资金在此处达成了**“价值共识”。 本指标通过后台算法,同时监控 6个时间周期 (4H - 年线),将这些重叠的价位转化为可视化的“共振框”**,提供一个多级别的全局视角。
2. 核心功能
⚓ 全周期锚定 VWAP:后台实时计算 4H, 日线, 周线, 月线, 季度线, 年线 的 VWAP 及其标准差轨道。
⚡ 智能共振雷达:自动检测不同周期的关键位重叠。
2线共振:⚡ (关注)
3线共振:⚡⚡ (强力支撑/阻力)
4线以上:⚡⚡⚡ (核弹级/铁壁共振)
🧘 显示模式 (Zen / Focus):
全面模式:显示所有线条 + 表格 + 共振框。
专注模式:隐藏线条,保留表格 + 共振框。
极简模式 (Zen):隐藏一切干扰,只显示共振框。像狙击手一样只看目标。
🏢 季度线增强:特别加入了 Quarterly VWAP (季度线),这是机构季末调仓和财报周期的重要防守线。
🎨 高度客制化:支持调整表格文字大小(从“小”到“巨大”),适配各种分辨率屏幕。
3. 实战用法
寻找“墙壁”:关注图表上的 红色共振框 (阻力) 或 绿色共振框 (支撑),尤其是带有 ⚡⚡ 标志的区域。
解读筹码:看一眼右上角的仪表盘标签(例如 Q VWAP + W Lower)。这意味着“季度级别的平均成本”与“周线级别的超卖线”重合,支撑力度极强。
警报交易:开启警报功能。不需要盯着屏幕,当价格撞上共振框时,指标会自动通知你。
Dual TF Bearish Divergence (Working)//@version=6
indicator("Dual TF Bearish Divergence (Working)", overlay=true)
// ----------------- SIMPLE BEARISH DIVERGENCE FUNCTION -------------------
bearDiv(src, rsiLen, lookbackMin, lookbackMax) =>
r = ta.rsi(src, rsiLen)
ph = ta.pivothigh(src, lookbackMin, lookbackMin)
ph_rsi = ta.pivothigh(r, lookbackMin, lookbackMin)
ph2 = ph
ph2_rsi = ph_rsi
priceHH = not na(ph) and not na(ph2) and ph > ph2
rsiLH = not na(ph_rsi) and not na(ph2_rsi) and ph_rsi < ph2_rsi
barsOk = lookbackMin >= lookbackMin and lookbackMin <= lookbackMax
priceHH and rsiLH and barsOk
// ----------------- TF CALLS -------------------
b60 = request.security(syminfo.tickerid, "60", bearDiv(close, 14, 10, 15))
b240 = request.security(syminfo.tickerid, "240", bearDiv(close, 14, 10, 15))
dual = b60 and b240
// ----------------- PLOT -------------------
plotshape(dual, title="Dual Bear Div", style=shape.labeldown,
color=color.red, size=size.small, text="🔻BearDiv")
// ----------------- ALERT -------------------
alertcondition(dual, "Dual Bearish Div 60+240",
"Bearish Divergence on both 60m & 240m")

Real Relative Strength Indicator### What is RRS (Real Relative Strength)?
RRS is a volatility-normalized relative strength indicator that shows you – in real time – whether your stock, crypto, or any asset is genuinely beating or lagging the broader market after adjusting for risk and volatility. Unlike the classic “price ÷ SPY” line that gets completely fooled by volatility regimes, RRS answers the only question that actually matters to professional traders:
“Is this ticker moving better (or worse) than the market on a risk-adjusted basis right now?”
It does this by measuring the excess momentum of your ticker versus a benchmark (SPY, QQQ, BTC, etc.) and then dividing that excess by the average volatility (ATR) of both instruments. The result is a clean, centered-around-zero oscillator that works the same way in calm markets, crash markets, or parabolic bull runs.
### How to Use the RRS Indicator (Aqua/Purple Area Version) in Practice
The indicator is deliberately simple to read once you know the rules:
Positive area (aqua) means genuine outperformance.
Negative area (purple) means genuine underperformance.
The farther from zero, the stronger the leadership or weakness.
#### Core Signals and How to Trade Them
- RRS crossing above zero → one of the highest-probability long signals in existence. The asset has just started outperforming the market on a risk-adjusted basis. Enter or add aggressively if price structure agrees.
- RRS crossing below zero → leadership is ending. Tighten stops, take partial or full profits, or flip short if you trade both sides.
- RRS above +2 (bright aqua area) → clear leadership. This is where the real money is made in bull markets. Trail stops, add on pullbacks, let winners run.
- RRS below –2 (bright purple area) → clear distribution or capitulation. Avoid new longs, consider short entries or protective puts.
- Extreme readings above +4 or below –4 (background tint appears) → rare, very high-conviction moves. Treat these like once-a-month opportunities.
- Divergence (not plotted here, but easy to spot visually): price making new highs while the aqua area is shrinking → distribution. Price making new lows while the purple area is shrinking → hidden buying and coming reversal.
#### Best Settings by Style and Asset Class
For stocks and ETFs: keep benchmark as SPY (or QQQ for tech-heavy names) and length 14–20 on daily/4H charts.
For crypto: change the benchmark to BTCUSD (or ETHUSD) immediately — otherwise the reading is meaningless. Length 10–14 works best on 1H–4H crypto charts because volatility is higher.
For day trading: drop length to 10–12 and use 15-minute or 5-minute charts. Signals are faster and still extremely clean.
#### Highest-Edge Setups (What Actually Prints Money)
- RRS crosses above zero while price is still below a major moving average (50 EMA, 200 SMA, etc.) → early leadership, often catches the exact bottom of a new leg up.
- RRS already deep aqua (+3 or higher) and price pulls back to support without RRS dropping below +1 → textbook add-on or re-entry zone.
- RRS deep purple and suddenly turns flat or starts curling up while price is still falling → hidden accumulation, usually the exact low tick.
That’s it. Master these few rules and the RRS becomes one of the most powerful edge tools you will ever use for rotation trading...

Goal Setting Strategies Viprasol# 🎯 Goal Setting Strategies Viprasol
A powerful goal tracking tool designed for disciplined traders who want to monitor their trading objectives, milestones, and progress directly on their charts.
## ✨ KEY FEATURES
### 📊 Flexible Goal Management
- Track anywhere from 1 to 20 trading goals simultaneously
- Adjustable goal count via simple input slider
- Each goal has its own unique emoji identifier
- Real-time progress counter
### ✅ Visual Tracking System
- Interactive checkbox system for goal completion
- Clear visual indicators (✅ completed, ⬜️ pending)
- Customizable goal names and descriptions
- Dynamic progress display
### 🎨 Full Customization
- **4 Position Options**: Top Left, Top Right, Bottom Left, Bottom Right
- **5 Font Sizes**: Tiny, Small, Normal, Large, Huge (optimized for all screen sizes)
- **Custom Colors**: Header, labels, background, achievement text
- **Premium Styling**: Modern cyber-themed design with professional appearance
### 💡 Perfect For:
- Daily/Weekly trading goal tracking
- Risk management milestones
- Profit target monitoring
- Trading plan compliance
- Personal development objectives
- Learning milestones
## 🔧 HOW TO USE
1. **Set Your Primary Goal**: Enter your main objective in "Primary Goal" field
2. **Choose Goal Count**: Select how many goals you want (1-20)
3. **Name Your Goals**: Customize each goal name in the "Goal Definitions" section
4. **Track Progress**: Check off goals as you complete them
5. **Customize Display**: Adjust colors, sizes, and position to match your chart setup
## 📐 INPUT GROUPS
### 🎯 Viprasol Goal Configuration
- Primary Goal Name
- Number of Goals (1-20)
### 📋 Goal Definitions
- All 20 goals with individual names and checkboxes
- Only enabled goals (based on count) will display
### 🌈 Premium Styling
- Goal Header Color
- Label Color
- Panel Background Color
- Achievement Color
- Header Font Size
- Milestone Font Size (Tiny/Small optimized for space)
### 📍 Elite Display
- Dashboard Position selector
## 💎 UNIQUE FEATURES
- **Space Efficient**: Tiny and Small font options for compact displays
- **Scalable**: Grow from 1 goal to 20 as your needs evolve
- **Non-Intrusive**: Overlay indicator that doesn't interfere with price action
- **Professional Design**: Clean, modern interface with cyber aesthetic
## 🎓 USE CASES
**Day Traders**: Track daily profit targets, trade count limits, max loss thresholds
**Swing Traders**: Monitor weekly/monthly goals, position management rules
**New Traders**: Learning milestones, strategy development checkpoints
**Experienced Traders**: Advanced risk management, portfolio objectives
## ⚙️ TECHNICAL DETAILS
- Version: Pine Script v5
- Type: Overlay Indicator
- Max Labels: 500
- Table-based display system
- No repainting
- Lightweight performance
## 🚀 GETTING STARTED
1. Add indicator to your chart
2. Set "Number of Goals" to your desired count (start small, scale up)
3. Customize goal names
4. Check boxes as you achieve goals
5. Watch your progress build!
## 📊 DISPLAY OPTIMIZATION
- Use "Tiny" or "Small" for maximum goals on small screens
- Use "Normal" or "Large" for standard monitors
- Use "Huge" for presentation or large displays
- Adjust position to avoid chart overlap
## 🎯 TRADING DISCIPLINE
This tool helps reinforce:
- Goal-oriented trading mindset
- Progress tracking accountability
- Milestone celebration
- Structured approach to trading development
---
**© viprasol**
*Designed for traders who take their goals seriously.*

⏰Forex Market Clock Table (DST Auto)⏰ Forex Market Clock Table (DST Auto)
Keep track of key forex session times with this clean, real-time table showing local time, market status (open/closed), and automatic Daylight Saving Time (DST) adjustments for Sydney, Tokyo, London, and New York. Displays countdowns to session open/close and highlights weekends. Fully customizable position, colors, and text size—perfect for multi-session traders.

Dark VectorThe Dark Vector is a professional-grade trend-following system designed to solve the two most common causes of trading losses: over-trading during chop and exiting trends too early.
Unlike standard indicators that continuously recalculate based on every price tick, this system operates on a strict "State Machine" logic. This means it tracks the current market phase and refuses to issue conflicting signals. If the system is Long, it mathematically cannot issue another Long signal until the previous trend has concluded.
The system relies on three core engines:
1. The Trend Architecture (Modified SuperTrend) The backbone of the system is an ATR-based trailing stop mechanism. It creates a dynamic trend line that adjusts to volatility. When volatility expands, the line widens to prevent premature stop-outs during market noise. When volatility contracts, the line tightens to protect profits.
2. The Noise Gate (Choppiness Index) This is the system's safety filter. It measures the fractal efficiency of the market—essentially determining if price is moving in a clear direction or moving sideways. When the market enters a consolidation phase (sideways chop), the Noise Gate activates, turning the candles gray and physically blocking all new entry signals. This prevents the user from entering trades in low-probability environments.
3. The Singularity State Machine This internal logic enforces trading discipline. It treats the trend as a binary state (Bullish or Bearish). It forces an alternating signal pattern, ensuring that you are only alerted to the specific moment a major trend reversal occurs, rather than being bombarded with repetitive signals during a long run.
Best Way to Use This System
To maximize profitability and minimize false positives, it is recommended to use the "Regime & Alignment" methodology outlined below.
1. The Traffic Light Rule
Before placing any trade, observe the color of the candlesticks on the chart:
Green Candles: The market is in a confirmed Bullish Impulse. You should only look for Long entries or hold existing positions. Shorting is statistically dangerous here.
Red Candles: The market is in a confirmed Bearish Impulse. You should only look for Short entries or hold cash. Buying the dip here is high-risk.
Gray Candles: The market is in a Chop/Squeeze regime. The Noise Gate is active. Do not open new positions. This indicates indecision, and the market is likely to destroy option premiums or stop out tight leverage. Wait for the candles to return to Green or Red before acting.
2. The Entry Trigger
Enter a trade only when a text label (LONG or SHORT) appears.
Long Signal: Occurs when price closes above the Trend Line AND the market is not in a Chop zone.
Short Signal: Occurs when price closes below the Trend Line AND the market is not in a Chop zone.
3. The Exit Strategy
There are two ways to manage the trade once active:
The Trend Follower (Conservative): Hold the position until the Trend Line flips color. This captures the maximum duration of the move but may give back some profit at the very end.
The Stop Loss (Active): The Trend Line (the white value in your dashboard) acts as your Trailing Stop. If a candle closes beyond this line, the trend is technically invalidated. You should exit immediately.
4. Multi-Timeframe Alignment (The Golden Rule)
The highest win rates are achieved when your trading timeframe aligns with the higher-order trend.
Step 1: Check the 4-Hour chart. Is the Trend Line Green?
Step 2: Switch to the 15-Minute chart.
Step 3: Only take the LONG signals on the 15-Minute chart. Ignore all Short signals.
Reasoning: Counter-trend trades often fail. By trading only in the direction of the higher timeframe, you are swimming with the current, not against it.
Recommended Settings by Style
Swing Trading (Daily/4H): Keep the Trend Factor at 4.0. This ignores daily noise and keeps you in the trade for weeks or months.
Day Trading (1H/15m): Lower the Trend Factor to 3.0. This makes the system more reactive to intraday reversals.
Scalping (5m): Lower the Trend Factor to 2.0 and the ATR Length to 7. This is aggressive and requires strict adherence to the Stop Loss.
Disclaimer
This indicator is for educational and informational purposes only. It does not constitute financial advice, investment advice, or a recommendation to buy or sell any asset. Trading cryptocurrencies, stocks, and futures involves a high degree of risk and the potential for significant financial loss. The user assumes all responsibility for their trading decisions. Past performance of any system or indicator is not indicative of future results. Always practice risk management and never trade with money you cannot afford to lose.

HTF Manipulation Swing Points [Pogiest]General
HTF Manipulation Swing Points plots out relevant swings on the higher timeframes selected and draws a horizontal line anchored from the extremes of the swing point. These are important levels traders can look to base entries off of. This indicator is designed to track higher timeframe swing points on a lower timeframe. It will detect a sweep (Manipulation) or a breakout/breakdown (Failure to Manipulate) based on the higher timeframe candle close.
Usage
Depending on how the higher timeframe candles engage the relevant swing points, it can assist traders on bias and direction given the higher timeframe order-flow, lower timeframe order-flow, zones, levels, etc. Manipulation of swing points can potentially signal the start of a reversal or retracement. Failure to Manipulate swing points can potentially signal continuation of the higher timeframe current trend. It is up to the trader to gauge the price action at these levels.
How the Indicator works
1. Lines (Not engaged) - Plots out line from higher timeframe swing points and extends to the right.
2. Manipulation (M) - M label will be plotted on the swing point line that has been engaged. For example, if 1 hour timeframe was selected in settings and the 1 hour swing point line is plotted on the chart, the indicator will track the first one hour candle to engage the line and wait for the 1 hour engaging candle to close before marking it out as a Manipulation label. It is deemed to be manipulation if the 1 hour candle sweeps the level and closes back into the range.
3. Failure to Manipulate (FTM) - FTM label functions the same as Manipulation in which it waits for the swing point line to be engaged in order for a label to be printed. However, if the price does not sweep the swing point, breaks through, and closes beyond the level then it would be deemed a "Failure to Manipulate".
Note: The timeframe selected in settings will match the engaging candle. For instance, if a 4 hour timeframe is selected, the next 4 hour candle that engages the swing point level will need to close before it displays a label. In addition, this indicator is designed to view on lower timeframes with higher timeframe swing points selected in Settings.
Settings
Timeframes:
1. Choose up to two timeframes for swing point levels.
2. Adjust Pivot lookback.
3. Option to change high and low line color, line style, and line width.
Timeframe Manipulation Labels:
4. Show/hide labels.
5. Option to adjust offset of labels horizontally/vertically for each high or low line.
6. Option to change label colors, label size, and text color.
Line Tags:
7. Show/hide line end tags.
8. Option to change tag size and tag color.
9. Adjust offset of tags.
Overlap Detection:
10. Adjust overlap threshold percentage.
11. Adjust label shift amount (for when labels are overlapping each other).
Alerts:
12. Option to enable/disable all alerts. Select different alerts for each timeframe (i.e. manipulate alert or failure to manipulate alert).
Risk Disclaimer
This indicator is for educational and informational purposes only and does not constitute financial advice. All trading and investment decisions remain solely the responsibility of the user.
Trading involves a high degree of risk, and past performance is not indicative of future results.
Always conduct your own research and consult with a qualified financial professional before making any trading decisions.
By using this indicator, users acknowledge they understand these risks and accept full responsibility for their trading decisions and outcomes.

Current Price Label & Line📊 Current Price Label & Line Indicator
Keep track of the current price with style! This indicator displays a clean, customizable price label alongside a horizontal reference line that makes it easy to see exactly where price is trading at a glance.
✨ Key Features
The indicator creates a dynamic label that shows the current closing price with precision formatting matched to your chart's tick size. Position the label anywhere you want using the bar offset control, allowing you to keep it visible without cluttering your price action. The accompanying horizontal line extends across your chart, providing a clear visual reference point.
🎨 Full Customization
Make it match your trading style perfectly. Choose from five font sizes ranging from tiny to huge, ensuring readability on any screen size or chart layout. Customize the label background color, text color, and line color independently to match your chart theme or personal preferences. You can even adjust the line width for subtle or bold emphasis depending on your needs.
🎯 Perfect For
Day traders who need quick price reference at a glance. Chart analysts who want clean, professional-looking price markers. Anyone who prefers a minimalist approach to price tracking without unnecessary indicators cluttering their workspace.
💡 How It Works
The indicator automatically updates with each new bar, keeping your price display current. The label floats at your chosen offset from the current bar, while the line extends left across your chart history. Everything is clean, efficient, and designed to stay out of your way while providing essential information.
Simple to set up, easy to customize, and lightweight on your chart. Add it once and adjust the settings to your preference—it just works!

GENESIS DHANUS A clean, non-repainting trend-following signal indicator.
Buy signals appear when:
• Fast EMA (9) crosses above Slow EMA (21)
• RSI > 50 (bullish momentum)
• Previous bar volume > 1.5× 20-period average
• Price is above the current Heikin-Ashi "trend level"
Sell signals use the exact opposite conditions.
All conditions use confirmed data only (no future leak, no repainting).
Perfect for swing trading and alert setups on any timeframe.
Features:
- Large clear arrows with text
- Optional light background coloring
- Precise alert conditions
- EMA lines can be toggled
100% Pine Script v5 – open source and free.

Intraday Day-Trade Scanner//@version=5
indicator("Intraday Day-Trade Scanner", overlay=true)
// ----- Inputs -----
minFloat = input.int(10000000, "Min Float")
maxFloat = input.int(20000000, "Max Float")
minPrice = input.float(3, "Min Price")
maxPrice = input.float(50, "Max Price")
minRVOL = input.float(1.5, "Min Relative Volume")
minAtrPct = input.float(1.0, "Min ATR %")
maxAtrPct = input.float(5.0, "Max ATR %")
useLong = input.bool(true, "Long scan (above VWAP)")
useShort = input.bool(false, "Short scan (below VWAP)")
// ----- Data -----
float = request.financial(syminfo.tickerid, "FLOAT", "FQ")
avgVol = ta.sma(volume, 20)
rvol = volume / avgVol
atr = ta.atr(14)
atrPct = (atr / close) * 100
// VWAP
vwap = ta.vwap(close)
// ----- Conditions -----
floatOK = float >= minFloat and float <= maxFloat
priceOK = close >= minPrice and close <= maxPrice
rvolOK = rvol >= minRVOL
atrOK = atrPct >= minAtrPct and atrPct <= maxAtrPct
longOK = useLong and close > vwap
shortOK = useShort and close < vwap
qualified = floatOK and priceOK and rvolOK and atrOK and (longOK or shortOK)
// ----- Plot label on chart -----
plotshape(qualified,title ="Qualified Stock", text="SCAN HIT", style=shape.labelup, size=size.small, color=color.new(color.green, 0))
// ----- Alerts -----
alertcondition(qualified, title="Trade Candidate Found", message="This stock meets your day-trade scan criteria!")

Pure FVG [Textbook]1. The Core Concept
This is not a standard "show all gaps" indicator. It is a specific entry signal generator based on Smart Money Concepts (SMC).
It focuses on Consequent Encroachment (The 50% Level). The underlying principle is that a Fair Value Gap (FVG) represents a market inefficiency where opposing traders are trapped. When price retraces at least 50% back into this gap, it creates pressure as these trapped positions look to exit—either through stop-losses or position reversal. This makes the gap most likely to act as a reversal zone.
2. How It Works (The Lifecycle)
The indicator logic follows a strict sequence of events. A signal is generated only if all conditions are met in order:
-- Phase 1: Identification (The Fresh Gap)
The script scans for the classic 3-candle FVG pattern (where the 1st and 3rd candles do not overlap).
Visual: It draws a box (Green for Bullish, Red for Bearish) extending to the right.
The 50% Line: A dashed line is drawn through the center of the gap.
-- Phase 2: Mitigation (The Gray Zone)
This is the critical filter. The indicator waits for a candle to CLOSE past the 50% dashed line.
Once this happens, the gap is considered "Deeply Mitigated."
Visual: The box changes color to Gray. This tells the trader: "Price is deep in the zone, watch for a reaction."
-- Phase 3: The Signal (Rejection)
Once the box is Gray, the script watches for a "Rejection Candle."
Bullish Scenario: Price is deep in the gap (Gray). The script waits for a candle to close higher than it opened (a green candle).
Bearish Scenario: Price is deep in the gap (Gray). The script waits for a candle to close lower than it opened (a red candle).
Visual: A Triangle Label (▲ or ▼) appears, signaling an entry.
-- Phase 4: Invalidation
If the price closes completely past the far edge of the box (the Stop Loss level), the box is deleted immediately.
3. Key Options
These are the most important settings for the user:
-- Min Gap Size (%):
Filters out "noise." It ensures the script ignores tiny, insignificant gaps that are less than X% in height.
-- Max Visible Gaps:
Keeps your chart clean. It limits how many open boxes can be on the screen at once (e.g., only show the last 3 unclosed gaps).
-- Show Signal History Only:
Feature Highlight: When enabled, this hides all the "noise" of open or failed gaps. It only draws the boxes that successfully produced a Rejection Signal in the past.

Simulateur Carnet d'Ordres & Liquidité [Sese] - Custom🔹 Indicator Name
Order Book & Liquidity Simulator - Custom
🔹 Concept and Functionality
This indicator is a technical analysis tool designed to visually simulate market depth (Order Book) and potential liquidity zones.
It is important to adhere to TradingView's transparency rules: This script does not access real Level 2 data (the actual exchange order book). Instead, it uses a deductive algorithm based on historical Price Action to estimate where Buy Limit (Bid) and Sell Limit (Ask) orders might be resting.
Methodology used by the script:
Pivot Detection: The indicator scans for significant Swing Highs and Swing Lows over a user-defined lookback period (Length).
Level Projection: These pivots are projected to the right as horizontal lines.
Red Lines (Ask): Represent potential resistance zones (sellers).
Blue Lines (Bid): Represent potential support zones (buyers).
Liquidity Management (Absorption): The script is dynamic. If the current price crosses a line, the indicator assumes the liquidity at that level has been consumed (orders filled). The line is then automatically deleted from the chart.
Density Profile (Right Side): Horizontal bars appear to the right of the current price. These approximate a "Time Price Opportunity" or Volume Profile, showing where the market has spent the most time recently.
🔹 User Manual (Settings)
Here is how to configure the inputs to match your trading style:
1. Detection Algorithm
Lookback Length (Candles): Determines the sensitivity of the pivots.
Low value (e.g., 10): Shows many lines (scalping/short term).
High value (e.g., 50): Shows only major structural levels (swing trading).
Volume Factor: (Technical note: In this specific code version, this variable is calculated but the lines are primarily drawn based on geometric pivots).
2. Visual Settings
Show Price Lines (Bid/Ask): Toggles the horizontal Support/Resistance lines on or off.
Show Volume Profile: Toggles the heatmap-style bars on the right side of the chart.
Extend Lines: If checked, untouched lines will extend to the right towards the current price bar.
3. Colors and Transparency Management
Customize the aesthetics to keep your chart clean:
Bid / Ask Colors: Choose your base colors (Default is Blue and Red).
Line Transparency (%): Crucial for chart visibility.
0% = Solid, bright colors.
80-90% = Very subtle, faint lines (recommended if you overlay this on other tools).
Text Size: Adjusts the size of the price labels ("BUY LIMIT" / "SELL LIMIT").
🔹 How to Read the Indicator
Rejections: Unbroken lines act as potential walls. Watch for price reaction when approaching a blue line (support) or red line (resistance).
Breakouts/Absorption: When a line disappears, it means the level has been breached. The market may then seek the next liquidity level (the next line).
Density (Right-side boxes): More opaque/visible boxes indicate a price zone "accepted" by the market (consolidation). Empty gaps suggest an imbalance where price might move through quickly.
⚠️ Disclaimer
This script is for educational and technical analysis purposes only. It is a simulation based on price history, not real-time order book data. Past performance is not indicative of future results. Trading involves risk.

Mark Minervini SEPA - Balanced
📊 MARK MINERVINI SEPA BALANCED - COMPLETE USER GUIDE
🚀 WHAT IS THIS INDICATOR?
This is a professional swing trading indicator based on Mark Minervini's famous
Trend Template strategy. It automatically identifies high-probability setups where:
✅ Long-term trend is BULLISH (confirmed by moving averages)
✅ Stock is OUTPERFORMING the market (relative strength improving)
✅ Price is CONSOLIDATING (forming a base for breakout)
✅ Volume is CONFIRMING (volume spike on breakout)
Result: CLEAR BUY SIGNALS when everything aligns! 🎯
🎨 WHAT YOU SEE ON YOUR CHART
1️⃣ FOUR MOVING AVERAGE LINES:
🟠 Orange Line (MA 20) = Short-term trend
🔵 Blue Line (MA 50) = Intermediate trend
🟢 Green Line (MA 150) = Long-term trend
🔴 Red Line (MA 200) = Very long-term trend
IDEAL: All lines stacked in order (Orange > Blue > Green > Red)
2️⃣ BACKGROUND COLOR:
🟢 GREEN background = Trend template is VALID (bullish setup ready)
🔴 RED background = Trend template is BROKEN (avoid trading)
3️⃣ DASHBOARD PANEL (Top-Right):
Real-time checklist showing:
✓ 6 core trend template rules
✓ Relative strength status
✓ VCP base quality
✓ Stage classification (S1/S2/S3/S4)
✓ Volume breakout status
4️⃣ VCP BASE BOXES (Blue Rectangles):
Shows where consolidation is happening
This is your potential entry zone
5️⃣ BUY SIGNAL LABEL (Green Text Below Candle):
Green "BUY" label appears when ALL criteria are met
This is your strongest entry signal
6️⃣ STOP LOSS LINE (Red Dashed Line):
Shows your stop loss level (base low)
📖 HOW TO USE - STEP BY STEP
STEP 1: ADD INDICATOR TO CHART
────────────────────────────────
1. Open TradingView chart
2. Click "Indicators" (top toolbar)
3. Search "Minervini SEPA Balanced"
4. Click to add to your chart
5. Use DAILY (1D) timeframe for swing trading
STEP 2: CHECK THE DASHBOARD (Top-Right Panel)
1. Look at all the checkmarks
2. Count how many are GREEN (✓)
3. Check Stage column - is it showing S2 or S1?
STEP 3: LOOK FOR SETUP PATTERNS
─────────────────────────────────
Ideal setup shows:
✓ Dashboard: 10+ criteria are GREEN
✓ Stage: S2 (green) or S1 (orange)
✓ Blue VCP box visible on chart (base forming)
✓ Moving averages aligned (50 > 150 > 200)
✓ Price above all moving averages
✓ Background is GREEN
STEP 4: WAIT FOR ENTRY SIGNAL
──────────────────────────────
Option A: BUY SIGNAL label appears
→ Green "BUY" label = ALL criteria met
→ ENTER at market price immediately
Option B: Setup looks good but no BUY label yet
→ Wait for price to break above blue VCP box
→ Volume should spike (1.3x or higher)
→ Then enter at breakout
STEP 5: PLACE YOUR TRADE
────────────────────────
📍 ENTRY: At breakout from VCP base
📍 STOP LOSS: Base low (red dashed line)
📍 TARGET: 20-30% move (typical Minervini target)
📍 HOLDING TIME: 2-4 weeks
🎯 BALANCED VERSION - WHY IT'S BETTER FOR INDIAN STOCKS
Volume Multiplier: 1.3x (NOT 1.5x)
→ Original was too strict for Indian market
→ 1.3x is realistic and catches good breakouts
→ Results: 5-10 signals per stock per year (tradeable!)
Trend Template: Core 6 rules (NOT all 8)
→ Focuses on the most important rules
→ Still maintains quality, but more flexible
→ Works better with Indian stock behavior
Stage Allowed: S1 OR S2 (NOT just S2)
→ Catches earlier moves
→ Allows you to enter sooner
→ But maintains quality with other criteria
📊 DASHBOARD INDICATORS - WHAT EACH MEANS
TREND SECTION (Core 6 Rules):
─────────────────────────────
P>200 ✓ = Price above 200-day MA (long-term uptrend)
150>200 ✓ = MA150 above MA200 (MA alignment)
200↑ ✓ = MA200 trending up (uptrend accelerating)
50>150 ✓ = MA50 above MA150 (intermediate uptrend)
50>200 ✓ = MA50 above MA200 (overall alignment)
P>50 ✓ = Price above MA50 (pullback level intact)
RS STRENGTH SECTION:
───────────────────
RS↑ ✓ = Stock outperforming NIFTY index
✗ = Stock underperforming NIFTY (avoid)
VCP BASE SECTION:
────────────────
In Base ✓ = Consolidation zone detected
✗ = No consolidation yet
Vol Dry ✓ = Volume drying up (base tightening)
✗ = Normal volume (consolidation weak)
ENTRY SECTION:
──────────────
Stage S2 = GREEN (best for swing trading)
S1 = ORANGE (acceptable, early entry)
S3 = RED (avoid - distribution phase)
S4 = RED (avoid - downtrend)
Vol Brk ✓ = Volume confirmed breakout (1.3x+ average)
✗ = Weak volume (breakout likely to fail)
❌ WHEN NOT TO TRADE
SKIP if ANY of these are true:
❌ Background is RED (trend template broken)
❌ Stage is S3 or S4 (distribution or downtrend)
❌ Vol Brk is RED (volume not confirming)
❌ RS↑ is ORANGE/RED (stock underperforming market)
❌ Blue box is NOT visible (no base forming)
❌ Base is very loose/messy (not tight enough)
❌ Moving averages are not aligned
❌ Less than 8 GREEN criteria on dashboard
⚙️ CUSTOMIZATION GUIDE
Click ⚙️ gear icon next to indicator name to adjust settings:
VOLUME MULTIPLIER (Default: 1.3)
────────────────────────────────
Current: 1.3x = BALANCED for Indian stocks ✅
Change to 1.2x = MORE signals (more false breakouts)
Change to 1.4x = FEWER signals (very selective)
Change to 1.5x = ORIGINAL (too strict, rarely triggers)
RS BENCHMARK (Default: NSE:NIFTY)
─────────────────────────────────
Current: NSE:NIFTY = Large-cap stocks
Change to NSE:NIFTY500 = Mid-cap stocks
Change to NSE:NIFTYNXT50 = Small-cap stocks
MINIMUM BASE DAYS (Default: 20)
───────────────────────────────
Current: 20 days = 4 weeks consolidation ✅
Change to 15 = Shorter bases (more frequent signals)
Change to 25 = Longer bases (higher quality)
ATR% FOR TIGHTNESS (Default: 1.5)
──────────────────────────────────
Current: 1.5% = BALANCED ✅
Change to 1.0% = ONLY very tight bases
Change to 2.0% = Loose bases accepted
📈 REAL TRADING EXAMPLE
SCENARIO: Trading RELIANCE over 4 weeks
WEEK 1: Base Starts Forming
────────────────────────────
- Price consolidating around ₹1,500
- Dashboard: 5/14 criteria green
- Action: MONITOR (not ready yet)
WEEK 2: Base Tightens
─────────────────────
- Price still ₹1,500 (no movement)
- VCP box appearing on chart
- Dashboard: 8/14 criteria green
- Vol Dry: ✓ (volume shrinking - good!)
- Action: MONITOR (almost ready)
WEEK 3: Perfect Setup Formed
──────────────────────────────
- Base still ₹1,500
- Dashboard: 12/14 criteria GREEN ✓✓✓
- Stage: S2 ✓
- Blue box tight and clean
- Action: WAIT FOR BREAKOUT
WEEK 4: Breakout Happens!
──────────────────────────
- Price closes at ₹1,550 (breakout!)
- Volume: 1.6x average (exceeds 1.3x requirement)
- Dashboard: BUY SIGNAL ✓ (all criteria met)
- Action: ENTER TRADE
Entry: ₹1,550
Stop: ₹1,480 (base low)
Target: ₹1,850 (20% move)
RESULT: +19.4% profit in 2 weeks! ✅
💡 PRO TIPS FOR BEST RESULTS
1. USE DAILY (1D) CHARTS ONLY
Weekly charts = Fewer signals, slower moves
Daily charts = Best for swing trading ✅
Intraday charts = Too many false signals
2. SCAN MULTIPLE STOCKS
Don't just watch 1 stock
Scan 50-100 stocks daily
More stocks = More opportunities
3. WAIT FOR PERFECT ALIGNMENT
Don't enter on 8/14 criteria
Wait for 12+/14 criteria
This increases win rate significantly
4. VOLUME IS CRITICAL
Always check Vol Brk column
No volume = Likely to fail
1.3x+ volume = Good breakout
5. COMBINE WITH YOUR OWN ANALYSIS
Indicator gives technical signals
You add your own fundamental view
Strong fundamental + technical = Best trade
6. BACKTEST ON HISTORICAL DATA
Use TradingView Replay feature
Go back 6-12 months
See how many signals appeared
Verify which were profitable
7. KEEP A TRADING JOURNAL
Track entry, exit, profit/loss
Note what worked and what didn't
Continuous improvement!
⚠️ IMPORTANT DISCLAIMERS
✓ This indicator is for educational purposes only
✓ Past performance does not guarantee future results
✓ Always use proper risk management (position sizing, stop loss)
✓ Never risk more than 2% of your account on one trade
✓ Backtest thoroughly before using with real money
✓ The indicator provides technical signals, not investment advice
✓ Losses can occur - trade at your own risk
🎯 QUICK START CHECKLIST
Before entering ANY trade, verify:
□ Dashboard shows mostly GREEN (10+ criteria)
□ Stage = S2 (green) or S1 (orange)
□ Blue VCP box visible on chart
□ Price just broke above the box
□ Volume is high (1.3x+ average, Vol Brk = ✓)
□ Moving averages aligned (50 > 150 > 200)
□ RS is uptrending (RS↑ = ✓)
□ BUY SIGNAL label appeared (optional but strong confirmation)
ALL CHECKED? → READY TO BUY! 🚀
📞 FOR HELP & SUPPORT
Questions about the indicator?
→ Check the dashboard - each criterion has a specific meaning
→ Review this guide - answers most common questions
→ Backtest on historical data using TradingView Replay
→ Start with paper trading (no real money) first
🎓 LEARNING RESOURCES
To understand Mark Minervini's method better:
→ Read: "Trade Like a Stock Market Wizard" by Mark Minervini
→ Watch: TradingView educational videos on trend templates
→ Practice: Backtest this indicator on 6-12 months of historical data
→ Learn: Study successful traders who use similar strategies
GOOD LUCK WITH YOUR TRADING! 🚀📈
May your trends be bullish and your breakouts be explosive! 🎯

Visible RangeOverview This is a precision tool designed for quantitative traders and engineers who need exact control over their chart's visual scope. Unlike standard time calculations that fail in markets with trading breaks (like A-Shares, Futures, or Stocks), this indicator uses a loop-back mechanism to count the actual number of visible bars, ensuring your indicators (e.g., MA60, MA200) have sufficient sample data.
Why use this? If you use multi-timeframe layouts (e.g., Daily/Hourly/15s), it is critical to know exactly how much data is visible.
The Problem: In markets like the Chinese A-Share market (T+1, 4-hour trading day), calculating Time Range / Timeframe results in massive errors because it includes closed market hours (lunch breaks, nights, weekends).
The Solution: This script iterates through the visible range to count the true bar_index, providing 100% accurate data density metrics.
Key Features
True Bar Counting: Uses a for loop to count actual candles, ignoring market breaks. perfect for non-24/7 markets.
Integer Precision: Displays time ranges (Days, Hours, Mins, Secs) in clean integers. No messy decimals.
Compact UI: Displays information in a single line (e.g., View: 30 Days (120 Bars)), default to the Top Right corner to save screen space.
Fully Customizable: Adjustable position, text size, and colors to fit any dark/light theme.
Performance Optimized: Includes max_bars_back limits to prevent browser lag on deep history lookups.
Settings
Position: Default Top Right (can be moved to any corner).
Max Bar Count: Default 5000 (Safety limit for loop calculation).

Superior-Range Bound Renko - Alerts - 11-29-25 - Signal LynxSuperior-Range Bound Renko – Alerts Edition with Advanced Risk Management Template
Signal Lynx | Free Scripts supporting Automation for the Night-Shift Nation 🌙
1. Overview
This is the Alerts & Indicator Edition of Superior-Range Bound Renko (RBR).
The Strategy version is built for backtesting inside TradingView.
This Alerts version is built for automation: it emits clean, discrete alert events that you can route into webhooks, bots, or relay engines (including your own Signal Lynx-style infrastructure).
Under the hood, this script contains the same core engine as the strategy:
Adaptive Range Bounding based on volatility
Renko Brick Emulation on standard candles
A stack of Laguerre Filters for impulse detection
K-Means-style Adaptive SuperTrend for trend confirmation
The full Signal Lynx Risk Management Engine (state machine, layered exits, AATS, RSIS, etc.)
The difference is in what we output:
Instead of placing historical trades, this version:
Plots the entry and RM signals in a separate pane (overlay = false)
Exposes alertconditions for:
Long Entry
Short Entry
Close Long
Close Short
TP1, TP2, TP3 hits (Staged Take Profit)
This makes it ideal as the signal source for automated execution via TradingView Alerts + Webhooks.
2. Quick Action Guide (TL;DR)
Best Timeframe:
4H and above. This is a swing-trading / position-trading style engine, not a micro-scalper.
Best Assets:
Volatile but structured markets, e.g.:
BTC, ETH, XAUUSD (Gold), GBPJPY, and similar high-volatility majors or indices.
Script Type:
indicator() – Alerts & Visualization Only
No built-in order placement
All “orders” are emitted as alerts for your external bot or manual handling
Strategy Type:
Volatility-Adaptive Trend Following + Impulse Detection
using Renko-like structure and multi-layer Laguerre filters.
Repainting:
Designed to be non-repainting on closed candles.
The underlying Risk Management engine is built around previous-bar data (close , high , low ) for execution-critical logic.
Intrabar values can move while the bar is forming (normal for any advanced signal), but once a bar closes, the alert logic is stable.
Recommended Alert Settings:
Condition: one of the built-in signals (see section 3.B)
Options: “Once Per Bar Close” is strongly recommended for automation
Message: JSON, CSV, or simple tokens – whatever your webhook / relay expects
3. Detailed Report: How the Alerts Edition Works
A. Relationship to the Strategy Version
The Alerts Edition shares the same internal logic as the strategy version:
Same Adaptive Lookback and volatility normalization
Same Range and Close Range construction
Same Renko Brick Emulator and directional memory (renkoDir)
Same Fib structures, Laguerre stack, K-Means SuperTrend, and Baseline signals (B1, B2)
Same Risk Management Engine and layered exits
In the strategy script, these signals are wired into strategy.entry, strategy.exit, and strategy.close.
In the alerts script:
We still compute the final entry/exit signals (Fin, CloseEmAll, TakeProfit1Plot, etc.)
Instead of placing trades, we:
Plot them for visual inspection
Expose them via alertcondition(...) so that TradingView can fire alerts.
This ensures that:
If you use the same settings on the same symbol/timeframe, the Alerts Edition and Strategy Edition agree on where entries and exits occur.
(Subject only to normal intrabar vs. bar-close differences.)
B. Signals & Alert Conditions
The alerts script focuses on discrete, automation-friendly events.
Internally, the main signals are:
Fin – Final entry decision from the RM engine
CloseEmAll – RM-driven “hard close” signal (for full-position exits)
TakeProfit1Plot / 2Plot / 3Plot – One-time event markers when each TP stage is hit
On the chart (in the separate indicator pane), you get:
plot(Fin) – where:
+2 = Long Entry event
-2 = Short Entry event
plot(CloseEmAll) – where:
+1 = “Close Long” event
-1 = “Close Short” event
plot(TP1/TP2/TP3) (if Staged TP is enabled) – integer tags for TP hits:
+1 / +2 / +3 = TP1 / TP2 / TP3 for Longs
-1 / -2 / -3 = TP1 / TP2 / TP3 for Shorts
The corresponding alertconditions are:
Long Entry
alertcondition(Fin == 2, title="Long Entry", message="Long Entry Triggered")
Fire this to open/scale a long position in your bot.
Short Entry
alertcondition(Fin == -2, title="Short Entry", message="Short Entry Triggered")
Fire this to open/scale a short position.
Close Long
alertcondition(CloseEmAll == 1, title="Close Long", message="Close Long Triggered")
Fire this to fully exit a long position.
Close Short
alertcondition(CloseEmAll == -1, title="Close Short", message="Close Short Triggered")
Fire this to fully exit a short position.
TP 1 Hit
alertcondition(TakeProfit1Plot != 0, title="TP 1 Hit", message="TP 1 Level Reached")
First staged take profit hit (either long or short). Your bot can interpret the direction based on position state or message tags.
TP 2 Hit
alertcondition(TakeProfit2Plot != 0, title="TP 2 Hit", message="TP 2 Level Reached")
TP 3 Hit
alertcondition(TakeProfit3Plot != 0, title="TP 3 Hit", message="TP 3 Level Reached")
Together, these give you a complete trade lifecycle:
Open Long / Short
Optionally scale out via TP1/TP2/TP3
Close remaining via Close Long / Close Short
All while the Risk Management Engine enforces the same logic as the strategy version.
C. Using This Script for Automation
This Alerts Edition is designed for:
Webhook-based bots
Execution relays (e.g., your own Lynx-Relay-style engine)
Dedicated external trade managers
Typical setup flow:
Add the script to your chart
Same symbol, timeframe, and settings you use in the Strategy Edition backtests.
Configure Inputs:
Longs / Shorts enabled
Risk Management toggles (SL, TS, Staged TP, AATS, RSIS)
Weekend filter (if you do not want weekend trades)
RBR-specific knobs (Adaptive Lookback, Brick type, ATR vs Standard Brick, etc.)
Create Alerts for Each Event Type You Need:
Long Entry
Short Entry
Close Long
Close Short
TP1 / TP2 / TP3 (optional, if your bot handles partial closes)
For each:
Condition: the corresponding alertcondition
Option: “Once Per Bar Close” is strongly recommended
Message:
You can use structured JSON or a simple token set like:
{"side":"long","event":"entry","symbol":"{{ticker}}","time":"{{timenow}}"}
or a simpler text for manual trading like:
LONG ENTRY | {{ticker}} | {{interval}}
Wire Up Your Bot / Relay:
Point TradingView’s webhook URL to your execution engine
Parse the messages and map them into:
Exchange
Symbol
Side (long/short)
Action (open/close/partial)
Size and risk model (this script does not position-size for you; it only signals when, not how much.)
Because the alerts come from a non-repainting, RM-backed engine that you’ve already validated via the Strategy Edition, you get a much cleaner automation pipeline.
D. Repainting Protection (Alerts Edition)
The same protections as the Strategy Edition apply here:
Execution-critical logic (trailing stop, TP triggers, SL, RM state changes) uses previous bar OHLC:
open , high , low , close
No security() with lookahead or future-bar dependencies.
This means:
Alerts are designed to fire on states that would have been visible at bar close, not on hypothetical “future history.”
Important practical note:
Intrabar: While a bar is forming, internal conditions can oscillate.
Bar Close: With “Once Per Bar Close” alerts, the fired signal corresponds to the final state of the engine for that candle, matching your Strategy Edition expectations.
4. For Developers & Modders
You can treat this Alerts script as an ”RM + Alert Framework” and inject any signal logic you want.
Where to plug in:
Find the section:
// BASELINE & SIGNAL GENERATION
You’ll see how B1 and B2 are built from the RBR stack and then combined:
baseSig = B2
altSig = B1
finalSig = sigSwap ? baseSig : altSig
To use your own logic:
Replace or wrap the code that sets baseSig / altSig with your own conditions:
e.g., RSI, MACD, Heikin Ashi filters, candle patterns, volume filters, etc.
Make sure your final decision is still:
2 → Long / Buy signal
-2 → Short / Sell signal
0 → No trade
finalSig is then passed into the RM engine and eventually becomes Fin, which:
Drives the Long/Short Entry alerts
Interacts with the RM state machine to integrate properly with AATS, SL, TS, TP, etc.
Because this script already exposes alertconditions for key lifecycle events, you don’t need to re-wire alerts each time — just ensure your logic feeds into finalSig correctly.
This lets you use the Signal Lynx Risk Management Engine + Alerts wrapper as a drop-in chassis for your own strategies.
5. About Signal Lynx
Automation for the Night-Shift Nation 🌙
Signal Lynx builds tools and templates that help traders move from:
“I have an indicator” → “I have a structured, automatable strategy with real risk management.”
This Superior-Range Bound Renko – Alerts Edition is the automation-focused companion to the Strategy Edition. It’s designed for:
Traders who backtest with the Strategy version
Then deploy live signals with this Alerts version via webhooks or bots
While relying on the same non-repainting, RM-driven logic
We release this code under the Mozilla Public License 2.0 (MPL-2.0) to support the Pine community with:
Transparent, inspectable logic
A reusable Risk Management template
A reference implementation of advanced adaptive logic + alerts
If you are exploring full-stack automation (TradingView → Webhooks → Exchange / VPS), keep Signal Lynx in your search.
License: Mozilla Public License 2.0 (Open Source).
If you build improvements or helpful variants, please consider sharing them back with the community.

TQQQ Ultra Clean Trend Strategy⭐ TradingView Script Description (Layman Friendly, Polished, Professional)
TQQQ Ultra Clean Trend Strategy
This strategy is designed to make trend-following simple and easy to understand, even for beginners.
It looks at three basic conditions to decide when to buy and when to sell, using only price action and two moving averages.
🔵 Buy Logic (in simple English)
The strategy generates a Buy when:
Price is moving upward (above the 50-day average)
The overall trend is healthy (50-day average above the 250-day average)
Strength is increasing (momentum is positive)
In plain words:
👉 “Price is climbing strongly, buyers are in control, and the trend is pointing upward.”
Only when all three conditions agree do we buy.
🔴 Sell Logic (in simple English)
A Sell happens when any of these warning signs appear:
Price starts to fall below the short-term trend
The trend begins to weaken
Momentum turns negative
In plain words:
👉 “Price is starting to drop, the up-move is losing strength, and the trend may be ending.”
This helps lock in gains when the market starts showing weakness.
🟢 Why this strategy is clean and easy to read
Only small text labels appear on the chart (“Buy: Price climbing strongly” / “Sell: Price starting to drop”)
No clutter, no shapes, no background boxes
Makes it easy to visually understand why a trade happened
Uses only reliable long-term signals to avoid noise
Perfect for trending instruments like TQQQ

Previous & Current Day LevelsPine Script indicator that displays key price levels from the previous trading day and the current day's opening price on your chart.
What it displays:
The script draws four horizontal reference lines across your chart:
Previous Day High (PDH) - The highest price reached yesterday
Previous Day Low (PDL) - The lowest price reached yesterday
Previous Day Close (PDC) - Yesterday's closing price
Daily Open (DO) - Today's opening price
Key features:
Visual customization - You can adjust colors, line styles (solid/dashed/dotted), line thickness, and text size for all levels
Label positioning - Labels can be offset to the right of the current price action to keep them visible and out of the way
Flexible display - Choose between full descriptive labels ("Prev Day High") or shorthand abbreviations ("PDH")
Performance optimization - The script limits how far back lines are drawn (configurable up to 5000 bars) to prevent rendering issues
Clean presentation - Each level includes a solid horizontal line from its starting point, plus a dotted connector line extending to the label
Why traders use it:
These levels are important reference points for intraday traders. Previous day levels often act as support/resistance zones, and the daily open helps identify potential trend direction. The script automatically updates these levels each day, making it easy to track key price areas without manual drawing.

P&F Label Overlay🧙 The Wizard's Challenge: P&F Label Overlay on Your Chart
This is a custom Pine Script indicator designed to overlay the classic Point & Figure (P&F) pattern directly onto your standard candlestick or bar chart. While Pine Script offers built-in, dedicated P&F charts, this indicator was created as a challenging and experimental project to satisfy the goal of visualizing the P&F X's and O's directly on the price bars.
❶. How to Use This Code on TradingView
1. Copy the Code: Copy the entire Pine Script code provided above.
2. Open Pine Editor: On TradingView, click the "Pine Editor" tab at the bottom of your chart.
3. Replace Content: Delete any existing code in the editor and paste this P&F script.
4. Add to Chart: Click the "Add to Chart" button (usually located near the top right of the Pine Editor).
5. Access Settings: The indicator, named "P&F Label Overlay: The Wizard's Challenge," will appear on your chart. You can click the gear icon ( ) next to its name on the chart to adjust the inputs.
❷. 🎛️ Key Settings & Customization (Inputs)
The indicator provides core P&F settings that you can customize to fit your analysis style:
✅ Enable Auto Box Size (Default: True): When enabled, the box size is automatically calculated as a percentage of the current price, making it dynamic.
・Auto Box Size Basis (%): Sets the percentage used to calculate the dynamic box size. (e.g., 2% of the price).
・Fixed Box Size (Price Units): When "Enable Auto Box Size" is disabled, this value is used as the static box size (e.g., a value of 5.0 for a $5 box).
・Reversal Count (Default: 3): This is the crucial P&F parameter (the Reversal Factor). It determines how many boxes the price must move in the opposite direction to trigger a column reversal (e.g., 3 means price must reverse by 3 \times \text{BOX\_SIZE}).
Calculation Source: Allows you to choose the price data used for calculations (e.g., close, hl2 (High/Low/2), etc.).
❸. 🎯 The Challenge: Why an Overlay?
This indicator represents an experimental and challenging endeavor made in collaboration with an AI. It stems from the strong desire to visualize P&F patterns overlaid on a conventional chart, which is not a native function in Pine Script's standard indicator plotting system.
・Leveraging Drawing Objects: The core of this challenge relies on cleverly using Pine Script's label.new() drawing objects to represent the "X" and "O" symbols. This is a highly non-standard way to draw a P&F chart, as it requires complex logic to manage the drawing coordinates, price levels, and column spacing on the time-based chart.
・The Current Status: We've successfully achieved the initial goal: visualizing the X and O patterns as an overlay. Achieving a perfectly aligned, full-featured P&F chart (where columns align precisely, and price rounding is fully consistent across all columns) is far more complex, but this code provides a strong foundation.
❹. 🛠️ Technical Highlights
Tick-Precision Rounding: The custom function f_roundToTick() is critical. It ensures that the calculated box size and the lastPrice are always rounded to the nearest minimum tick size (syminfo.mintick) of the asset. This maintains high precision and accuracy relative to the market's price movements.
・Column Indexing: The currentColumnIndex variable is used to simulate the horizontal movement of P&F columns by adding a fractional offset to the bar_index when drawing the labels. This is what makes the pattern appear as distinct columns.
・Garbage Collection: The activeLabels array and the MAX_LABELS limit ensure that old labels are deleted (label.delete()) as new ones are drawn. This is a crucial performance optimization to prevent TradingView's label limit (500) from being exceeded and to maintain a smooth experience.
❺. 🚀 A Platform for Deep Customization
While TradingView's built-in indicators are excellent, every trader has their "personal best settings." View this code as a starting point for your own analytical environment. You can use it as a base to pursue deeper custom features, such as:
・Different drawing styles or colors based on momentum.
・Automated detection and signaling of specific P&F patterns (e.g., Double Top Buy, Triple Bottom Sell).
Please feel free to try it on your chart! We welcome any feedback you might have as we continue to refine this experimental overlay.
I do not speak English at all. Please understand that if you send me a message, I may not be able to reply, or my reply may have a different meaning. Thank you for your understanding.

Zonas de Liquidez Pro + Puntos de GiroRequirements for marking 💧:✅ High crosses the zone✅ Close returns inside (false breakout / fakeout)✅ Volume is 20% greater than the average✅ Occurs within the last 10 bars(Note: This last requirement is stated in the text but not explicitly in the code snippet provided)📚 Psychology Behind the SweepWho lost money?Traders with stops placed too tightlyBuyers who entered "on the breakout"Bots with automatic orders placed aboveWho made money?Smart Money / InstitutionsThey sold at a high priceThey hunted for liquidity before moving the priceThey know where retail stops are located🎯 How to Use the Drops in Your TradingGolden Rule:💧 near a strong zone + Multiple rejections = PROBABLE REVERSALStrategy:See 💧 at resistance → Look for SHORTSee 💧 at support → Look for LONGPrice returns to the swept zone → High-probability setupStop beyond the sweep high/low → ProtectionPractical Example:If you see 💧 LIQ at $111,263 (resistance)→ Wait for bearish rejection→ Entry: Sell at $110,800→ Stop: $111,500 (above the sweep high)→ Target: Next support level⚠️ Common Mistakes❌ Mistake 1: Trading the breakoutPrice breaks $111k → "It's going to the moon!" → Buy💧 LIQ appears → It was a trap → Drop → Loss✅ Correct Approach:Price breaks $111k → Check if there is 💧 LIQ💧 appears → "It's a trap" → Wait for rejection → Sell❌ Mistake 2: Ignoring the volumeNot all sweeps are equal.Sweeps with high volume are more reliable.No volume = it could be noise.🎓 Ultra-Fast SummaryElementMeaning💧 LIQLiquidity sweep detectedAt ResistanceBullish trap → Prepare for a shortAt SupportBearish trap → Prepare for a longWith High VolumeMore reliable signalNear Strong Zone High probability of reversal🔥 The Magic of Your IndicatorScenarioWithout this IndicatorWith this IndicatorAction"The price broke $111k, I'm buying!""There is 💧 LIQ + zone + rejections → It's a trap."ResultYou loseYou avoid a loss or gain on the short

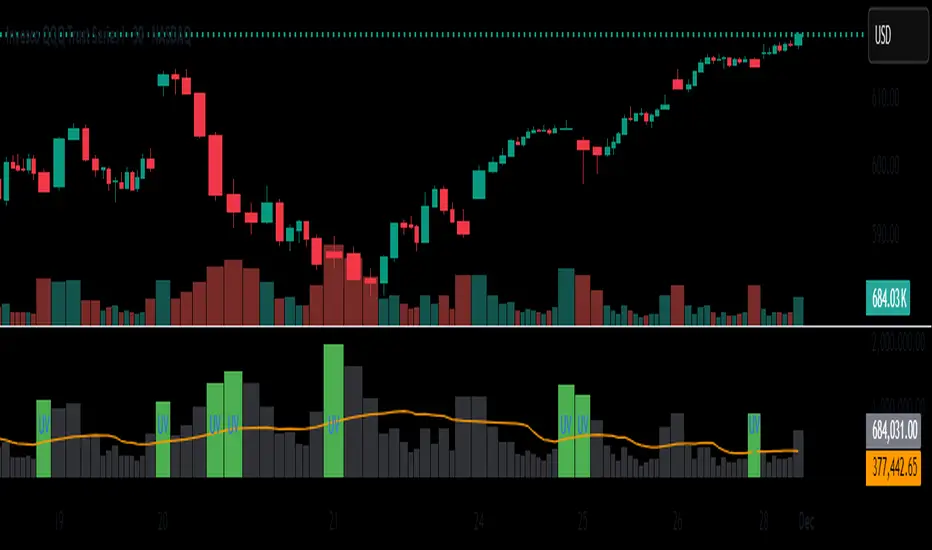
Unusual Volume//@version=5
indicator("Unusual Volume", overlay=false)
// --- Inputs ---
len = input.int(20, "Average Volume Length", minval=1)
mult = input.float(2.0, "Unusual Volume Multiplier", step=0.1)
// --- Calculations ---
avgVol = ta.sma(volume, len)
ratio = volume / avgVol
isBigVol = ratio > mult
// --- Plots ---
plot(volume, "Volume", style=plot.style_columns,
color = isBigVol ? color.new(color.green, 0) : color.new(color.gray, 60))
plot(avgVol, "Average Volume", color=color.orange)
// Mark unusual volume bars
plotshape(isBigVol, title="Unusual Volume Marker",
location=location.bottom, style=shape.triangleup,
color=color.green, size=size.tiny, text="UV")
// Optional: show ratio in Data Window
var label ratioLabel = na