MA Deviation Suite [InvestorUnknown]This indicator combines advanced moving average techniques with multiple deviation metrics to offer traders a versatile tool for analyzing market trends and volatility.
Moving Average Types :
SMA, EMA, HMA, DEMA, FRAMA, VWMA: Standard moving averages with different characteristics for smoothing price data.
Corrective MA: This method corrects the MA by considering the variance, providing a more responsive average to price changes.
f_cma(float src, simple int length) =>
ma = ta.sma(src, length)
v1 = ta.variance(src, length)
v2 = math.pow(nz(ma , ma) - ma, 2)
v3 = v1 == 0 or v2 == 0 ? 1 : v2 / (v1 + v2)
var tolerance = math.pow(10, -5)
float err = 1
// Gain Factor
float kPrev = 1
float k = 1
for i = 0 to 5000 by 1
if err > tolerance
k := v3 * kPrev * (2 - kPrev)
err := kPrev - k
kPrev := k
kPrev
ma := nz(ma , src) + k * (ma - nz(ma , src))
Fisher Least Squares MA: Aims to reduce lag by using a Fisher Transform on residuals.
f_flsma(float src, simple int len) =>
ma = src
e = ta.sma(math.abs(src - nz(ma )), len)
z = ta.sma(src - nz(ma , src), len) / e
r = (math.exp(2 * z) - 1) / (math.exp(2 * z) + 1)
a = (bar_index - ta.sma(bar_index, len)) / ta.stdev(bar_index, len) * r
ma := ta.sma(src, len) + a * ta.stdev(src, len)
Sine-Weighted MA & Cosine-Weighted MA: These give more weight to middle bars, creating a smoother curve; Cosine weights are shifted for a different focus.
Deviation Metrics :
Average Absolute Deviation (AAD) and Median Absolute Deviation (MAD): AAD calculates the average of absolute deviations from the MA, offering a measure of volatility. MAD uses the median, which can be less sensitive to outliers.
Standard Deviation (StDev): Measures the dispersion of prices from the mean.
Average True Range (ATR): Reflects market volatility by considering the day's range.
Average Deviation (adev): The average of previous deviations.
// Calculate deviations
float aad = f_aad(src, dev_len, ma) * dev_mul
float mad = f_mad(src, dev_len, ma) * dev_mul
float stdev = ta.stdev(src, dev_len) * dev_mul
float atr = ta.atr(dev_len) * dev_mul
float avg_dev = math.avg(aad, mad, stdev, atr)
// Calculated Median with +dev and -dev
float aad_p = ma + aad
float aad_m = ma - aad
float mad_p = ma + mad
float mad_m = ma - mad
float stdev_p = ma + stdev
float stdev_m = ma - stdev
float atr_p = ma + atr
float atr_m = ma - atr
float adev_p = ma + avg_dev
float adev_m = ma - avg_dev
// upper and lower
float upper = f_max4(aad_p, mad_p, stdev_p, atr_p)
float upper2 = f_min4(aad_p, mad_p, stdev_p, atr_p)
float lower = f_min4(aad_m, mad_m, stdev_m, atr_m)
float lower2 = f_max4(aad_m, mad_m, stdev_m, atr_m)
Determining Trend
The indicator generates trend signals by assessing where price stands relative to these deviation-based lines. It assigns a trend score by summing individual signals from each deviation measure. For instance, if price crosses above the MAD-based upper line, it contributes a bullish point; crossing below an ATR-based lower line contributes a bearish point.
When the aggregated trend score crosses above zero, it suggests a shift towards a bullish environment; crossing below zero indicates a bearish bias.
// Define Trend scores
var int aad_t = 0
if ta.crossover(src, aad_p)
aad_t := 1
if ta.crossunder(src, aad_m)
aad_t := -1
var int mad_t = 0
if ta.crossover(src, mad_p)
mad_t := 1
if ta.crossunder(src, mad_m)
mad_t := -1
var int stdev_t = 0
if ta.crossover(src, stdev_p)
stdev_t := 1
if ta.crossunder(src, stdev_m)
stdev_t := -1
var int atr_t = 0
if ta.crossover(src, atr_p)
atr_t := 1
if ta.crossunder(src, atr_m)
atr_t := -1
var int adev_t = 0
if ta.crossover(src, adev_p)
adev_t := 1
if ta.crossunder(src, adev_m)
adev_t := -1
int upper_t = src > upper ? 3 : 0
int lower_t = src < lower ? 0 : -3
int upper2_t = src > upper2 ? 1 : 0
int lower2_t = src < lower2 ? 0 : -1
float trend = aad_t + mad_t + stdev_t + atr_t + adev_t + upper_t + lower_t + upper2_t + lower2_t
var float sig = 0
if ta.crossover(trend, 0)
sig := 1
else if ta.crossunder(trend, 0)
sig := -1
Backtesting and Performance Metrics
The code integrates with a backtesting library that allows traders to:
Evaluate the strategy historically
Compare the indicator’s signals with a simple buy-and-hold approach
Generate performance metrics (e.g., mean returns, Sharpe Ratio, Sortino Ratio) to assess historical effectiveness.
Practical Usage and Calibration
Default settings are not optimized: The given parameters serve as a starting point for demonstration. Users should adjust:
len: Affects how smooth and lagging the moving average is.
dev_len and dev_mul: Influence the sensitivity of the deviation measures. Larger multipliers widen the bands, potentially reducing false signals but introducing more lag. Smaller multipliers tighten the bands, producing quicker signals but potentially more whipsaws.
This flexibility allows the trader to tailor the indicator for various markets (stocks, forex, crypto) and time frames.
Disclaimer
No guaranteed results: Historical performance does not guarantee future outcomes. Market conditions can vary widely.
User responsibility: Traders should combine this indicator with other forms of analysis, appropriate risk management, and careful calibration of parameters.
חפש סקריפטים עבור "the strat"

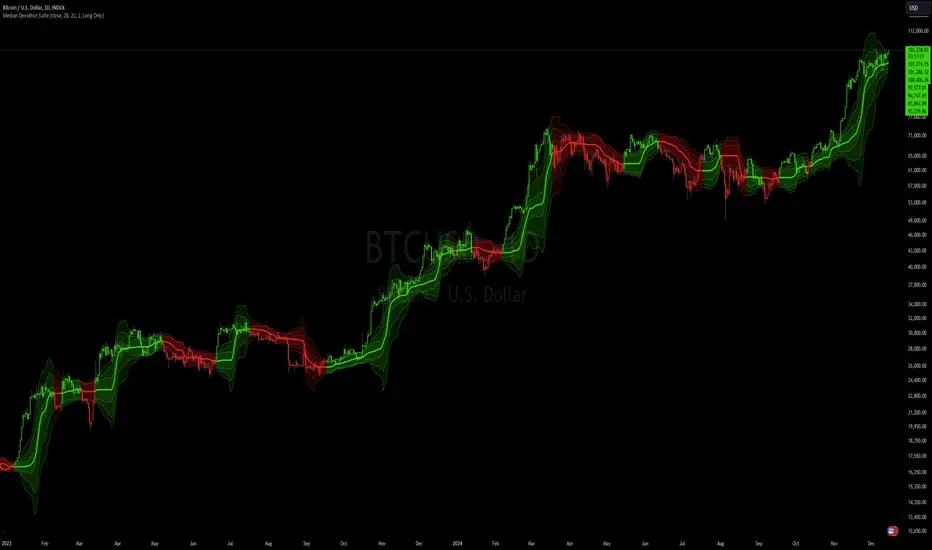
Median Deviation Suite [InvestorUnknown]The Median Deviation Suite uses a median-based baseline derived from a Double Exponential Moving Average (DEMA) and layers multiple deviation measures around it. By comparing price to these deviation-based ranges, it attempts to identify trends and potential turning points in the market. The indicator also incorporates several deviation types—Average Absolute Deviation (AAD), Median Absolute Deviation (MAD), Standard Deviation (STDEV), and Average True Range (ATR)—allowing traders to visualize different forms of volatility and dispersion. Users should calibrate the settings to suit their specific trading approach, as the default values are not optimized.
Core Components
Median of a DEMA:
The foundation of the indicator is a Median applied to the 7-day DEMA (Double Exponential Moving Average). DEMA aims to reduce lag compared to simple or exponential moving averages. By then taking a median over median_len periods of the DEMA values, the indicator creates a robust and stable central tendency line.
float dema = ta.dema(src, 7)
float median = ta.median(dema, median_len)
Multiple Deviation Measures:
Around this median, the indicator calculates several measures of dispersion:
ATR (Average True Range): A popular volatility measure.
STDEV (Standard Deviation): Measures the spread of price data from its mean.
MAD (Median Absolute Deviation): A robust measure of variability less influenced by outliers.
AAD (Average Absolute Deviation): Similar to MAD, but uses the mean absolute deviation instead of median.
Average of Deviations (avg_dev): The average of the above four measures (ATR, STDEV, MAD, AAD), providing a combined sense of volatility.
Each measure is multiplied by a user-defined multiplier (dev_mul) to scale the width of the bands.
aad = f_aad(src, dev_len, median) * dev_mul
mad = f_mad(src, dev_len, median) * dev_mul
stdev = ta.stdev(src, dev_len) * dev_mul
atr = ta.atr(dev_len) * dev_mul
avg_dev = math.avg(aad, mad, stdev, atr)
Deviation-Based Bands:
The indicator creates multiple upper and lower lines based on each deviation type. For example, using MAD:
float mad_p = median + mad // already multiplied by dev_mul
float mad_m = median - mad
Similar calculations are done for AAD, STDEV, ATR, and the average of these deviations. The indicator then determines the overall upper and lower boundaries by combining these lines:
float upper = f_max4(aad_p, mad_p, stdev_p, atr_p)
float lower = f_min4(aad_m, mad_m, stdev_m, atr_m)
float upper2 = f_min4(aad_p, mad_p, stdev_p, atr_p)
float lower2 = f_max4(aad_m, mad_m, stdev_m, atr_m)
This creates a layered structure of volatility envelopes. Traders can observe which layers price interacts with to gauge trend strength.
Determining Trend
The indicator generates trend signals by assessing where price stands relative to these deviation-based lines. It assigns a trend score by summing individual signals from each deviation measure. For instance, if price crosses above the MAD-based upper line, it contributes a bullish point; crossing below an ATR-based lower line contributes a bearish point.
When the aggregated trend score crosses above zero, it suggests a shift towards a bullish environment; crossing below zero indicates a bearish bias.
// Define Trend scores
var int aad_t = 0
if ta.crossover(src, aad_p)
aad_t := 1
if ta.crossunder(src, aad_m)
aad_t := -1
var int mad_t = 0
if ta.crossover(src, mad_p)
mad_t := 1
if ta.crossunder(src, mad_m)
mad_t := -1
var int stdev_t = 0
if ta.crossover(src, stdev_p)
stdev_t := 1
if ta.crossunder(src, stdev_m)
stdev_t := -1
var int atr_t = 0
if ta.crossover(src, atr_p)
atr_t := 1
if ta.crossunder(src, atr_m)
atr_t := -1
var int adev_t = 0
if ta.crossover(src, adev_p)
adev_t := 1
if ta.crossunder(src, adev_m)
adev_t := -1
int upper_t = src > upper ? 3 : 0
int lower_t = src < lower ? 0 : -3
int upper2_t = src > upper2 ? 1 : 0
int lower2_t = src < lower2 ? 0 : -1
float trend = aad_t + mad_t + stdev_t + atr_t + adev_t + upper_t + lower_t + upper2_t + lower2_t
var float sig = 0
if ta.crossover(trend, 0)
sig := 1
else if ta.crossunder(trend, 0)
sig := -1
Practical Usage and Calibration
Default settings are not optimized: The given parameters serve as a starting point for demonstration. Users should adjust:
median_len: Affects how smooth and lagging the median of the DEMA is.
dev_len and dev_mul: Influence the sensitivity of the deviation measures. Larger multipliers widen the bands, potentially reducing false signals but introducing more lag. Smaller multipliers tighten the bands, producing quicker signals but potentially more whipsaws.
This flexibility allows the trader to tailor the indicator for various markets (stocks, forex, crypto) and time frames.
Backtesting and Performance Metrics
The code integrates with a backtesting library that allows traders to:
Evaluate the strategy historically
Compare the indicator’s signals with a simple buy-and-hold approach
Generate performance metrics (e.g., mean returns, Sharpe Ratio, Sortino Ratio) to assess historical effectiveness.
Disclaimer
No guaranteed results: Historical performance does not guarantee future outcomes. Market conditions can vary widely.
User responsibility: Traders should combine this indicator with other forms of analysis, appropriate risk management, and careful calibration of parameters.
Supertrend with Correct Y-axis Scaling OLEG_SLSThe functionality of the script:
1. Supertrend Calculation:
-The trend (Supertrend line) is updated dynamically:
-If the price is above the previous trend, the line follows the upper limit.
-If the price is lower, the line follows the lower boundary.
2. Calculation of the Supertrend for the higher timeframe:
-The function is used to calculate the Supertrend for the hourly, regardless of the current timeframe on the chart.
3. Buy and Sell Signals:
-Buy signal: When the price crosses the Supertrend line up and is above the Supertrend line.
-A sales signal: When the price crosses the Supertrend line down and is below the Supertrend line.
4. Display on the chart
-The Supertrend line is displayed:
-Green if the price is above the Supertrend line.
-Red if the price is below the Supertrend line.
-The Supertrend line for the hourly timeframe is displayed in blue.
5. Alerts
Two types of alerts are created:
-Buy Alert: When there is a buy signal.
-Sell Alert: When there is a sell signal.
Features and recommendations:
-Supertrend works best in trending markets. In a sideways movement, it can give false signals.
-Check the signals on multiple timeframes for confirmation.
-Add additional indicators (for example, RSI or MACD) to filter the signals.
-Test the strategy on historical data before using it in real trading.
_________________________________________________________________________________
Функционал скрипта:
1. Расчет Supertrend:
-Тренд (линия Supertrend) обновляется динамически:
-Если цена выше предыдущего тренда, линия следует за верхней границей.
-Если цена ниже, линия следует за нижней границей.
2. Расчет Supertrend для старшего таймфрейма:
-Используется функция чтобы рассчитать Supertrend для часового,независимо от текущего таймфрейма на графике.
3. Сигналы покупки и продажи:
-Сигнал покупки: Когда цена пересекает линию Supertrend вверх и находится выше линии Supertrend.
-Сигнал продажи: Когда цена пересекает линию Supertrend вниз и находится ниже линии Supertrend.
4. Отображение на графике
-Линия Supertrend отображается:
-Зеленым, если цена выше линии Supertrend.
-Красным, если цена ниже линии Supertrend.
-Линия Supertrend для часового таймфрейма отображается синим цветом.
5. Оповещения
Создаются два типа оповещений:
-Buy Alert: Когда возникает сигнал на покупку.
-Sell Alert: Когда возникает сигнал на продажу.
Особенности и рекомендации:
-Supertrend лучше всего работает в трендовых рынках. В боковом движении может давать ложные сигналы.
-Проверяйте сигналы на нескольких таймфреймах для подтверждения.
-Добавьте дополнительные индикаторы (например, RSI или MACD) для фильтрации сигналов.
-Тестируйте стратегию на исторических данных перед использованием в реальной торговле.

Optimized WaveletsThe script, High-Resolution Volume-Price Pressure Indicator with Wavelets, utilizes wavelet transforms and high-resolution data to analyze market pressure based on volume and price dynamics. The approach combines volume data from smaller timeframes (1 second) with non-linear transformation techniques to generate a refined view of market conditions. Here’s a detailed breakdown of how it works:
Key Components:
Wavelet Transform:
A wavelet function is applied to the price and volume data to capture patterns over a set time period. This technique helps identify underlying structures in the data that might be missed with traditional moving averages.
High-Resolution Data:
The indicator fetches 1-second high-resolution data for price movements and volume. This allows the strategy to capture granular price and volume changes, crucial for short-term trading decisions.
Normalized Difference:
The script calculates the normalized difference in price and volume data. By comparing changes over the selected length, it standardizes these movements to help detect sudden shifts in market pressure.
Sigmoid Transformation:
After combining the price and volume wavelet data, a sigmoid function is applied to smooth out the resulting values. This non-linear transformation helps highlight significant moves while filtering out minor fluctuations.
Volume-Price Pressure:
The up and down volume differences, together with price movements, are combined to create a "Volume-Price Pressure Score." The final indicator reflects the pressure exerted on the market by both buyers and sellers.
Indicator Plot:
The final transformed score is plotted, showing how price and volume dynamics, combined through wavelet transformation, interact. The indicator can be used to identify potential market turning points or pressure buildups based on volume and price movement patterns.
This approach is well-suited for traders looking for advanced signal detection based on high-frequency data and can provide insight into areas where typical indicators may lag or overlook short-term volatility.

Custom Candlestick Pattern IndicatorCustom Candlestick Pattern Indicator - Buy Signal Based on Green Candles Breaking Previous Lows
Overview:
This custom candlestick pattern indicator is designed to highlight potential buy opportunities based on a simple yet powerful candlestick pattern. The indicator identifies green candles that break below the low of the previous candle. This combination may signal a potential market reversal or a bullish continuation after a pullback, depending on the market context. Traders can use this indicator to detect areas where prices may be bouncing from recent lows, indicating a potential buying opportunity.
Pattern Explanation:
The strategy underlying this indicator is a two-part condition that must be met before a buy signal is generated:
Green Candle: A green candle forms when the closing price of the current candle is higher than its opening price. This visually represents bullish momentum as buyers have taken control, closing the price higher than where it opened.
Breaking the Previous Low: The low of the current candle must be lower than the low of the previous candle. This suggests that, despite initial bearish pressure during the candle formation (which drove the price below the previous candle's low), buyers stepped in to push the price higher by the candle’s close. This pattern can signify a potential reversal or bullish continuation, as it demonstrates that buyers are overcoming initial selling pressure.
When the Pattern Occurs:
This pattern is particularly interesting to traders who look for potential reversal signals after a brief decline in price.
It may also work well in markets where pullbacks are common, as this pattern could mark the end of a retracement and the resumption of the bullish trend.
How the Indicator Works:
Green Candle: The indicator first identifies a green candle, where the close of the candle is greater than its open (close > open). This signals that the current period closed higher than it opened, which is generally a bullish sign.
Breaking Previous Low: The indicator checks if the current candle's low is below the low of the previous candle (low < low ). If this condition is met, it means the price dropped below the previous candle's low but was still able to close higher (green candle), signaling a potential reversal or buying opportunity.
Buy Signal: If both conditions are true (green candle + breaking previous low), the indicator plots a buy signal below the candle in the form of an upward-facing triangle labeled "Buy" in green. This serves as a visual cue for traders to consider entering a buy position.
Optional Previous Low Plot: For added reference, the indicator plots the previous candle's low as a red step-line on the chart. This helps traders visualize when the price has dipped below the prior candle's low, making it easier to spot instances where the pattern is forming.
How to Use:
This indicator can be used across multiple timeframes, whether you’re trading short-term intraday patterns or longer-term swing trades.
It works well in markets that experience pullbacks or minor retracements, as the pattern it identifies suggests a rejection of lower prices followed by a push higher.
Traders can combine this indicator with other technical analysis tools (such as moving averages, support/resistance levels, or momentum oscillators) to strengthen the buy signals and add more context to the trading decision.
Example Scenarios:
Reversal Signal: Suppose a market has been in a minor downtrend, and suddenly a green candle forms after a low that breaks the previous day’s low. This indicator would generate a buy signal, suggesting the downtrend may be losing strength and that buyers are taking control. This could be an early indication of a reversal.
Bullish Continuation After Pullback: Imagine a market in a steady uptrend experiences a temporary pullback. The price breaks the previous candle’s low, but the current candle closes higher (green candle). This buy signal could indicate that the pullback is over, and the uptrend is likely to continue.
Advantages:
Simplicity: This indicator relies on basic price action (green candles and lows) without requiring complicated indicators or oscillators, making it easy to understand and use.
Visual Alerts: The plotted buy signals and previous lows provide a clear, visual representation on the chart, simplifying decision-making for traders.
Versatility: It can be applied across different timeframes and asset classes (stocks, forex, crypto, etc.), making it a versatile tool for all kinds of traders.
Limitations:
As with any single indicator or pattern, this should not be used in isolation. It is important to incorporate broader market context, support/resistance levels, and other forms of analysis to avoid false signals.
The pattern tends to be more effective when there’s sufficient market liquidity and may perform better in trending or volatile markets compared to sideways or flat markets.

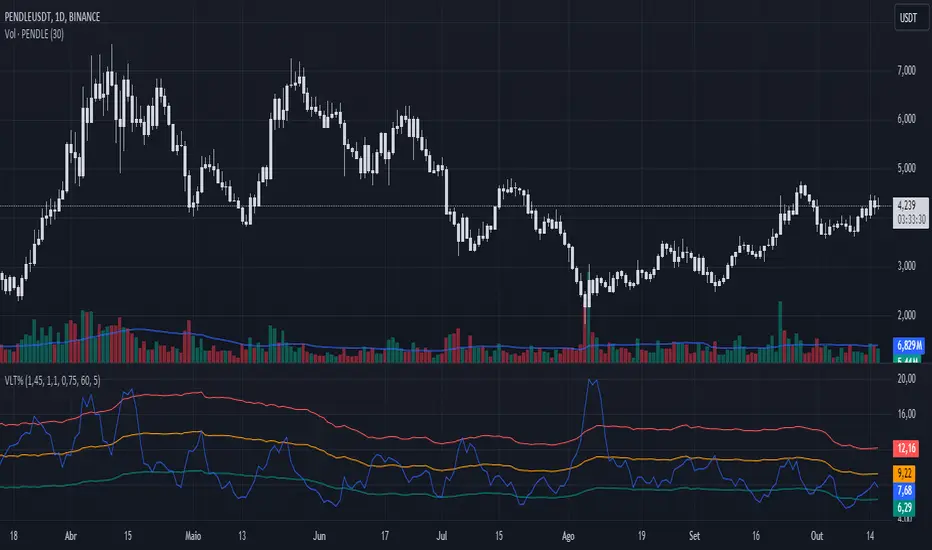
Volatility %This indicator compares the average range of candles over a long period with the average range of a short period (which can be defined according to whether the strategy is more long-term or short-term), thus allowing the measurement of the asset's volatility or the strength of the movement. It was also created to be used on the 1D time frame with Swing Trading.
This indicator does not aim to predict the direction or strength of the next movement, but seeks to indicate whether the asset's value is moving more or less than the average. Based on the principle of alternation, after a large movement, there will likely be a short movement, and after a short movement, there will likely be a long one. Therefore, phases with less movement can be a good time to position oneself, and if volatility starts to decrease and the target has not been reached, closing the position can be considered.
This indicator also comes with three bands of percentage volatility averages altered by a multiplier, allowing for a dynamic reading of how volatile the market is. These should be adapted according to the asset.
This indicator is not meant to be used alone but as an auxiliary indicator.
Cosine-Weighted MA ATR [InvestorUnknown]The Cosine-Weighted Moving Average (CWMA) ATR (Average True Range) indicator is designed to enhance the analysis of price movements in financial markets. By incorporating a cosine-based weighting mechanism , this indicator provides a unique approach to smoothing price data and measuring volatility, making it a valuable tool for traders and investors.
Cosine-Weighted Moving Average (CWMA)
The CWMA is calculated using weights derived from the cosine function, which emphasizes different data points in a distinctive manner. Unlike traditional moving averages that assign equal weight to all data points, the cosine weighting allocates more significance to values at the edges of the data window. This can help capture significant price movements while mitigating the impact of outlier values.
The weights are shifted to ensure they remain non-negative, which helps in maintaining a stable calculation throughout the data series. The normalization of these weights ensures they sum to one, providing a proportional contribution to the average.
// Function to calculate the Cosine-Weighted Moving Average with shifted weights
f_Cosine_Weighted_MA(series float src, simple int length) =>
var float cosine_weights = array.new_float(0)
array.clear(cosine_weights) // Clear the array before recalculating weights
for i = 0 to length - 1
weight = math.cos((math.pi * (i + 1)) / length) + 1 // Shift by adding 1
array.push(cosine_weights, weight)
// Normalize the weights
sum_weights = array.sum(cosine_weights)
for i = 0 to length - 1
norm_weight = array.get(cosine_weights, i) / sum_weights
array.set(cosine_weights, i, norm_weight)
// Calculate Cosine-Weighted Moving Average
cwma = 0.0
if bar_index >= length
for i = 0 to length - 1
cwma := cwma + array.get(cosine_weights, i) * close
cwma
Cosine-Weighted ATR Calculation
The ATR is an essential measure of volatility, reflecting the average range of price movement over a specified period. The Cosine-Weighted ATR uses a similar weighting scheme to that of the CWMA, allowing for a more nuanced understanding of volatility. By emphasizing more recent price movements while retaining sensitivity to broader trends, this ATR variant offers traders enhanced insight into potential price fluctuations.
// Function to calculate the Cosine-Weighted ATR with shifted weights
f_Cosine_Weighted_ATR(simple int length) =>
var float cosine_weights_atr = array.new_float(0)
array.clear(cosine_weights_atr)
for i = 0 to length - 1
weight = math.cos((math.pi * (i + 1)) / length) + 1 // Shift by adding 1
array.push(cosine_weights_atr, weight)
// Normalize the weights
sum_weights_atr = array.sum(cosine_weights_atr)
for i = 0 to length - 1
norm_weight_atr = array.get(cosine_weights_atr, i) / sum_weights_atr
array.set(cosine_weights_atr, i, norm_weight_atr)
// Calculate Cosine-Weighted ATR using true ranges
cwatr = 0.0
tr = ta.tr(true) // True Range
if bar_index >= length
for i = 0 to length - 1
cwatr := cwatr + array.get(cosine_weights_atr, i) * tr
cwatr
Signal Generation
The indicator generates long and short signals based on the relationship between the price (user input) and the calculated upper and lower bands, derived from the CWMA and the Cosine-Weighted ATR. Crossover conditions are used to identify potential entry points, providing a systematic approach to trading decisions.
// - - - - - CALCULATIONS - - - - - //{
bar b = bar.new()
float src = b.calc_src(cwma_src)
float cwma = f_Cosine_Weighted_MA(src, ma_length)
// Use normal ATR or Cosine-Weighted ATR based on input
float atr = atr_type == "Normal ATR" ? ta.atr(atr_len) : f_Cosine_Weighted_ATR(atr_len)
// Calculate upper and lower bands using ATR
float cwma_up = cwma + (atr * atr_mult)
float cwma_dn = cwma - (atr * atr_mult)
float src_l = b.calc_src(src_long)
float src_s = b.calc_src(src_short)
// Signal logic for crossovers and crossunders
var int signal = 0
if ta.crossover(src_l, cwma_up)
signal := 1
if ta.crossunder(src_s, cwma_dn)
signal := -1
//}
Backtest Mode and Equity Calculation
To evaluate its effectiveness, the indicator includes a backtest mode, allowing users to test its performance on historical data:
Backtest Equity: A detailed equity curve is calculated based on the generated signals over a user-defined period (startDate to endDate).
Buy and Hold Comparison: Alongside the strategy’s equity, a Buy-and-Hold equity curve is plotted for performance comparison.
Visualization and Alerts
The indicator features customizable plots, allowing users to visualize the CWMA, ATR bands, and signals effectively. The colors change dynamically based on market conditions, with clear distinctions between long and short signals.
Alerts can be configured to notify users of crossover events, providing timely information for potential trading opportunities.

Sine-Weighted MA ATR [InvestorUnknown]The Sine-Weighted MA ATR is a technical analysis tool designed to emphasize recent price data using sine-weighted calculations , making it particularly well-suited for analyzing cyclical markets with repetitive patterns . The indicator combines the Sine-Weighted Moving Average (SWMA) and a Sine-Weighted Average True Range (SWATR) to enhance price trend detection and volatility analysis.
Sine-Weighted Moving Average (SWMA):
Unlike traditional moving averages that apply uniform or exponentially decaying weights, the SWMA applies Sine weights to the price data.
Emphasis on central data points: The Sine function assigns more weight to the middle of the lookback period, giving less importance to the beginning and end points. This helps capture the main trend more effectively while reducing noise from recent volatility or older data.
// Function to calculate the Sine-Weighted Moving Average
f_Sine_Weighted_MA(series float src, simple int length) =>
var float sine_weights = array.new_float(0)
array.clear(sine_weights) // Clear the array before recalculating weights
for i = 0 to length - 1
weight = math.sin((math.pi * (i + 1)) / length)
array.push(sine_weights, weight)
// Normalize the weights
sum_weights = array.sum(sine_weights)
for i = 0 to length - 1
norm_weight = array.get(sine_weights, i) / sum_weights
array.set(sine_weights, i, norm_weight)
// Calculate Sine-Weighted Moving Average
swma = 0.0
if bar_index >= length
for i = 0 to length - 1
swma := swma + array.get(sine_weights, i) * close
swma
Sine-Weighted ATR:
This is a variation of the Average True Range (ATR), which measures market volatility. Like the SWMA, the ATR is smoothed using Sine-based weighting, where central values are more heavily considered compared to the extremities. This improves sensitivity to changes in volatility while maintaining stability in highly volatile markets.
// Function to calculate the Sine-Weighted ATR
f_Sine_Weighted_ATR(simple int length) =>
var float sine_weights_atr = array.new_float(0)
array.clear(sine_weights_atr)
for i = 0 to length - 1
weight = math.sin((math.pi * (i + 1)) / length)
array.push(sine_weights_atr, weight)
// Normalize the weights
sum_weights_atr = array.sum(sine_weights_atr)
for i = 0 to length - 1
norm_weight_atr = array.get(sine_weights_atr, i) / sum_weights_atr
array.set(sine_weights_atr, i, norm_weight_atr)
// Calculate Sine-Weighted ATR using true ranges
swatr = 0.0
tr = ta.tr(true) // True Range
if bar_index >= length
for i = 0 to length - 1
swatr := swatr + array.get(sine_weights_atr, i) * tr
swatr
ATR Bands:
Upper and lower bands are created by adding/subtracting the Sine-Weighted ATR from the SWMA. These bands help identify overbought or oversold conditions, and when the price crosses these levels, it may generate long or short trade signals.
// - - - - - CALCULATIONS - - - - - //{
bar b = bar.new()
float src = b.calc_src(swma_src)
float swma = f_Sine_Weighted_MA(src, ma_length)
// Use normal ATR or Sine-Weighted ATR based on input
float atr = atr_type == "Normal ATR" ? ta.atr(atr_len) : f_Sine_Weighted_ATR(atr_len)
// Calculate upper and lower bands using ATR
float swma_up = swma + (atr * atr_mult)
float swma_dn = swma - (atr * atr_mult)
float src_l = b.calc_src(src_long)
float src_s = b.calc_src(src_short)
// Signal logic for crossovers and crossunders
var int signal = 0
if ta.crossover(src_l, swma_up)
signal := 1
if ta.crossunder(src_s, swma_dn)
signal := -1
//}
Signal Logic:
Long/Short Signals are triggered when the price crosses above or below the Sine-Weighted ATR bands
Backtest Mode and Equity Calculation
To evaluate its effectiveness, the indicator includes a backtest mode, allowing users to test its performance on historical data:
Backtest Equity: A detailed equity curve is calculated based on the generated signals over a user-defined period (startDate to endDate).
Buy and Hold Comparison: Alongside the strategy’s equity, a Buy-and-Hold equity curve is plotted for performance comparison.
Alerts
The indicator includes built-in alerts for both long and short signals, ensuring users are promptly notified when market conditions meet the criteria for an entry or exit.

CAPE / Shiller PE RatioThe CAPE (Cyclically Adjusted Price-to-Earnings) or Shiller PE ratio is a popular valuation measure used by investors to assess whether a stock or index is over or undervalued relative to its historical earnings. Unlike the traditional P/E ratio, the CAPE ratio smooths earnings over ten years, adjusting for inflation and providing a more stable and long-term view of valuation.
This indicator lets you quickly calculate and visualize the CAPE ratio for any stock on TradingView, helping you make informed decisions about the sustainability of current price levels. With its clear presentation and intuitive setup, you can compare historical CAPE levels and identify potential opportunities for long-term investments or avoid overvalued markets.
Advantages of the CAPE Ratio:
Long-Term Focus : Smooth earnings over ten years, reducing the impact of short-term volatility.
Inflation-Adjusted : Provides a more precise, inflation-adjusted valuation measure over time.
Historical Comparison : Allows for benchmarking against long-term historical averages.
Market Sentiment Indicator : Can highlight overvalued or undervalued markets for long-term investors.
Reduces Noise : Filters out short-term earnings fluctuations, offering a more stable view.
Disadvantages of the CAPE Ratio:
Ignores Recent Earnings : Misses short-term earnings changes, which can affect current valuations.
Outdated Data : Relies on old earnings data that may not reflect recent company performance.
Less Effective for Growth Stocks : May undervalue high-growth stocks focused on future earnings.
Sector Limitations : Works best for broad markets, less so for fast-changing industries.
Debated Predictive Power : It’s unreliable for timing short-term market movements.
In short, the CAPE ratio is excellent for long-term valuation but has limitations for short-term or growth-focused investing.
Disclaimer
Please remember that past performance may not be indicative of future results.
Due to various factors, including changing market conditions, the strategy may no longer perform as well as in historical backtesting.
This post and the script don’t provide any financial advice.

E9 Shark-32 PatternUnderstanding the Shark-32 Pattern and its Trading Applications
The Shark-32 Pattern is a bearish technical trading formation used to predict market reversals or trend continuations. It highlights a downward move followed by a corrective rally, signaling a potential resumption of the downtrend. Here’s a breakdown of how it works:
What is the Shark-32 Pattern?
The Shark-32 pattern is a five-wave structure typically observed in bearish markets:
Wave 0 to X: A significant price decline starts the pattern.
Wave X to A: A correction pushes the price slightly upward.
Wave A to B: The price drops again but doesn’t reach the initial low.
Wave B to C: A final sharp decline concludes the pattern.
Once Wave C is formed, it suggests that the market will continue to move downward, presenting a potential selling or shorting opportunity.
Using the Pattern in Trading
This pattern is valuable for traders seeking high-probability bearish setups. The goal is to capitalize on the continuation of a downtrend following the corrective rally (X to A). Identifying the Shark-32 pattern helps anticipate the next wave of selling pressure.
Trading Setup
Identify a Shark-32 pattern.
If the price closes above the pattern's high, buy at the open the next day.
If the price closes below the pattern's low, short at the open the next day.
Sell/cover when the price moves 7% in the direction of the breakout.
Close the trade for a loss if the price moves 7% in the opposite direction.
For example, in a bull market after an upward breakout from a Shark-32, the net gain was $69.55. The method won 56% of the time with 5,218 winning trades and an average gain of $714.07. Conversely, 44% of trades were losers, with an average loss of $747.33. The average holding period was 26 calendar days.
The gains and losses were closely aligned with the 7% threshold set for this test.
Key Target Levels
To enhance the strategy, use dotted projection lines as target levels:
Upper Target: Drawn above the high of the corrective rally (Wave A). If the price breaks above this line, it may signal further upward movement, indicating a potentially weaker downtrend.
Lower Target: Positioned below the low of Wave C, providing a target for bearish trades.
These lines help determine future price targets and assist in setting take-profit or stop-loss levels.
Trading the Breakout
Look for breakouts once the Shark-32 pattern is identified:
Upward Breakout: If the price closes above the green line (high from two bars ago), it indicates a potential reversal to the upside.
Downward Breakout: If the price breaks below the red line (low from two bars ago), it confirms the bearish continuation.
Breakouts allow traders to adjust their positions based on market shifts.
Trading Tips
Continuation: The Shark-32 pattern acts as a continuation 60% of the time, confirming the ongoing trend.
Breakout Confirmation: Wait for the price to close above or below the pattern’s key levels before entering a trade.
Trade with the Trend: Since the Shark-32 is a continuation pattern, expect the breakout to align with the inbound price trend.
Symmetry: Patterns with symmetry often perform better. For more insights, refer to detailed trading literature.
Half-Staff: The Shark-32 can form midway in a trend, similar to flags and pennants.
Shark-32: Trading Performance
Based on an analysis of 23,369 trades, the following performance metrics were observed:
Bull Market with Upward Breakout: The average net profit was $69.55. This method won 56% of the time, with winning trades averaging $714.07. Losing trades, which constituted 44% of the total, had an average loss of $747.33. The average holding period was 26 calendar days.
Bull Market with Downward Breakout: The average net loss was $(76.36). This method won 43% of the time, with winning trades averaging $753.56. Losing trades, which constituted 57% of the total, had an average loss of $706.32. The average holding period was 23 calendar days.
Bear Market with Upward Breakout: The average net loss was $(89.13). This method won 46% of the time, with winning trades averaging $710.77. Losing trades, which constituted 54% of the total, had an average loss of $756.97. The average holding period was 16 calendar days.
Bear Market with Downward Breakout: The average net profit was $65.17. This method won 52% of the time, with winning trades averaging $781.62. Losing trades, which constituted 48% of the total, had an average loss of $722.41. The average holding period was 13 calendar days.
Price Close ProbabilityThe Price Close Probability Indicator is designed to help traders estimate the likelihood of price closing above or below specified levels within a given bar. By placing two levels on your chart, you can quickly gauge the probability of the current price bar closing above or below these levels in real-time.
Key Features:
Dynamic Probability Calculation: The indicator continuously updates the probability of price closing above or below your set levels as the current bar progresses, providing you with timely insights as the bar approaches its close.
Customizable Standard Deviation : Adjust the length of the Standard Deviation used in the calculations to tailor the probability estimates to your preferred settings.
User-Friendly Probability Table : A clean, easy-to-read table displays the calculated probabilities, helping you make informed trading decisions at a glance.
Assumptions and Considerations:
While the indicator assumes that returns are normally distributed, which may not fully reflect reality, it still offers a valuable approximation of the probabilities for price movement within the current bar.
Future Enhancements (Coming Soon):
Multi-Bar Probability: Calculate probabilities across multiple bars to enhance your forecasting capabilities.
Additional Levels: Set more than two levels for a broader analysis of price movements.
Refined Distribution Modeling: Improve the accuracy of probability calculations by adjusting for more realistic return distributions.
Disclaimer
Please remember that past performance may not be indicative of future results.
Due to various factors, including changing market conditions, the strategy may no longer perform as well as in historical backtesting.
This post and the script don’t provide any financial advice.

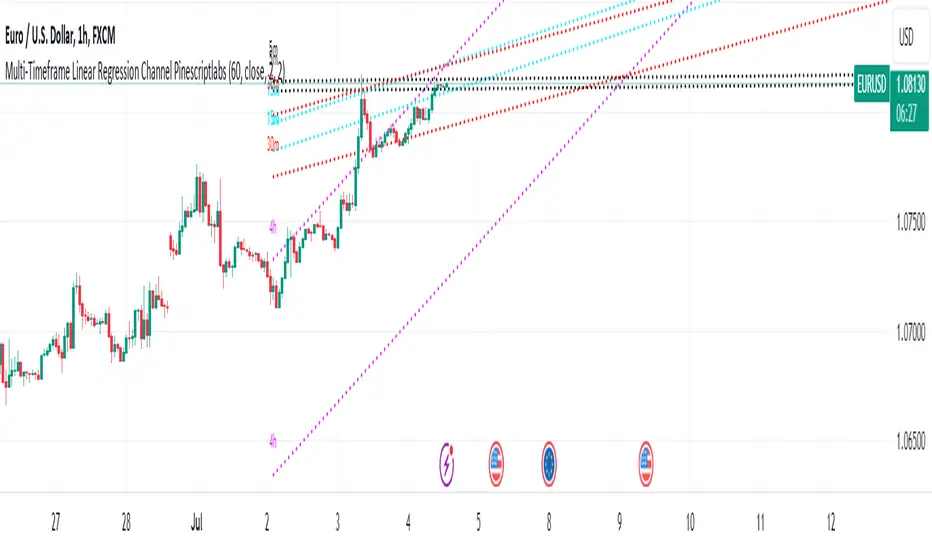
Multi-Timeframe Linear Regression Channel (Pinescriptlabs)This script combines multiple timeframes for visualizing linear regression channels in a single chart, allowing us to obtain a holistic view of price behavior across different timeframes (5m, 15m, 30m, and 4h). It facilitates the identification of trends and support/resistance levels across various time horizons. This multi-timeframe approach is useful because it helps confirm signals and detect potential divergences.
Components and Their Interaction
Linear Regression: Calculates the regression line and standard deviations for different timeframes. These lines show the direction and strength of the trend.
Deviation Bands: The upper and lower bands act as dynamic support and resistance levels, based on the standard deviation or maximum deviation.
Colors and Labels: Different colors for each timeframe allow for quick and clear identification of the regression lines and their bands. The labels help identify the timeframe of each channel.
Justification for the Mashup
Combining linear regressions across different timeframes allows us to observe short, medium, and long-term trends in a single chart. This multi-timeframe approach provides a more comprehensive market perspective compared to using a single timeframe.
Default Properties
The default properties of the strategy are configured to provide a clear view of the regression channels across different timeframes. These properties include:
Channel Length: Default of 50 periods, adjustable between 1 and 5000.
Data Source: Closing price by default.
Deviations: Optional use of upper and lower deviations with adjustable multipliers.
Line Extension: Option to extend lines to the right for better visualization.
Underlying Concepts
Calculating linear regression involves determining the slope, mean, and intercept of a line that best fits the price data. Standard deviations are used to create bands around this line, providing a measure of volatility. Implementing this in different timeframes allows us to observe how the trend changes over time and helps identify more precise entry and exit points.
This script is particularly useful for traders looking for an integrated tool that allows them to observe price behavior across multiple timeframes without needing to switch between different charts.
1.- For example, in the main image of the script, we observe that we are in a 1-hour timeframe, where the 4-hour linear regression channel indicates an uptrend with a length of 60 periods. Meanwhile, the 15-minute and 30-minute channels identify a convergence in the same trend. However, in the 5-minute linear regression, we have a completely lateral channel. These channels, shown from different timeframes in a single chart, give us a clear idea of exactly where the price is heading in each timeframe. Each channel serves as support or resistance for a lower or higher timeframe, depending on which timeframe we are looking at. Next, we will go to each timeframe to observe how the regression channels are displayed
(5min):
(15min):
(30min):
(4h):
Español:
Este script combina múltiples marcos de tiempo para la visualización de canales de regresión lineal en un solo gráfico, nos permitirá obtener una visión holística del comportamiento del precio en diferentes marcos temporales (5m, 15m, 30m y 4h) permite la identificación de tendencias y niveles de soporte/resistencia en diferentes horizontes de tiempo. Este enfoque multi-temporal es útil porque permite confirmar señales y detectar posibles divergencias.
Componentes y su Interacción
Regresión Lineal: Calcula la línea de regresión y las desviaciones estándar para diferentes marcos temporales. Estas líneas muestran la dirección y la fuerza de la tendencia.
Bandas de Desviación: Las bandas superior e inferior actúan como niveles dinámicos de soporte y resistencia, basados en la desviación estándar o la desviación máxima.
Colores y Etiquetas: Diferentes colores para cada marco temporal permiten una identificación rápida y clara de las líneas de regresión y sus bandas. Las etiquetas ayudan a identificar el marco temporal de cada canal.
Justificación del Mashup
La combinación de regresiones lineales en diferentes marcos temporales nos permite observar la tendencia a corto, medio y largo plazo en un solo gráfico. Este enfoque multi-temporal proporciona una perspectiva más completa del mercado en comparación con el uso de un solo marco temporal.
Propiedades por Defecto
Las propiedades por defecto de la estrategia están configuradas para proporcionar una visión clara de los canales de regresión en diferentes marcos temporales. Estas propiedades incluyen:
Longitud del Canal: 50 períodos por defecto, ajustable entre 1 y 5000.
Fuente de Datos: Precio de cierre por defecto.
Desviaciones: Uso opcional de desviaciones superiores e inferiores con multiplicadores ajustables.
Extensión de Líneas: Opción para extender las líneas hacia la derecha para una mejor visualización.
Conceptos Subyacentes
El cálculo de la regresión lineal implica determinar la pendiente, la media y la intersección de una línea que mejor se ajusta a los datos de precios. Las desviaciones estándar se utilizan para crear bandas alrededor de esta línea, proporcionando una medida de la volatilidad. La implementación en diferentes marcos temporales permite observar cómo cambia la tendencia a lo largo del tiempo y ayuda a identificar puntos de entrada y salida más precisos.
Este script es particularmente útil para traders que buscan una herramienta integrada que les permita observar el comportamiento del precio en múltiples marcos temporales sin necesidad de cambiar entre diferentes gráficos.
Por ejemplo en la imagen principal del script observamos que estamos en un timeframe de 1h, donde el canal de regresión lineal de 4h, nos indica en un length de 60 periodos una tendencia alcista, mientras que los canales de 15min y 30 min nos identifican una convergencia en la misma tendencia, sin embargo en la regresión lineal de 5 minutos tenemos un canal totalmente lateral, estos canales mostrados de diferentes marcos de tiempo en un solo grafico nos da una clara idea de exactamente de a donde esta dirigiendo el precio en cada marco de tiempo a la par que cada canal nos sirve como soporte o resistencia de un marco de tiempo ya sea inferior o mayor dependiendo en que time frame nos coloquemos, a continuación iremos a cada marco de tiempo para que observemos como se muestran los canales de regresión:
(5min):
(15min):
(30min):
(4h):
Multiple Instrument Automation ScreenerI have developed a Pine Script indicator on TradingView designed to demonstrate how to automate execution for ten instruments. This example utilizes a straightforward, Simple Moving Average (SMA) indicator. You can use it as a template, but use your indicator.
The indicator computes long/short signals based on the crossing of the SMA using the security function
It acts as a screener, presenting calculation results in an organized table format.
Utilizing the varip variable, the indicator sends alerts for multiple instruments sequentially rather than simultaneously.
For every generated signal, the indicator builds and sends a JSON execution command to a third-party tool, ensuring seamless integration and automation. You can use your own format.
Sent alerts look like this:
{"ticker": "DOGEBTC","action": "buy","price": "0.00000199","time": "1719754620658"}
Details and Limitations
Instrument Limit: The example is configured for ten instruments for simplicity. However, it can be expanded to handle up to 40 instruments.
Alert Rate Limit: There is a rate limit of 15 alerts in 3 minutes. Exceeding this limit may cause some alerts to be stopped. This can be managed by tracking the alert times and delaying some alerts, though this may affect the entry prices.
Timing of Signal Generation : The indicator processes signals at the bar close to the active instrument. Due to its computational complexity, there is a slight delay in collecting all records, potentially causing signals to reflect a few seconds before the bar closes. Care should be taken when executing based on these signals.
Disclaimer
Please remember that past performance may not be indicative of future results.
Due to various factors, including changing market conditions, the strategy may no longer perform as well as in historical backtesting.
This post and the script don’t provide any financial advice.

Multiple Indicators Screener v2After taking the approval of Mr. QuantNomad
Multiple Indicators Screener by QuantNomad
New lists have been modified and added
Built-in indicators:
RSI (Relative Strength Index): Provides trading opportunities based on overbought or oversold market conditions.
MFI (Cash Flow Index): Measures the flow of cash into or from assets, which helps in identifying buying and selling areas.
Williams Percent Range (WPR): Measures how high or low the price has been in the last time period, giving signals of periods of saturation.
Supertrend: Used to determine market direction and potential entry and exit locations.
Volume Change Percentage: Provides an analysis of the volume change percentage, which helps in identifying demand and supply changes for assets.
How to use:
Users can choose which symbols they want to monitor and analyze using a variety of built-in indicators.
The indicator provides visual signals that help traders identify potential trading opportunities based on the selected settings.
RSI in purple = buy weak liquidity (safe entry).
MFI in yellow = Liquidity
WPR in blue = RSI, MFI and WPR in oversold areas for all.
Allows users to customize the display locations and appearance of the cursor to their personal preferences.
Disclaimer
Please remember that past performance may not be indicative of future results.
Due to various factors, including changing market conditions, the strategy may no longer perform as well as in historical backtesting.
This post and the script don’t provide any financial advice.
=========================================================================
فاحص لمؤشرات متعددة مع مخرجات جدول شاملة لتسهيل مراقبة الكثير من العملات تصل الى 99 في وقت واحد
بختصر الشرح
ظهور اللون البنفسجي يعني كمية الشراء ضعف السيولة .
ظهور اللون الازرق جميع المؤشرات وصلة الى مرحلة التشبع البيعي ( دخول آمن )
ظهور اللون الاصفر يعني السيولة ضعفين الشراء ( عكس اتجاه قريب ) == ركزو على هاللون خصوصا مع عملات الخفيفة

Buffett IndicatorThis is an open-source version of the Buffett indicator. The old version was code-protected and broken, so I created another version.
It's computed simply as the entire SPX 500 capitalization divided by the US GDP. Since TradingView does not have data for the SPX 500 capitalization, I used quarterly values of SPX devisors as a proxy.
I tried to create another version of the Buffett indicator for other countries/indexes, but I can't find the data. If you can help me find data for index divisors, I can add more choices to this indicator.
It's interesting to see how this indicator's behavior has changed in the last few years. Levels that looked crazy are not so crazy anymore.
Disclaimer
Please remember that past performance may not be indicative of future results.
Due to various factors, including changing market conditions, the strategy may no longer perform as well as in historical backtesting.
This post and the script don’t provide any financial advice.

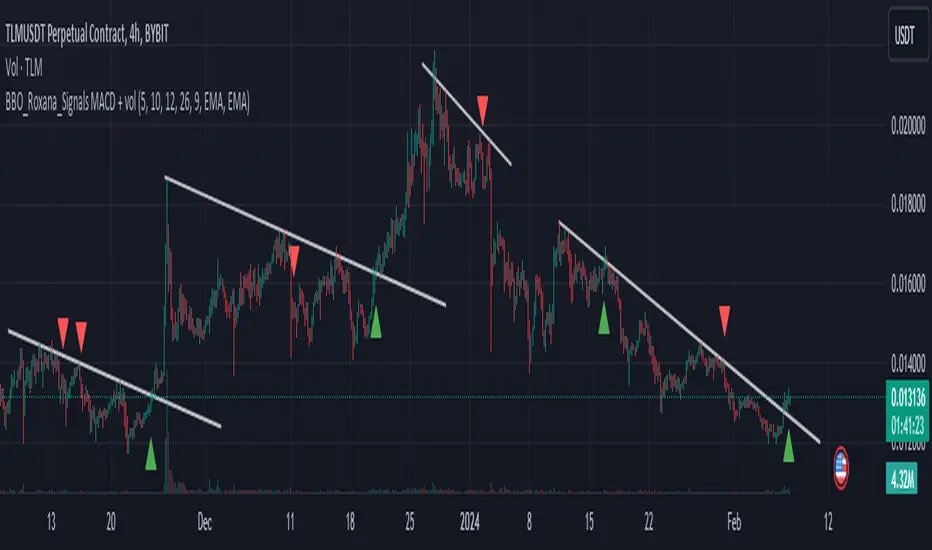
BBO_Roxana_Signals MACD + volDescription of BBO_Roxana_Signals MACD + vol Script
This script is designed to provide trading signals based on a combination of the MACD (Moving Average Convergence Divergence) indicator and volume analysis. Here's a systematic breakdown of how the script functions:
Volume Accumulation Check:
The script first accumulates volume data over time. It ensures that there's volume data available for analysis. If no volume data is provided, it generates a runtime error.
MACD Calculation:
The script calculates the MACD indicator using the provided parameters, including fast and slow lengths for exponential moving averages (EMA), as well as signal smoothing.
It computes the fast and slow EMAs, calculates the MACD line by subtracting the slow EMA from the fast EMA, and then computes the signal line.
Volume Oscillator Calculation:
It calculates a volume oscillator by computing the difference between short and long EMAs of volume and then normalizing the result to a percentage.
Signal Generation:
Long signals are generated when there's a crossover of the MACD line above the zero line and the volume oscillator is above the zero line. These are marked on the chart with upward green triangles.
Short signals are generated when there's a crossunder of the MACD line below the zero line and the volume oscillator is above the zero line. These are marked on the chart with downward red triangles.
Alerts:
The script also provides alerts for long signals, short signals, and combined signals. These alerts can be used for automated trading or as notifications for manual trading decisions.
Recommendation:
This script should be used in conjunction with other technical analysis tools and trend analysis for comprehensive trading decisions.
It's advisable to backtest the strategy on historical data before deploying it in live trading to evaluate its effectiveness and suitability for your trading goals.
By integrating MACD analysis with volume analysis, the script aims to provide signals based on both momentum and volume trends, offering a more comprehensive approach to trading decision-making.
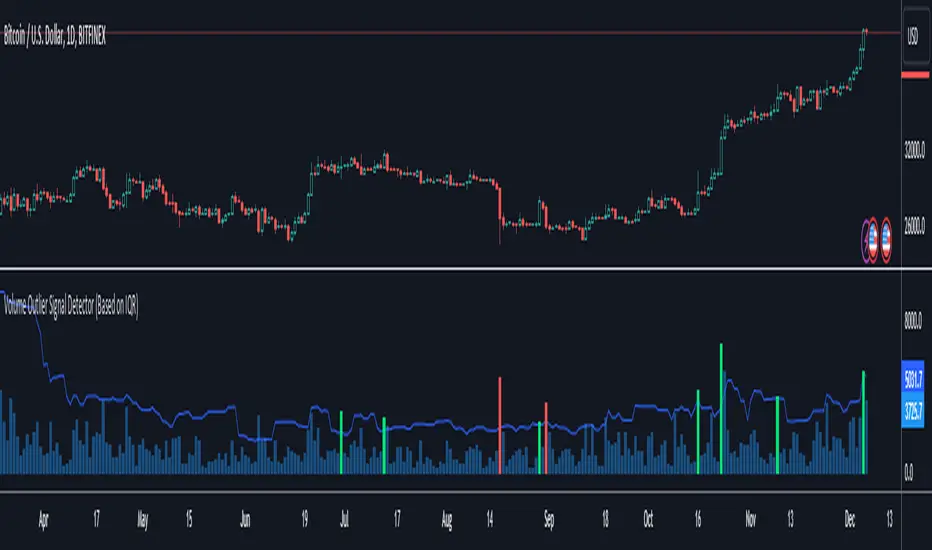
Volume Outlier Signal Detector (Based on IQR)This indicator can detect outliers in trading volume using the 1.5 IQR rule or the outlier formula.
The outlier formula designates outliers based on upper and lower boundaries. Any value that is 1.5 times the Interquartile Range (IQR) greater than the third quartile is designated as an outlier.
The indicator computes the Q3 (75th percentile) and Q1 (25th percentile) of a given volume dataset. The IQR is then calculated by subtracting the Q1 volume from the Q3 volume.
To identify volume outliers, the indicator uses the formula:
Q3 Volume + IQR Multiplier(1.5) * IQR
If the trading volume surpasses the volume outlier, the indicator will display either a green or red column.
A green column indicates that the current bar volume is higher than the volume outlier, and simultaneously, the current bar close is higher than the previous bar's close. Vice versa for the red column.
Moving averages are an optional parameter that can be added to filter out instances where the indicator shows a green or red column. If this option is enabled, the indicator will not display a green column if the price is not above the moving average, and vice versa for red columns.
Several settings can be customized to personalize this indicator, such as setting the moving average filter to higher timeframes. The MA type can also be switched, and IQR settings can be adjusted to fit different markets.
This indicator only works with TradingView charts with volume data.
***Disclaimer:
Before using this indicator for actual trading, make sure to conduct a back test to ensure the strategy is not a losing one in the long run. Apply proper risk management techniques, such as position sizing and using stop loss.
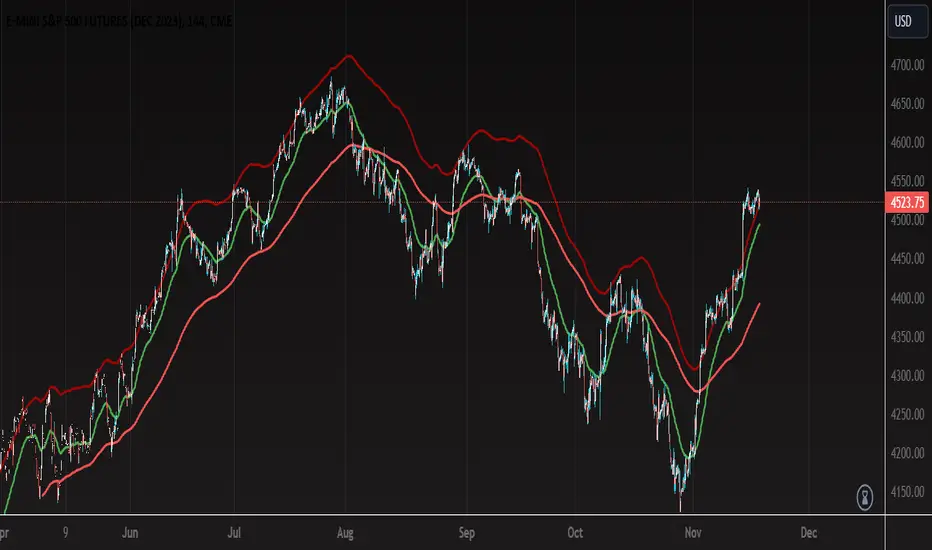
Multiple Moving Averages with OffsetUser Description:
This indicator is designed to provide insights into market trends based on multiple moving averages with customizable offsets. It combines short-term and long-term moving averages to offer a comprehensive view of price movements. The user can adjust various parameters to tailor the indicator to their preferred settings.
How the Strategy Works:
Short-Term Fast Moving Average:
Length: 47 (Adjustable by the user)
Offset: Adjustable (User-defined)
Color: Green
Line Thickness: 2 (Thicker green line for better visibility)
Long-Term Fast Moving Average:
Length: 203 (Adjustable by the user)
Offset: Adjustable (User-defined)
Color: Red
Line Thickness: 2 (Thicker red line for better visibility)
Long-Term Slow Moving Average:
Length: 100 (Adjustable by the user)
Offset: 77 (Adjustable by the user)
Color: Custom Red (RGB: 161, 5, 5)
Line Thickness: 2 (Thicker red line for better visibility)
Interpretation:
When the Short-Term Fast Moving Average (green line) is above the Long-Term Fast Moving Average (red line), it may signal a potential uptrend.
Conversely, when the Short-Term Fast Moving Average is below the Long-Term Fast Moving Average, it may indicate a potential downtrend.
The Long-Term Slow Moving Average provides additional context, allowing users to assess the strength and stability of trends.
Customization:
Users can experiment with different lengths and offsets to fine-tune the indicator based on their trading preferences and market conditions.
TIPS:
- When price action reaches upper RED moving average is probable that the price action is close to a pull back or change of direction.
- When price action falls and closes below the bottom RED moving average it can be a possible change of direction to the downside.
- You can use the green moving average as a filter and confluence to identify if the price action is moving towards the upside or downside.
Note: This indicator is for informational purposes only and should be used in conjunction with other analysis tools for comprehensive decision-making.
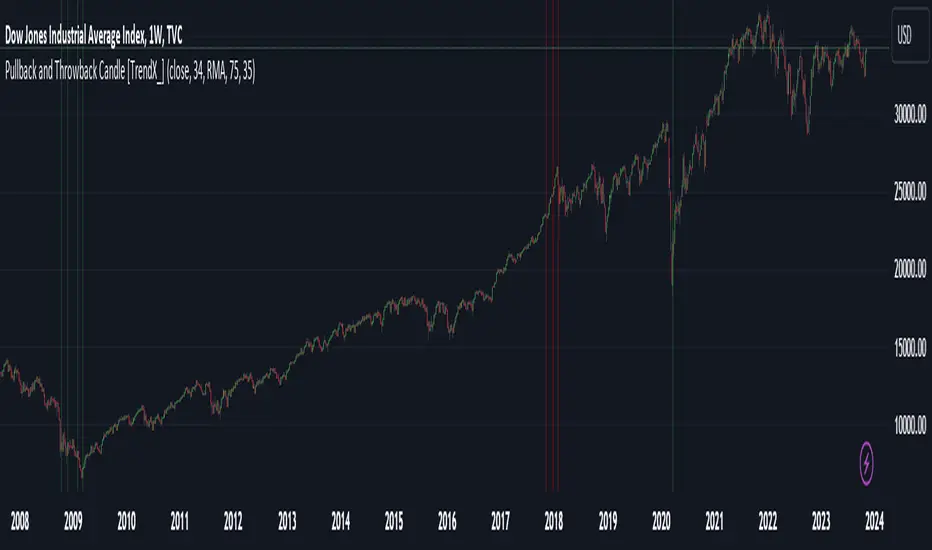
Pullback and Throwback Candle [TrendX_]Pullback and Throwback candles can help traders determine the the potential reversal points
USAGE
The indicator identifies pullback and throwback in overbought and oversold zones by measuring the distance between the price and its relative strength index.
A Pullback is an expected rebound in a downtrend (painted in green area), while a Throwback is a bounceback from an uptrend (painted in red area).
The strategy is useful for valuing reversal points. Accordingly, it can also be helpful for traders to use alongside other Technical Analysis indicators.
DISCLAIMER
This indicator is not financial advice, it can only help traders make better decisions.
There are many factors and uncertainties that can affect the outcome of any endeavor, and no one can guarantee or predict with certainty what will occur.
Therefore, one should always exercise caution and judgment when making decisions based on past performance.
JK - Q SuiteThis indicator is primarily for identifying pauses in Stage 2 uptrends, modelled on Qullamaggie's style of trading, but fits well with many traders including William O' Neil. or Mark Minervini.
I built this for my own purposes, and have gradually added range of tools into a single suite. My goal has also to be as clean as possible, while providing clear, actionable information.
This suite includes all of the following:
Moving averages (10, 20, 50, 200)
Coloured bars showing tightening price (blue under 75% of ADR, orange under 50% of ADR)
A 'markets' dashboard (top-right), showing the major indexes. Red if 10<20MA, or price <20MA
A 'sectors' dashboard (top-right, below markets). Red if 5<10MA, or price <10MA - see note below
Strength / Weakness information - two cells at the top, bottom-right. See below
Stock information - glanceable stock info as quick filters. The thresholds for ADR, Average volume, and Dollar Volume can be customised.
NOTE - if the 'tightening coloured candles' are not showing, the indicator needs to be at the top of the stack. Click the triple squares at the very bottom-right of the TradingView interface, and drag the indicator to the top, should work then!
=============
Sectors
These are based on the 11 official Sectors, tracked using index funds (XLY, XLK etc). HOWEVER, TradingView does NOT use the official 11 sectors - therefore I've done my best to match TradingViews ones to the official ones, but doesn't always work... e.g. 'Electronic Technology' is typically semiconductors, which are classes as 'Industrials', but Apple is the same sector in TV, but classed as 'Technology' using the official 11 Sectors.
If TradingView move to use the official 11 I'll update this, but for now it's a best guess and will sometimes be wrong, sorry!
Strength / Weakness information
This was an experiment in trying not to give too much back to the market! Typically the strategy would be to sell if price closes below 10MA (Weakness), however there may be large pops that can be advantageous to sell into.
The 'Strength' information (top cell, bottom-right), checks how far the price is extended above 10MA - this is customisable as a multiple of ADR. You may find that in weak markets (like now), it can be best to take profits quickly - in good markets, you could increase this as stocks make bigger or more sustained moves.
=============
While I'm not the best coder - and I've hacked and tried and changed different things - this has been a labour of love and essential for me.
If you have any suggestions, while I may or may not be able to implement them, I'm certainly open to ideas!

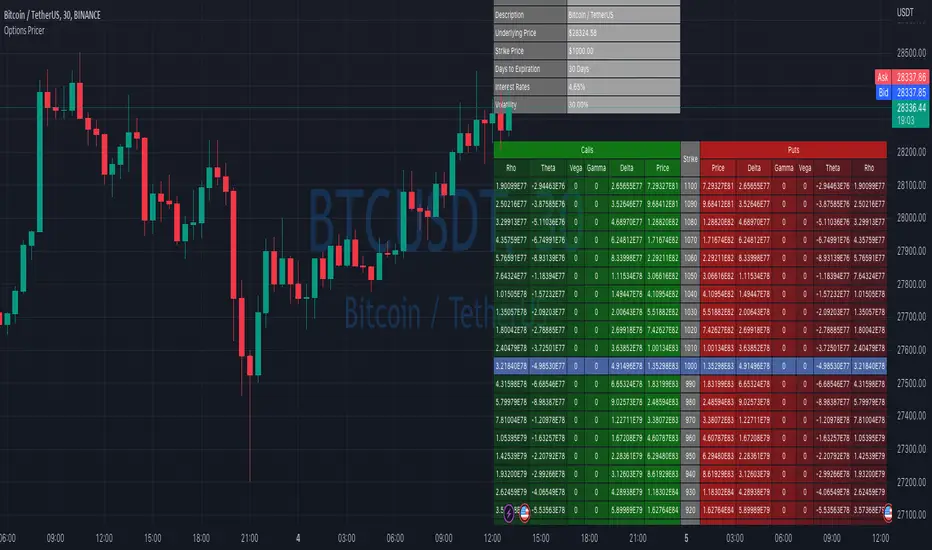
Options Price CalculatorIn the team, we continue to explore and expand the boundaries of TradingView.
For now, there is not much an options trader can do with options in TradingView.
We wanted to change that and created a simple option pricer.
You can set up in parameters a set of strikes, implied volatility, and days to expiry.
The indicators will take a risk-free rate from US01Y and the underlying price from your current chart.
It will compute prices and greeks for both put and call options.
Thanks to @MUQWISHI for helping code it.
Disclaimer
Please remember that past performance may not indicate future results.
Due to various factors, including changing market conditions, the strategy may no longer perform as well as in historical backtesting.
This post and the script don’t provide any financial advice.
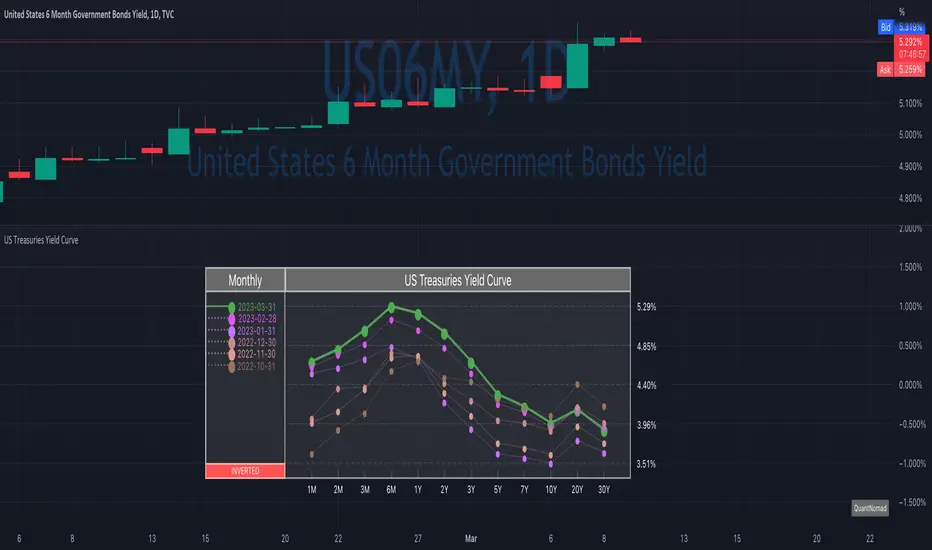
US Treasuries Yield CurveNews about the yield curve became pretty crucial for all the trades in the last year.
So in the team, we decided to implement a nice widget that will allow you to track the current yield curve in your chart directly.
It's possible to compare the current yield curve with past yield curves. You can choose to display the number of curves weeks, months, and years ago. So you can see the dynamics of the yield curve change.
When the Y2 > Y10 curve is considered invested, so you'll see an "Inverted" notification on the chart.
Thanks to @MUQWISHI for helping code it.
Disclaimer
Please remember that past performance may not indicate future results.
Due to various factors, including changing market conditions, the strategy may no longer perform as well as in historical backtesting.
This post and the script don’t provide any financial advice.
Bollinger Band Alert with RSI Filter IndicatorThis code is for a technical analysis indicator called Bollinger Band Alert with RSI Filter. It uses two tools: Bollinger Bands and Relative Strength Index (RSI) to identify potential trading signals in the market.
Bollinger Bands are lines plotted two standard deviations away from a simple moving average of the price of a stock or asset. They help traders determine whether prices are high or low on a relative basis.
The RSI is a momentum indicator that measures the strength of recent price changes to evaluate whether an asset is overbought or oversold.
The code has some input parameters that a user can change, such as length and multiplier, which are used to calculate the Bollinger Bands, and upper and lower RSI levels to define the overbought and oversold zones.
The code then uses if statements to generate alerts if certain conditions are met. The alert condition is triggered if the close price of an asset crosses above or below the upper or lower Bollinger Bands, and if the RSI is either above or below the overbought or oversold threshold levels.
Finally, the code generates plots to visualize the Bollinger Bands and displays triangles above or below the bars indicating when to enter a long or short position based on the strategy's criteria.
