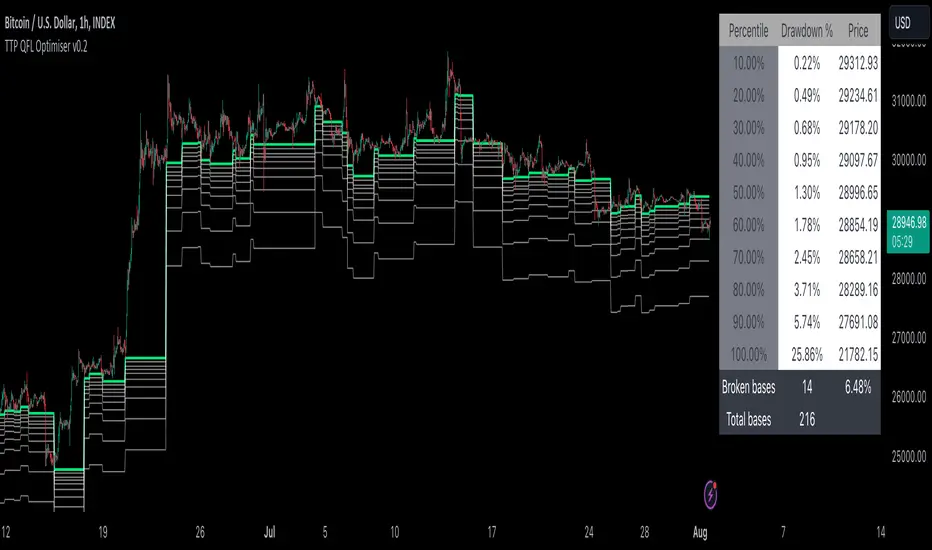
TTP QFL OptimiserThis tool is designed to help finding the best take profit and stop loss levels when trading with QFL bases (Quick Fingers Luc).
You can use it to see the average drawdown among all historic bases broken for an asset and then find the drawdowns that are more frequent using the percentile parameters provided.
For example, by knowing that 98% of the bases got broken with a drawdown of up to 5% can become extremely useful for deciding where to place your take profit or stop loss levels.
It supports QFL 1H, 2H and 4H but make sure to set the chart timeframe to a lower timeframe than QFL to obtain valid results.
Two percentiles are provided to be able to evaluate potential TP and SL at the same time.
Steps:
- Load an asset in the 15min TF
- Select the QFL version: 1H more deals / lower quality vs 4H less deals/ better quality
- Find a percentile that triggers enough deals (example: 70) and then another percentile that doesn't get hit too much (example: 98)
- Confirm the values p1 and p2 provided in the table and the white and grey lines for the results of which drawdown percentages correspond to such selection of percentiles
Once having p1 and p2 use your backtesting and forward testing tools to confirm and adjust accordingly.
חפש סקריפטים עבור "tp"
Trend Analyser by Abdul KhaderThis indicator is designed to provide buy and sell signals based on a combination of technical analysis methods. It uses the Relative Strength Index (RSI), Moving Average Convergence Divergence (MACD), and Exponential Moving Averages (EMA) to generate signals. It also calculates Stop Loss (SL) and Take Profit (TP) levels based on the Average True Range (ATR).
Components:
RSI: An oscillator that measures the speed and change of price movements. RSI is used to identify overbought and oversold conditions. In this indicator, an RSI below 30 is considered oversold and an RSI above 70 is considered overbought.
MACD: A trend-following momentum indicator that shows the relationship between two moving averages of a security’s price. The MACD triggers technical signals when it crosses above (to buy) or below (to sell) its signal line.
EMA: These moving averages give more weight to recent prices and are used to identify short-term price trends. A crossover of a shorter period EMA (9 periods in this case) above a longer period EMA (21 periods in this case) generates a buy signal. Conversely, a crossover of the shorter EMA below the longer EMA generates a sell signal.
ATR: This is a market volatility indicator. The ATR is used to calculate Stop Loss and Take Profit levels. These levels are set at a distance from the entry price, equal to a certain multiplier (1.5 in this case) of the ATR.
How to Use:
Buy Signal: A green triangle below the price bar indicates a buy signal. This is generated when the following conditions are met:
The short-term EMA crosses above the long-term EMA
The RSI is below 30 (oversold condition)
The MACD line crosses above the signal line and is above zero
Sell Signal: A red triangle above the price bar indicates a sell signal. This is generated when the following conditions are met:
The short-term EMA crosses below the long-term EMA
The RSI is above 70 (overbought condition)
The MACD line crosses below the signal line and is below zero
Stop Loss and Take Profit: These levels are indicated by dashed lines. The stop loss for a long position is set below the entry price, while the take profit is set above. For a short position, the stop loss is set above the entry price and the take profit is set below.
Important Notes:
This indicator is designed for intraday trading and may not be suitable for longer-term trades.
Always use this indicator in conjunction with other aspects of technical and fundamental analysis. No indicator can provide accurate signals 100% of the time.
Always backtest this indicator with historical data before using it in live trading.
Risk management is crucial in trading. Never risk more than a small percentage of your trading capital on a single trade.
Quantitative Trend Strategy- Uptrend longTrend Strategy #1
Indicators:
1. SMA
2. Pivot high/low functions derived from SMA
3. Step lines to plot support and resistance based on the pivot points
4. If the close is over the resistance line, green arrows plot above, and vice versa for red arrows below support.
Strategy:
1. Long Only
2. Mutable 2% TP/1.5% SL
3. 0.01% commission
4. When the close is greater than the pivot point of the sma pivot high, and the close is greater than the resistance step line, a long position is opened.
*At times, the 2% take profit may not trigger IF; the conditions for reentry are met at the time of candle closure + no exit conditions have been triggered.
5. If the position is in the green and the support step line crosses over the resistance step line, positions are exited.
How to use it and what makes it unique:
Use this strategy to trade an up-trending market using a simple moving average to determine the trend. This strategy is meant to capture a good risk/reward in a bullish market while staying active in an appropriate fashion. This strategy is unique due to it's inclusion of the step line function with statistics derived from myself.
This description tells the indicators combined to create a new strategy, with commissions and take profit/stop loss conditions included, and the process of strategy execution with a description on how to use it. If you have any questions feel free to PM me and boost if you enjoyed it. Thank you, pineUSERS!

Yesterday's High v.17.07Yesterday’s High Breakout it is a trading system based on the analysis of yesterday's highs, it works in trend-following mode therefore it opens a long position at the breakout of yesterday's highs even if they occur several times in one day.
There are several methods for exiting a trade, each with its own unique strategy. The first method involves setting Take-Profit and Stop-Loss percentages, while the second utilizes a trailing-stop with a specified offset value. The third method calls for a conditional exit when the candle closes below a reference EMA.
Additionally, operational filters can be applied based on the volatility of the currency pair, such as calculating the percentage change from the opening or incorporating a gap to the previous day's high levels. These filters help to anticipate or delay entry into the market, mitigating the risk of false breakouts.
In the specific case of INJ, a 12% Take-Profit and a 1.5% Stop-Loss were set, with an activated trailing-stop percentage, TRL 1 and OFF 0.5.
To postpone entry and avoid false breakouts, a 1% gap was added to the price of yesterday's highs.
Name: Yesterday's High Breakout - Trend Follower Strategy
Author: @tumiza999
Category: Trend Follower, Breakout of Yesterday's High.
Operating mode: Spot or Futures (only long).
Trade duration: Intraday.
Timeframe: 30M, 1H, 2H, 4H
Market: Crypto
Suggested usage: Short-term trading, when the market is in trend and it is showing high volatility.
Entry: When there is a breakout of Yesterday's High.
Exit: Profit target or Trailing stop, Stop loss or Crossunder EMA.
Configuration:
- Gap to anticipate or postpone the entry before or after the identified level
- Rate of Change for Entry Condition
- Take Profit, Stop Loss and Trailing Stop
- EMA length
Backtesting:
⁃ Exchange: BINANCE
⁃ Pair: INJUSDT
⁃ Timeframe: 4H
- Treshold: 1
- Gap%: 1
- SL: 1.5
- TP:12
- TRL: 1
- OFF-TRL: 0.5
⁃ Fee: 0.075%
⁃ Slippage: 1
- Initial Capital: 10000 USDT
- Position sizing: 10% of Equity
- Start : 2018-07-26 (Out Of Sample from 2022-12-23)
- Bar magnifier: on
Credits: LucF for Pine Coders (f_security function to avoid repainting using security)
Disclaimer: Risk Management is crucial, so adjust stop loss to your comfort level. A tight stop loss can help minimise potential losses. Use at your own risk.
How you or we can improve? Source code is open so share your ideas!
Leave a comment and smash the boost button!
Thanks for your attention, happy to support the TradingView community.

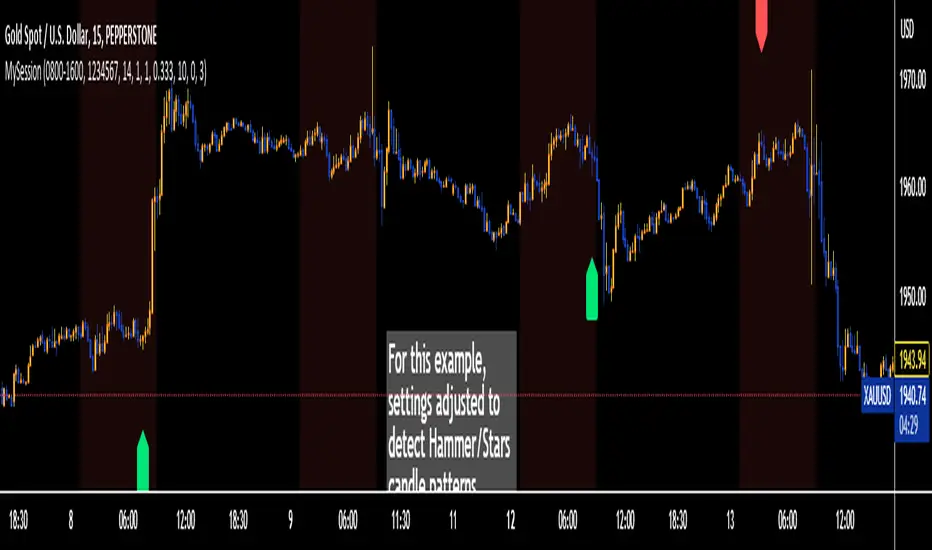
Trading Session TemplateDescription:
The Trading Session Template Indicator is a powerful script that allows traders to customize their own trading session time range on a chart. With this indicator, you have the flexibility to define specific hours during which you prefer to focus your trading activities. The example chart showcases the New York session hours, but you can easily adapt it to any desired time range based on your trading strategy and preferences.
Key Features:
Customizable Trading Session: The indicator empowers you to define your own trading session time range, tailored to your preferred market sessions or specific trading hours. This flexibility ensures that the indicator aligns with your unique trading strategy.
Highlighted Trading Session: When a new trading day begins, the script automatically scans for the specified time range. Once the first candle within the range begins printing, the background color of the chart is highlighted, indicating the beginning of the trading session. When the last candle within the range is closed, the background color returns to normal.
Focus on Specific Market Sessions: This indicator is particularly useful for traders who prefer to trade certain market sessions or specific hours during the day. By customizing the trading session, you can better align your trading activities with specific market conditions and trading opportunities.
Candle Pattern Detection: The indicator includes the ability to detect candle patterns such as Doji, Engulfing, Hammer, and Shooting Star. You can activate the desired candle patterns and set up alerts for them. When an alert is triggered, indicating the formation of a specific candle pattern, you can further analyze the market and make informed trading decisions.
ATR Filter: The indicator offers an ATR (Average True Range) filter to limit noise and focus on candle patterns with a size comparable to the ATR. You can set a minimum and maximum size for a candle compared to the ATR. This helps you filter out smaller or larger candles that may not align with your trading preferences.
Stop Loss (SL) and Take Profit (TP) Levels: When a candle pattern is detected, based on the ATR, the indicator can display suggested Stop Loss and Take Profit levels. This feature provides additional guidance for risk management and potential profit targets.
User-Friendly Interface: The indicator provides a user-friendly interface with adjustable settings and switches for customization. Tooltips are available to guide you through the various options and configurations, making it easy to adapt the indicator to your trading style and preferences.
Note:
The Trading Session Template Indicator is designed for timeframes lower than 1D. It does not plot any information on timeframes of 1D and higher.
Disclaimer:
The Trading Session Template Indicator is provided for informational and educational purposes only. Trading in the financial markets involves risk, and you should only trade with funds that you can afford to lose. The indicator's past performance is not indicative of future results. Always conduct your own research and due diligence before making any investment decisions. The creator of this indicator shall not be held responsible for any losses or damages incurred from the use of this indicator.
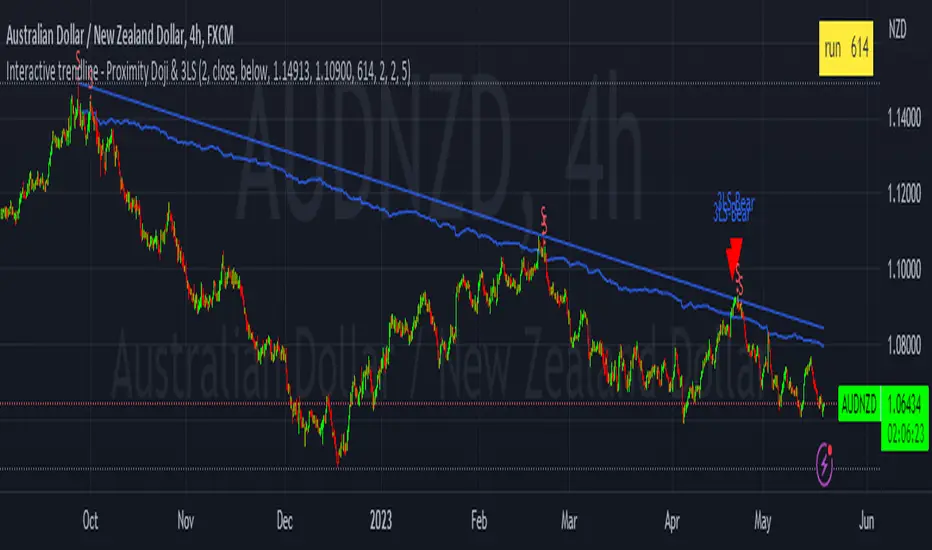
Interactive trendline - Proximity Doji & 3LSThis script was developed with Blockhead305 (seriously talented) and uses 1) the Three Line Strike from The Moving Average as well as 2) an original doji script written for me and 3) the Interactive Trendline as developed by Blockhead305. The basic premise is that should a doji or Three Line Strike occur within a customizable ATR distance from your trendline, an on-chart notification will appear or you could set an alarm to warn you if this has happened.
How to set this up:
Step 1 - Find a a trend
Step 2 - Identify the candles that touches the trendline
Step 3 - Click on the indicator
Step 4 - Set the X1 and Y1 coordinates for the start of the trend
Step 5 - Set the X2 and Y2 coordinates for the last relevant candle of the trend
Step 6 - Write the number in the yellow box down (in this case 880)
Step 7 - Open the settings of the indicator
Enter the number from the yellow box into the box titled "Run" - Press "OK"
Step 8 - Chart should/could now show Buy/Sell Signals for the Dojis and/or Bullish or Bearish Three Line Strikes
Notes
1. If your trendline is bearish (X1/Y1 is higher than X2/Y2) only bearish signals will appear and vice versa
2. You can change the ATR multiples from trendline in the settings - I prefer 2 (which is also the default)
3. You can toggle Big Engulfing and/or Three Line Strike on or off (exact functionality as per The Moving Average functionality)
4. You can construct the type of doji you would like to see at the bottom of the settings screen - I prefer the following settings:
Dominant Wick Multiple - 2
Recessive Wick Multiple - 2
Body Multiple - 5
5. I place my SL above last high (shorts) or last low (longs) but could also use the trendline for this
6. I use TP with RRR off 1:2 but much more is obviously possible.
7. ONLY ONE INTERACTIVE TRENDLINE CAN BE USED ON THE SAME CHART
8. THE NUMBER IN THE YELLOW BOX IS RELEVANT TO THE TIMEFRAME THAT THE TRENDLINE WAS CREATED ON. IF YOU CHANGE
TIMEFRAMES IT WILL NOT WORK
Happy to receive constructive criticism and/or suggestions for improvements on the settings.
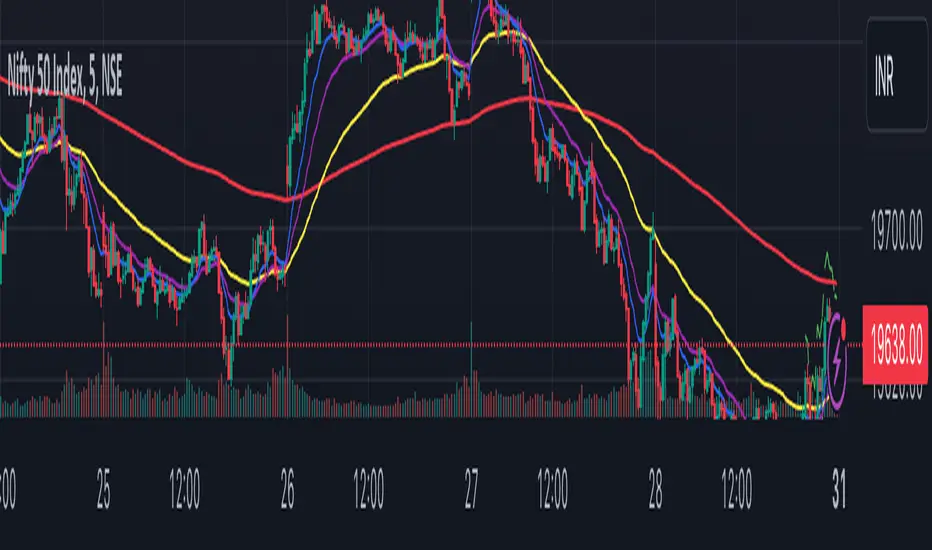
Rainbow Drift BetaRainbow Drift Beta is an indicator that detects the triggers of long and short positions at any TF.
It's based on two different type of approaches to the EMAs periods:
- Classic EMAs periods: 10 and 50
- Cycle EMAs perdios: 16, 64 and 256
The 256 period EMA (Annual Cycle) detects the trend: if the EMA 64 (Three-Weekly Cycle) is above, it shows an uptrend; while the EMA 64 is below, it means that the price action is in downtrend.
10 and 16 periods EMAs are working together as well as the 50 and the 64. The first couple reacts faster than the second one and as soon as the 10 is above the 16, the band shows the first attempt of the price action to go in the uptrend direction. The same concept is applied to the second couple (50, 64): when EMA 50 > EMA 64 it's a confirmation of the faster EMAs long direction. Viceverca happens for the downtrend but with the same concept.
As the EMA periods taken in consideration are quite often a sensitive level of reaction of the price, the indicator detects when there is trigger of a long or a short set up and plots a label on the chart. It's possibile to set up an alert as well.
Quite important, the indicator is looking for sideways patterns as the breakout of them shows a clear direction of the price.
Moreover, in order to privide the first and the best entry possibile, the indicator has a function that is triggering only one time as the trend reverted: for example, a long entry on the EMA 10-16 happens only one time since they crossover the EMA 64.
As included in the name, this is a beta version and new improvements will be added in the near future like suggested price entry, SL and TP, and the focus of the development is to avoid as much as possibile the false triggers.
Of course the best way to improve the code is to receive the users' feedbacks, so please feel free to post your comments and questions.

Position_controlLibrary "Position_control"
This is a library for defining positions and working with them.
f_calculateLeverage(_Leverage, _maintenance, _value, _direction)
Calculate the leverage used in a trade.
@description This function calculates the leverage used in a trade, based on the value of the trade, the maintenance margin, and the direction of the trade.
Parameters:
_Leverage (float) : The leverage used in the trade, as a floating point number.
_maintenance (float) : The maintenance margin percentage, as a floating point number.
_value (float) : The value of the trade, as a floating point number.
_direction (string) : The direction of the trade, either "long" or "short".
Returns: The leverage used in the trade, as a floating point number.
f_calculate_PL(_Position, _max_TP, _Position_index, _show_profit, _i_decimals_contracts, _i_decimals_prercent)
Calculate the profit or loss for a given trade.
@description This function calculates the profit or loss for a given trade, based on the position type, maximum take profit, position index, and whether to show the profit as a percentage or a value.
Parameters:
_Position (t_Position_type ) : An array of position types for the trade.
_max_TP (int) : The maximum take profit for the trade, as an integer value.
_Position_index (int) : The index of the position in the array, as an integer value.
_show_profit (bool) : A boolean value indicating whether to show the profit as a percentage or a value.
_i_decimals_contracts (int)
_i_decimals_prercent (int)
Returns: The profit or loss for the trade, as a floating point number.
f_drawposition(_Position, _Parameters, _Position_index)
draws a position on the chart
@description via sending in a typo of Position this function is able to drawout Stoploss, Entrybox, Takeprofits and the required labels with information
Parameters:
_Position (t_Position_type ) : array of type t_Position_type containing the position information.
_Parameters (t_drawing_parameters)
_Position_index (int) : the index of the current position.
Returns: None but boxes / lines / labels on the chart itself
t_TP_Variant
Fields:
TP_Type (series__string)
TP_Parameter_1 (series__integer)
TP_Parameter_2 (series__integer)
TP_Parameter_3 (series__float)
TP_Parameter_4 (series__float)
t_TPs
Fields:
TP_Price (series__float)
TP_Lot (series__float)
TP_Variant (|t_TP_Variant|#OBJ)
TP_Active (series__bool)
t_SLs
Fields:
SL_Price (series__float)
SL_Lot (series__float)
SL_Active (series__bool)
t_Position_type
Fields:
Lot (series__float)
Leverage (series__float)
Maintenance (series__float)
Starttime (series__integer)
Entry_Start (series__float)
Stoptime (series__integer)
Entry_Stop (series__float)
Entryprice (series__float)
TPs (array__|t_TPs|#OBJ)
SLs (array__|t_SLs|#OBJ)
t_drawing_parameters
Fields:
ShowPos (series__bool)
ShowLIQ (series__bool)
A_Colors (array__color)
Prolong_lines (series__bool)
Str_fontsize (series__string)
Textshift (series__integer)
Decimals_contracts (series__integer)
Decimals_price (series__integer)
Decimals_percent (series__integer)
bartime (series__integer)

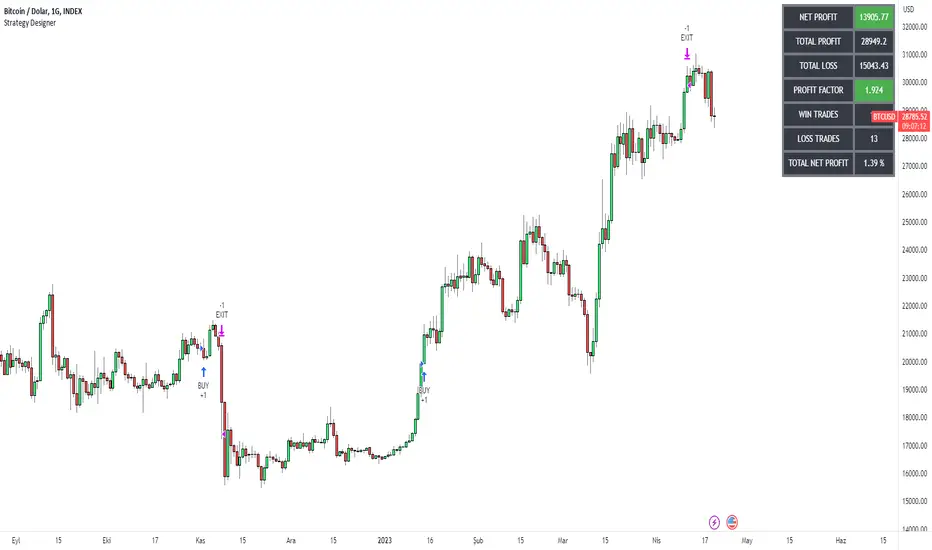
Strategy DesignerHello traders.
Thanks to the tool I have published, everyone who knows or does not know coding will be able to create strategies and see the results instantly on the screen. Yes it looks very nice :)
What does this script do?
Thanks to this tool, even if you don't know any coding, you will be able to create your own strategies. You can add and remove indicators.
Entrance
The first thing you need to do is to set a strategy in your mind.
Then you need to adjust the settings of the indicators installed in the system. Please set the indicators first, because later they are forgotten.
The screen for entering the parameters of the indicators will be as follows.
After entering the parameters there is an important part . In this section, we can adjust the strategy settings.
First we choose between which dates we want the strategy to run. We then choose whether we want the strategy results to be displayed in a table or not.
We choose how the Terms should be linked together. For example, if you have a condition that is expected to produce more than one receive signal, select whether these conditions are connected to each other with and or with the connector.
In this way, you can determine whether all or any of the rules in your strategy should apply.
Next, we choose whether our strategy will work in the spot market or in a bidirectional market. Yes, you can design a strategy for both spot and bidirectional trades :)
At the bottom of the above image, we see a screen where we can adjust the stop level and tp level. As a standard, adjustments are made according to the percentage level you enter. However, if you remove the tick next to the percent sign, the previous stop level and the next profit level are determined as much as the value you entered.
At the bottom is the trailing stop. When you open the trailing stop, the trailing stop becomes active in your strategy.
Very important, when the trailing stop and the stop are active at the same time, the trailing stop value is valid.
It's time to design our strategy. Each chapter that begins with an exclamation point is a separate fiction.
If you do not mark the Active button, that condition will not be included in the calculation.
Direction = It is the direction for which the fiction in this region is valid.
We came to the indicator setting screen. Here, there is a screen where we can select two different indicators on the right and left.
We choose the first indicator starting with 1.
Then we choose from the middle region how we want these two indicators to interact.
We choose our second indicator from the place starting with 2.
If you want an indicator to interact with any value, tick the box where it says Value and fill in the value in the blank. When Value is ticked, the second indicator does not work.
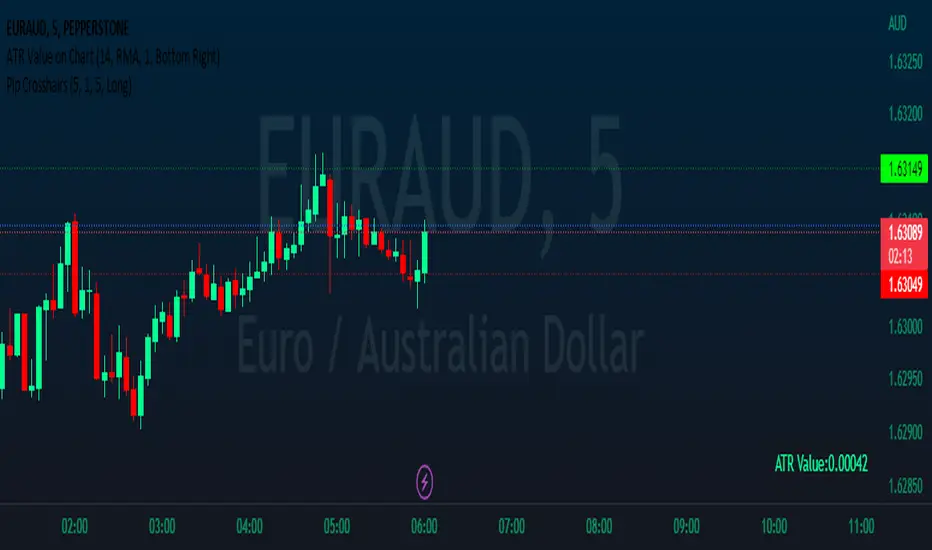
Pip CrosshairsThis is a simple tool designed to help you visualize your stop loss and take profit levels before entering a trade. The tool plots two lines on the chart - a green dotted line for take profit and a red dotted line for stop loss (similar to the price line) - with a simulated default spread of one pip factored in. The indicator has the option to toggle between long and short positions.
Please note that the spread used in the tool is not based on your actual spread and should be adjusted accordingly. As, to the best of my knowledge Pine Script does not have the ability to automatically include spread in an indicator, so you will need to input your spread manually. (if you can please let me know cause that would be a game changer).
Overall, should help save you a bit of time by not having to manually measure stop loss and take profit levels for each trade.
Happy hunting :)
ATR Mean Reversion Strategy V1**Long Only Strategy**
When Price drops below the ATR band below it will enter a buy on the next candle open
SL at current price minus ATR* ATR multiplier
TP at Mean EMA or if higher than Mean EMA and current candle low is below previous candle low or if price is above ATR
NB: I would highly recommend a low fee broker (I use ICmarkets raw spread account) due to the fact that this is a decently high frequency trading strategy you will rack up a lot of commission, if you use and exchange like Bybit or Binance the strategy will not be profitable due to the high commissions.

Strategy Myth-Busting #7 - MACDBB+SSL+VSF - [MYN]This is part of a new series we are calling "Strategy Myth-Busting" where we take open public manual trading strategies and automate them. The goal is to not only validate the authenticity of the claims but to provide an automated version for traders who wish to trade autonomously.
Our seventh one we are automating is the "Magic MACD Indicator: Crazy Accurate Scalping Trading Strategy ( 74% Win Rate )" strategy from "TradeIQ" who claims to have backtested this manually and achieved 427% profit with a 74% winrate over 100 trades in just a 4 months. I was unable to emulate these results consistently accommodating for slippage and commission but even so the results and especially the high win-rate and low markdown is pretty impressive and quite respectable.
This strategy uses a combination of 3 open-source public indicators:
AK MACD BB v 1.00 by Algokid
SSL Hybrid by Mihkel00
Volume Strength Finder by Saravanan_Ragavan
This is considered a trend following Strategy. AK MACD BB is being used as the primary short term trend direction indicator with an interesting approach of using Bollinger Bands to define an upper and lower range and upon the MACD going above the upper Bollinger Bands, it's indicative of an up trend, where as if the MACD is below the lower Bollinger Band, it's indicative of a down trend. To eliminate false signals, SSL Hyrbid is used as a trend confirmation filter, confirming and eliminating false signals from the MACD BB. It does this by validating the price action is above the the EMA and the SSL is positive that is a confirmation of an uptrend. When the price action is below the EMA and the SSL is negative, that is an confirmation of a downtrend. To avoid taking trades during ranged markets, VSF Buyer's Strength is used so the buyers/sellers strength and must be above 50% or the trade will not be inititiated.
Trading Rules
5 min candles but other lower time frames even below 5m work quite well too.
Best results can be found by tweaking these 2 input parameters:
Number Of bars to look back to ensure MACD isn't above/below Zero Line
Number Of bars back to look for SSL pullback
Long Entry when these conditions are true
AK MACD BB BB issues a new continuation long signal. A new green circle must appear on the indicator and these circles should not be touching across the zero level while they were previously red
SSL Hybrid price action closes above the EMA and the line is blue color and then creates a pullback . The pullback is confirmed when the color changes from blue to gray or from blue to red.
VSF Buyers strength above 50% at the time the MACD indicator issues a new long signal.
Short Entry when these conditions are true
AK MACD BB issues a new continuation short signal. A new red circle must appear on the indicator and these circles should not be touching across the zero level while they were previously green
SSL Hybrid price action closes below the EMA and the line is red color then it has to create a pullback . The pullback is confirmed when the color changes from red to gray or from red to blue.
VSF Sellers strength above 50% at the time the MACD indicator issues a new short signal.
Stop Loss at EMA Line with TP Target 1.5x the risk
If you know of or have a strategy you want to see myth-busted or just have an idea for one, please feel free to message me.

Dual Bollinger Band Mean ReversionSimple but solid mean reversion indicator with sl and tp levels. Most of the code is based on the built in bollinger bands script. Designed for scalping 1-5 minute timeframes.
The indicator consists of two sets of bollinger bands.
Price has to close below the lower (fast) bollinger band, above the moving average of the (slower) bollinger band.
If price now closes above the lower (fast) bb, the indicator draws a label at the open of the next candle (which would be a potential entry point). Take profit becomes the upper bollinger band, stop loss the same distance below the open of the candle.
I've built in a simple backtesting function that calculates the potential win/loss-ratio. Loss and profit levels are 1:1. Exit strategy could be improved on.
Adjusting the lengths depending on the asset proves to be a good idea.
The slower bollinger bands can help to identify ranging markets and/or trends following regular bollinger bands theory.
Feel free to comment with any changes that you'd like to be made.

Simple SuperTrend Strategy for BTCUSD 4HHello guys!, If you are a swing trader and you are looking for a simple trend strategy, you should check this one. Based in the supertrend indicator, this strategy will help you to catch big movements in BTCUSD 4H and avoid losses as much as possible in consolidated situations of the market
This strategy was designed for BTCUSD in 4H timeframe
Backtesting context: 2020-01-02 to 2023-01-05 (The strategy has also worked in previous years)
Trade conditions:
Rules are actually simple, the most important thing is the risk and position management of this strategy
For long:
Once Supertrend changes from a downtrend to a uptrend, you enter into a long position. The stop loss will be defined by the atr stop loss
The first profit will be of 0.75 risk/reward ratio where half position will be closed. When this happens, you move the stop loss to break even.
Now, just will be there two situations:
Once Supertrend changes from a uptrend to a downtrend, you close the other half of the initial long position.
If price goes againts the position, the position will be closed due to breakeven.
For short:
Once Supertrend changes from a uptrend to a downtrend, you enter into a short position. The stop loss will be defined by the atr stop loss
The first profit will be of 0.75 risk/reward ratio where half position will be closed. When this happens, you move the stop loss to break even.
Like in the long position, just will be there two situations:
Once Supertrend changes from a downtrend to a uptrend, you close the other half of the initial short position.
If price goes againts the position, the position will be closed due to breakeven.
Risk management
For calculate the amount of the position you will use just a small percent of your initial capital for the strategy and you will use the atr stop loss for this.
Example: You have 1000 usd and you just want to risk 2,5% of your account, there is a long signal at price of 20,000 usd. The stop loss price from atr stop loss is 19,000. You calculate the distance in percent between 20,000 and 19,000. In this case, that distance would be of 5,0%. Then, you calculate your position by this way: (initial or current capital * risk per trade of your account) / (stop loss distance).
Using these values on the formula: (1000*2,5%)/(5,0%) = 500usd. It means, you have to use 500 usd for risking 2.5% of your account.
We will use this risk management for apply compound interest.
Script functions
Inside of settings, you will find some utilities for display atr stop loss, supertrend or positions.
You will find the settings for risk management at the end of the script if you want to change something. But rebember, do not change values from indicators, the idea is to not over optimize the strategy.
If you want to change the initial capital for backtest the strategy, go to properties, and also enter the commisions of your exchange and slippage for more realistic results.
Signals meanings:
L for long position. CL for close long position.
S for short position. CS for close short position.
Tp for take profit (it also appears when the position is closed due to stop loss, this due to the script uses two kind of positions)
Exit due to break even or due to stop loss
Some things to consider
USE UNDER YOUR OWN RISK. PAST RESULTS DO NOT REPRESENT THE FUTURE.
DEPENDING OF % ACCOUNT RISK PER TRADE, YOU COULD REQUIRE LEVERAGE FOR OPEN SOME POSITIONS, SO PLEASE, BE CAREFULL AND USE CORRECTLY THE RISK MANAGEMENT
The amount of trades closed in the backtest are not exactly the real ones. If you want to know the real ones, go to settings and change % of trade for first take profit to 100 for getting the real ones. In the backtest, the real amount of opened trades was of 194.
Indicators used:
Supertrend
Atr stop loss by garethyeo
This is the fist strategy that I publish in tradingview, I will be glad with you for any suggestion, support or advice for future scripts. Do not doubt in make any question you have and if you liked this content, leave a boost. I plan to bring more strategies and useful content for you!

ATR_RSI_Strategy v2 with no repaint [liwei666]🎲 Overview
🎯 this is a optimized version based on ATR_RSI_Strategy with no-repaint.
Sharpe ratio: 1.4, trade times: 116 ,
trade symbol: BINANCE:BTCUSDTPERP 15M
you can get same backtesting result with the correct settings.
🎲 Strategy Logic
🎯 the core logic is quite simple, use ATR and RSI and SMA
1. when price is in high volatility ( atr_value > atr_ma);
2. wait for a break signal (rsi_value > rsi_buy or rsi_value < rsi_sell);
3. entry Long or Short,use trailing stop-loss to max security and percent TP to keep profit.
🎲 Settings
🎯 there are 7 input properties in script, but I only finetune 4 of them ( bold field below ),
you may change other parameter to get better result by yourself.
atr_length: length to get atr value
atr_ma_length : length of smoothing atr value
atr_ma_norm_min : atr_ma normalized min value, filter high volatility ranges
atr_ma_norm_max : atr_ma normalized max value, filter high volatility ranges
rsi_length : length to get rsi value
rsi_entry: 50 +/- rsi_entry to get entry threshold
trailing_percent: trailing stop-loss percent
🎲 Usage
🎯 the commission set to 0.05% , part of exchange the commission is less than 0.05% in reality,
but I will still use 0.05% in my next script.
🎯 this script use 50% of equity to size positions follow general script position,
you can adjust the value to fix size or 100% of equity to compare result with other strategy,
but I still suggest you use 5-10% of equity for each strategy in reality.
🎯any questions please comment below. if there are any words violate House Rule, please tell me below and i will revise immediately
don't want be hiddened again 😂😂
Additionally, I plan to publish 20 profitable strategies in 2023;
let‘s witness it together!
Hope this strategy will be usefull for you :)
enjoy! 🚀🚀🚀

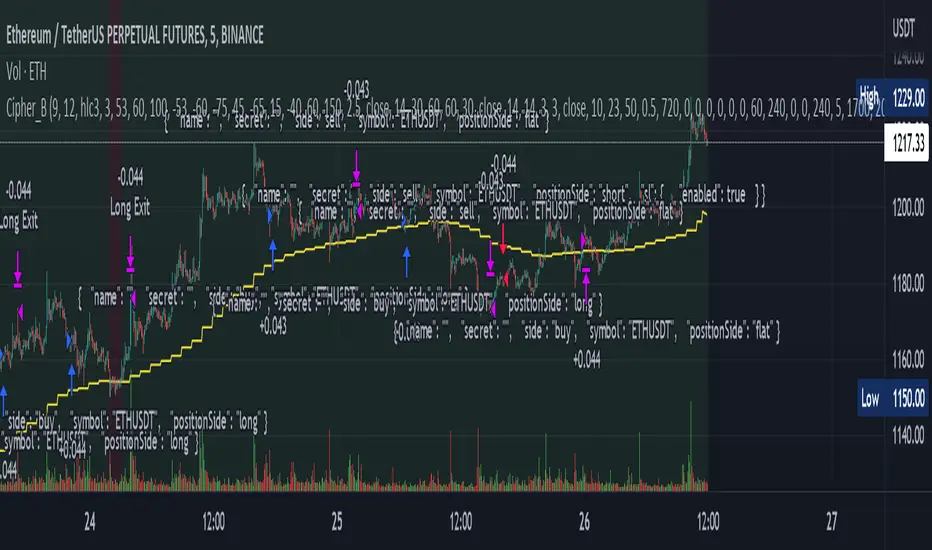
Cipher_B (Finandy support)In this version of the script you can force to cancel your position after some amount of time indepedently on price action. For example, your bot open a short position with SL=1% and TP=2.4% but price did not reach any of this level over the course of to say 8 hours. In this case, position will be closed regardless of the price.
Other interesting features are volume and slope filters. Slope is essentially a derivative of price action. If you don't like to buy your instrument under high volatility, for example, if a trend goes down too fast then you can filter long position which could be opened according to the strategy. Same thing for volume filter. If the volume is too high/too low, you might want to escape such setup in your trading strategy.
Moreover, you can tune price shift for opening position. To say, if you believe that the signal for opening position comes too early everytime, you can force the strategy to buy at 1% lower price than the current price when the signal comes. Similar logic for short: open position price will be always higher than the price of the signal. If the price did not reach such level then position will be automatically cancel with a new signal arrival. Check the backtesting results to understand better the logic.
Ultimate Strategy Template (Advanced Edition)Hello traders
This script is an upgraded version of that one below
New features
- Upgraded to Pinescript version 5
- Added the exit SL/TP now in real-time
- Added text fields for the alerts - easier to send the commands to your trading bots
Step 1: Create your connector
Adapt your indicator with only 2 lines of code and then connect it to this strategy template.
For doing so:
1) Find in your indicator where are the conditions printing the long/buy and short/sell signals.
2) Create an additional plot as below
I'm giving an example with a Two moving averages cross.
Please replicate the same methodology for your indicator wether it's a MACD , ZigZag , Pivots , higher-highs, lower-lows or whatever indicator with clear buy and sell conditions.
//@version=5
indicator(title='Moving Average Cross', shorttitle='Moving Average Cross', overlay=true, precision=6, max_labels_count=500, max_lines_count=500)
type_ma1 = input.string(title='MA1 type', defval='SMA', options= )
length_ma1 = input(10, title=' MA1 length')
type_ma2 = input.string(title='MA2 type', defval='SMA', options= )
length_ma2 = input(100, title=' MA2 length')
// MA
f_ma(smoothing, src, length) =>
rma_1 = ta.rma(src, length)
sma_1 = ta.sma(src, length)
ema_1 = ta.ema(src, length)
iff_1 = smoothing == 'EMA' ? ema_1 : src
iff_2 = smoothing == 'SMA' ? sma_1 : iff_1
smoothing == 'RMA' ? rma_1 : iff_2
MA1 = f_ma(type_ma1, close, length_ma1)
MA2 = f_ma(type_ma2, close, length_ma2)
// buy and sell conditions
buy = ta.crossover(MA1, MA2)
sell = ta.crossunder(MA1, MA2)
plot(MA1, color=color.new(color.green, 0), title='Plot MA1', linewidth=3)
plot(MA2, color=color.new(color.red, 0), title='Plot MA2', linewidth=3)
plotshape(buy, title='LONG SIGNAL', style=shape.circle, location=location.belowbar, color=color.new(color.green, 0), size=size.normal)
plotshape(sell, title='SHORT SIGNAL', style=shape.circle, location=location.abovebar, color=color.new(color.red, 0), size=size.normal)
/////////////////////////// SIGNAL FOR STRATEGY /////////////////////////
Signal = buy ? 1 : sell ? -1 : 0
plot(Signal, title='🔌Connector🔌', display = display.data_window)
Basically, I identified my buy, sell conditions in the code and added this at the bottom of my indicator code
Signal = buy ? 1 : sell ? -1 : 0
plot(Signal, title="🔌Connector🔌", transp=100)
Important Notes
🔥 The Strategy Template expects the value to be exactly 1 for the bullish signal, and -1 for the bearish signal
Now you can connect your indicator to the Strategy Template using the method below or that one
Step 2: Connect the connector
1) Add your updated indicator to a TradingView chart
2) Add the Strategy Template as well to the SAME chart
3) Open the Strategy Template settings and in the Data Source field select your 🔌Connector🔌 (which comes from your indicator)
From then, you should start seeing the signals and plenty of other stuff on your chart
🔥 Note that whenever you'll update your indicator values, the strategy statistics and visual on your chart will update in real-time
Settings
- Color Candles: Color the candles based on the trade state ( bullish , bearish , neutral)
- Close positions at market at the end of each session: useful for everything but cryptocurrencies
- Session time ranges: Take the signals from a starting time to an ending time
- Close Direction: Choose to close only the longs, shorts, or both
- Date Filter: Take the signals from a starting date to an ending date
- Set the maximum losing streak length with an input
- Set the maximum winning streak length with an input
- Set the maximum consecutive days with a loss
- Set the maximum drawdown (in % of strategy equity)
- Set the maximum intraday loss in percentage
- Limit the number of trades per day
- Limit the number of trades per week
- Stop-loss: None or Percentage or Trailing Stop Percentage or ATR - I'll add shortly multiple options for the trailing stop loss
- Take-Profit: None or Percentage or ATR - I'll add also a trailing take profit
- Risk-Reward based on ATR multiple for the Stop-Loss and Take-Profit
Special Thanks
Special thanks to @JosKodify as I borrowed a few risk management snippets from his website: kodify.net
Best
Dave

Fibonacci Zones EMA Zones StrategyThis idea is only for fun and learning purposes only.
The strategy represents 2 simple math formulas that are very simple. the "Fibo Formula" and the "EMA Formula" Please see source code for reference
I Feel like coders can learn a lot about developing strategies using this source code
This is to show that there is unlimited amount of variables and factors to a strategy and its all about working with probability.
Also to show that unlimited amount of conditions could be added to a strategy.
And unlimited amount of variables/factors with the settings that could change the results.
Rules are simple
Entry on close, Close/Entry must be in the blue Fibo Zone
Blue Fibonacci zone fully customizable
Other Conditions could be added involving EMA zones, Over Ema1, Under Ema1 etc..
TP/SL and Dates Fully Customizable
This script is just an idea fully for learning purposes.

AJ's Position Size Calculator for Forex and StocksThis position size/ stop loss and take profit calculator is designed to make entering positions more efficient. In the settings enter your account size and currency. Stop loss and profit levels can be calculated from the ATR or manually. To manually choose stop and profit price, choose manual from the SL or TP Value Type, then enter your price in the boxes below. Lot size or shares will be calculated and displayed on the table to the right of the chart. Position size calculation takes into account any currency exchange rates between your account currency and the quoted currency of the selected ticker. For forex lot sizes the exchange rate for the quoted currency relative to account currency is also built in to get an accurate position size. Enter your brokers leverage and your used margin will be displayed as well. The position size calculator is currently only configured for stocks and forex, I will try to add updates, in the future to other tickers like crypto , precious metals and crude oil CFD's. profit target and stop loss calculator should work for all symbols. I can't guarantee that the output of this calculator is correct. Use at your own risk!

SuperTrend Multi Time Frame Long and Short Trading Strategy
Hello All
This is non-repainting Supertrend Multi Time Frame script, I got so many request on Supertrend with Multi Time Frame. This is for all of them ..I am making it open for all so you can change its coding according to your need.
How the Basic Indicator works
SuperTrend is one of the most common ATR based trailing stop indicators.
In this version you can change the ATR calculation method from the settings. Default method is RMA.
The indicator is easy to use and gives an accurate reading about an ongoing trend. It is constructed with two parameters, namely period and multiplier. The default values used while constructing a Supertrend indicator are 10 for average true range or trading period and three for its multiplier.
The average true range (ATR) plays an important role in 'Supertrend' as the indicator uses ATR to calculate its value. The ATR indicator signals the degree of price volatility .
The buy and sell signals are generated when the indicator starts plotting either on top of the closing price or below the closing price. A buy signal is generated when the ‘Supertrend’ closes above the price and a sell signal is generated when it closes below the closing price.
It also suggests that the trend is shifting from descending mode to ascending mode. Contrary to this, when a ‘Supertrend’ closes above the price, it generates a sell signal as the colour of the indicator changes into red.
A ‘Supertrend’ indicator can be used on spot, futures, options or forex, or even crypto markets and also on daily, weekly and hourly charts as well, but generally, it fails in a sideways-moving market.
How the Strategy works
This is developed based on SuperTrend.
Use two time frame for confirm all entry signals.
Two time frame SuperTrend works as Trailing stop for both long and short positions.
More securely execute orders, because it is wait until confine two time frames(example : daily and 30min)
Each time frame developed as customisable for user to any timeframe.
User can choose trading position side from Long, Short, and Both.
Custom Stop Loss level, user can enter Stop Loss percentage based on timeframe using.
Multiple Take Profit levels with customisable TP price percentage and position size.
Back-testing with custom time frame.
This strategy is develop for specially for automation purpose.
The strategy includes:
Entry for Long and Short.
Take Profit.
Stop Loss.
Trailing Stop Loss.
Position Size.
Exit Signal.
Risk Management Feature.
Backtesting.
Trading Alerts.
Use the strategy with alerts
This strategy is alert-ready. All you have to do is:
Go on a pair you would like to trade
Create an alert
Select the strategy as a Trigger
Wait for new orders to be sent to you
This is develop for specially for automating trading on any exchange, if you need to get that automating service for this strategy or any Tradingview strategy or indicator please contact me I am have 8 year experience on that field.
I hope you enjoy it!
Thanks,
Ranga

Candle wick averageThis tool shows all 4 values: (Candle chart can describe the size)
- Average wick length below It is calculated as the length of the candle wick under the rising candlestick. calculated average (AVG) and Standard Deviation (STDEV). plot on the chart at the current bar using (open price ) - (average + STDEV ).
- Average wick + average body above(high - open) is calculated from the upper wick and upper body wick length of the rising candle. take Average (AVG) and standard deviation (STDEV). plot on the chart at the current bar using (open price) + (average + 2*STDEV)
- The other 2 values are calculated in the same way. But using the data of the candlestick that the price has moved down.
Usage example
- Use the average of the lower wick length to determine the SL for buy order.
- Use the average wick length and the candle above to set the TP for buy order.
- The other 2 values use in the same way for sell order

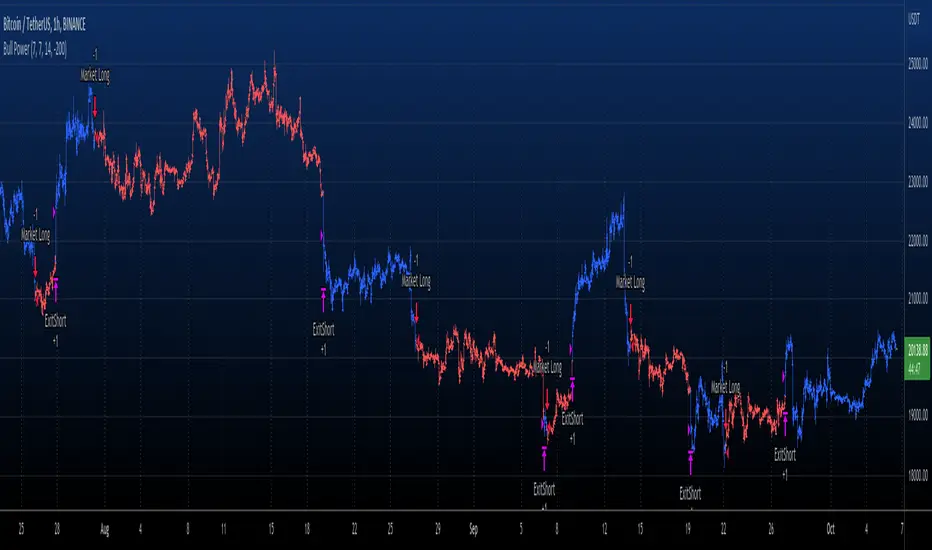
Elder Ray (Bull Power) TP and SL Developed by Dr Alexander Elder, the Elder-ray indicator measures buying
and selling pressure in the market. The Elder-ray is often used as part
of the Triple Screen trading system but may also be used on its own.
Dr Elder uses a 13-day exponential moving average (EMA) to indicate the
market consensus of value. Bull Power measures the ability of buyers to
drive prices above the consensus of value. Bear Power reflects the ability
of sellers to drive prices below the average consensus of value.
Bull Power is calculated by subtracting the 13-day EMA from the day's High.
Bear power subtracts the 13-day EMA from the day's Low.
WARNING:
- For purpose educate only
- This script to change bars colors.
Strategy Myth-Busting #10 - InsideBar+EMA - [MYN]This is part of a new series we are calling "Strategy Myth-Busting" where we take open public manual trading strategies and automate them. The goal is to not only validate the authenticity of the claims but to provide an automated version for traders who wish to trade autonomously.
Our 10th one we are automating is the " 75% Win Rate High Profit Inside Bar Trading Strategy - What If You ... " strategy from " Trade Pro " who claims to have backtested this manually and achieved 11,063% profit with a 75% winrate over 100 trades. I was unable to emulate these results consistently accommodating for slippage and commission but even so, the results look promising. I was only able to achieve this win-rate with some multiple take profit staggering. Even so the markdown is above where I would normally consider comfortable (>20%).
If you know of or have a strategy you want to see myth-busted or just have an idea for one, please feel free to message me.
This strategy uses a combination of 2 open-source public indicators:
Inside Bar Ind/Alert by CMA
EMA (built-in)
Trading Rules
4 hour candles
Stop Loss at EMA Line with TP Target 1.5x the risk
Long Entry when these conditions are true
inside bar and bullish
Bar close's above 50 ema
Price action rises above high of inside bar .
Short Entry when these conditions are true
inside bar and bearish
Bar close below 50 ema
Price action falls below low of inside bar
