אינדיקטור Pine Script®
חפש סקריפטים עבור "trend"
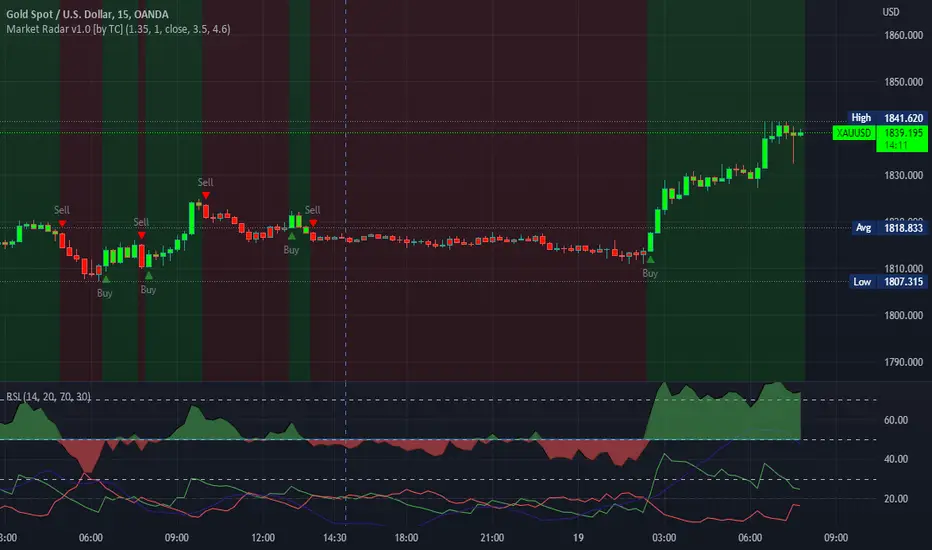
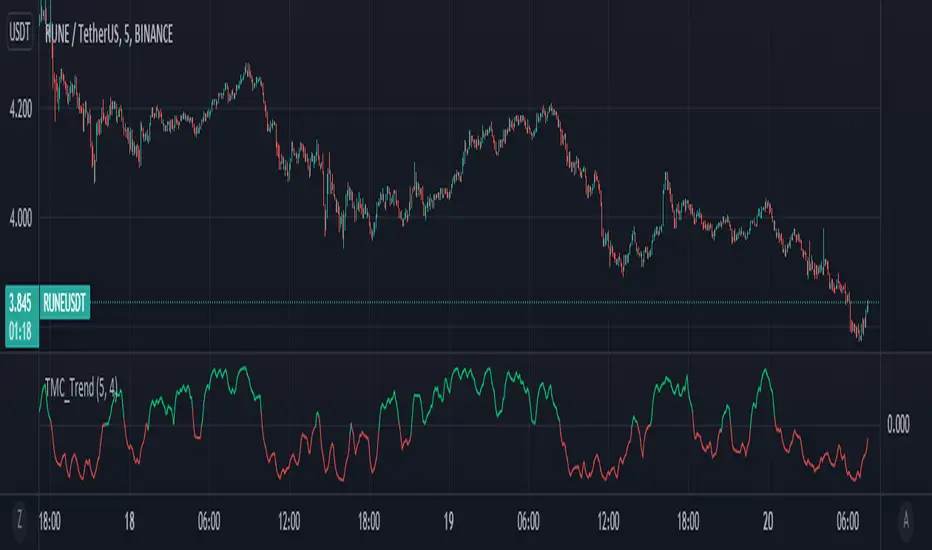
Too Many Cooks trend indicatorToo many Cooks in The Kitchen
You have probably heard the adage "Too many cooks spoils the broth" before. The meaning behind it is obviously that when to many people are trying to work on the same task at once it simply devolves into a fight for control and creates a mess of the situation. But is this true for indicators is the question I had and thus I made this indicator, a simple combination of 8 random trend finding indicators I assembled (A list of these indicators and their authors will be available at the bottom of this page) . Is it any good though ? In short yes, it is a decent trend finding indicator and could likely be used in your strategy in the place of your current trend finding indicator if you so wish. However much of the versatility of the individual indicators IS lost and would not be possible to get back in this big mess of a broth, so this indicator will not be the be all end all of trend indicators nor will it be a free money machine like you may be expecting looking at the list of included indicators so the adage was correct to a degree.
List of Authors and their included indicators
Trading View defaults:
MACD (Modified by me)
Stochastic RSI (Modified by me)
Lazy Bear:
Wavetrend Oscilator (Modified by me)
Traders Dynamic Index (Modified by me)
HACOLT (Modified by me)
Algokid
AK Trend
Racer8
Average Force
KivancOzbilgic
Average Sentiment Osclilator
אינדיקטור Pine Script®
[JL] Trend or RangeJust want to make an easy indicator to show trend or range.
ToR idea is based on the simple concept:
Range will have more cross than trend
So I calculate difference of two moving average
Then divide ATR to get how many virtual bars in the difference
Calculate sum of virtual bars during the period.
So more virtual bars, more chance to be trend.
will make a table to compare many pairs on one chart.
אינדיקטור Pine Script®

FX TrendFX Trend Indicator by request of S.C. in The Trading Journal Discord.
Original Meta Trader Indicator at www.mql5.com
FXT = K * ((Close-L1) / (D1*Small range)+(Close-L2) / (D2*Middle range)+(Close-L3) / (D3*Big range))
Where:
D1 = H1 - L1
D2 = H2 - L2
D3 = H3 - L3
L1, H1 - the lowest and the highest prices in the Small range
L2, H2 - the lowest and the highest prices in the Middle range
L3, H3 - the lowest and the highest prices in the Big range
K = 100.0 / (1/Small range+1 / Middle range+1 / Big range)
אינדיקטור Pine Script®
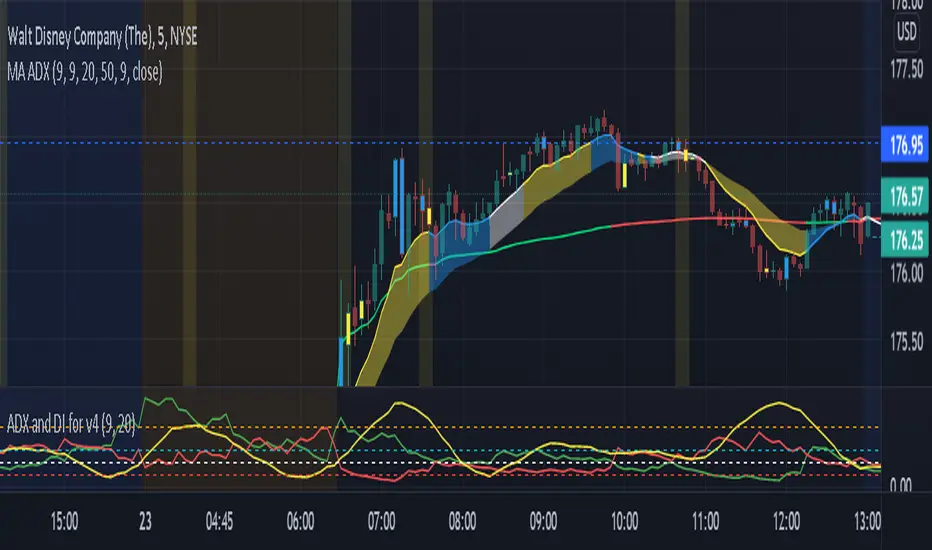
ADX and DI EMA Trend LineADX: The average directional index (ADX) is a technical analysis indicator used by some traders to determine the strength of a trend.
DI: The directional movement index (DMI) is an indicator developed by J. Welles Wilder in 1978 that identifies in which direction the price of an asset is moving. ... Conversely, if -DI is above +DI, then there is more downward pressure on the price. This indicator may help traders assess the trend direction.
EMA: The exponential moving average (EMA) is a technical chart indicator that tracks the price of an investment (like a stock or commodity) over time. The EMA is a type of weighted moving average (WMA) that gives more weighting or importance to recent price data.
UPDATE: This current indicator has been changed from MA and EMA trend lines the 9 and the 50, and also added Inside & Outside bars...You can toggle anything Off or On
The code in this indicator calculates the value of each ADX and DI (+/-) value to give a green color for DI + trend and a red color for DI - trend, and lastly white for no direction...The nice part of this code is the 50 EMA will be your bull or bear transition level. The colors heading to the ema will tell you if we are still bull or bear heading to the EMA.
I also changed the ADX to become the 9 EMA with Yellow showing a ADX positive rate of change, Blue showing a negative rate of change, and white to show that the trend has no direction.
Open settings to adjust how big or small you want the ema lines to be and adjust colors for what works for you. Hopefully you enjoy this update
אינדיקטור Pine Script®
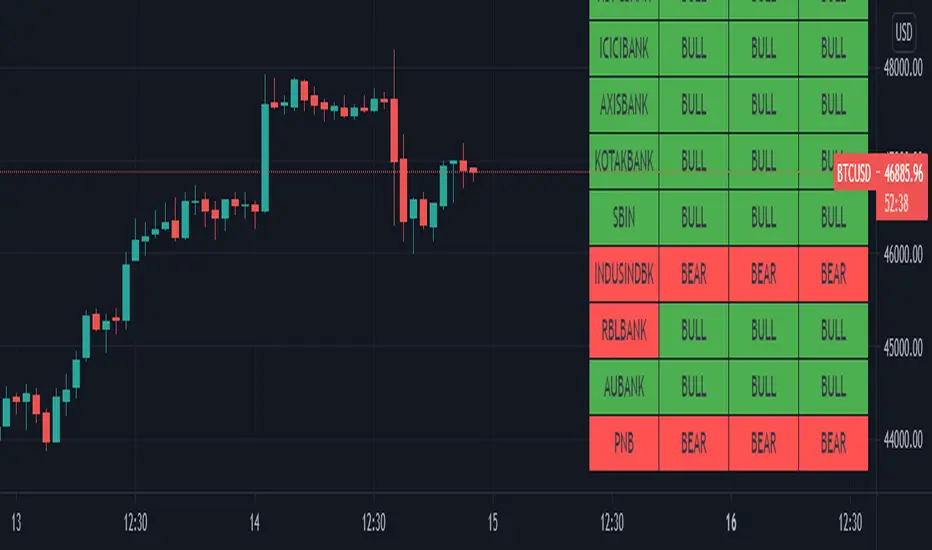
BANK NIFTY list of stocks with their multi timeframe EMA trend This script gives you an overview of banknifty and its underlying heavy weight stocks.
You can view the trend in single chart in 3 different time frames.
Color indication green for bullish and red for bearish trend
Symbol name shows green if the current day change is positive. Else red color
אינדיקטור Pine Script®
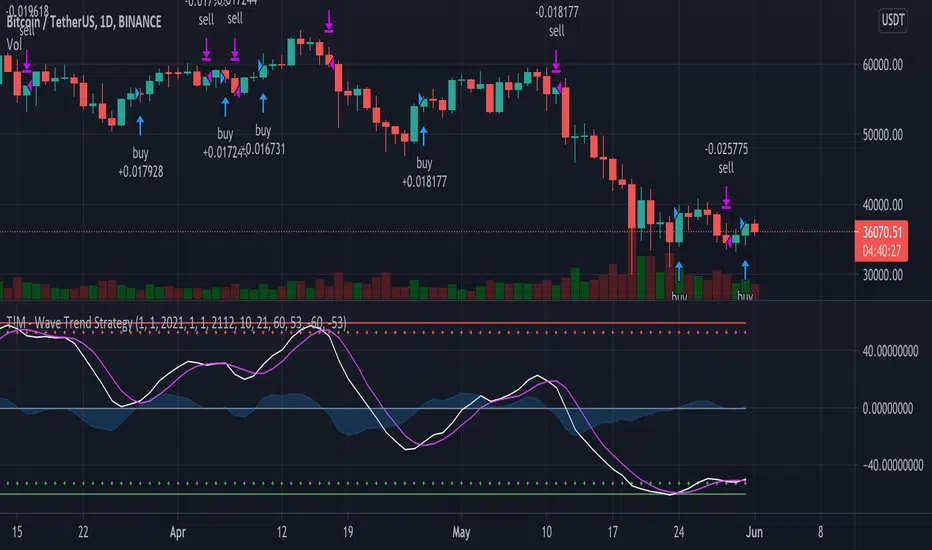
T!M - Wave Trend Strategy with DatesUsing Lazy Bear's original Wave Trend script but I added dates to it to make it easier to backtest.
אסטרטגיית Pine Script®
אינדיקטור Pine Script®
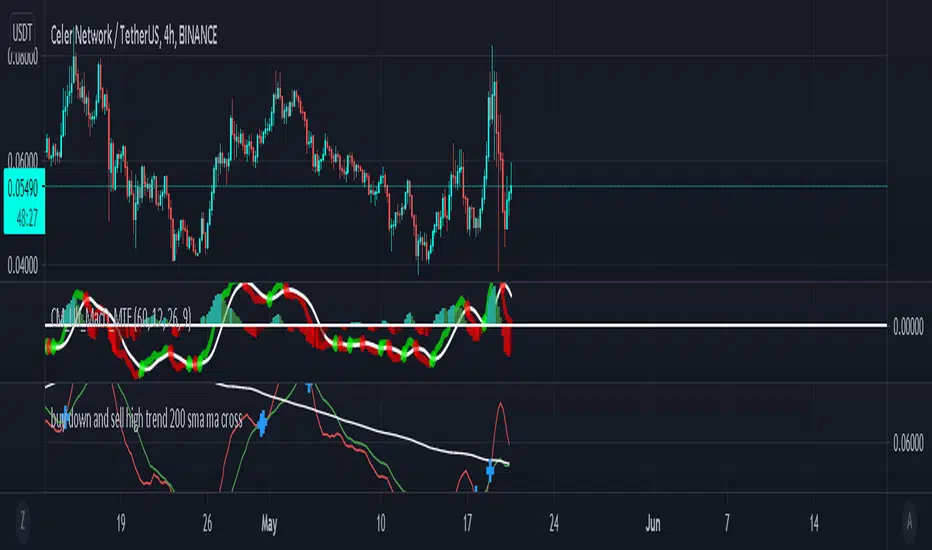
buy down and sell high trend 200 sma and ma cross this indicator showing you when have to buy down and sell high and also can see the market trend is being above or below
I'm sorry if there is an error
אסטרטגיית Pine Script®
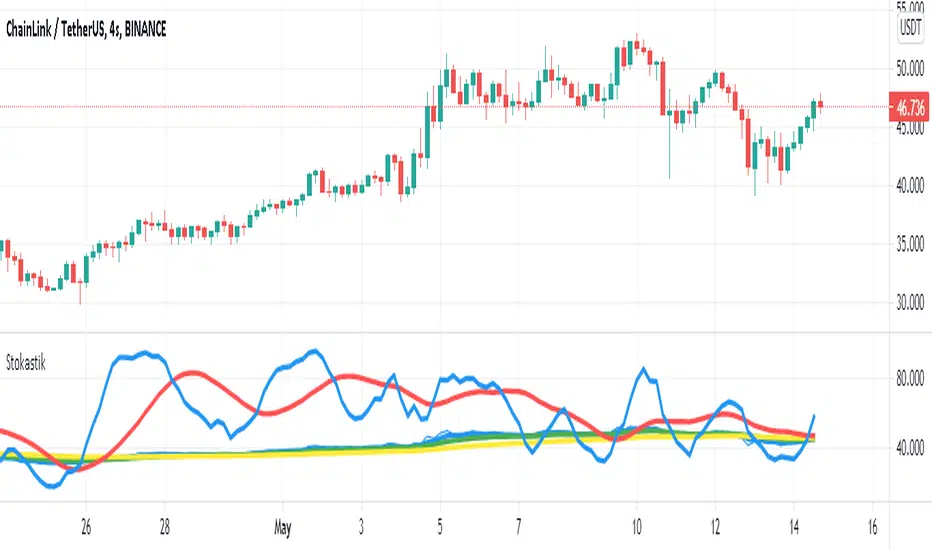
4-Hour Stochastic EMA TrendThis trading strategy relies heavily on catching the trend. You
may have success using this strategy on as low as the one hour
chart or as high as the daily chart; however, I’ve had most
success trading it on the four hour chart. This strategy consists
of four indicators, which are:
1. 5 Period Exponential Moving Average (closed)
2. 15 Period Exponential Moving Average (closed)
3. 50 Period Exponential Moving Average (closed)
4. Stochastic indicator K=13 D=5 Smooth=5 (13,5,5) 80/20
Levels
Refer
אסטרטגיית Pine Script®
Highest high, Lowest low and Trend, MACD, RSI on CandlesticksHighest high, Lowest low and Trend, MACD, RSI on Candlesticks
אינדיקטור Pine Script®

אינדיקטור Pine Script®
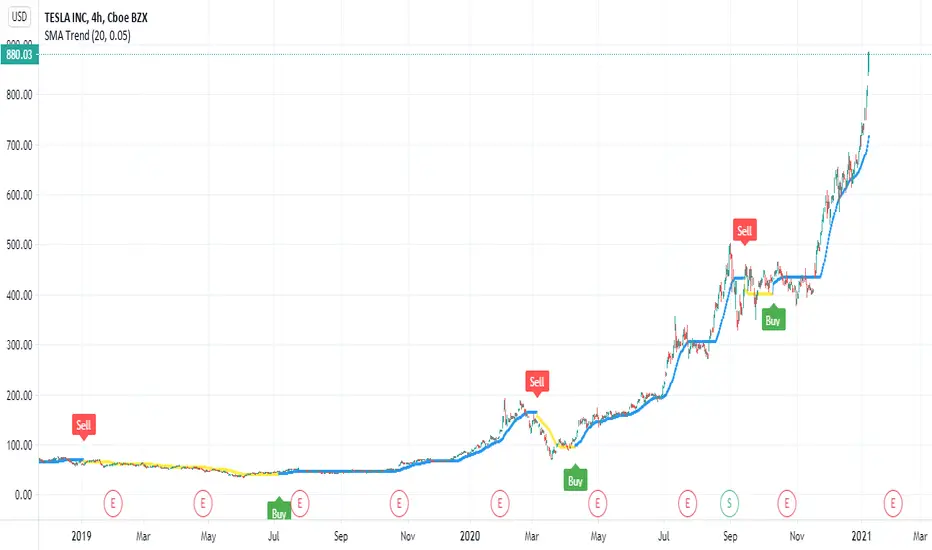
SMA TrendThis is SMA based trend with some twist . you can control it via length of the SMA currently set to 20 or by factor that control sensitivity set 0.05 and you can change it to any value that you like
the indicator have signal and alerts
blue line is uptrend
yellow line is down trend
I try to optimize it for stocks but it can work on any asset that you like ' probably need to change settings
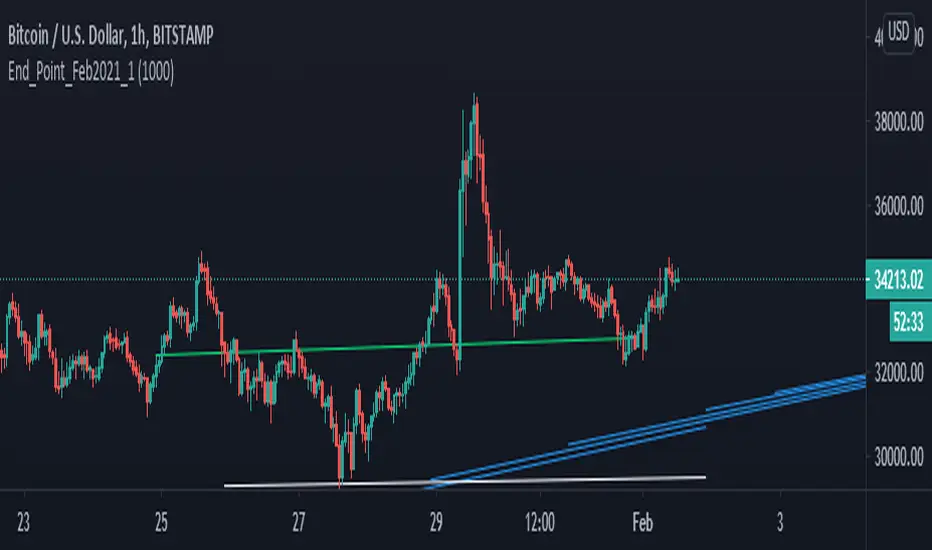
btc
אינדיקטור Pine Script®
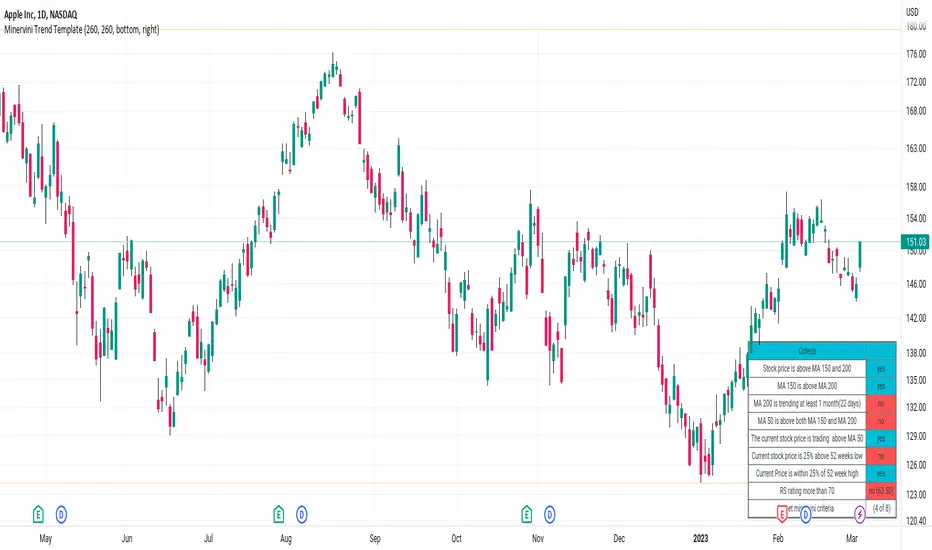
Minervini Trend TemplateMinervini Trend Template
1. Stock price is above MA 150 and 200
2. MA 150 is above MA 200
3. MA 200 is trending at least 1 month(22 days)
4. MA 50 is above both MA 150 and MA 200
5. Current stock price is 25% above 52 weeks low
6. Current Price is within 25% of 52 week high
7. RS Ratings
אינדיקטור Pine Script®
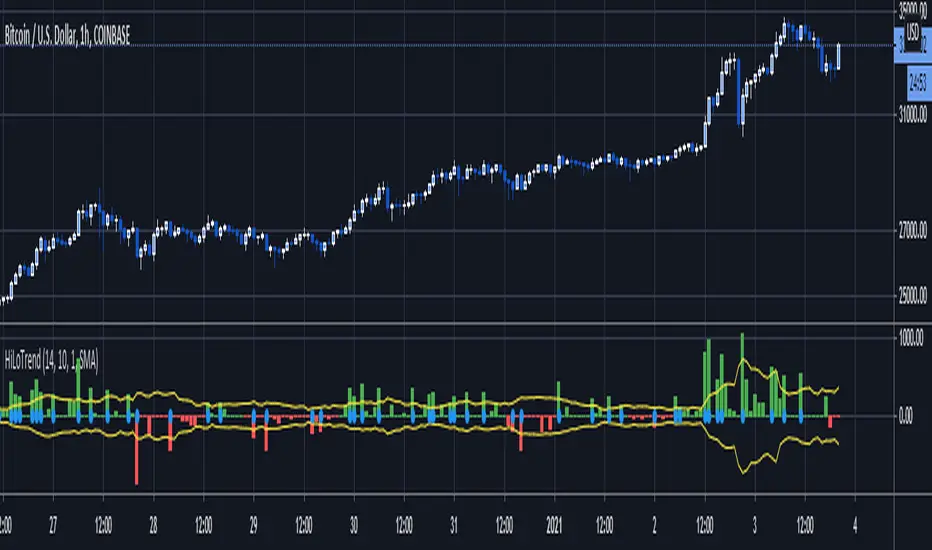
Hi-Lo TrendThis script uses the most recent low/high and candle size to determine trend breakouts.
The trend is determined buy whether the most recent price extreme within the Lookback period is a high or low. If it is a most recent high, it is an uptrend, if it is a lwo, a downtrend.
Bands are created using the average absolute difference of current minus previous close over the MABandPeriod, multiplied by the MABandMultiplier.
If the current close minus previous close is above/below the band, then a blue dot is painted and it is a breakout.
a buy alert fires when a downtrend becomes an uptrend and a breakout above the bands happens.
A sell alert fires when an uptrend becomes a downtrend and a breakout below the bands happns.
אינדיקטור Pine Script®
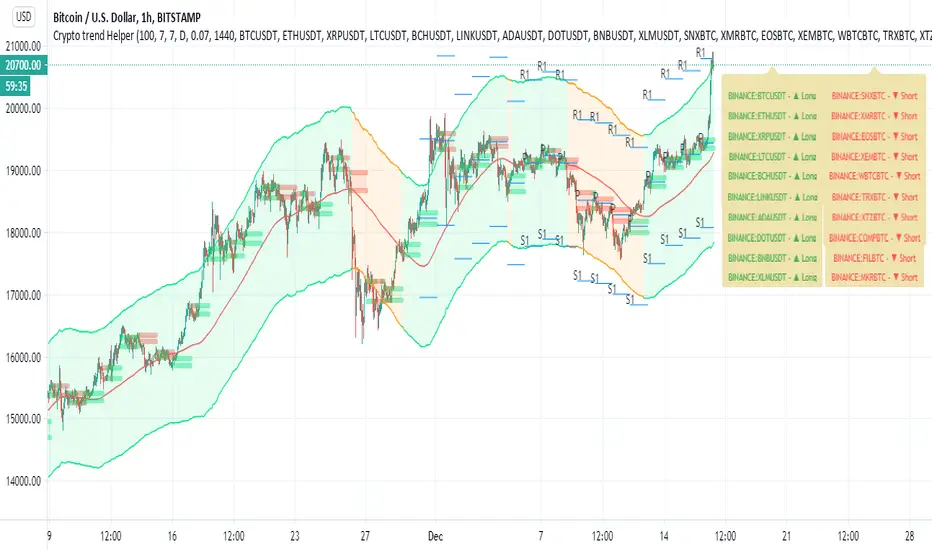
Crypto trend HelperThis is a good tool for chart 2 hours and bellow
the screener script taken from //script taken from with his consent.
long and short determine by my script Trend M version 1
it set up to daily MTF so if it above the mean it green or buy,bellow it it sell
R1 and S1 by percentage from mean set to 7 % or 0.07
the channel is percentage channel set to 7 % up or low
the color of this channel set by
it function to see long trends
you can modify the alts inside the script or in menu\
thanks for Zekis for it help in the screener
אינדיקטור Pine Script®
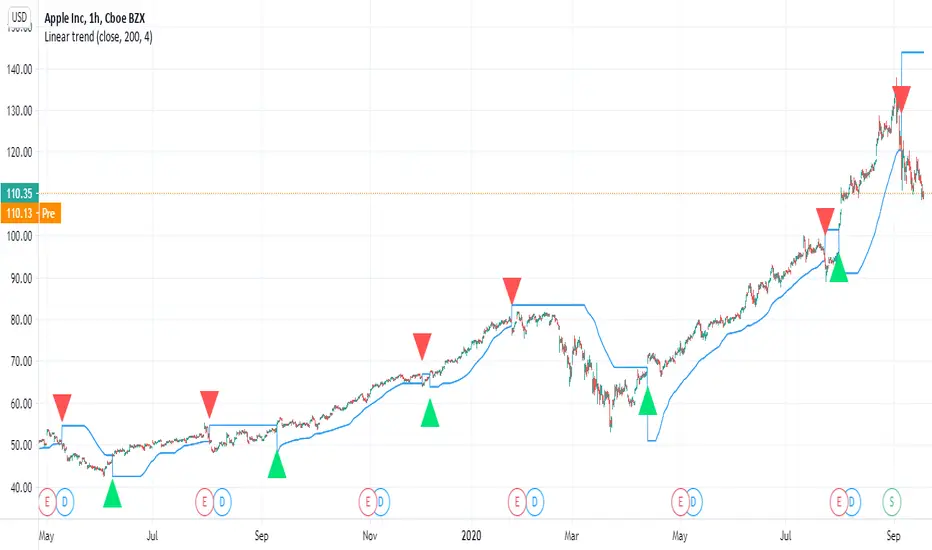
Linear trendBy request of a user
I just put this indicator which is a linear regression that work on same logic as super trend
the control is by length (len) and the deviation
there is alerts and signals
try to find best settings according to your needs
it can done in a different way as well
this one seems to work nice on stocks
אסטרטגיית Pine Script®
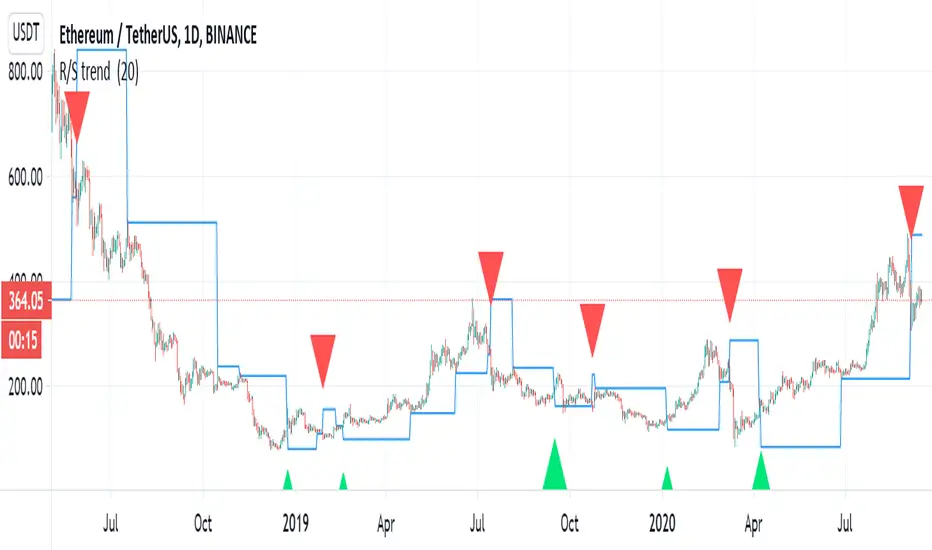
R/S trend my stupid country go to lockdown again due to covid 19, so at least i can play with some scripts:)
This is not super trend but by the same logic, we can make a trend based on support and resistance.
r =length so if you want it to buy more make it shorter or vice versa
alerts inclusded plus signals
the trend based o finding highest high and lowest low
i hope you like this one
tesla
אינדיקטור Pine Script®
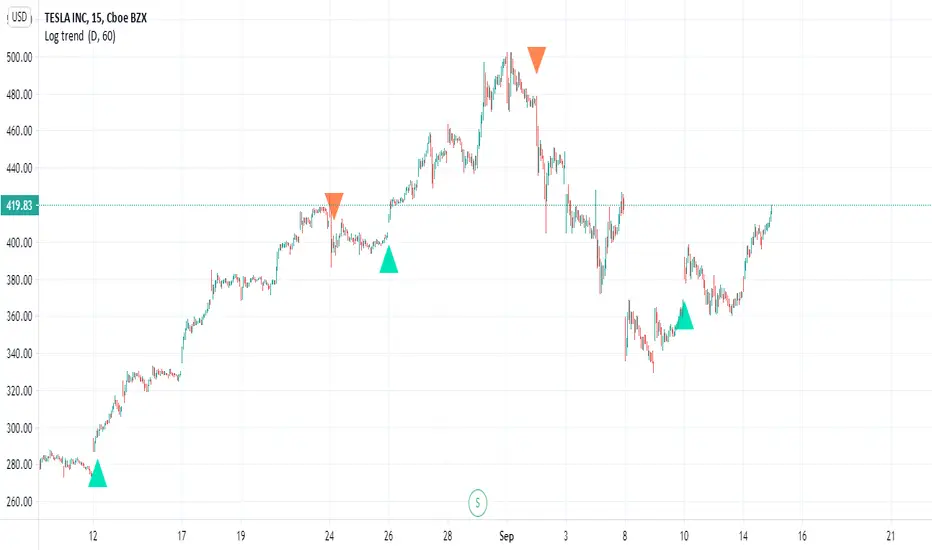
Log trend Very nice Log trend with alerts, signals
this version is MTF version with no repaint
i just took the logic of a super trend and converted it to a log type trend
you will find in menue (MTF - this for control of trend up or down)
HTF (no security type ) for close
try to play with either to find best settings
alerts are activated by alerts menue
אינדיקטור Pine Script®
RSI SUPER TREND V1very simple script of RSI super trend based on super trend V
(can be found in my open scripts
buy period is green
sell period is red
you can change length by min time (now set to 240 min)
you can change output by RSI length or the supertrend ATR
very easy to add signal or alert to it
i may do it later
אינדיקטור Pine Script®

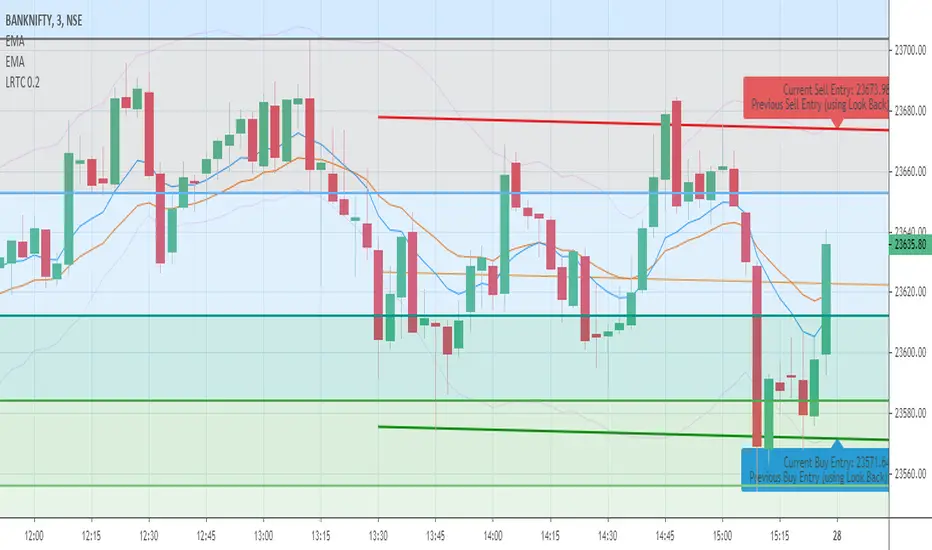
Linear Regression Trend Channel with Entries & Alerts-vinayLinear Regression Trend Channel with Entries & Alerts-vinay
אינדיקטור Pine Script®
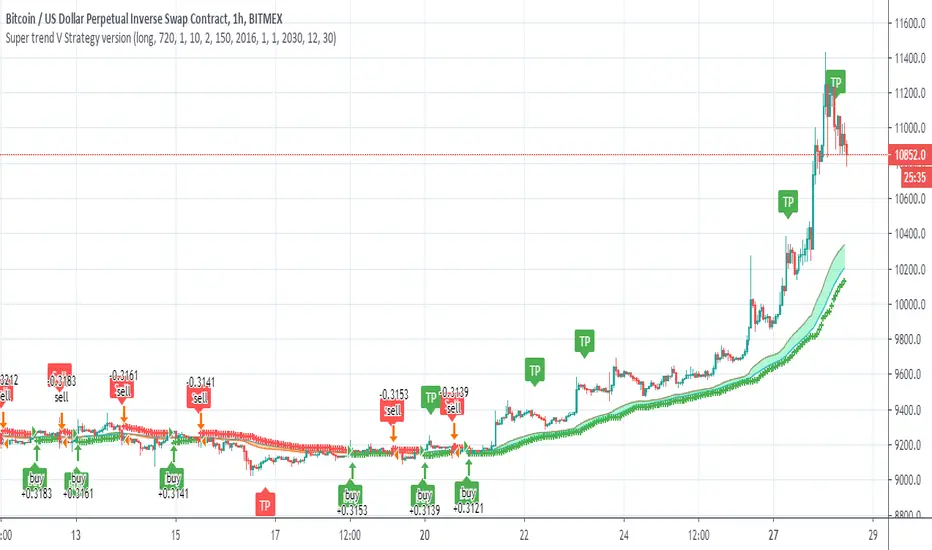
Super trend V Strategy versionThis is the strategy of Super trend V indicator
it not calculating the TP points which can make it much more proftible in theory
just the buy and sell of the super trend
youy can choose long only
short only
or both directions
אסטרטגיית Pine Script®
price trendshello :
this is my first indicator
to plot the trends automatically, you have 2 parameter in this indicator
1- DELTA is the scale used by indicator
2- offset : define the offset of the drawn line
אינדיקטור Pine Script®