RSI Analytic Volume Matrix [RAVM] Overview
RSI Analytic Volume Matrix is an overlay indicator that turns classic RSI into a multi-layered market-reading engine. Instead of treating RSI 30 and 70 as simple buy/sell lines, RAVM combines RSI geometry (angle and acceleration), statistical volume analysis, and a 5×5 VSA-inspired matrix to describe what is really happening inside each candle.
The script is designed as an educational and analytical tool. It does not generate trading signals. Instead, it helps you read the market context, understand where the pressure is coming from (buyers vs. sellers), and see how price, momentum, and volume interact in real time.
Concept & Philosophy
RAVM is built around a hierarchical logic and a few core ideas:
• Hierarchical State Machine: First, RSI defines a context (where we are in the 0–100 range). Then the geometric engine evaluates the angle-of-turn of RSI using a Z-Score. Only after a meaningful geometric event is detected does the system promote a bar to a potential setup (warning vs. confirmed).
• Geometric Primacy: The angle and acceleration of RSI (RSI geometry) are more important than the raw RSI level itself. RAVM uses a geometric veto: if the geometric trigger is not confirmed, the confidence score is capped below 50%, even if volume looks interesting.
• RSI Beyond 30 and 70: Being above 70 or below 30 is not treated as an automatic overbought/oversold signal. RAVM treats those zones as contextual factors that contribute only a partial portion of the final score, alongside geometry, total volume expansion, buy/sell balance, and delta power.
• Volume Decomposition: Volume is decomposed into total, buy-side, sell-side, and delta components. Each of these is normalized with a Z-Score over a shared statistical window, so RSI geometry and volume live in the same statistical context.
• Educational Scoring Pipeline: RAVM builds a 0–100 "Quantum Score" for each detected setup. The score expresses how strong the story is across four dimensions: geometry (RSI angle-of-turn), total volume expansion, which side is driving that volume (buyers vs. sellers), and the power of delta. The score is designed for learning and weighting, not for mechanical trade entries.
• VSA Matrix Engine: A 5×5 matrix combines momentum states and volume dynamics. Each cell corresponds to an interpreted VSA-style scenario (Absorption, Distribution, No Demand, Stopping Volume, Strong Reversal, etc.), shown both as text and as a heatmap dashboard on the chart.
How RAVM Works
1. RSI Context & Geometry
RAVM starts with a classic RSI, but it does not stop at simple level checks. It computes the velocity and acceleration of RSI and normalizes them via a Z-Score to produce an Angle-of-Turn metric (Z-AoT). This Z-AoT is then mapped into a 0–1 intensity value called MSI (Momentum Shift Intensity).
The script monitors both classic RSI zones (around 30 and 70) and geometric triggers. Entering the lower or upper zone is treated as a contextual event only. A setup becomes "confirmed" when a significant geometric turn is detected (based on Z-AoT thresholds). Otherwise, the bar is at most a warning.
2. Volume & Statistical Engine
The volume engine can work in two modes: a geometric approximation (based on candle structure) or a more precise intrabar mode using up/down volume requests. In both cases, RAVM builds a volume packet consisting of:
• Total volume
• Buy-side volume
• Sell-side volume
• Delta (buy – sell)
Each of these series is normalized using a Z-Score over the same statistical window that is used for RSI geometry. This allows RAVM to answer questions such as: Is total volume exceptional on this bar? Is the expansion mostly coming from buyers or from sellers? Is delta unusually strong or weak compared to recent history?
3. Scoring System (Quantum Score)
For each bar where a setup is active, RAVM computes a 0–100 score intended as an educational confidence measure. The scoring pipeline follows this sequence:
A. RSI Geometry (MSI): Measures the strength of the RSI angle-of-turn via Z-AoT. This has geometric primacy over simple level checks.
B. RSI Zone Context: Being below 30 or above 70 contributes only a partial bonus to the score, reflecting the idea that these zones are context, not automatic signals. Mildly supportive zones (e.g., RSI below 50 for bullish contexts) can also contribute with lower weight.
C. Total Volume Expansion: A normalized Volume Power term expresses how exceptional the total volume is relative to its recent distribution. If there is no meaningful volume expansion, the score remains modest even if RSI geometry looks interesting.
D. Which Side Is Driving the Volume: RAVM then checks whether the expansion is primarily on the buy side or the sell side, using Z-Score statistics for buy and sell volume separately. This stage does not yet rely on delta as a power metric; it simply answers the question: "Is this expansion mostly driven by buyers, sellers, or both?"
E. Delta as Final Power: Only at the final stage does the script bring in delta and its Z-Score as a measure of how one-sided the pressure really is. A strong negative delta during a bullish context, for example, can highlight absorption, while a strong positive delta against a bearish context can highlight distribution or a buying climax.
If a setup is not geometrically confirmed (for example, a simple entry into RSI 30/70 without a strong geometric turn), RAVM caps the final score below 50%. This "Geometric Veto" enforces the idea that RSI geometry must confirm before a scenario can be considered high-confidence.
4. Overlay UI & Smart Labels
RAVM is an overlay indicator: all information is drawn directly on the price chart, not in a separate pane. When a setup is active, a smart label is attached to the bar, together with a vertical connector line. Each label shows:
• Direction of the setup (bullish or bearish)
• Trigger type (classic OS/OB vs. geometric/hidden)
• Status (warning vs. confirmed)
• Quantum Score as a percentage
Confirmed setups use stronger colors and solid connectors, while warnings use softer colors and dotted connectors. The script also manages label placement to avoid overlap, keeping the chart clean and readable.
In addition to labels, a dashboard table is drawn on the chart. It displays the currently active matrix scenario, the dominant bias, a short textual interpretation, the full 5×5 heatmap, and summary metrics such as RSI, MSI, and Volume Power.
RSI Is Not Just 30 and 70
One of the central design decisions in RAVM is to treat RSI 30 and 70 as context, not as fixed buy/sell buttons. Many traders mechanically assume that RSI below 30 means "buy" and RSI above 70 means "sell". RAVM explicitly rejects this simplification.
Instead, the script asks a series of deeper questions: How sharp is the angle-of-turn of RSI right now? Is total volume expanding or contracting? Is that expansion dominated by buyers or sellers? Is delta confirming the move, or is there a hidden absorption or distribution taking place?
In the scoring logic, being in a lower or upper RSI zone contributes only part of the final score. Geometry, volume expansion, the buy/sell split, and delta power all have to align before a high-confidence scenario emerges. This makes RAVM much closer to a structured market-reading tool than a classic overbought/oversold indicator.
Matrix User Manual – Reading the 5×5 Grid
The heart of RAVM is its 5×5 matrix, where the vertical axis represents momentum states (M1–M5) and the horizontal axis represents volume dynamics (V1–V5). Each cell in this grid corresponds to a VSA-style scenario. The dashboard highlights the currently active cell and prints a textual description so you can read the story at a glance.
1. Confirmation Scenarios
These scenarios occur when momentum direction and volume expansion are aligned:
• Bullish Confirmation / Strong Reversal: Momentum is shifting strongly upward (often from a depressed RSI context), and expanded volume is driven mainly by buyers. Often seen as a strong bullish reversal or continuation signal from a VSA perspective.
• Bearish Confirmation / Strong Drop: Momentum is turning decisively downward, and expanded volume is driven mainly by sellers. This maps to strong bearish continuation or sharp reversal patterns.
2. Absorption & Stopping Volume
• Absorption: Total volume expands, but the dominant flow is opposite to the recent price move or the geometric bias. For example, heavy selling volume while the geometric context is bullish. This can indicate smart money quietly absorbing orders from the crowd.
• Stopping Volume: Exceptionally high volume appears near the end of an extended move, while momentum begins to decelerate. Price may still print new extremes, but the effort vs. result relationship signals potential exhaustion and the possibility of a turn.
3. Distribution & Buying Climax
• Distribution: Heavy buying volume appears within a bearish or topping context. Rather than healthy accumulation, this often represents larger players offloading inventory to late buyers. The matrix will typically flag this as a bearish-leaning scenario despite strong upside prints.
• Buying Climax: A surge of buy-side volume near the end of a strong uptrend, with momentum starting to weaken. From a VSA point of view, this is often the last push where retail aggressively buys what smart money is selling.
4. No Demand & No Supply
• No Demand: Price attempts to rise but does so on low, non-expansive volume. The market is not interested in following the move, and the lack of participation often precedes weakness or sideways action.
• No Supply: Price tries to push lower on thin volume. Selling pressure is limited, and the lack of supply can precede stabilization or recovery if buyers step back in.
5. Trend Exhaustion
• Uptrend Exhaustion: Momentum remains nominally bullish, but the quality of volume deteriorates (e.g., more effort, less net result). The matrix marks this as an uptrend losing internal strength, often after a series of aggressive moves.
• Downtrend Exhaustion: Similar logic in the opposite direction: strong prior downtrend, but increasingly inefficient downside progress relative to the volume invested. This can precede accumulation or a relief rally.
6. Effort vs. Result Scenarios
• Bullish Effort, Little Result: Buyers invest notable volume, but price progress is limited. This may reveal hidden selling into strength or a lack of follow-through from the broader market.
• Bearish Effort, Little Result: Sellers push volume, but price does not decline proportionally. This can indicate absorption of selling pressure and potential underlying demand.
7. Neutral, Churn & Thin Markets
• Neutral / Thin Market: Momentum and volume both remain muted. RAVM marks these as neutral cells where aggressive decision-making is usually less attractive and observing the broader structure is more important.
• High Volume Churn / Volatility: Both sides are active with high volume but limited directional progress. This can correspond to battle zones, local ranges, or high volatility rotations where the main message is conflict rather than clear trend.
Inputs & Options
RAVM includes several input groups to adapt the tool to your preferences:
• Localization: Multiple language options for all labels and dashboard text (e.g., English, Farsi, Turkish, Russian).
• RSI Core Settings: RSI length, source, and upper/lower contextual zones (typically around 30 and 70).
• Geometric Engine: Z-AoT sigma thresholds, confirmation ratios, and normalization window multiplier. These control how sensitive the script is to RSI angle-of-turn events.
• Volume Engine: Choice between geometric approximation and intrabar up/down volume, Z-Score thresholds for volume expansion, and related parameters.
• Visual Interface: Toggles for smart labels, dashboard table, font sizes, dashboard position, and color themes for bullish, bearish, and warning states.
Disclaimer
RSI Analytic Volume Matrix is provided for educational and research purposes only. It does not constitute financial advice and is not a signal generator. Any trading decisions you make based on this tool, or any other, are entirely your own responsibility. Always consider your own risk management rules and conduct your own analysis.
חפש סקריפטים עבור "trigger"

Per Bak Self-Organized CriticalityTL;DR: This indicator measures market fragility. It measures the system's vulnerability to cascade failures and phase transitions. I've added four independent stress vectors: tail risk, volatility regime, credit stress, and positioning extremes. This allows us to quantify how susceptible markets are to disproportionate moves from small shocks, similar to how a steep sandpile is primed for avalanches.
Avalanches, forest fires, earthquakes, pandemic outbreaks, and market crashes. What do they all have in common? They are not random.
These events follow power laws - stable systems that naturally evolve toward critical states where small triggers can unleash catastrophic cascades.
For example, if you are building a sandpile, there will be a point with a little bit additional sand will cause a landslide.
Markets build fragility grain by grain, like a sandpile approaching avalanche.
The Per Bak Self-Organized Criticality (SOC) indicator detects when the markets are a few grains away from collapse.
This indicator is highly inspired by the work of Per Bak related to the science of self-organized criticality .
As Bak said:
"The earthquake does not 'know how large it will become'. Thus, any precursor state of a large event is essentially identical to a precursor state of a small event."
For markets, this means:
We cannot predict individual crash size from initial conditions
We can predict statistical distribution of crashes
We can identify periods of increased systemic risk (proximity to critical state)
BTW, this is a forwarding looking indicator and doesn't reprint. :)
The Story of Per Bak
In 1987, Danish physicist Per Bak and his colleagues discovered an important pattern in nature: self-organized criticality.
Their sandpile experiment revealed something: drop grains of sand one by one onto a pile, and the system naturally evolves toward a critical state. Most grains cause nothing. Some trigger small slides. But occasionally a single grain triggers a massive avalanche.
The key insight is that we cannot predict which grain will trigger the avalanche, but you can measure when the pile has reached a critical state.
Why Markets Are the Ultimate SOC System?
Financial markets exhibit all the hallmarks of self-organized criticality:
Interconnected agents (traders, institutions, algorithms) with feedback loops
Non-linear interactions where small events can cascade through the system
Power-law distributions of returns (fat tails, not normal distributions)
Natural evolution toward fragility as leverage builds, correlations tighten, and positioning crowds
Phase transitions where calm markets suddenly shift to crisis regimes
Mathematical Foundation
Power Law Distributions
Traditional finance assumes returns follow a normal distribution. "Markets return 10% on average." But I disagree. Markets follow power laws:
P(x) ∝ x^(-α)
Where P(x) is the probability of an event of size x, and α is the power law exponent (typically 3-4 for financial markets).
What this means: Small moves happen constantly. Medium moves are less frequent. Catastrophic moves are rare but follow predictable probability distributions. The "fat tails" are features of critical systems.
Critical Slowing Down
As systems approach phase transitions, they exhibit critical slowing down—reduced ability to absorb shocks. Mathematically, this appears as:
τ ∝ |T - T_c|^(-ν)
Where τ is the relaxation time, T is the current state, T_c is the critical threshold, and ν is the critical exponent.
Translation: Near criticality, markets take longer to recover from perturbations. Fragility compounds.
Component Aggregation & Non-Linear Emergence
The Per Bak SOC our index aggregates four normalized components (each scaled 0-100) with tunable weights:
SOC = w₁·C_tail + w₂·C_vol + w₃·C_credit + w₄·C_position
Default weights (you can change this):
w₁ = 0.34 (Tail Risk via SKEW)
w₂ = 0.26 (Volatility Regime via VIX term structure)
w₃ = 0.18 (Credit Stress via HYG/LQD + TED spread)
w₄ = 0.22 (Positioning Extremes via Put/Call ratio)
Each component uses percentile ranking over a 252-day lookback combined with absolute thresholds to capture both relative regime shifts and extreme absolute levels.
The Four Pillars Explained
1. Tail Risk (SKEW Index)
Measures options market pricing of fat-tail events. High SKEW indicates elevated outlier probability.
C_tail = 0.7·percentrank(SKEW, 252) + 0.3·((SKEW - 115)/0.5)
2. Volatility Regime (VIX Term Structure)
Combines VIX level with term structure slope. Backwardation signals acute stress.
C_vol = 0.4·VIX_level + 0.35·VIX_slope + 0.25·VIX_ratio
3. Credit Stress (HYG/LQD + TED Spread)
Tracks high-yield deterioration versus investment-grade and interbank lending stress.
C_credit = 0.65·percentrank(LQD/HYG, 252) + 0.35·(TED/0.75)·100
4. Positioning Extremes (Put/Call Ratio)
Detects extreme hedging demand through percentile ranking and z-score analysis.
C_position = 0.6·percentrank(P/C, 252) + 0.4·zscore_normalized
What the Indicator Really Measures?
Not Volatility but Fragility
Markets Going Down ≠ Fragility Building (actually when markets go down, risk and fragility are released)
The 0-100 Scale & Regime Thresholds
The indicator outputs a 0-100 fragility score with four regimes:
🟢 Safe (0-39): System resilient, can absorb normal shocks
🟡 Building (40-54): Early fragility signs, watch for deterioration
🟠 Elevated (55-69): System vulnerable
🔴 Critical (70-100): Highly susceptible to cascade failures
Further Reading for Nerds
Bak, P., Tang, C., & Wiesenfeld, K. (1987). "Self-organized criticality: An explanation of 1/f noise." Physical Review Letters.
Bak, P. & Chen, K. (1991). "Self-organized criticality." Scientific American.
Bak, P. (1996). How Nature Works: The Science of Self-Organized Criticality. Copernicus.
Feedback is appreciated :)

Mars Signals - Ultimate Institutional Suite v3.0(Joker)Comprehensive Trading Manual
Mars Signals – Ultimate Institutional Suite v3.0 (Joker)
## Chapter 1 – Philosophy & System Architecture
This script is not a simple “buy/sell” indicator.
Mars Signals – UIS v3.0 (Joker) is designed as an institutional-style analytical assistant that layers several methodologies into a single, coherent framework.
The system is built on four core pillars:
1. Smart Money Concepts (SMC)
- Detection of Order Blocks (professional demand/supply zones).
- Detection of Fair Value Gaps (FVGs) (price imbalances).
2. Smart DCA Strategy
- Combination of RSI and Bollinger Bands
- Identifies statistically discounted zones for scaling into spot positions or exiting shorts.
3. Volume Profile (Visible Range Simulation)
- Distribution of volume by price, not by time.
- Identification of POC (Point of Control) and high-/low-volume areas.
4. Wyckoff Helper – Spring
- Detection of bear traps, liquidity grabs, and sharp bullish reversals.
All four pillars feed into a Confluence Engine (Scoring System).
The final output is presented in the Dashboard, with a clear, human-readable signal:
- STRONG LONG 🚀
- WEAK LONG ↗
- NEUTRAL / WAIT
- WEAK SHORT ↘
- STRONG SHORT 🩸
This allows the trader to see *how many* and *which* layers of the system support a bullish or bearish bias at any given time.
## Chapter 2 – Settings Overview
### 2.1 General & Dashboard Group
- Show Dashboard Panel (`show_dash`)
Turns the dashboard table in the corner of the chart ON/OFF.
- Show Signal Recommendation (`show_rec`)
- If enabled, the textual signal (STRONG LONG, WEAK SHORT, etc.) is displayed.
- If disabled, you only see feature status (ON/OFF) and the current price.
- Dashboard Position (`dash_pos`)
Determines where the dashboard appears on the chart:
- `Top Right`
- `Bottom Right`
- `Top Left`
### 2.2 Smart Money (SMC) Group
- Enable SMC Strategy (`show_smc`)
Globally enables or disables the Order Block and FVG logic.
- Order Block Pivot Lookback (`ob_period`)
Main parameter for detecting key pivot highs/lows (swing points).
- Default value: 5
- Concept:
A bar is considered a pivot low if its low is lower than the lows of the previous 5 and the next 5 bars.
Similarly, a pivot high has a high higher than the previous 5 and the next 5 bars.
These pivots are used as anchors for Order Blocks.
- Increasing `ob_period`:
- Fewer levels.
- But levels tend to be more significant and reliable.
- In highly volatile markets (major news, war events, FOMC, etc.),
using values 7–10 is recommended to filter out weak levels.
- Show Fair Value Gaps (`show_fvg`)
Enables/disables the drawing of FVG zones (imbalances).
- Bullish OB Color (`c_ob_bull`)
- Color of Bullish Order Blocks (Demand Zones).
- Default: semi-transparent green (transparency ≈ 80).
- Bearish OB Color (`c_ob_bear`)
- Color of Bearish Order Blocks (Supply Zones).
- Default: semi-transparent red.
- Bullish FVG Color (`c_fvg_bull`)
- Color of Bullish FVG (upward imbalance), typically yellow.
- Bearish FVG Color (`c_fvg_bear`)
- Color of Bearish FVG (downward imbalance), typically purple.
### 2.3 Smart DCA Strategy Group
- Enable DCA Zones (`show_dca`)
Enables the Smart DCA logic and visual labels.
- RSI Length (`rsi_len`)
Lookback period for RSI (default: 14).
- Shorter → more sensitive, more noise.
- Longer → fewer signals, higher reliability.
- Bollinger Bands Length (`bb_len`)
Moving average period for Bollinger Bands (default: 20).
- BB Multiplier (`bb_mult`)
Standard deviation multiplier for Bollinger Bands (default: 2.0).
- For extremely volatile markets, values like 2.5–3.0 can be used so that only extreme deviations trigger a DCA signal.
### 2.4 Volume Profile (Visible Range Sim) Group
- Show Volume Profile (`show_vp`)
Enables the simulated Volume Profile bars on the right side of the chart.
- Volume Lookback Bars (`vp_lookback`)
Number of bars used to compute the Volume Profile (default: 150).
- Higher values → broader historical context, heavier computation.
- Row Count (`vp_rows`)
Number of vertical price segments (rows) to divide the total price range into (default: 30).
- Width (%) (`vp_width`)
Relative width of each volume bar as a percentage.
In the code, bar widths are scaled relative to the row with the maximum volume.
> Technical note: Volume Profile calculations are executed only on the last bar (`barstate.islast`) to keep the script performant even on higher timeframes.
### 2.5 Wyckoff Helper Group
- Show Wyckoff Events (`show_wyc`)
Enables detection and plotting of Wyckoff Spring events.
- Volume MA Length (`vol_ma_len`)
Length of the moving average on volume.
A bar is considered to have Ultra Volume if its volume is more than 2× the volume MA.
## Chapter 3 – Smart Money Strategy (Order Blocks & FVG)
### 3.1 What Is an Order Block?
An Order Block (OB) represents the footprint of large institutional orders:
- Bullish Order Block (Demand Zone)
The last selling region (bearish candle/cluster) before a strong upward move.
- Bearish Order Block (Supply Zone)
The last buying region (bullish candle/cluster) before a strong downward move.
Institutions and large players place heavy orders in these regions. Typical price behavior:
- Price moves away from the zone.
- Later returns to the same zone to fill unfilled orders.
- Then continues the larger trend.
In the script:
- If `pl` (pivot low) forms → a Bullish OB is created.
- If `ph` (pivot high) forms → a Bearish OB is created.
The box is drawn:
- From `bar_index ` to `bar_index`.
- Between `low ` and `high `.
- `extend=extend.right` extends the OB into the future, so it acts as a dynamic support/resistance zone.
- Only the last 4 OB boxes are kept to avoid clutter.
### 3.2 Order Block Color Guide
- Semi-transparent Green (`c_ob_bull`)
- Represents a Bullish Order Block (Demand Zone).
- Interpretation: a price region with a high probability of bullish reaction.
- Semi-transparent Red (`c_ob_bear`)
- Represents a Bearish Order Block (Supply Zone).
- Interpretation: a price region with a high probability of bearish reaction.
Overlap (Multiple OBs in the Same Area)
When two or more Order Blocks overlap:
- The shared area appears visually denser/stronger.
- This suggests higher order density.
- Such zones can be treated as high-priority levels for entries, exits, and stop-loss placement.
### 3.3 Demand/Supply Logic in the Scoring Engine
is_in_demand = low <= ta.lowest(low, 20)
is_in_supply = high >= ta.highest(high, 20)
- If current price is near the lowest lows of the last 20 bars, it is considered in a Demand Zone → positive impact on score.
- If current price is near the highest highs of the last 20 bars, it is considered in a Supply Zone → negative impact on score.
This logic complements Order Blocks and helps the Dashboard distinguish whether:
- Market is currently in a statistically cheap (long-friendly) area, or
- In a statistically expensive (short-friendly) area.
### 3.4 Fair Value Gaps (FVG)
#### Concept
When the market moves aggressively:
- Some price levels are skipped and never traded.
- A gap between wicks/shadows of consecutive candles appears.
- These regions are called Fair Value Gaps (FVGs) or Imbalances.
The market generally “dislikes” imbalance and often:
- Returns to these zones in the future.
- Fills the gap (rebalance).
- Then resumes its dominant direction.
#### Implementation in the Code
Bullish FVG (Yellow)
fvg_bull_cond = show_smc and show_fvg and low > high and close > high
if fvg_bull_cond
box.new(bar_index , high , bar_index, low, ...)
Core condition:
`low > high ` → the current low is above the high of two bars ago; the space between them is an untraded gap.
Bearish FVG (Purple)
fvg_bear_cond = show_smc and show_fvg and high < low and close < low
if fvg_bear_cond
box.new(bar_index , low , bar_index, high, ...)
Core condition:
`high < low ` → the current high is below the low of two bars ago; again a price gap exists.
#### FVG Color Guide
- Transparent Yellow (`c_fvg_bull`) – Bullish FVG
Often acts like a magnet for price:
- Price tends to retrace into this zone,
- Fill the imbalance,
- And then continue higher.
- Transparent Purple (`c_fvg_bear`) – Bearish FVG
Price tends to:
- Retrace upward into the purple area,
- Fill the imbalance,
- And then resume downward movement.
#### Trading with FVGs
- FVGs are *not* standalone entry signals.
They are best used as:
- Targets (take-profit zones), or
- Reaction areas where you expect a pause or reversal.
Examples:
- If you are long, a bearish FVG above is often an excellent take-profit zone.
- If you are short, a bullish FVG below is often a good cover/exit zone.
### 3.5 Core SMC Trading Templates
#### Reversal Long
1. Price trades down into a green Order Block (Demand Zone).
2. A bullish confirmation candle (Close > Open) forms inside or just above the OB.
3. If this zone is close to or aligned with a bullish FVG (yellow), the signal is reinforced.
4. Entry:
- At the close of the confirmation candle, or
- Using a limit order near the upper boundary of the OB.
5. Stop-loss:
- Slightly below the OB.
- If the OB is broken decisively and price consolidates below it, the zone loses validity.
6. Targets:
- The next FVG,
- Or the next red Order Block (Supply Zone) above.
#### Reversal Short
The mirror scenario:
- Price rallies into a red Order Block (Supply).
- A bearish confirmation candle forms (Close < Open).
- FVG/premium structure above can act as a confluence.
- Stop-loss goes above the OB.
- Targets: lower FVGs or subsequent green OBs below.
## Chapter 4 – Smart DCA Strategy (RSI + Bollinger Bands)
### 4.1 Smart DCA Concept
- Classic DCA = buying at fixed time intervals regardless of price.
- Smart DCA = scaling in only when:
- Price is statistically cheaper than usual, and
- The market is in a clear oversold condition.
Code logic:
rsi_val = ta.rsi(close, rsi_len)
= ta.bb(close, bb_len, bb_mult)
dca_buy = show_dca and rsi_val < 30 and close < bb_lower
dca_sell = show_dca and rsi_val > 70 and close > bb_upper
Conditions:
- DCA Buy – Smart Scale-In Zone
- RSI < 30 → oversold.
- Close < lower Bollinger Band → price has broken below its typical volatility envelope.
- DCA Sell – Overbought/Distribution Zone
- RSI > 70 → overbought.
- Close > upper Bollinger Band → price is extended far above the mean.
### 4.2 Visual Representation on the Chart
- Green “DCA” Label Below Candle
- Shape: `labelup`.
- Color: lime background, white text.
- Meaning: statistically attractive level for laddered spot entries or short exits.
- Red “SELL” Label Above Candle
- Warning that the market is in an extended, overbought condition.
- Suitable for profit-taking on longs or considering short entries (with proper confluence and risk management).
- Light Green Background (`bgcolor`)
- When `dca_buy` is true, the candle background turns very light green (high transparency).
- This helps visually identify DCA Zones across the chart at a glance.
### 4.3 Practical Use in Trading
#### Spot Trading
Used to build a better average entry price:
- Every time a DCA label appears, allocate a fixed portion of capital (e.g., 2–5%).
- Combining DCA signals with:
- Green OBs (Demand Zones), and/or
- The Volume Profile POC
makes the zone structurally more important.
#### Futures Trading
- Longs
- Use DCA Buy signals as low-risk zones for opening or adding to longs when:
- Price is inside a green OB, or
- The Dashboard already leans LONG.
- Shorts
- Use DCA Sell signals as:
- Exit zones for longs, or
- Areas to initiate shorts with stops above structural highs.
## Chapter 5 – Volume Profile (Visible Range Simulation)
### 5.1 Concept
Traditional volume (histogram under the chart) shows volume over time.
Volume Profile shows volume by price level:
- At which prices has the highest trading activity occurred?
- Where did buyers and sellers agree the most (High Volume Nodes – HVNs)?
- Where did price move quickly due to low participation (Low Volume Nodes – LVNs)?
### 5.2 Implementation in the Script
Executed only when `show_vp` is enabled and on the last bar:
1. The last `vp_lookback` bars (default 150) are processed.
2. The minimum low and maximum high over this window define the price range.
3. This price range is divided into `vp_rows` segments (e.g., 30 rows).
4. For each row:
- All bars are scanned.
- If the mid-price `(high + low ) / 2` falls inside a row, that bar’s volume is added to the row total.
5. The row with the greatest volume is stored as `max_vol_idx` (the POC row).
6. For each row, a volume box is drawn on the right side of the chart.
### 5.3 Color Scheme
- Semi-transparent Orange
- The row with the maximum volume – the Point of Control (POC).
- Represents the strongest support/resistance level from a volume perspective.
- Semi-transparent Blue
- Other volume rows.
- The taller the bar → the higher the volume → the stronger the interest at that price band.
### 5.4 Trading Applications
- If price is above POC and retraces back into it:
→ POC often acts as support, suitable for long setups.
- If price is below POC and rallies into it:
→ POC often acts as resistance, suitable for short setups or profit-taking.
HVNs (Tall Blue Bars)
- Represent areas of equilibrium where the market has spent time and traded heavily.
- Price tends to consolidate here before choosing a direction.
LVNs (Short or Nearly Empty Bars)
- Represent low participation zones.
- Price often moves quickly through these areas – useful for targeting fast moves.
## Chapter 6 – Wyckoff Helper – Spring
### 6.1 Spring Concept
In the Wyckoff framework:
- A Spring is a false break of support.
- The market briefly trades below a well-defined support level, triggers stop losses,
then sharply reverses upward as institutional buyers absorb liquidity.
This movement:
- Clears out weak hands (retail sellers).
- Provides large players with liquidity to enter long positions.
- Often initiates a new uptrend.
### 6.2 Code Logic
Conditions for a Spring:
1. The current low is lower than the lowest low of the previous 50 bars
→ apparent break of a long-standing support.
2. The bar closes bullish (Close > Open)
→ the breakdown was rejected.
3. Volume is significantly elevated:
→ `volume > 2 × volume_MA` (Ultra Volume).
When all conditions are met and `show_wyc` is enabled:
- A pink diamond is plotted below the bar,
- With the label “Spring” – one of the strongest long signals in this system.
### 6.3 Trading Use
- After a valid Spring, markets frequently enter a meaningful bullish phase.
- The highest quality setups occur when:
- The Spring forms inside a green Order Block, and
- Near or on the Volume Profile POC.
Entries:
- At the close of the Spring bar, or
- On the first pullback into the mid-range of the Spring candle.
Stop-loss:
- Slightly below the Spring’s lowest point (wick low plus a small buffer).
## Chapter 7 – Confluence Engine & Dashboard
### 7.1 Scoring Logic
For each bar, the script:
1. Resets `score` to 0.
2. Adjusts the score based on different signals.
SMC Contribution
if show_smc
if is_in_demand
score += 1
if is_in_supply
score -= 1
- Being in Demand → `+1`
- Being in Supply → `-1`
DCA Contribution
if show_dca
if dca_buy
score += 2
if dca_sell
score -= 2
- DCA Buy → `+2` (strong, statistically driven long signal)
- DCA Sell → `-2`
Wyckoff Spring Contribution
if show_wyc
if wyc_spring
score += 2
- Spring → `+2` (entry of strong money)
### 7.2 Mapping Score to Dashboard Signal
- score ≥ 2 → STRONG LONG 🚀
Multiple bullish conditions aligned.
- score = 1 → WEAK LONG ↗
Some bullish bias, but only one layer clearly positive.
- score = 0 → NEUTRAL / WAIT
Rough balance between buying and selling forces; staying flat is usually preferable.
- score = -1 → WEAK SHORT ↘
Mild bearish bias, suited for cautious or short-term plays.
- score ≤ -2 → STRONG SHORT 🩸
Convergence of several bearish signals.
### 7.3 Dashboard Structure
The dashboard is a two-column table:
- Row 0
- Column 0: `"Mars Signals"` – black background, white text.
- Column 1: `"UIS v3.0"` – black background, yellow text.
- Row 1
- Column 0: `"Price:"` (light grey background).
- Column 1: current closing price (`close`) with a semi-transparent blue background.
- Row 2
- Column 0: `"SMC:"`
- Column 1:
- `"ON"` (green) if `show_smc = true`
- `"OFF"` (grey) otherwise.
- Row 3
- Column 0: `"DCA:"`
- Column 1:
- `"ON"` (green) if `show_dca = true`
- `"OFF"` (grey) otherwise.
- Row 4
- Column 0: `"Signal:"`
- Column 1: signal text (`status_txt`) with background color `status_col`
(green, red, teal, maroon, etc.)
- If `show_rec = false`, these cells are cleared.
## Chapter 8 – Visual Legend (Colors, Shapes & Actions)
For quick reading inside TradingView, the visual elements are described line by line instead of a table.
Chart Element: Green Box
Color / Shape: Transparent green rectangle
Core Meaning: Bullish Order Block (Demand Zone)
Suggested Trader Response: Look for longs, Smart DCA adds, closing or reducing shorts.
Chart Element: Red Box
Color / Shape: Transparent red rectangle
Core Meaning: Bearish Order Block (Supply Zone)
Suggested Trader Response: Look for shorts, or take profit on existing longs.
Chart Element: Yellow Area
Color / Shape: Transparent yellow zone
Core Meaning: Bullish FVG / upside imbalance
Suggested Trader Response: Short take-profit zone or expected rebalance area.
Chart Element: Purple Area
Color / Shape: Transparent purple zone
Core Meaning: Bearish FVG / downside imbalance
Suggested Trader Response: Long take-profit zone or temporary supply region.
Chart Element: Green "DCA" Label
Color / Shape: Green label with white text, plotted below the candle
Core Meaning: Smart ladder-in buy zone, DCA buy opportunity
Suggested Trader Response: Spot DCA entry, partial short exit.
Chart Element: Red "SELL" Label
Color / Shape: Red label with white text, plotted above the candle
Core Meaning: Overbought / distribution zone
Suggested Trader Response: Take profit on longs, consider initiating shorts.
Chart Element: Light Green Background (bgcolor)
Color / Shape: Very transparent light-green background behind bars
Core Meaning: Active DCA Buy zone
Suggested Trader Response: Treat as a discount zone on the chart.
Chart Element: Orange Bar on Right
Color / Shape: Transparent orange horizontal bar in the volume profile
Core Meaning: POC – price with highest traded volume
Suggested Trader Response: Strong support or resistance; key reference level.
Chart Element: Blue Bars on Right
Color / Shape: Transparent blue horizontal bars in the volume profile
Core Meaning: Other volume levels, showing high-volume and low-volume nodes
Suggested Trader Response: Use to identify balance zones (HVN) and fast-move corridors (LVN).
Chart Element: Pink "Spring" Diamond
Color / Shape: Pink diamond with white text below the candle
Core Meaning: Wyckoff Spring – liquidity grab and potential major bullish reversal
Suggested Trader Response: One of the strongest long signals in the suite; look for high-quality long setups with tight risk.
Chart Element: STRONG LONG in Dashboard
Color / Shape: Green background, white text in the Signal row
Core Meaning: Multiple bullish layers in confluence
Suggested Trader Response: Consider initiating or increasing longs with strict risk management.
Chart Element: STRONG SHORT in Dashboard
Color / Shape: Red background, white text in the Signal row
Core Meaning: Multiple bearish layers in confluence
Suggested Trader Response: Consider initiating or increasing shorts with a logical, well-placed stop.
## Chapter 9 – Timeframe-Based Trading Playbook
### 9.1 Timeframe Selection
- Scalping
- Timeframes: 1M, 5M, 15M
- Objective: fast intraday moves (minutes to a few hours).
- Recommendation: focus on SMC + Wyckoff.
Smart DCA on very low timeframes may introduce excessive noise.
- Day Trading
- Timeframes: 15M, 1H, 4H
- Provides a good balance between signal quality and frequency.
- Recommendation: use the full stack – SMC + DCA + Volume Profile + Wyckoff + Dashboard.
- Swing Trading & Position Investing
- Timeframes: Daily, Weekly
- Emphasis on Smart DCA + Volume Profile.
- SMC and Wyckoff are used mainly to fine-tune swing entries within larger trends.
### 9.2 Scenario A – Scalping Long
Example: 5-Minute Chart
1. Price is declining into a green OB (Bullish Demand).
2. A candle with a long lower wick and bullish close (Pin Bar / Rejection) forms inside the OB.
3. A Spring diamond appears below the same candle → very strong confluence.
4. The Dashboard shows at least WEAK LONG ↗, ideally STRONG LONG 🚀.
5. Entry:
- On the close of the confirmation candle, or
- On the first pullback into the mid-range of that candle.
6. Stop-loss:
- Slightly below the OB.
7. Targets:
- Nearby bearish FVG above, and/or
- The next red OB.
### 9.3 Scenario B – Day-Trading Short
Recommended Timeframes: 1H or 4H
1. The market completes a strong impulsive move upward.
2. Price enters a red Order Block (Supply).
3. In the same zone, a purple FVG appears or remains unfilled.
4. On a lower timeframe (e.g., 15M), RSI enters overbought territory and a DCA Sell signal appears.
5. The main timeframe Dashboard (1H) shows WEAK SHORT ↘ or STRONG SHORT 🩸.
Trade Plan
- Open a short near the upper boundary of the red OB.
- Place the stop above the OB or above the last swing high.
- Targets:
- A yellow FVG lower on the chart, and/or
- The next green OB (Demand) below.
### 9.4 Scenario C – Swing / Investment with Smart DCA
Timeframes: Daily / Weekly
1. On the daily or weekly chart, each time a green “DCA” label appears:
- Allocate a fixed fraction of your capital (e.g., 3–5%) to that asset.
2. Check whether this DCA zone aligns with the orange POC of the Volume Profile:
- If yes → the quality of the entry zone is significantly higher.
3. If the DCA signal sits inside a daily green OB, the probability of a medium-term bottom increases.
4. Always build the position laddered, never all-in at a single price.
Exits for investors:
- Near weekly red OBs or large purple FVG zones.
- Ideally via partial profit-taking rather than closing 100% at once.
### 9.5 Case Study 1 – BTCUSDT (15-Minute)
- Context: Price has sold off down towards 65,000 USD.
- A green OB had previously formed at that level.
- Near the lower boundary of this OB, a partially filled yellow FVG is present.
- As price returns to this region, a Spring appears.
- The Dashboard shifts from NEUTRAL / WAIT to WEAK LONG ↗.
Plan
- Enter a long near the OB low.
- Place stop below the Spring low.
- First target: a purple FVG around 66,200.
- Second (optional) target: the first red OB above that level.
### 9.6 Case Study 2 – Meme Coin (PEPE – 4H)
- After a strong pump, price enters a corrective phase.
- On the 4H chart, RSI drops below 30; price breaks below the lower Bollinger Band → a DCA label prints.
- The Volume Profile shows the POC at approximately the same level.
- The Dashboard displays STRONG LONG 🚀.
Plan
- Execute laddered buys in the combined DCA + POC zone.
- Place a protective stop below the last significant swing low.
- Target: an expected 20–30% upside move towards the next red OB or purple FVG.
## Chapter 10 – Risk Management, Psychology & Advanced Tuning
### 10.1 Risk Management
No signal, regardless of its strength, replaces risk control.
Recommendations:
- In futures, do not expose more than 1–3% of account equity to risk per trade.
- Adjust leverage to the volatility of the instrument (lower leverage for highly volatile altcoins).
- Place stop-losses in zones where the idea is clearly invalidated:
- Below/above the relevant Order Block or Spring, not randomly in the middle of the structure.
### 10.2 Market-Specific Parameter Tuning
- Calmer Markets (e.g., major FX pairs)
- `ob_period`: 3–5.
- `bb_mult`: 2.0 is usually sufficient.
- Highly Volatile Markets (Crypto, news-driven assets)
- `ob_period`: 7–10 to highlight only the most robust OBs.
- `bb_mult`: 2.5–3.0 so that only extreme deviations trigger DCA.
- `vol_ma_len`: increase (e.g., to ~30) so that Spring triggers only on truly exceptional
volume spikes.
### 10.3 Trading Psychology
- STRONG LONG 🚀 does not mean “risk-free”.
It means the probability of a successful long, given the model’s logic, is higher than average.
- Treat Mars Signals as a confirmation and context system, not a full replacement for your own decision-making.
- Example of disciplined thinking:
- The Dashboard prints STRONG LONG,
- But price is simultaneously testing a multi-month macro resistance or a major negative news event is imminent,
- In such cases, trade smaller, widen stops appropriately, or skip the trade.
## Chapter 11 – Technical Notes & FAQ
### 11.1 Does the Script Repaint?
- Order Blocks and Springs are based on completed pivot structures and confirmed candles.
- Until a pivot is confirmed, an OB does not exist; after confirmation, behavior is stable under classic SMC assumptions.
- The script is designed to be structurally consistent rather than repainting signals arbitrarily.
### 11.2 Computational Load of Volume Profile
- On the last bar, the script processes up to `vp_lookback` bars × `vp_rows` rows.
- On very low timeframes with heavy zooming, this can become demanding.
- If you experience performance issues:
- Reduce `vp_lookback` or `vp_rows`, or
- Temporarily disable Volume Profile (`show_vp = false`).
### 11.3 Multi-Timeframe Behavior
- This version of the script is not internally multi-timeframe.
All logic (OB, DCA, Spring, Volume Profile) is computed on the active timeframe only.
- Practical workflow:
- Analyze overall structure and key zones on higher timeframes (4H / Daily).
- Use lower timeframes (15M / 1H) with the same tool for timing entries and exits.
## Conclusion
Mars Signals – Ultimate Institutional Suite v3.0 (Joker) is a multi-layer trading framework that unifies:
- Price structure (Order Blocks & FVG),
- Statistical behavior (Smart DCA via RSI + Bollinger),
- Volume distribution by price (Volume Profile with POC, HVN, LVN),
- Liquidity events (Wyckoff Spring),
into a single, coherent system driven by a transparent Confluence Scoring Engine.
The final output is presented in clear, actionable language:
> STRONG LONG / WEAK LONG / NEUTRAL / WEAK SHORT / STRONG SHORT
The system is designed to support professional decision-making, not to replace it.
Used together with strict risk management and disciplined execution,
Mars Signals – UIS v3.0 (Joker) can serve as a central reference manual and operational guide
for your trading workflow, from scalping to swing and investment positioning.

Time-Decay Liquidity Zones [BackQuant]Time-Decay Liquidity Zones
A dynamic liquidity map that turns single-bar exhaustion events into fading, color-graded zones, so you can see where trapped traders and unfinished business still matter, and when those areas have finally stopped pulling price.
What this is
This indicator detects unusually strong impulsive moves into wicks, converts them into supply or demand “zones,” then lets those zones decay over time. Each zone carries a strength score that fades bar by bar. Zones that stop attracting or rejecting price are gradually de-emphasized and eventually removed, while the most relevant areas stay bright and obvious.
Instead of static rectangles that live forever, you get a living liquidity map where:
Zones are born from objective criteria: volatility, wick size, and optional volume spikes.
Zones “age” using a configurable decay factor and maximum lifetime.
Zone color and opacity reflect current relative strength on a unified clear → green → red gradient.
Zones freeze when broken, so you can distinguish “active reaction areas” from “historical levels that have already given way”.
Conceptual idea
Large wicks with strong volatility often mark areas where aggressive orders met hidden liquidity and got absorbed. Price may revisit these areas to test leftover interest or to relieve trapped positions. However, not every wick matters for long. As time passes and more bars print, the market “forgets” some areas.
Time-Decay Liquidity Zones turns that idea into a rule-based system:
Find bars that likely reflect strong aggressive flows into liquidity.
Mark a zone around the wick using ATR-based thickness.
Assign a strength score of 1.0 at birth.
Each bar, reduce that score by a decay factor and remove zones that fall below a threshold or live too long.
Color all surviving zones from weak to strong using a single gradient scale and a visual legend.
How events are detected
Detection lives in the Event Detection group. The script combines range, wick size, and optional volume filters into simple rules.
Volatility filter
ATR Length — computes a rolling ATR over your chosen window. This is the volatility baseline.
Min range in ATRs — bar range (High–Low) must exceed this multiple of ATR for an event to be considered. This avoids tiny bars triggering zones.
Wick filters
For each bar, the script splits the candle into body and wicks:
Upper wick = High minus the max(Open, Close).
Lower wick = min(Open, Close) minus Low.
Then it tests:
Upper wick condition — upper wick must be larger than Min wick size in ATRs × ATR.
Lower wick condition — lower wick must be larger than Min wick size in ATRs × ATR.
Only bars with a sufficiently long wick relative to volatility qualify as candidate “liquidity events”.
Volume filter
Optionally, the script requires a volume spike:
Use volume filter — if enabled, volume must exceed a rolling volume SMA by a configurable multiplier.
Volume SMA length — period for the volume average.
Volume spike multiplier — how many times above the SMA current volume needs to be.
This lets you focus only on “heavy” tests of liquidity and ignore quiet bars.
Event types
Putting it together:
Upper event (potential supply / long liquidation, etc.)
Occurs when:
Upper wick is large in ATR terms.
Full bar range is large in ATR terms.
Volume is above the spike threshold (if enabled).
Lower event (potential demand / short liquidation, etc.)
Symmetric conditions using the lower wick.
How zones are constructed
Zone geometry lives in Zone Geometry .
When an event is detected, the script builds a rectangular box that anchors to the wick and extends in the appropriate direction by an ATR-based thickness.
For upper (supply-type) zones
Bottom of the zone = event bar high.
Top of the zone = event bar high + Zone thickness in ATRs × ATR.
The zone initially spans only the event bar on the x-axis, but is extended to the right as new bars appear while the zone is active.
For lower (demand-type) zones
Top of the zone = event bar low.
Bottom of the zone = event bar low − Zone thickness in ATRs × ATR.
Same extension logic: box starts on the event bar and grows rightward while alive.
The result is a band around the wick that scales with volatility. On high-ATR charts, zones are thicker. On calm charts, they are narrower and more precise.
Zone lifecycle, decay, and removal
All lifecycle logic is controlled by the Decay & Lifetime group.
Each zone carries:
Score — a floating-point “importance” measure, starting at 1.0 when created.
Direction — +1 for upper zones, −1 for lower zones.
Birth index — bar index at creation time.
Active flag — whether the zone is still considered unbroken and extendable.
1) Active vs broken
Each confirmed bar, the script checks:
For an upper zone , the zone is counted as “broken” when the close moves above the top of the zone.
For a lower zone , the zone is counted as “broken” when the close moves below the bottom of the zone.
When a zone breaks:
Its right edge is frozen at the previous bar (no further extension).
The zone remains on the chart, but is no longer updated by price interaction. It still decays in score until removal.
This lets you see where a major level was overrun, while naturally fading its influence over time.
2) Time decay
At each confirmed bar:
Score := Score × Score decay per bar .
A decay value close to 1.0 means very slow decay and long-lived zones.
Lower values (closer to 0.9) mean faster forgetting and more current-focused zones.
You are controlling how quickly the market “forgets” past events.
3) Age and score-based removal
Zones are removed when either:
Age in bars exceeds Max bars a zone can live .
This is a hard lifetime cap.
Score falls below Minimum score before removal .
This trims zones that have decayed into irrelevance even if their age is still within bounds.
When a zone is removed, its box is deleted and all associated state is freed to keep performance and visuals clean.
Unified gradient and color logic
Color control lives in Gradient & Color . The indicator uses a single continuous gradient for all zones, above and below price, so you can read strength at a glance without guessing what palette means what.
Base colors
You set:
Mid strength color (green) — used for mid-level strength zones and as the “anchor” in the gradient.
High strength color (red) — used for the strongest zones.
Max opacity — the maximum visual opacity for the solid part of the gradient. Lower values here mean more solid; higher values mean more transparent.
The script then defines three internal points:
Clear end — same as mid color, but with a high alpha (close to transparent).
Mid end — mid color at the strongest allowed opacity.
High end — high color at the strongest allowed opacity.
Strength normalization
Within each update:
The script finds the maximum score among all existing zones.
Each zone’s strength is computed as its score divided by this maximum.
Strength is clamped into .
This means a zone with strength 1.0 is currently the strongest zone on the chart. Other zones are colored relative to that.
Piecewise gradient
Color is assigned in two stages:
For strength between 0.0 and 0.5: interpolate from “clear” green to solid green.
Weak zones are barely visible, mid-strength zones appear as solid green.
For strength between 0.5 and 1.0: interpolate from solid green to solid red.
The strongest zones shift toward the red anchor, clearly separating them from everything else.
Strength scale legend
To make the gradient readable, the indicator draws a vertical legend on the right side of the chart:
About 15 cells from top (Strong) to bottom (Weak).
Each cell uses the same gradient function as the zones themselves.
Top cell is labeled “Strong”; bottom cell is labeled “Weak”.
This legend acts as a fixed reference so you can instantly map a zone’s color to its approximate strength rank.
What it plots
At a glance, the indicator produces:
Upper liquidity zones above price, built from large upper wick events.
Lower liquidity zones below price, built from large lower wick events.
All zones colored by relative strength using the same gradient.
Zones that freeze when price breaks them, then fade out via decay and removal.
A strength scale legend on the right to interpret the gradient.
There are no extra lines, labels, or clutter. The focus is the evolving structure of liquidity zones and their visual strength.
How to read the zones
Bright red / bright green zones
These are your current “major” liquidity areas. They have high scores relative to other zones and have not yet decayed. Expect meaningful reactions, absorption attempts, or spillover moves when price interacts with them.
Faded zones
Pale, nearly transparent zones are either old, decayed, or minor. They can still matter, but priority is lower. If these are in the middle of a long consolidation, they often become background noise.
Broken but still visible zones
Zones whose extension has stopped have been overrun by closing price. They show where a key level gave way. You can use them as context for regime shifts or failed attempts.
Absence of zones
A chart with few or no zones means that, under your current thresholds, there have not been strong enough liquidity events recently. Either tighten the filters or accept that recent price action has been relatively balanced.
Use cases
1) Intraday liquidity hunting
Run the indicator on lower timeframes (e.g., 1–15 minute) with moderately fast decay.
Use the upper zones as potential sell reaction areas, the lower zones as potential buy reaction areas.
Combine with order flow, CVD, or footprint tools to see whether price is absorbing or rejecting at each zone.
2) Swing trading context
Increase ATR length and range/wick multipliers to focus only on major spikes.
Set slower decay and higher max lifetime so zones persist across multiple sessions.
Use these zones as swing inflection areas for larger setups, for example anticipating re-tests after breakouts.
3) Stop placement and invalidation
For longs, place invalidation beyond a decaying lower zone rather than in the middle of noise.
For shorts, place invalidation beyond strong upper zones.
If price closes through a strong zone and it freezes, treat that as additional evidence your prior bias may be wrong.
4) Identifying trapped flows
Upper zones formed after violent spikes up that quickly fail can mark trapped longs.
Lower zones formed after violent spikes down that quickly reverse can mark trapped shorts.
Watching how price behaves on the next touch of those zones can hint at whether those participants are being rescued or squeezed.
Settings overview
Event Detection
Use volume filter — enable or disable the volume spike requirement.
Volume SMA length — rolling window for average volume.
Volume spike multiplier — how aggressive the volume spike filter is.
ATR length — period for ATR, used in all size comparisons.
Min wick size in ATRs — minimum wick size threshold.
Min range in ATRs — minimum bar range threshold.
Zone Geometry
Zone thickness in ATRs — vertical size of each liquidity zone, scaled by ATR.
Decay & Lifetime
Score decay per bar — multiplicative decay factor for each zone score per bar.
Max bars a zone can live — hard cap on lifetime.
Minimum score before removal — score cut-off at which zones are deleted.
Gradient & Color
Mid strength color (green) — base color for mid-level zones and the lower half of the gradient.
High strength color (red) — target color for the strongest zones.
Max opacity — controls the most solid end of the gradient (0 = fully solid, 100 = fully invisible).
Tuning guidance
Fast, session-only liquidity
Shorter ATR length (e.g., 20–50).
Higher wick and range multipliers to focus only on extreme events.
Decay per bar closer to 0.95–0.98 and moderate max lifetime.
Volume filter enabled with a decent multiplier (e.g., 1.5–2.0).
Slow, structural zones
Longer ATR length (e.g., 100+).
Moderate wick and range thresholds.
Decay per bar very close to 1.0 for slow fading.
Higher max lifetime and slightly higher min score threshold so only very weak zones disappear.
Noisy, high-volatility instruments
Increase wick and range ATR multipliers to avoid over-triggering.
Consider enabling the volume filter with stronger settings.
Keep decay moderate to avoid the chart getting overloaded with old zones.
Notes
This is a structural and contextual tool, not a complete trading system. It does not account for transaction costs, execution slippage, or your specific strategy rules. Use it to:
Highlight where liquidity has recently been tested hard.
Rank these areas by decaying strength.
Guide your attention when layering in separate entry signals, risk management, and higher-timeframe context.
Time-Decay Liquidity Zones is designed to keep your chart focused on where the market has most recently “cared” about price, and to gradually forget what no longer matters. Adjust the detection, geometry, decay, and gradient to fit your product and timeframe, and let the zones show you which parts of the tape still have unfinished business.

ATR Channel (Bottom & Top)The ATR Channel (Bottom & Top) indicator dynamically visualizes market volatility zones based on the Average True Range (ATR). It automatically builds adaptive upper and lower boundaries around the current price, helping traders identify potential market extremes, volatility-driven reversals, and dynamic support/resistance levels.
This version is specifically optimized for Bitcoin (BTCUSDT) but works with any asset or timeframe.
⚙️ How It Works
The indicator calculates ATR over a user-defined period (default 200) and applies separate multipliers for the top and bottom bands (default ×1).
The Top Band = Close + (ATR × Multiplier)
The Bottom Band = Close - (ATR × Multiplier)
These two adaptive bands create a volatility envelope, allowing traders to visualize where the price may encounter potential exhaustion or reversal zones.
💡 Signal Logic
LONG Signal (Green Tab):
Triggered when the low of the candle touches or dips below the ATR bottom line — suggesting a possible oversold or volatility-based bottoming area.
The label displays the exact ATR line value (not the close), formatted for better readability (e.g. “LONG\n103 885”).
SELL Signal (Red Tab):
Triggered when the high of the candle touches or exceeds the ATR top line — signaling possible overbought conditions or an exhaustion zone.
Signal Filtering:
The script intelligently avoids duplicate signals — e.g., multiple consecutive LONGs or SELLs will not appear until the opposite signal is triggered.
This ensures cleaner visualization and reduces signal noise during consolidation periods.
🎯 Features
✅ Adaptive ATR-based volatility channel
✅ Automatic LONG/SELL signal labeling with real ATR-touch prices
✅ Customizable parameters:
✅ Intelligent filtering (one signal per phase)
✅ Works on any market and timeframe (crypto, forex, indices, stocks)
🧭 Trading Applications
Identify volatility extremes (ATR-based overbought/oversold zones)
Detect reversal points or exhaustion moves after extended trends
Use with trend filters (e.g. EMA200) to confirm trend continuation vs mean reversion setups
Combine with oscillators (RSI, Stoch) for confluence signals
📊 Summary
The ATR Channel (Bottom & Top) provides a clear, professional-grade visualization of volatility dynamics and price extremes.
It is especially useful for traders using mean-reversion, volatility breakout, or swing-trading strategies — helping them identify statistically significant reaction zones and improving trade timing precision.

MechArt Moving Average and % Above V1.1MechArt Moving Average and % Above V1.1
Unlock the power of custom analysis with this Adjustable Moving Average Indicator! Whether you're a day trader, swing trader, or long-term investor, this tool helps you track price action with precision and flexibility. Tailor your trading strategy to your needs by adjusting the type of moving average, price triggers, and percentage levels.
🔑 Key Features:
Choose Your Moving Average Type 🌀
Select from four popular moving averages:
SMA (Simple Moving Average)
EMA (Exponential Moving Average)
WMA (Weighted Moving Average)
VWMA (Volume Weighted Moving Average)
Find the one that best fits your trading style!
Adjustable Trigger Price
Choose between four price types to trigger signals:
Open
High
Low
Close
Pick the price type that makes the most sense for your strategy!
Percentage Above the Moving Average 📈🔽
Set a custom percentage above the moving average to generate alerts when the price reaches key levels.
Customizable Alerts 🔔
Get notified when the price is above the target price or below the moving average. Perfect for timely trades!
📉 Visual Alerts:
🔴 Red Background: When the selected price is above the target price (percentage above the moving average).
🟩 Green Background: When the selected price is below the moving average.
🚀 How This Indicator Helps You:
Precision 🎯: Visual signals with clear red and green backgrounds help you make quick decisions based on the price's relationship to your moving average.
Flexibility 🔄: Customize the type of moving average and the price used for triggers to fit your trading style.
📊 Perfect For:
Swing Traders 📈: Use the indicator to identify price trends and reversals based on moving averages.
Day Traders ⏳: Set short-term percentage levels to catch immediate price movements.
Long-Term Investors 💼: Track longer-term trends and set alerts when prices deviate significantly from your moving average.
Take control of your trading strategy with this Adjustable Moving Average Indicator and start making more informed decisions today! 🏅
Change from V1.0: Fixed Timeframe setting to match chart.

MechArt Moving Average and % Above V1.0MechArt Moving Average and % Above V1.0
Unlock the power of custom analysis with this Adjustable Moving Average Indicator! Whether you're a day trader, swing trader, or long-term investor, this tool helps you track price action with precision and flexibility. Tailor your trading strategy to your needs by adjusting the type of moving average, price triggers, and percentage levels.
🔑 Key Features:
Choose Your Moving Average Type 🌀
Select from four popular moving averages:
SMA (Simple Moving Average)
EMA (Exponential Moving Average)
WMA (Weighted Moving Average)
VWMA (Volume Weighted Moving Average)
Find the one that best fits your trading style!
Adjustable Trigger Price
Choose between four price types to trigger signals:
Open
High
Low
Close
Pick the price type that makes the most sense for your strategy!
Percentage Above the Moving Average 📈🔽
Set a custom percentage above the moving average to generate alerts when the price reaches key levels.
Customizable Alerts 🔔
Get notified when the price is above the target price or below the moving average. Perfect for timely trades!
📉 Visual Alerts:
🔴 Red Background: When the selected price is above the target price (percentage above the moving average).
🟩 Green Background: When the selected price is below the moving average.
📅 Adjustable Timeframe:
Choose the timeframe that suits you! Whether you're trading on a 1-minute chart, 1-hour, 1-day, or 1-week, this indicator works for all timeframes.
🚀 How This Indicator Helps You:
Precision 🎯: Visual signals with clear red and green backgrounds help you make quick decisions based on the price's relationship to your moving average.
Flexibility 🔄: Customize the type of moving average and the price used for triggers to fit your trading style.
📊 Perfect For:
Swing Traders 📈: Use the indicator to identify price trends and reversals based on moving averages.
Day Traders ⏳: Set short-term percentage levels to catch immediate price movements.
Long-Term Investors 💼: Track longer-term trends and set alerts when prices deviate significantly from your moving average.
Take control of your trading strategy with this Adjustable Moving Average Indicator and start making more informed decisions today! 🏅

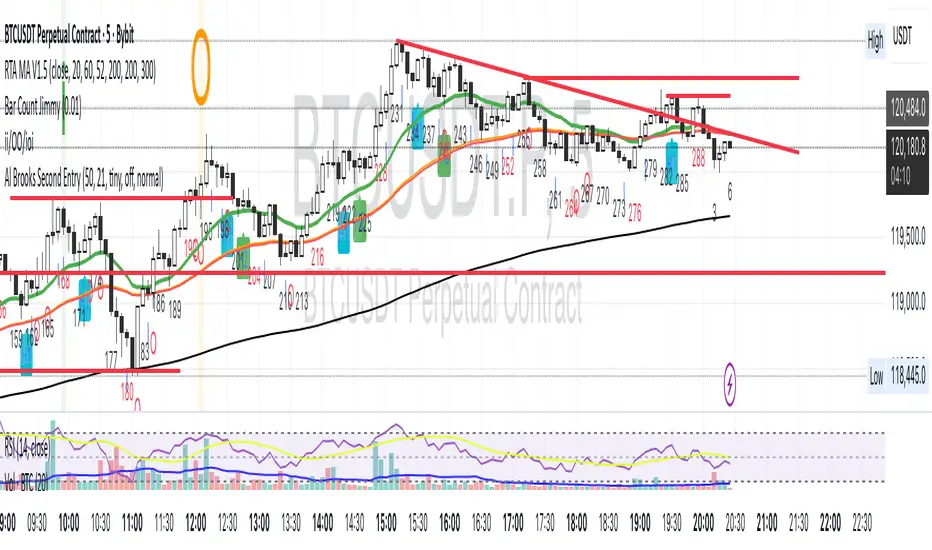
Al Brooks II.IOI.OO# Al Brooks Consecutive Bar Patterns (II/OO/IOI)
## Overview
This indicator automatically identifies Al Brooks' key consecutive bar patterns that signal important market transitions. Enhanced with both **traditional (high/low)** and **body (open/close)** detection methods for more accurate signals.
## Pattern Definitions
### 📊 II Pattern - Double Inside Bars
- **Signal**: Two consecutive inside bars
- **Market Meaning**: Volatility contraction, breakout pending
- **Trading**: Wait for breakout, trade with momentum
### 📊 OO Pattern - Double Outside Bars
- **Signal**: Two consecutive outside bars
- **Market Meaning**: Volatility expansion, trend acceleration or reversal
- **Trading**: Watch for exhaustion at key levels
### 📊 IOI Pattern - Inside-Outside-Inside
- **Signal**: Inside bar → Outside bar → Inside bar sequence
- **Market Meaning**: Market indecision, complex consolidation
- **Trading**: Avoid early entries, wait for clear direction
## Features
✅ **Dual Detection System**
- Traditional: Uses high/low prices (catches wicks)
- Body: Uses open/close prices (focuses on real trading range)
- Combined: Triggers when either condition is met
✅ **Visual Markers**
- Clear labels above/below bars
- Color-coded backgrounds
- Detection source indicators (h=high/low, b=body, +=both)
✅ **Smart Alerts**
- Real-time pattern detection
- Separate alerts for body-only patterns
- Customizable notification settings
## Settings
**Display Options**
- Show/hide each pattern type
- Toggle detection methods
- Customize colors
**Detection Modes**
- High/Low Detection: Traditional wick-based
- Body Detection: Open/Close based
- Show Source: Display what triggered the pattern
## Trading Tips
1. **Best Timeframes**: 1H, 4H, Daily
2. **Combine with**: Volume, trend indicators, support/resistance
3. **Risk Management**:
- II: Tight stops inside pattern
- OO: Wider stops due to volatility
- IOI: Scale in positions
## Label Meanings
- `ii` / `OO` / `ioi` = Base pattern detected
- `+h` suffix = High/Low triggered
- `+b` suffix = Body triggered
- `++` suffix = Both conditions met (strongest signal)
## Author Notes
Based on Al Brooks' price action methodology from his Trading Price Action series. This enhanced version adds body detection to filter out wick-only patterns and reduce false signals.
---
*For educational purposes only. Trading involves risk.*
**Version 2.0** | **Pine Script v6** | **@JimmC98**
Order Block Volumatic FVG StrategyInspired by: Volumatic Fair Value Gaps —
License: CC BY-NC-SA 4.0 (Creative Commons Attribution–NonCommercial–ShareAlike).
This script is a non-commercial derivative work that credits the original author and keeps the same license.
What this strategy does
This turns BigBeluga’s visual FVG concept into an entry/exit strategy. It scans bullish and bearish FVG boxes, measures how deep price has mitigated into a box (as a percentage), and opens a long/short when your mitigation threshold and filters are satisfied. Risk is managed with a fixed Stop Loss % and a Trailing Stop that activates only after a user-defined profit trigger.
Additions vs. the original indicator
✅ Strategy entries based on % mitigation into FVGs (long/short).
✅ Lower-TF volume split using upticks/downticks; fallback if LTF data is missing (distributes prior bar volume by close’s position in its H–L range) to avoid NaN/0.
✅ Per-FVG total volume filter (min/max) so you can skip weak boxes.
✅ Age filter (min bars since the FVG was created) to avoid fresh/immature boxes.
✅ Bull% / Bear% share filter (the 46%/53% numbers you see inside each FVG).
✅ Optional candle confirmation and cooldown between trades.
✅ Risk management: fixed SL % + Trailing Stop with a profit trigger (doesn’t trail until your trigger is reached).
✅ Pine v6 safety: no unsupported args, no indexof/clamp/when, reverse-index deletes, guards against zero/NaN.
How a trade is decided (logic overview)
Detect FVGs (same rules as the original visual logic).
For each FVG currently intersected by the bar, compute:
Mitigation % (how deep price has entered the box).
Bull%/Bear% split (internal volume share).
Total volume (printed on the box) from LTF aggregation or fallback.
Age (bars) since the box was created.
Apply your filters:
Mitigation ≥ Long/Short threshold.
Volume between your min and max (if enabled).
Age ≥ min bars (if enabled).
Bull% / Bear% within your limits (if enabled).
(Optional) the current candle must be in trade direction (confirm).
If multiple FVGs qualify on the same bar, the strategy uses the most recent one.
Enter long/short (no pyramiding).
Exit with:
Fixed Stop Loss %, and
Trailing Stop that only starts after price reaches your profit trigger %.
Input settings (quick guide)
Mitigation source: close or high/low. Use high/low for intrabar touches; close is stricter.
Mitigation % thresholds: minimal mitigation for Long and Short.
TOTAL Volume filter: skip FVGs with too little/too much total volume (per box).
Bull/Bear share filter: require, e.g., Long only if Bull% ≥ 50; avoid Short when Bull% is high (Short Bull% max).
Age filter (bars): e.g., ≥ 20–30 bars to avoid fresh boxes.
Confirm candle: require candle direction to match the trade.
Cooldown (bars): minimum bars between entries.
Risk:
Stop Loss % (fixed from entry price).
Activate trailing at +% profit (the trigger).
Trailing distance % (the trailing gap once active).
Lower-TF aggregation:
Auto: TF/Divisor → picks 1/3/5m automatically.
Fixed: choose 1/3/5/15m explicitly.
If LTF can’t be fetched, fallback allocates prior bar’s volume by its close position in the bar’s H–L.
Suggested starting presets (you should optimize per market)
Mitigation: 60–80% for both Long/Short.
Bull/Bear share:
Long: Bull% ≥ 50–70, Bear% ≤ 100.
Short: Bull% ≤ 60 (avoid shorting into strong support), Bear% ≥ 0–70 as you prefer.
Age: ≥ 20–30 bars.
Volume: pick a min that filters noise for your symbol/timeframe.
Risk: SL 4–6%, trailing trigger 1–2%, distance 1–2% (crypto example).
Set slippage/fees in Strategy Properties.
Notes, limitations & best practices
Data differences: The LTF split uses request.security_lower_tf. If the exchange/data feed has sparse LTF data, the fallback kicks in (it’s deliberate to avoid NaNs but is a heuristic).
Real-time vs backtest: The current bar can update until close; results on historical bars use closed data. Use “Bar Replay” to understand intrabar effects.
No pyramiding: Only one position at a time. Modify pyramiding in the header if you need scaling.
Assets: For spot/crypto, TradingView “volume” is exchange volume; in some markets it may be tick volume—interpret filters accordingly.
Risk disclosure: Past performance ≠ future results. Use appropriate position sizing and risk controls; this is not financial advice.
Credits
Visual FVG concept and original implementation: BigBeluga.
This derivative strategy adds entry/exit logic, volume/age/share filters, robust LTF handling, and risk management while preserving the original spirit.
License remains CC BY-NC-SA 4.0 (non-commercial, attribution required, share-alike).

Uptrick: Volatility Weighted CloudIntroduction
The Volatility Weighted Cloud (VWC) is a trend-tracking overlay that combines adaptive volatility-based bands with a multi-source smoothed price cloud to visualize market bias. It provides users with a dynamic structure that adapts to volatility conditions while maintaining a persistent visual record of trend direction. By incorporating configurable smoothing techniques, percentile-ranked volatility, and multi-line cloud construction, the indicator allows traders to interpret price context more effectively without relying on raw price movement alone.
Overview
The script builds a smoothed price basis using the open, and close prices independently, and uses these to construct a layered visual cloud. This cloud serves both as a reference for price structure and a potential area of dynamic support and resistance. Alongside this cloud, adaptive upper and lower bands are plotted using volatility that scales with percentile rank. When price closes above or below these bands, the script interprets that as a breakout and updates the trend bias accordingly.
Candle coloring is persistent and reflects the most recent confirmed signal. Labels can optionally be placed on the chart when the trend bias flips, giving traders additional visual reference points. The indicator is designed to be both flexible and visually compact, supporting different strategies and timeframes through its detailed configuration options.
Originality
This script introduces originality through its combined use of percentile-ranked volatility, adaptive envelope sizing, and multi-source cloud construction. Unlike static-band indicators, the Volatility Weighted Cloud adjusts its band width based on where current volatility ranks within a defined lookback range. This dynamic scaling allows for smoother signal behavior during low-volatility environments and more responsive behavior during high-volatility phases.
Additionally, instead of using a single basis line, the indicator computes two separate smoothed lines for open and close. These are rendered into a shaded visual cloud that reflects price structure more completely than traditional moving average overlays. The use of ALMA and MAD, both less commonly applied in volatility-band overlays, adds further control over smoothing behavior and volatility measurement, enhancing its adaptability across different market types.
Inputs
Group: Core
Basis Length (short-term): The number of bars used for calculating the primary basis line. Affects how quickly the basis responds to price changes.
Basis Type: Option to choose between EMA and ALMA. EMA provides a standard exponential average; ALMA offers a centered, Gaussian-weighted average with reduced lag.
ALMA Offset: Determines the balance point of the ALMA window. Only applies when ALMA is selected.
Sigma: Sets the width of the ALMA smoothing window, influencing how much smoothing is applied.
Basis Smoothing EMA: Adds additional EMA-based smoothing to the computed basis line for noise reduction.
Group: Volatility & Bands
Volatility: Choose between StDev (standard deviation) and MAD (median absolute deviation) for measuring price volatility.
Vol Length (short-term): Length of the window used for calculating volatility.
Vol Smoothing EMA: Smooths the raw volatility value to stabilize band behavior.
Min Multiplier: Minimum multiplier applied to volatility when forming the adaptive bands.
Max Multiplier: Maximum multiplier applied at high volatility percentile.
Volatility Rank Lookback: Number of bars used to calculate the percentile rank of current volatility.
Show Adaptive Bands: Enables or disables the display of upper and lower volatility bands on the chart.
Group: Trend Switch Labels
Show Trend Switch Labels: Toggles the appearance of labels when the trend direction changes.
Label Anchor: Defines whether the labels are anchored to recent highs/lows or to the main basis line.
ATR Length (offset): Length used for calculating ATR, which determines label offset distance.
ATR Offset (multiplier): Multiplies the ATR value to place labels away from price bars for better visibility.
Label Size: Allows selection of label size (tiny to huge) to suit different chart setups.
Features
Adaptive Volatility Bands: The indicator calculates volatility using either standard deviation or MAD. It then applies an EMA smoothing layer and scales the band width dynamically based on the percentile rank of volatility over a user-defined lookback window. This avoids fixed-width bands and allows the indicator to adapt to changing volatility regimes in real time.
Volatility Method Options: Users can switch between two volatility measurement methods:
➤ Standard Deviation (StDev): Captures overall price dispersion, but may be sensitive to spikes.
➤ Median Absolute Deviation (MAD): A more robust measure that reduces the effect of outliers, making the bands less jumpy during erratic price behavior.
Basis Type Options: The core price basis used for cloud and bands can be built from:
➤ Exponential Moving Average (EMA): Fast-reacting and widely used in trend systems.
➤ Arnaud Legoux Moving Average (ALMA): A smoother, more centered alternative that offers greater control through offset and sigma parameters.
Multi-Line Basis Cloud: The cloud is formed by plotting two individually smoothed basis lines from open and close prices. A filled area is created between the open and close basis lines. This cloud serves as a dynamic support or resistance zone, allowing users to identify possible reversal areas. Price moving through or rejecting from the cloud can be interpreted contextually, especially when combined with band-based signals.
Persistent Trend Bias Coloring: The indicator uses the last confirmed breakout (above upper band or below lower band) to determine bias. This bias is reflected in the color of every subsequent candle, offering a persistent visual cue until a new signal is triggered. It helps simplify trend recognition, especially in choppy or sideways markets.
Trend Switch Labels: When enabled, the script places labeled markers at the exact bar where the bias direction switches. Labels are anchored either to recent highs/lows or to the main basis line, and spaced vertically using an ATR-based offset. This allows the trader to quickly locate historical trend transitions.
Alert Conditions: Two built-in alert conditions are available:
➤ Long Signal: Triggered when the close crosses above the upper adaptive band.
➤ Short Signal: Triggered when the close crosses below the lower adaptive band.
These conditions can be used for custom alerts, automation, or external signaling tools.
Display Control and Flexibility: Users can disable the adaptive bands for a cleaner layout while keeping the basis cloud and candle coloring active. The indicator can be tuned for fast or slow response depending on the strategy in use, and is suitable for intraday, swing, or position trading.
Summary
The Volatility Weighted Cloud is a configurable trend-following overlay that uses adaptive volatility bands and a structured cloud system to help visualize market bias. By combining EMA or ALMA smoothing with percentile-ranked volatility and a four-line price structure, it provides a flexible and informative charting layer. Its key strengths lie in the use of dynamic envelopes, visually persistent trend indication, and clearly defined breakout zones that adapt to current volatility conditions.
Disclaimer
This indicator is for informational and educational purposes only. Trading involves risk and may not be suitable for all investors. Past performance does not guarantee future results.

Multi-Band Trend LineThis Pine Script creates a versatile technical indicator called "Multi-Band Trend Line" that builds upon the concept of the popular "Follow Line Indicator" by Dreadblitz. While the original Follow Line Indicator uses simple trend detection to place a line at High or Low levels, this enhanced version combines multiple band-based trading strategies with dynamic trend line generation. The indicator supports five different band types and provides more sophisticated buy/sell signals based on price breakouts from various technical analysis bands.
Key Features
Multi-Band Support
The indicator supports five different band types:
- Bollinger Bands: Uses standard deviation to create bands around a moving average
- Keltner Channels: Uses ATR (Average True Range) to create bands around a moving average
- Donchian Channels: Uses the highest high and lowest low over a specified period
- Moving Average Envelopes: Creates bands as a percentage above and below a moving average
- ATR Bands: Uses ATR multiplier to create bands around a moving average
Dynamic Trend Line Generation (Enhanced Follow Line Concept)
- Similar to the Follow Line Indicator, the trend line is placed at High or Low levels based on trend direction
- Key Enhancement: Instead of simple trend detection, this version uses band breakouts to trigger trend changes
- When price breaks above the upper band (bullish signal), the trend line is set to the low (optionally adjusted with ATR) - similar to Follow Line's low placement
- When price breaks below the lower band (bearish signal), the trend line is set to the high (optionally adjusted with ATR) - similar to Follow Line's high placement
- The trend line acts as dynamic support/resistance, following the price action more precisely than the original Follow Line
ATR Filter (Follow Line Enhancement)
- Like the original Follow Line Indicator, an ATR filter can be selected to place the line at a more distance level than the normal mode settled at candles Highs/Lows
- When enabled, it adds/subtracts ATR value to provide more conservative trend line placement
- Helps reduce false signals in volatile markets
- This feature maintains the core philosophy of the Follow Line while adding more precision through band-based triggers
Signal Generation
- Buy Signal: Generated when trend changes from bearish to bullish (trend line starts rising)
- Sell Signal: Generated when trend changes from bullish to bearish (trend line starts falling)
- Signals are displayed as labels on the chart
Visual Elements
- Upper and lower bands are plotted in gray
- Trend line changes color based on direction (green for bullish, red for bearish)
- Background color changes based on trend direction
- Buy/sell signals are marked with labeled shapes
How It Works
Band Calculation: Based on the selected band type, upper and lower boundaries are calculated
Signal Detection: When price closes above the upper band or below the lower band, a breakout signal is generated
Trend Line Update: The trend line is updated based on the breakout direction and previous trend line value
Trend Direction: Determined by comparing current trend line with the previous value
Alert Generation: Buy/sell conditions trigger alerts and visual signals
Use Cases
Enhanced trend following strategies: More precise than basic Follow Line due to band-based triggers
Breakout trading: Multiple band types provide various breakout opportunities
Dynamic support/resistance identification: Combines Follow Line concept with band analysis
Multi-timeframe analysis with different band types: Choose the most suitable band for your timeframe
Reduced false signals: Band confirmation provides better entry/exit points compared to simple trend following

The Barking Rat LiteMomentum & FVG Reversion Strategy
The Barking Rat Lite is a disciplined, short-term mean-reversion strategy that combines RSI momentum filtering, EMA bands, and Fair Value Gap (FVG) detection to identify short-term reversal points. Designed for practical use on volatile markets, it focuses on precise entries and ATR-based take profit management to balance opportunity and risk.
Core Concept
This strategy seeks potential reversals when short-term price action shows exhaustion outside an EMA band, confirmed by momentum and FVG signals:
EMA Bands:
Parameters used: A 20-period EMA (fast) and 100-period EMA (slow).
Why chosen:
- The 20 EMA is sensitive to short-term moves and reflects immediate momentum.
- The 100 EMA provides a slower, structural anchor.
When price trades outside both bands, it often signals overextension relative to both short-term and medium-term trends.
Application in strategy:
- Long entries are only considered when price dips below both EMAs, identifying potential undervaluation.
- Short entries are only considered when price rises above both EMAs, identifying potential overvaluation.
This dual-band filter avoids counter-trend signals that would occur if only a single EMA was used, making entries more selective..
Fair Value Gap Detection (FVG):
Parameters used: The script checks for dislocations using a 12-bar lookback (i.e. comparing current highs/lows with values 12 candles back).
Why chosen:
- A 12-bar displacement highlights significant inefficiencies in price structure while filtering out micro-gaps that appear every few bars in high-volatility markets.
- By aligning FVG signals with candle direction (bullish = close > open, bearish = close < open), the strategy avoids random gaps and instead targets ones that suggest exhaustion.
Application in strategy:
- Bullish FVGs form when earlier lows sit above current highs, hinting at downward over-extension.
- Bearish FVGs form when earlier highs sit below current lows, hinting at upward over-extension.
This gives the strategy a structural filter beyond simple oscillators, ensuring signals have price-dislocation context.
RSI Momentum Filter:
Parameters used: 14-period RSI with thresholds of 80 (overbought) and 20 (oversold).
Why chosen:
- RSI(14) is a widely recognized momentum measure that balances responsiveness with stability.
- The thresholds are intentionally extreme (80/20 vs. the more common 70/30), so the strategy only engages at genuine exhaustion points rather than frequent minor corrections.
Application in strategy:
- Longs trigger when RSI < 20, suggesting oversold exhaustion.
- Shorts trigger when RSI > 80, suggesting overbought exhaustion.
This ensures entries are not just technically valid but also backed by momentum extremes, raising conviction.
ATR-Based Take Profit:
Parameters used: 14-period ATR, with a default multiplier of 4.
Why chosen:
- ATR(14) reflects the prevailing volatility environment without reacting too much to outliers.
- A multiplier of 4 is a pragmatic compromise: wide enough to let trades breathe in volatile conditions, but tight enough to enforce disciplined exits before mean reversion fades.
Application in strategy:
- At entry, a fixed target is set = Entry Price ± (ATR × 4).
- This target scales automatically with volatility: narrower in calm periods, wider in explosive markets.
By avoiding discretionary exits, the system maintains rule-based discipline.
Visual Signals on Chart
Blue “▲” below candle: Potential long entry
Orange/Yellow “▼” above candle: Potential short entry
Green “✔️”: Trade closed at ATR take profit
Blue (20 EMA) & Orange (100 EMA) lines: Dynamic channel reference
⚙️Strategy report properties
Position size: 25% equity per trade
Initial capital: 10,000.00 USDT
Pyramiding: 10 entries per direction
Slippage: 2 ticks
Commission: 0.055% per side
Backtest timeframe: 1-minute
Backtest instrument: HYPEUSDT
Backtesting range: Jul 28, 2025 — Aug 17, 2025
Note on Sample Size:
You’ll notice the report displays fewer than the ideal 100 trades in the strategy report above. This is intentional. The goal of the script is to isolate high-quality, short-term reversal opportunities while filtering out low-conviction setups. This means that the Barking Rat Lite strategy is very selective, filtering out over 90% of market noise. The brief timeframe shown in the strategy report here illustrates its filtering logic over a short window — not its full capabilities. As a result, even on lower timeframes like the 1-minute chart, signals are deliberately sparse — each one must pass all criteria before triggering.
For a larger dataset:
Once the strategy is applied to your chart, users are encouraged to expand the lookback range or apply the strategy to other volatile pairs to view a full sample.
💡Why 25% Equity Per Trade?
While it's always best to size positions based on personal risk tolerance, we defaulted to 25% equity per trade in the backtesting data — and here’s why:
Backtests using this sizing show manageable drawdowns even under volatile periods.
The strategy generates a sizeable number of trades, reducing reliance on a single outcome.
Combined with conservative filters, the 25% setting offers a balance between aggression and control.
Users are strongly encouraged to customize this to suit their risk profile.
What makes Barking Rat Lite valuable
Combines multiple layers of confirmation: EMA bands + FVG + RSI
Adaptive to volatility: ATR-based exits scale with market conditions
Clear, actionable visuals: Easy to monitor and manage trades

Trishul Tap Signals (v6) — Liquidity Sweep + Imbalanced RetestTrishul Tap Signals — Liquidity Sweep + Imbalanced Retest
Type: Signal-only indicator (non-repainting)
Style: Price-action + Liquidity + Trend-following
Best for: Intraday & Swing Trading — any liquid market (stocks, futures, crypto, FX)
Timeframes: Any (5m–1D recommended)
Concept
The Trishul Tap setup is a liquidity-driven retest play inspired by order-flow and Smart Money Concepts.
It identifies one-sided impulse candles that also sweep liquidity (grab stops above/below a recent swing), then waits for price to retest the origin of that candle to enter in the trend direction.
Think of it as the three points of a trident:
Trend filter — Only signals with the prevailing trend.
Liquidity sweep — Candle takes out a recent swing high/low (stop-hunt).
Imbalanced retest — Price taps the candle’s open/low (bull) or open/high (bear).
Bullish Setup
Trend Filter: Price above EMA(200).
Impulse Candle:
Green close.
Upper wick ≥ (wickRatio × lower wick).
Lower wick ≤ (oppWickMaxFrac × full range).
Liquidity Sweep: Candle’s high exceeds the highest high of the last sweepLookback bars (excluding current).
Tap Entry: Buy signal triggers when price later taps the candle’s low or open (user choice) within expireBars.
Bearish Setup
Trend Filter: Price below EMA(200).
Impulse Candle:
Red close.
Lower wick ≥ (wickRatio × upper wick).
Upper wick ≤ (oppWickMaxFrac × full range).
Liquidity Sweep: Candle’s low breaks the lowest low of the last sweepLookback bars (excluding current).
Tap Entry: Sell signal triggers when price later taps the candle’s high or open (user choice) within expireBars.
Inputs
Trend EMA Length: Default 200.
Sweep Lookback: Number of bars for liquidity sweep check (default 20).
Wick Ratio: Required size ratio of dominant wick to opposite wick (default 2.0).
Opposite Wick Max %: Opposite wick must be ≤ this fraction of the candle’s range (default 25%).
Tap Tolerance (ticks): How close price must come to the level to count as a tap.
Expire Bars: Max bars after setup to allow a valid tap.
One Signal per Level: If ON, a base is “consumed” after first signal.
Plot Tap Levels: Show horizontal lines for active bases.
Show Setup Labels: Mark the origin sweep candle.
Plots & Visuals
EMA Trend Line — trend filter reference.
Tap Levels —
Green = bullish base (origin candle’s low/open).
Red = bearish base (origin candle’s high/open).
Labels — Show where the setup candle formed.
Signals —
BUY: triangle-up below bar at bullish tap.
SELL: triangle-down above bar at bearish tap.
Alerts
Two built-in conditions:
BUY Signal (Trishul Tap) — triggers on bullish tap.
SELL Signal (Trishul Tap) — triggers on bearish tap.
Set via Alerts panel → Condition = this indicator → Choose signal type.
How to Trade It
Use in liquid markets with clean price structure.
Confirm with HTF structure, volume spikes, or other confluence if desired.
Place stop just beyond the tap level (or ATR-based).
Target 1–2R or trail behind structure.
Why It Works
Liquidity sweep traps traders entering late (breakout buyers or panic sellers) and forces them to exit in the opposite direction, fueling your entry.
Wick imbalance confirms directional aggression by one side.
Trend filter keeps you aligned with the market’s dominant flow.
Retest entry lets you enter at a better price with reduced risk.
Non-Repainting
Setups form only on confirmed bar closes.
Signals trigger only on later bars that tap the stored level.
No lookahead functions are used.
Disclaimer
This script is for educational purposes only and does not constitute financial advice. Test thoroughly in a simulator or demo before using in live markets. Trading involves risk.

RSI Z-score | Lemniscuss🧠 Introducing RSI Z-Score (RSI-Z) by Lemniscuss
🛠️ Overview
RSI Z-Score (RSI-Z) is a momentum-based market condition detector that transforms the classic Relative Strength Index (RSI) into a standardized volatility framework.
By applying Z-Score normalization to the RSI, this tool allows traders to identify statistically significant deviations in momentum — cutting through noise and highlighting high-probability turning points.
RSI-Z is optimized for trend inflection detection and overextension spotting, providing both visual clarity and actionable trade signals with dynamic labeling and optional bar coloring.
🔍 How It Works
1️⃣ RSI Foundation
The system starts with a standard RSI calculation on a user-defined source and length (default: 45).
2️⃣ Z-Score Normalization
The RSI values are standardized by subtracting their mean and dividing by the standard deviation over the same lookback.
This converts RSI into a statistical measure — revealing how many standard deviations current momentum is from its mean.
3️⃣ Threshold Logic
Two customizable thresholds define actionable zones:
• Long Threshold → Signals bullish momentum shifts when crossed upward
• Short Threshold → Signals bearish momentum shifts when crossed downward
4️⃣ Signal State Tracking
A state variable locks in a bias (Long / Short / Neutral) until an opposing trigger appears, ensuring clear and consistent market bias mapping.
✨ Key Features
🔹 Statistically Driven Momentum Detection — Moves beyond fixed RSI overbought/oversold levels by using standard deviations for adaptive accuracy.
🔹 Customizable Thresholds — Fine-tune long/short triggers for different volatility environments.
🔹 Clear Visual Feedback — Candle coloring and signal labels make trade setups instantly recognizable.
🔹 Overlay-Friendly — Works directly on your main chart or in a separate pane.
⚙️ Custom Settings
• Source: Price stream for RSI calculation (default: close)
• RSI Length: Lookback period for RSI & Z-Score (default: 45)
• Long Threshold: Z-score value for bullish signal (default: 1)
• Short Threshold: Z-score value for bearish signal (default: -1.9)
• Long/Cash Signal Labels: Toggle for "Long"/"Short" markers
• Bar Coloring: Toggle for trend-based candle coloring
📌 Trading Applications
✅ Trend Reversals → Spot statistically significant shifts in momentum before traditional RSI signals trigger
✅ Overextension Monitoring → Identify when momentum has deviated too far from the mean
✅ Mean Reversion Setups → Use extreme Z-score values as potential reversion points
✅ Bias Confirmation → Combine with trend tools for higher conviction entries/exits
📌 Conclusion
RSI-Z by Lemniscuss offers a clean, statistics-backed upgrade to the classic RSI.
By framing momentum in standard deviation terms, it empowers traders to separate normal fluctuations from truly significant market moves — making it a valuable tool for both trend traders and mean reversion specialists.
🔹 Summary Highlights
1️⃣ Statistical upgrade to RSI for higher-quality signals
2️⃣ Threshold-based, customizable long/short triggers
3️⃣ Visual candle coloring & signal labels for clarity
4️⃣ Adaptable to trend, swing, or intraday strategies
📌 Disclaimer: Past performance is not indicative of future results. No indicator guarantees profitability — always test and manage risk appropriately.

light_logLight Log - A Defensive Programming Library for Pine Script
Overview
The Light Log library transforms Pine Script development by introducing structured logging and defensive programming patterns typically found in enterprise languages like C#. This library addresses a fundamental challenge in Pine Script: the lack of sophisticated error handling and debugging tools that developers expect when building complex trading systems.
At its core, Light Log provides three transformative capabilities that work together to create more reliable and maintainable code. First, it wraps all native Pine Script types in error-aware containers, allowing values to carry validation state alongside their data. Second, it offers a comprehensive logging system with severity levels and conditional rendering. Third, it includes defensive programming utilities that catch errors early and make code self-documenting.
The Philosophy of Errors as Values
Traditional Pine Script error handling relies on runtime errors that halt execution, making it difficult to build resilient systems that can gracefully handle edge cases. Light Log introduces a paradigm shift by treating errors as first-class values that flow through your program alongside regular data.
When you wrap a value using Light Log's type system, you're not just storing data – you're creating a container that can carry both the value and its validation state. For example, when you call myNumber.INT() , you receive an INT object that contains both the integer value and a Log object that can describe any issues with that value. This approach, inspired by functional programming languages, allows errors to propagate through calculations without causing immediate failures.
Consider how this changes error handling in practice. Instead of a calculation failing catastrophically when it encounters invalid input, it can produce a result object that contains both the computed value (which might be na) and a detailed log explaining what went wrong. Subsequent operations can check has_error() to decide whether to proceed or handle the error condition gracefully.
The Typed Wrapper System
Light Log provides typed wrappers for every native Pine Script type: INT, FLOAT, BOOL, STRING, COLOR, LINE, LABEL, BOX, TABLE, CHART_POINT, POLYLINE, and LINEFILL. These wrappers serve multiple purposes beyond simple value storage.
Each wrapper type contains two fields: the value field v holds the actual data, while the error field e contains a Log object that tracks the value's validation state. This dual nature enables powerful programming patterns. You can perform operations on wrapped values and accumulate error information along the way, creating an audit trail of how values were processed.
The wrapper system includes convenient methods for converting between wrapped and unwrapped values. The extension methods like INT() , FLOAT() , etc., make it easy to wrap existing values, while the from_INT() , from_FLOAT() methods extract the underlying values when needed. The has_error() method provides a consistent interface for checking whether any wrapped value has encountered issues during processing.
The Log Object: Your Debugging Companion
The Log object represents the heart of Light Log's debugging capabilities. Unlike simple string concatenation for error messages, the Log object provides a structured approach to building, modifying, and rendering diagnostic information.
Each Log object carries three essential pieces of information: an error type (info, warning, error, or runtime_error), a message string that can be built incrementally, and an active flag that controls conditional rendering. This structure enables sophisticated logging patterns where you can build up detailed diagnostic information throughout your script's execution and decide later whether and how to display it.
The Log object's methods support fluent chaining, allowing you to build complex messages in a readable way. The write() and write_line() methods append text to the log, while new_line() adds formatting. The clear() method resets the log for reuse, and the rendering methods ( render_now() , render_condition() , and the general render() ) control when and how messages appear.
Defensive Programming Made Easy
Light Log's argument validation functions transform how you write defensive code. Instead of cluttering your functions with verbose validation logic, you can use concise, self-documenting calls that make your intentions clear.
The argument_error() function provides strict validation that halts execution when conditions aren't met – perfect for catching programming errors early. For less critical issues, argument_log_warning() and argument_log_error() record problems without stopping execution, while argument_log_info() provides debug visibility into your function's behavior.
These functions follow a consistent pattern: they take a condition to check, the function name, the argument name, and a descriptive message. This consistency makes error messages predictable and helpful, automatically formatting them to show exactly where problems occurred.
Building Modular, Reusable Code
Light Log encourages a modular approach to Pine Script development by providing tools that make functions more self-contained and reliable. When functions validate their inputs and return wrapped values with error information, they become true black boxes that can be safely composed into larger systems.
The void_return() function addresses Pine Script's requirement that all code paths return a value, even in error handling branches. This utility function provides a clean way to satisfy the compiler while making it clear that a particular code path should never execute.
The static log pattern, initialized with init_static_log() , enables module-wide error tracking. You can create a persistent Log object that accumulates information across multiple function calls, building a comprehensive diagnostic report that helps you understand complex behaviors in your indicators and strategies.
Real-World Applications
In practice, Light Log shines when building sophisticated trading systems. Imagine developing a complex indicator that processes multiple data streams, performs statistical calculations, and generates trading signals. With Light Log, each processing stage can validate its inputs, perform calculations, and pass along both results and diagnostic information.
For example, a moving average calculation might check that the period is positive, that sufficient data exists, and that the input series contains valid values. Instead of failing silently or throwing runtime errors, it can return a FLOAT object that contains either the calculated average or a detailed explanation of why the calculation couldn't be performed.
Strategy developers benefit even more from Light Log's capabilities. Complex entry and exit logic often involves multiple conditions that must all be satisfied. With Light Log, each condition check can contribute to a comprehensive log that explains exactly why a trade was or wasn't taken, making strategy debugging and optimization much more straightforward.
Performance Considerations
While Light Log adds a layer of abstraction over raw Pine Script values, its design minimizes performance impact. The wrapper objects are lightweight, containing only two fields. The logging operations only consume resources when actually rendered, and the conditional rendering system ensures that production code can run with logging disabled for maximum performance.
The library follows Pine Script best practices for performance, using appropriate data structures and avoiding unnecessary operations. The var keyword in init_static_log() ensures that persistent logs don't create new objects on every bar, maintaining efficiency even in real-time calculations.
Getting Started
Adopting Light Log in your Pine Script projects is straightforward. Import the library, wrap your critical values, add validation to your functions, and use Log objects to track important events. Start small by adding logging to a single function, then expand as you see the benefits of better error visibility and code organization.
Remember that Light Log is designed to grow with your needs. You can use as much or as little of its functionality as makes sense for your project. Even simple uses, like adding argument validation to key functions, can significantly improve code reliability and debugging ease.
Transform your Pine Script development experience with Light Log – because professional trading systems deserve professional development tools.
Light Log Technical Deep Dive: Advanced Patterns and Architecture
Understanding Errors as Values
The concept of "errors as values" represents a fundamental shift in how we think about error handling in Pine Script. In traditional Pine Script development, errors are events – they happen at a specific moment in time and immediately interrupt program flow. Light Log transforms errors into data – they become information that flows through your program just like any other value.
This transformation has profound implications. When errors are values, they can be stored, passed between functions, accumulated, transformed, and inspected. They become part of your program's data flow rather than exceptions to it. This approach, popularized by languages like Rust with its Result type and Haskell with its Either monad, brings functional programming's elegance to Pine Script.
Consider a practical example. Traditional Pine Script might calculate a momentum indicator like this:
momentum = close - close
If period is invalid or if there isn't enough historical data, this calculation might produce na or cause subtle bugs. With Light Log's approach:
calculate_momentum(src, period)=>
result = src.FLOAT()
if period <= 0
result.e.write("Invalid period: must be positive", true, ErrorType.error)
result.v := na
else if bar_index < period
result.e.write("Insufficient data: need " + str.tostring(period) + " bars", true, ErrorType.warning)
result.v := na
else
result.v := src - src
result.e.write("Momentum calculated successfully", false, ErrorType.info)
result
Now the function returns not just a value but a complete computational result that includes diagnostic information. Calling code can make intelligent decisions based on both the value and its associated metadata.
The Monad Pattern in Pine Script
While Pine Script lacks the type system features to implement true monads, Light Log brings monadic thinking to Pine Script development. The wrapped types (INT, FLOAT, etc.) act as computational contexts that carry both values and metadata through a series of transformations.
The key insight of monadic programming is that you can chain operations while automatically propagating context. In Light Log, this context is the error state. When you have a FLOAT that contains an error, operations on that FLOAT can check the error state and decide whether to proceed or propagate the error.
This pattern enables what functional programmers call "railway-oriented programming" – your code follows a success track when all is well but can switch to an error track when problems occur. Both tracks lead to the same destination (a result with error information), but they take different paths based on the validity of intermediate values.
Composable Error Handling
Light Log's design encourages composition – building complex functionality from simpler, well-tested components. Each component can validate its inputs, perform its calculation, and return a result with appropriate error information. Higher-level functions can then combine these results intelligently.
Consider building a complex trading signal from multiple indicators:
generate_signal(src, fast_period, slow_period, signal_period) =>
log = init_static_log(ErrorType.info)
// Calculate components with error tracking
fast_ma = calculate_ma(src, fast_period)
slow_ma = calculate_ma(src, slow_period)
// Check for errors in components
if fast_ma.has_error()
log.write_line("Fast MA error: " + fast_ma.e.message, true)
if slow_ma.has_error()
log.write_line("Slow MA error: " + slow_ma.e.message, true)
// Proceed with calculation if no errors
signal = 0.0.FLOAT()
if not (fast_ma.has_error() or slow_ma.has_error())
macd_line = fast_ma.v - slow_ma.v
signal_line = calculate_ma(macd_line, signal_period)
if signal_line.has_error()
log.write_line("Signal line error: " + signal_line.e.message, true)
signal.e := log
else
signal.v := macd_line - signal_line.v
log.write("Signal generated successfully")
else
signal.e := log
signal.v := na
signal
This composable approach makes complex calculations more reliable and easier to debug. Each component is responsible for its own validation and error reporting, and the composite function orchestrates these components while maintaining comprehensive error tracking.
The Static Log Pattern
The init_static_log() function introduces a powerful pattern for maintaining state across function calls. In Pine Script, the var keyword creates variables that persist across bars but are initialized only once. Light Log leverages this to create logging objects that can accumulate information throughout a script's execution.
This pattern is particularly valuable for debugging complex strategies where you need to understand behavior across multiple bars. You can create module-level logs that track important events:
// Module-level diagnostic log
diagnostics = init_static_log(ErrorType.info)
// Track strategy decisions across bars
check_entry_conditions() =>
diagnostics.clear() // Start fresh each bar
diagnostics.write_line("Bar " + str.tostring(bar_index) + " analysis:")
if close > sma(close, 20)
diagnostics.write_line("Price above SMA20", false)
else
diagnostics.write_line("Price below SMA20 - no entry", true, ErrorType.warning)
if volume > sma(volume, 20) * 1.5
diagnostics.write_line("Volume surge detected", false)
else
diagnostics.write_line("Normal volume", false)
// Render diagnostics based on verbosity setting
if debug_mode
diagnostics.render_now()
Advanced Validation Patterns
Light Log's argument validation functions enable sophisticated precondition checking that goes beyond simple null checks. You can implement complex validation logic while keeping your code readable:
validate_price_data(open_val, high_val, low_val, close_val) =>
argument_error(na(open_val) or na(high_val) or na(low_val) or na(close_val),
"validate_price_data", "OHLC values", "contain na values")
argument_error(high_val < low_val,
"validate_price_data", "high/low", "high is less than low")
argument_error(close_val > high_val or close_val < low_val,
"validate_price_data", "close", "is outside high/low range")
argument_log_warning(high_val == low_val,
"validate_price_data", "high/low", "are equal (no range)")
This validation function documents its requirements clearly and fails fast with helpful error messages when assumptions are violated. The mix of errors (which halt execution) and warnings (which allow continuation) provides fine-grained control over how strict your validation should be.
Performance Optimization Strategies
While Light Log adds abstraction, careful design minimizes overhead. Understanding Pine Script's execution model helps you use Light Log efficiently.
Pine Script executes once per bar, so operations that seem expensive in traditional programming might have negligible impact. However, when building real-time systems, every optimization matters. Light Log provides several patterns for efficient use:
Lazy Evaluation: Log messages are only built when they'll be rendered. Use conditional logging to avoid string concatenation in production:
if debug_mode
log.write_line("Calculated value: " + str.tostring(complex_calculation))
Selective Wrapping: Not every value needs error tracking. Wrap values at API boundaries and critical calculation points, but use raw values for simple operations:
// Wrap at boundaries
input_price = close.FLOAT()
validated_period = validate_period(input_period).INT()
// Use raw values internally
sum = 0.0
for i = 0 to validated_period.v - 1
sum += close
Error Propagation: When errors occur early, avoid expensive calculations:
process_data(input) =>
validated = validate_input(input)
if validated.has_error()
validated // Return early with error
else
// Expensive processing only if valid
perform_complex_calculation(validated)
Integration Patterns
Light Log integrates smoothly with existing Pine Script code. You can adopt it incrementally, starting with critical functions and expanding coverage as needed.
Boundary Validation: Add Light Log at the boundaries of your system – where user input enters and where final outputs are produced. This catches most errors while minimizing changes to existing code.
Progressive Enhancement: Start by adding argument validation to existing functions. Then wrap return values. Finally, add comprehensive logging. Each step improves reliability without requiring a complete rewrite.
Testing and Debugging: Use Light Log's conditional rendering to create debug modes for your scripts. Production users see clean output while developers get detailed diagnostics:
// User input for debug mode
debug = input.bool(false, "Enable debug logging")
// Conditional diagnostic output
if debug
diagnostics.render_now()
else
diagnostics.render_condition() // Only shows errors/warnings
Future-Proofing Your Code
Light Log's patterns prepare your code for Pine Script's evolution. As Pine Script adds more sophisticated features, code that uses structured error handling and defensive programming will adapt more easily than code that relies on implicit assumptions.
The type wrapper system, in particular, positions your code to take advantage of potential future features or more sophisticated type inference. By thinking in terms of wrapped values and error propagation today, you're building code that will remain maintainable and extensible tomorrow.
Light Log doesn't just make your Pine Script better today – it prepares it for the trading systems you'll need to build tomorrow.
Library "light_log"
A lightweight logging and defensive programming library for Pine Script.
Designed for modular and extensible scripts, this utility provides structured runtime validation,
conditional logging, and reusable `Log` objects for centralized error propagation.
It also introduces a typed wrapping system for all native Pine values (e.g., `INT`, `FLOAT`, `LABEL`),
allowing values to carry errors alongside data. This enables functional-style flows with built-in
validation tracking, error detection (`has_error()`), and fluent chaining.
Inspired by structured logging patterns found in systems like C#, it reduces boilerplate,
enforces argument safety, and encourages clean, maintainable code architecture.
method INT(self, error_type)
Wraps an `int` value into an `INT` struct with an optional log severity.
Namespace types: series int, simple int, input int, const int
Parameters:
self (int) : The raw `int` value to wrap.
error_type (series ErrorType) : Optional severity level to associate with the log. Default is `ErrorType.error`.
Returns: An `INT` object containing the value and a default Log instance.
method FLOAT(self, error_type)
Wraps a `float` value into a `FLOAT` struct with an optional log severity.
Namespace types: series float, simple float, input float, const float
Parameters:
self (float) : The raw `float` value to wrap.
error_type (series ErrorType) : Optional severity level to associate with the log. Default is `ErrorType.error`.
Returns: A `FLOAT` object containing the value and a default Log instance.
method BOOL(self, error_type)
Wraps a `bool` value into a `BOOL` struct with an optional log severity.
Namespace types: series bool, simple bool, input bool, const bool
Parameters:
self (bool) : The raw `bool` value to wrap.
error_type (series ErrorType) : Optional severity level to associate with the log. Default is `ErrorType.error`.
Returns: A `BOOL` object containing the value and a default Log instance.
method STRING(self, error_type)
Wraps a `string` value into a `STRING` struct with an optional log severity.
Namespace types: series string, simple string, input string, const string
Parameters:
self (string) : The raw `string` value to wrap.
error_type (series ErrorType) : Optional severity level to associate with the log. Default is `ErrorType.error`.
Returns: A `STRING` object containing the value and a default Log instance.
method COLOR(self, error_type)
Wraps a `color` value into a `COLOR` struct with an optional log severity.
Namespace types: series color, simple color, input color, const color
Parameters:
self (color) : The raw `color` value to wrap.
error_type (series ErrorType) : Optional severity level to associate with the log. Default is `ErrorType.error`.
Returns: A `COLOR` object containing the value and a default Log instance.
method LINE(self, error_type)
Wraps a `line` object into a `LINE` struct with an optional log severity.
Namespace types: series line
Parameters:
self (line) : The raw `line` object to wrap.
error_type (series ErrorType) : Optional severity level to associate with the log. Default is `ErrorType.error`.
Returns: A `LINE` object containing the value and a default Log instance.
method LABEL(self, error_type)
Wraps a `label` object into a `LABEL` struct with an optional log severity.
Namespace types: series label
Parameters:
self (label) : The raw `label` object to wrap.
error_type (series ErrorType) : Optional severity level to associate with the log. Default is `ErrorType.error`.
Returns: A `LABEL` object containing the value and a default Log instance.
method BOX(self, error_type)
Wraps a `box` object into a `BOX` struct with an optional log severity.
Namespace types: series box
Parameters:
self (box) : The raw `box` object to wrap.
error_type (series ErrorType) : Optional severity level to associate with the log. Default is `ErrorType.error`.
Returns: A `BOX` object containing the value and a default Log instance.
method TABLE(self, error_type)
Wraps a `table` object into a `TABLE` struct with an optional log severity.
Namespace types: series table
Parameters:
self (table) : The raw `table` object to wrap.
error_type (series ErrorType) : Optional severity level to associate with the log. Default is `ErrorType.error`.
Returns: A `TABLE` object containing the value and a default Log instance.
method CHART_POINT(self, error_type)
Wraps a `chart.point` value into a `CHART_POINT` struct with an optional log severity.
Namespace types: chart.point
Parameters:
self (chart.point) : The raw `chart.point` value to wrap.
error_type (series ErrorType) : Optional severity level to associate with the log. Default is `ErrorType.error`.
Returns: A `CHART_POINT` object containing the value and a default Log instance.
method POLYLINE(self, error_type)
Wraps a `polyline` object into a `POLYLINE` struct with an optional log severity.
Namespace types: series polyline, series polyline, series polyline, series polyline
Parameters:
self (polyline) : The raw `polyline` object to wrap.
error_type (series ErrorType) : Optional severity level to associate with the log. Default is `ErrorType.error`.
Returns: A `POLYLINE` object containing the value and a default Log instance.
method LINEFILL(self, error_type)
Wraps a `linefill` object into a `LINEFILL` struct with an optional log severity.
Namespace types: series linefill
Parameters:
self (linefill) : The raw `linefill` object to wrap.
error_type (series ErrorType) : Optional severity level to associate with the log. Default is `ErrorType.error`.
Returns: A `LINEFILL` object containing the value and a default Log instance.
method from_INT(self)
Extracts the integer value from an INT wrapper.
Namespace types: INT
Parameters:
self (INT) : The wrapped INT instance.
Returns: The underlying `int` value.
method from_FLOAT(self)
Extracts the float value from a FLOAT wrapper.
Namespace types: FLOAT
Parameters:
self (FLOAT) : The wrapped FLOAT instance.
Returns: The underlying `float` value.
method from_BOOL(self)
Extracts the boolean value from a BOOL wrapper.
Namespace types: BOOL
Parameters:
self (BOOL) : The wrapped BOOL instance.
Returns: The underlying `bool` value.
method from_STRING(self)
Extracts the string value from a STRING wrapper.
Namespace types: STRING
Parameters:
self (STRING) : The wrapped STRING instance.
Returns: The underlying `string` value.
method from_COLOR(self)
Extracts the color value from a COLOR wrapper.
Namespace types: COLOR
Parameters:
self (COLOR) : The wrapped COLOR instance.
Returns: The underlying `color` value.
method from_LINE(self)
Extracts the line object from a LINE wrapper.
Namespace types: LINE
Parameters:
self (LINE) : The wrapped LINE instance.
Returns: The underlying `line` object.
method from_LABEL(self)
Extracts the label object from a LABEL wrapper.
Namespace types: LABEL
Parameters:
self (LABEL) : The wrapped LABEL instance.
Returns: The underlying `label` object.
method from_BOX(self)
Extracts the box object from a BOX wrapper.
Namespace types: BOX
Parameters:
self (BOX) : The wrapped BOX instance.
Returns: The underlying `box` object.
method from_TABLE(self)
Extracts the table object from a TABLE wrapper.
Namespace types: TABLE
Parameters:
self (TABLE) : The wrapped TABLE instance.
Returns: The underlying `table` object.
method from_CHART_POINT(self)
Extracts the chart.point from a CHART_POINT wrapper.
Namespace types: CHART_POINT
Parameters:
self (CHART_POINT) : The wrapped CHART_POINT instance.
Returns: The underlying `chart.point` value.
method from_POLYLINE(self)
Extracts the polyline object from a POLYLINE wrapper.
Namespace types: POLYLINE
Parameters:
self (POLYLINE) : The wrapped POLYLINE instance.
Returns: The underlying `polyline` object.
method from_LINEFILL(self)
Extracts the linefill object from a LINEFILL wrapper.
Namespace types: LINEFILL
Parameters:
self (LINEFILL) : The wrapped LINEFILL instance.
Returns: The underlying `linefill` object.
method has_error(self)
Returns true if the INT wrapper has an active log entry.
Namespace types: INT
Parameters:
self (INT) : The INT instance to check.
Returns: True if an error or message is active in the log.
method has_error(self)
Returns true if the FLOAT wrapper has an active log entry.
Namespace types: FLOAT
Parameters:
self (FLOAT) : The FLOAT instance to check.
Returns: True if an error or message is active in the log.
method has_error(self)
Returns true if the BOOL wrapper has an active log entry.
Namespace types: BOOL
Parameters:
self (BOOL) : The BOOL instance to check.
Returns: True if an error or message is active in the log.
method has_error(self)
Returns true if the STRING wrapper has an active log entry.
Namespace types: STRING
Parameters:
self (STRING) : The STRING instance to check.
Returns: True if an error or message is active in the log.
method has_error(self)
Returns true if the COLOR wrapper has an active log entry.
Namespace types: COLOR
Parameters:
self (COLOR) : The COLOR instance to check.
Returns: True if an error or message is active in the log.
method has_error(self)
Returns true if the LINE wrapper has an active log entry.
Namespace types: LINE
Parameters:
self (LINE) : The LINE instance to check.
Returns: True if an error or message is active in the log.
method has_error(self)
Returns true if the LABEL wrapper has an active log entry.
Namespace types: LABEL
Parameters:
self (LABEL) : The LABEL instance to check.
Returns: True if an error or message is active in the log.
method has_error(self)
Returns true if the BOX wrapper has an active log entry.
Namespace types: BOX
Parameters:
self (BOX) : The BOX instance to check.
Returns: True if an error or message is active in the log.
method has_error(self)
Returns true if the TABLE wrapper has an active log entry.
Namespace types: TABLE
Parameters:
self (TABLE) : The TABLE instance to check.
Returns: True if an error or message is active in the log.
method has_error(self)
Returns true if the CHART_POINT wrapper has an active log entry.
Namespace types: CHART_POINT
Parameters:
self (CHART_POINT) : The CHART_POINT instance to check.
Returns: True if an error or message is active in the log.
method has_error(self)
Returns true if the POLYLINE wrapper has an active log entry.
Namespace types: POLYLINE
Parameters:
self (POLYLINE) : The POLYLINE instance to check.
Returns: True if an error or message is active in the log.
method has_error(self)
Returns true if the LINEFILL wrapper has an active log entry.
Namespace types: LINEFILL
Parameters:
self (LINEFILL) : The LINEFILL instance to check.
Returns: True if an error or message is active in the log.
void_return()
Utility function used when a return is syntactically required but functionally unnecessary.
Returns: Nothing. Function never executes its body.
argument_error(condition, function, argument, message)
Throws a runtime error when a condition is met. Used for strict argument validation.
Parameters:
condition (bool) : Boolean expression that triggers the runtime error.
function (string) : Name of the calling function (for formatting).
argument (string) : Name of the problematic argument.
message (string) : Description of the error cause.
Returns: Never returns. Halts execution if the condition is true.
argument_log_info(condition, function, argument, message)
Logs an informational message when a condition is met. Used for optional debug visibility.
Parameters:
condition (bool) : Boolean expression that triggers the log.
function (string) : Name of the calling function.
argument (string) : Argument name being referenced.
message (string) : Informational message to log.
Returns: Nothing. Logs if the condition is true.
argument_log_warning(condition, function, argument, message)
Logs a warning when a condition is met. Non-fatal but highlights potential issues.
Parameters:
condition (bool) : Boolean expression that triggers the warning.
function (string) : Name of the calling function.
argument (string) : Argument name being referenced.
message (string) : Warning message to log.
Returns: Nothing. Logs if the condition is true.
argument_log_error(condition, function, argument, message)
Logs an error message when a condition is met. Does not halt execution.
Parameters:
condition (bool) : Boolean expression that triggers the error log.
function (string) : Name of the calling function.
argument (string) : Argument name being referenced.
message (string) : Error message to log.
Returns: Nothing. Logs if the condition is true.
init_static_log(error_type, message, active)
Initializes a persistent (var) Log object. Ideal for global logging in scripts or modules.
Parameters:
error_type (series ErrorType) : Initial severity level (required).
message (string) : Optional starting message string. Default value of ("").
active (bool) : Whether the log should be flagged active on initialization. Default value of (false).
Returns: A static Log object with the given parameters.
method new_line(self)
Appends a newline character to the Log message. Useful for separating entries during chained writes.
Namespace types: Log
Parameters:
self (Log) : The Log instance to modify.
Returns: The updated Log object with a newline appended.
method write(self, message, flag_active, error_type)
Appends a message to a Log object without a newline. Updates severity and active state if specified.
Namespace types: Log
Parameters:
self (Log) : The Log instance being modified.
message (string) : The text to append to the log.
flag_active (bool) : Whether to activate the log for conditional rendering. Default value of (false).
error_type (series ErrorType) : Optional override for the severity level. Default value of (na).
Returns: The updated Log object.
method write_line(self, message, flag_active, error_type)
Appends a message to a Log object, prefixed with a newline for clarity.
Namespace types: Log
Parameters:
self (Log) : The Log instance being modified.
message (string) : The text to append to the log.
flag_active (bool) : Whether to activate the log for conditional rendering. Default value of (false).
error_type (series ErrorType) : Optional override for the severity level. Default value of (na).
Returns: The updated Log object.
method clear(self, flag_active, error_type)
Clears a Log object’s message and optionally reactivates it. Can also update the error type.
Namespace types: Log
Parameters:
self (Log) : The Log instance being cleared.
flag_active (bool) : Whether to activate the log after clearing. Default value of (false).
error_type (series ErrorType) : Optional new error type to assign. If not provided, the previous type is retained. Default value of (na).
Returns: The cleared Log object.
method render_condition(self, flag_active, error_type)
Conditionally renders the log if it is active. Allows overriding error type and controlling active state afterward.
Namespace types: Log
Parameters:
self (Log) : The Log instance to evaluate and render.
flag_active (bool) : Whether to activate the log after rendering. Default value of (false).
error_type (series ErrorType) : Optional error type override. Useful for contextual formatting just before rendering. Default value of (na).
Returns: The updated Log object.
method render_now(self, flag_active, error_type)
Immediately renders the log regardless of `active` state. Allows overriding error type and active flag.
Namespace types: Log
Parameters:
self (Log) : The Log instance to render.
flag_active (bool) : Whether to activate the log after rendering. Default value of (false).
error_type (series ErrorType) : Optional error type override. Allows dynamic severity adjustment at render time. Default value of (na).
Returns: The updated Log object.
render(self, condition, flag_active, error_type)
Renders the log conditionally or unconditionally. Allows full control over render behavior.
Parameters:
self (Log) : The Log instance to render.
condition (bool) : If true, renders only if the log is active. If false, always renders. Default value of (false).
flag_active (bool) : Whether to activate the log after rendering. Default value of (false).
error_type (series ErrorType) : Optional error type override passed to the render methods. Default value of (na).
Returns: The updated Log object.
Log
A structured object used to store and render logging messages.
Fields:
error_type (series ErrorType) : The severity level of the message (from the ErrorType enum).
message (series string) : The text of the log message.
active (series bool) : Whether the log should trigger rendering when conditionally evaluated.
INT
A wrapped integer type with attached logging for validation or tracing.
Fields:
v (series int) : The underlying `int` value.
e (Log) : Optional log object describing validation status or error context.
FLOAT
A wrapped float type with attached logging for validation or tracing.
Fields:
v (series float) : The underlying `float` value.
e (Log) : Optional log object describing validation status or error context.
BOOL
A wrapped boolean type with attached logging for validation or tracing.
Fields:
v (series bool) : The underlying `bool` value.
e (Log) : Optional log object describing validation status or error context.
STRING
A wrapped string type with attached logging for validation or tracing.
Fields:
v (series string) : The underlying `string` value.
e (Log) : Optional log object describing validation status or error context.
COLOR
A wrapped color type with attached logging for validation or tracing.
Fields:
v (series color) : The underlying `color` value.
e (Log) : Optional log object describing validation status or error context.
LINE
A wrapped line object with attached logging for validation or tracing.
Fields:
v (series line) : The underlying `line` value.
e (Log) : Optional log object describing validation status or error context.
LABEL
A wrapped label object with attached logging for validation or tracing.
Fields:
v (series label) : The underlying `label` value.
e (Log) : Optional log object describing validation status or error context.
BOX
A wrapped box object with attached logging for validation or tracing.
Fields:
v (series box) : The underlying `box` value.
e (Log) : Optional log object describing validation status or error context.
TABLE
A wrapped table object with attached logging for validation or tracing.
Fields:
v (series table) : The underlying `table` value.
e (Log) : Optional log object describing validation status or error context.
CHART_POINT
A wrapped chart point with attached logging for validation or tracing.
Fields:
v (chart.point) : The underlying `chart.point` value.
e (Log) : Optional log object describing validation status or error context.
POLYLINE
A wrapped polyline object with attached logging for validation or tracing.
Fields:
v (series polyline) : The underlying `polyline` value.
e (Log) : Optional log object describing validation status or error context.
LINEFILL
A wrapped linefill object with attached logging for validation or tracing.
Fields:
v (series linefill) : The underlying `linefill` value.
e (Log) : Optional log object describing validation status or error context.

1M Scalp Setup – 2ndHi/2ndLo Breakout1M Scalp Setup – 2ndHi/2ndLo Breakout
This script is designed for 1-minute chart scalpers seeking high-probability intraday breakout setups based on early session price action. The strategy revolves around identifying the first high and low of the day, and then detecting the second breach (2nd high or 2nd low) to anticipate breakout entries.
🔍 Core Logic:
EMA Filter : A configurable EMA (default 8-period) is plotted for trend context.
1st High/Low Detection : Captures the very first high and low of each trading day.
2nd High/Low Markers : Identifies the second time price breaks the initial high or low, acting as a potential signal zone.
Breakout Signals :
A Buy Signal is triggered when price closes above the 2nd high.
A Sell Signal is triggered when price closes below the 2nd low.
Each signal is only triggered once per day to reduce noise and avoid overtrading.
🖌️ Visual Markers:
1stHi and 1stLo : Early session levels (red and green).
2ndHi and 2ndLo : Key breakout reference points (purple and blue).
B and S Labels : Buy and Sell triggers marked in real-time once breakouts occur.
⚙️ Inputs:
EMA Length (default: 8)
Customizable Colors for Buy/Sell signals and key markers
This tool is best used in fast-moving markets or during high-volume sessions. Combine with volume or higher-timeframe confirmation for improved accuracy.
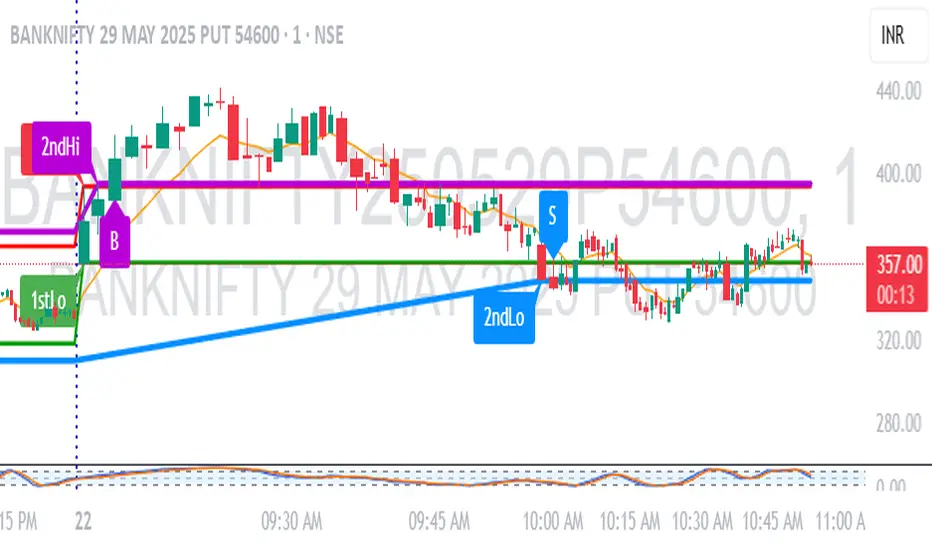
Stochastic RSI with Alerts# Stochastic RSI with Alerts - User Manual
## 1. Overview
This enhanced Stochastic RSI indicator identifies overbought/oversold conditions with visual signals and customizable alerts. It features:
- Dual-line Stoch RSI (K & D)
- Threshold-based buy/sell signals
- Configurable alert system
- Customizable parameters
## 2. Installation
1. Open TradingView chart
2. Open Pine Editor (📈 icon at bottom)
3. Copy/paste the full code
4. Click "Add to Chart"
## 3. Input Parameters
### 3.1 Core Settings
| Parameter | Default | Description |
|-----------|---------|-------------|
| K | 3 | Smoothing period for %K line |
| D | 3 | Smoothing period for %D line |
| RSI Length | 14 | RSI calculation period |
| Stochastic Length | 14 | Lookback period for Stoch calculation |
| RSI Source | Close | Price source for RSI calculation |
### 3.2 Signal Thresholds
| Parameter | Default | Description |
|-----------|---------|-------------|
| Upper Limit | 80 | Sell signal threshold (overbought) |
| Lower Limit | 20 | Buy signal threshold (oversold) |
### 3.3 Alert Settings
| Parameter | Default | Description |
|-----------|---------|-------------|
| Enable Buy Alerts | True | Toggle buy notifications |
| Enable Sell Alerts | True | Toggle sell notifications |
| Custom Alert Message | Empty | Additional text for alerts |
## 4. Signal Logic
### 4.1 Buy Signal (Green ▲)
Triggers when:
\text{%K crossover %D} \quad AND \quad (\text{%K ≤ Lower Limit} \quad OR \quad \text{%D ≤ Lower Limit})
### 4.2 Sell Signal (Red ▼)
Triggers when:
\text{%K crossunder %D} \quad AND \quad (\text{%K ≥ Upper Limit} \quad OR \quad \text{%D ≥ Upper Limit})
## 5. Alert System
### 5.1 Auto-Generated Alerts
The script automatically creates these alert conditions:
- **Buy Signal Alert**: Triggers on valid buy signals
- **Sell Signal Alert**: Triggers on valid sell signals
Alert messages include:
- Signal type (Buy/Sell)
- Current %K and %D values
- Custom message (if configured)
### 5.2 Alert Configuration
**Method 1: Script-Generated Alerts**
1. Hover over any signal marker
2. Click the 🔔 icon
3. Select trigger conditions:
- "Buy Signal Alert"
- "Sell Signal Alert"
**Method 2: Manual Setup**
1. Open Alert creation window
2. Condition: Select "Stoch RSI Alerts"
3. Choose:
- "Buy Signal Alert" for long entries
- "Sell Signal Alert" for exits/shorts
## 6. Customization Tips
### 6.1 Threshold Adjustment
// For day trading (tighter ranges)
upperLimit = 75
lowerLimit = 25
// For swing trading (wider ranges)
upperLimit = 85
lowerLimit = 15
### 6.2 Visual Modifications
Change signal markers via:
- `style=` : Try `shape.labelup`, `shape.flag`, etc.
- `color=` : Use hex codes (#FF00FF) or named colors
- `size=` : `size.tiny` to `size.huge`
## 7. Recommended Use Cases
1. **Mean Reversion Strategies**: Pair with support/resistance levels
2. **Trend Confirmation**: Filter with 200EMA direction
3. **Divergence Trading**: Compare with price action
## 8. Limitations
- Works best in ranging markets
- Combine with volume analysis for confirmation
- Not recommended as standalone strategy
---
This documentation follows technical writing best practices with:
- Clear parameter tables
- Mathematical signal logic
- Visual hierarchy
- Practical examples
- Usage recommendations

Parameter Free RSI [InvestorUnknown]The Parameter Free RSI (PF-RSI) is an innovative adaptation of the traditional Relative Strength Index (RSI), a widely used momentum oscillator that measures the speed and change of price movements. Unlike the standard RSI, which relies on a fixed lookback period (typically 14), the PF-RSI dynamically adjusts its calculation length based on real-time market conditions. By incorporating volatility and the RSI's deviation from its midpoint (50), this indicator aims to provide a more responsive and adaptable tool for identifying overbought/oversold conditions, trend shifts, and momentum changes. This adaptability makes it particularly valuable for traders navigating diverse market environments, from trending to ranging conditions.
PF-RSI offers a suite of customizable features, including dynamic length variants, smoothing options, visualization tools, and alert conditions.
Key Features
1. Dynamic RSI Length Calculation
The cornerstone of the PF-RSI is its ability to adjust the RSI calculation period dynamically, eliminating the need for a static parameter. The length is computed using two primary factors:
Volatility: Measured via the standard deviation of past RSI values.
Distance from Midpoint: The absolute deviation of the RSI from 50, reflecting the strength of bullish or bearish momentum.
The indicator offers three variants for calculating this dynamic length, allowing users to tailor its responsiveness:
Variant I (Aggressive): Increases the length dramatically based on volatility and a nonlinear scaling of the distance from 50. Ideal for traders seeking highly sensitive signals in fast-moving markets.
Variant II (Moderate): Combines volatility with a scaled distance from 50, using a less aggressive adjustment. Strikes a balance between responsiveness and stability, suitable for most trading scenarios.
Variant III (Conservative): Applies a linear combination of volatility and raw distance from 50. Offers a stable, less reactive length adjustment for traders prioritizing consistency.
// Function that returns a dynamic RSI length based on past RSI values
// The idea is to make the RSI length adaptive using volatility (stdev) and distance from the RSI midpoint (50)
// Different "variant" options control how aggressively the length changes
parameter_free_length(free_rsi, variant) =>
len = switch variant
// Variant I: Most aggressive adaptation
// Uses standard deviation scaled by a nonlinear factor of distance from 50
// Also adds another distance-based term to increase length more dramatically
"I" => math.ceil(
ta.stdev(free_rsi, math.ceil(free_rsi)) *
math.pow(1 + (math.ceil(math.abs(50 - (free_rsi - 50))) / 100), 2)
) +
(
math.ceil(math.abs(free_rsi - 50)) *
(1 + (math.ceil(math.abs(50 - (free_rsi - 50))) / 100))
)
// Variant II: Moderate adaptation
// Adds the standard deviation and a distance-based scaling term (less nonlinear)
"II" => math.ceil(
ta.stdev(free_rsi, math.ceil(free_rsi)) +
(
math.ceil(math.abs(free_rsi - 50)) *
(1 + (math.ceil(math.abs(50 - (free_rsi - 50))) / 100))
)
)
// Variant III: Least aggressive adaptation
// Simply adds standard deviation and raw distance from 50 (linear scaling)
"III" => math.ceil(
ta.stdev(free_rsi, math.ceil(free_rsi)) +
math.ceil(math.abs(free_rsi - 50))
)
2. Smoothing Options
To refine the dynamic RSI and reduce noise, the PF-RSI provides smoothing capabilities:
Smoothing Toggle: Enable or disable smoothing of the dynamic length used for RSI.
Smoothing MA Type for RSI MA: Choose between SMA and EMA
Smoothing Length Options for RSI MA:
Full: Uses the entire calculated dynamic length.
Half: Applies half of the dynamic length for smoother output.
SQRT: Uses the square root of the dynamic length, offering a compromise between responsiveness and smoothness.
The smoothed RSI is complemented by a separate moving average (MA) of the RSI itself, further enhancing signal clarity.
3. Visualization Tools
The PF-RSI includes visualization options to help traders interpret market conditions at a glance.
Plots:
Dynamic RSI: Displayed as a white line, showing the adaptive RSI value.
RSI Moving Average: Plotted in yellow, providing a smoothed reference for trend and momentum analysis.
Dynamic Length: A secondary plot (in faint white) showing how the calculation period evolves over time.
Histogram: Represents the RSI’s position relative to 50, with color gradients.
Fill Area: The space between the RSI and its MA is filled with a gradient (green for RSI > MA, red for RSI < MA), highlighting momentum shifts.
Customizable bar colors on the price chart reflect trend and momentum:
Trend (Raw RSI): Green (RSI > 50), Red (RSI < 50).
Trend (RSI MA): Green (MA > 50), Red (MA < 50).
Trend (Raw RSI) + Momentum: Adds momentum shading (lighter green/red when RSI and MA diverge).
Trend (RSI MA) + Momentum: Similar, but based on the MA’s trend.
Momentum: Green (RSI > MA), Red (RSI < MA).
Off: Disables bar coloring.
Intrabar Updating: Optional real-time updates within each bar for enhanced responsiveness.
4. Alerts
The PF-RSI supports customizable alerts to keep traders informed of key events.
Trend Alerts:
Raw RSI: Triggers when the RSI crosses above (uptrend) or below (downtrend) 50.
RSI MA: Triggers when the moving average crosses 50.
Off: Disables trend alerts.
Momentum Alerts:
Triggers when the RSI crosses its moving average, indicating rising (RSI > MA) or declining (RSI < MA) momentum.
Alerts are fired once per bar close, with descriptive messages including the ticker symbol (e.g., " Uptrend on: AAPL").
How It Works
The PF-RSI operates in a multi-step process:
Initialization
On the first run, it calculates a standard RSI with a 14-period length to seed the dynamic calculation.
Dynamic Length Computation
Once seeded, the indicator switches to a dynamic length based on the selected variant, factoring in volatility and distance from 50.
If smoothing is enabled, the length is further refined using an SMA.
RSI Calculation
The adaptive RSI is computed using the dynamic length, ensuring it reflects current market conditions.
Moving Average
A separate MA (SMA or EMA) is applied to the RSI, with a length derived from the dynamic length (Full, Half, or SQRT).
Visualization and Alerts
The results are plotted, and alerts are triggered based on user settings.
This adaptive approach minimizes lag in fast markets and reduces false signals in choppy conditions, offering a significant edge over fixed-period RSI implementations.
Why Use PF-RSI?
The Parameter Free RSI stands out by eliminating the guesswork of selecting an RSI period. Its dynamic length adjusts to market volatility and momentum, providing timely signals without manual tweaking.

[blackcat] L3 Twin Range Filter ProOVERVIEW
The L3 Twin Range Filter Pro indicator enhances trading strategies by filtering out market noise through a sophisticated dual-range approach. Unlike previous versions, this script not only provides clear visual indications of buy/sell signals but also incorporates a dynamic trend range filter line. By averaging two smoothed exponential moving averages—one fast and one slow—the indicator generates upper and lower range boundaries that adapt to changing market conditions. Traders can easily spot buy/sell opportunities when the closing price crosses these boundaries, supported by configurable alerts for real-time notifications.
FEATURES
Dual-Range Calculation: Combines fast and slow moving averages to create adaptive range boundaries.
Customizable Parameters:
Periods: Adjustable lengths for fast (default 9 bars) and slow (default 34 bars) moving averages.
Multipliers: Coefficients to modify the distance of the trailing lines from the price.
Dynamic Trend Range Filter Line: Visually displays buy/sell signals directly on the chart.
Trailing Stop Loss Logic: Automatically follows price movements to act as a trailing stop loss indicator.
Trade Signals: Clearly indicates buy/sell points with labeled signals.
Alerts: Configurable notifications for buy/sell signals to keep traders informed.
Visual Enhancements: Colored fills and dynamic boundary lines for easy interpretation.
HOW TO USE
Add the L3 Twin Range Filter Pro indicator to your TradingView chart.
Customize the input parameters:
Price Source: Choose the desired price source (e.g., Close).
Show Trade Signals: Toggle on/off for displaying buy/sell labels.
Fast Period: Set the period for the fast moving average (default 9 bars).
Slow Period: Set the period for the slow moving average (default 34 bars).
Fast Range Multiplier: Adjust the multiplier for the fast moving average.
Slow Range Multiplier: Adjust the multiplier for the slow moving average.
Monitor the plotted trend range filter and dynamic boundaries on the chart.
Identify buy/sell signals based on the crossing of price and range boundaries.
Configure alerts for real-time notifications when signals are triggered.
TRADE LOGIC
BUY Signal: Triggered when the price is higher than or equal to the upper range level. The indicator line will trail just below the price, acting as a trailing stop loss.
SELL Signal: Triggered when the price is lower than or equal to the lower range level. The indicator line will trail just above the price, serving as a trailing stop loss.
LIMITATIONS
The performance of this indicator relies on the selected periods and multipliers.
Market volatility can impact the accuracy of the signals.
Always complement this indicator with other analytical tools for robust decision-making.
NOTES
Experiment with different parameter settings to optimize the indicator for various market conditions.
Thoroughly backtest the indicator using historical data to ensure its compatibility with your trading strategy.
THANKS
A big thank you to Colin McKee for his foundational work on the Twin Range Filter! Your contributions have paved the way for enhanced trading tools. 🙏📈🔍

[blackcat] L2 FiboKAMA Adaptive TrendOVERVIEW
The L2 FiboKAMA Adaptive Trend indicator leverages advanced technical analysis techniques by integrating Fibonacci principles with the Kaufman Adaptive Moving Average (KAMA). This combination creates a dynamic and responsive tool designed to adapt seamlessly to changing market conditions. By providing clear buy and sell signals based on adaptive momentum, this indicator helps traders identify potential entry and exit points effectively. Its intuitive design and robust features make it a valuable addition to any trader’s arsenal 📊💹.
According to the principle of Kaufman's Adaptive Moving Average (KAMA), it is a type of moving average line specifically designed for markets with high volatility. Unlike traditional moving averages, KAMA can automatically adjust its period based on market conditions to improve accuracy and responsiveness. This makes it particularly useful for capturing market trends and reducing false signals in varying market environments.
The use of Fibonacci magic numbers (3, 8, 13) enhances the performance and accuracy of KAMA. These numbers have special mathematical properties that align well with the changing trends of KAMA moving averages. Combining them with KAMA can significantly boost its effectiveness, making it a popular choice among traders seeking reliable signals.
This fusion not only smoothens price fluctuations but also ensures quick responses to market changes, offering dependable entry and exit points. Thanks to the flexibility and precision of KAMA combined with Fibonacci magic numbers, traders can better manage risks and aim for higher returns.
FEATURES
Enhanced Kaufman Adaptive Moving Average (KAMA): Incorporates Fibonacci principles for improved adaptability:
Source Price: Allows customization of the price series used for calculation (default: HLCC4).
Fast Length: Determines the period for quicker adjustments to recent price changes.
Slow Length: Sets the period for smoother transitions over longer-term trends.
Dynamic Lines:
KAMA Line: A yellow line representing the primary adaptive moving average, which adapts quickly to new trends.
Trigger Line: A fuchsia line serving as a reference point for detecting crossovers and generating signals.
Visual Cues:
Buy Signals: Green 'B' labels indicating potential buying opportunities.
Sell Signals: Red 'S' labels signaling possible selling points.
Fill Areas: Colored regions between the KAMA and Trigger lines to visually represent trend directions and strength.
Alert Functionality: Generates real-time alerts for both buy and sell signals, ensuring timely notifications for actionable insights 🔔.
Customizable Parameters: Offers flexibility through adjustable inputs, allowing users to tailor the indicator to their specific trading strategies and preferences.
HOW TO USE
Adding the Indicator:
Open your TradingView chart and navigate to the indicators list.
Select L2 FiboKAMA Adaptive Trend and add it to your chart.
Configuring Parameters:
Adjust the Source Price to choose the desired price series (e.g., close, open, high, low).
Set the Fast Length to define how quickly the indicator responds to recent price movements.
Configure the Slow Length to determine the smoothness of long-term trend adaptations.
Interpreting Signals:
Monitor the chart for green 'B' labels indicating buy signals and red 'S' labels for sell signals.
Observe the colored fill areas between the KAMA and Trigger lines to gauge trend strength and direction.
Setting Up Alerts:
Enable alerts within the indicator settings to receive notifications whenever buy or sell signals are triggered.
Customize alert messages and frequencies according to your trading plan.
Combining with Other Tools:
Integrate this indicator with additional technical analysis tools and fundamental research for comprehensive decision-making.
Confirm signals using other indicators like RSI, MACD, or Bollinger Bands for increased reliability.
Optimizing Performance:
Backtest the indicator across various assets and timeframes to understand its behavior under different market conditions.
Fine-tune parameters based on historical performance and current market dynamics.
Integrating Magic Numbers:
Understand the basic principles of KAMA to find suitable entry points for Fibonacci magic numbers.
Utilize the efficiency ratio to measure market volatility and adjust moving average parameters accordingly.
Apply Fibonacci magic numbers (3, 8, 13) to enhance the responsiveness and accuracy of KAMA.
LIMITATIONS
Market Volatility: May produce false signals during periods of extreme volatility or sideways movement.
Parameter Sensitivity: Requires careful tuning of fast and slow lengths to balance responsiveness and stability.
Asset-Specific Behavior: Effectiveness can vary significantly across different financial instruments and time horizons.
Complementary Analysis: Should be used alongside other analytical methods to enhance accuracy and reduce risk.
NOTES
Historical Data: Ensure adequate historical data availability for precise calculations and backtesting.
Demo Testing: Thoroughly test the indicator on demo accounts before deploying it in live trading environments.
Continuous Learning: Stay updated with market trends and continuously refine your strategy incorporating feedback from the indicator's performance.
Risk Management: Always implement proper risk management practices regardless of the signals provided by the indicator.
ADVANCED USAGE TIPS
Multi-Timeframe Analysis: Apply the indicator across multiple timeframes to gain deeper insights into underlying trends.
Divergence Strategy: Look for divergences between price action and the KAMA line to spot potential reversals early.
Volume Integration: Combine volume analysis with the indicator to confirm the strength of identified trends.
Custom Scripting: Modify the script to include additional filters or conditions tailored to your unique trading approach.
IMPROVING KAMA PERFORMANCE
Increase Length: Extend the KAMA length to consider more historical data, reducing the impact of short-term price fluctuations.
Adjust Fast and Slow Lengths: Make KAMA smoother by increasing the fast length and decreasing the slow length.
Use Smoothing Factor: Apply a smoothing factor to control the level of smoothness; typical values range from 0 to 1.
Combine with Other Indicators: Pair KAMA with other smoothing indicators like EMA or SMA for more reliable signals.
Filter Noise: Use filters or other technical analysis tools to eliminate price noise, enhancing KAMA's effectiveness.
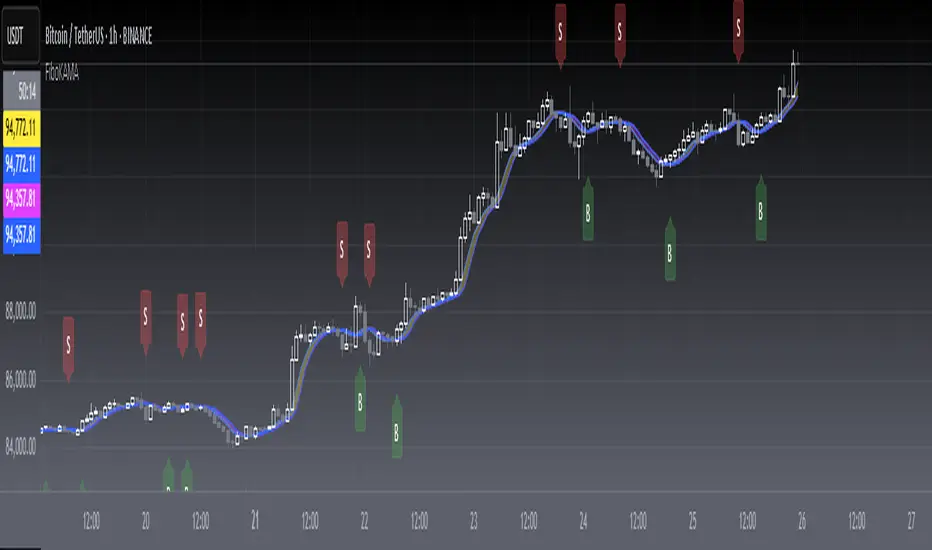
Bullish and Bearish Breakout Alert for Gold Futures PullbackBelow is a Pine Script (version 6) for TradingView that includes both bullish and bearish breakout conditions for my intraday trading strategy on micro gold futures (MGC). The strategy focuses on scalping two-legged pullbacks to the 20 EMA or key levels with breakout confirmation, tailored for the Apex Trader Funding $300K challenge. The script accounts for the Daily Sentiment Index (DSI) at 87 (overbought, favoring pullbacks). It generates alerts for placing stop-limit orders for 175 MGC contracts, ensuring compliance with Apex’s rules ($7,500 trailing threshold, $20,000 profit target, 4:59 PM ET close).
Script Requirements
Version: Pine Script v6 (latest for TradingView, April 2025).
Purpose:
Bullish: Alert when price breaks above a rejection candle’s high after a two-legged pullback to the 20 EMA in a bullish trend (price above 20 EMA, VWAP, higher highs/lows).
Bearish: Alert when price breaks below a rejection candle’s low after a two-legged pullback to the 20 EMA in a bearish trend (price below 20 EMA, VWAP, lower highs/lows).
Context: 5-minute MGC chart, U.S. session (8:30 AM–12:00 PM ET), avoiding overbought breakouts above $3,450 (DSI 87).
Output: Alerts for stop-limit orders (e.g., “Buy: Stop=$3,377, Limit=$3,377.10” or “Sell: Stop=$3,447, Limit=$3,446.90”), quantity 175 MGC.
Apex Compliance: 175-contract limit, stop-losses, one-directional news trading, close by 4:59 PM ET.
How to Use the Script in TradingView
1. Add Script:
Open TradingView (tradingview.com).
Go to “Pine Editor” (bottom panel).
Copy the script from the content.
Click “Add to Chart” to apply to your MGC 5-minute chart .
2. Configure Chart:
Symbol: MGC (Micro Gold Futures, CME, via Tradovate/Apex data feed).
Timeframe: 5-minute (entries), 15-minute (trend confirmation, manually check).
Indicators: Script plots 20 EMA and VWAP; add RSI (14) and volume manually if needed .
3. Set Alerts:
Click the “Alert” icon (bell).
Add two alerts:
Bullish Breakout: Condition = “Bullish Breakout Alert for Gold Futures Pullback,” trigger = “Once Per Bar Close.”
Bearish Breakout: Condition = “Bearish Breakout Alert for Gold Futures Pullback,” trigger = “Once Per Bar Close.”
Customize messages (default provided) and set notifications (e.g., TradingView app, SMS).
Example: Bullish alert at $3,377 prompts “Stop=$3,377, Limit=$3,377.10, Quantity=175 MGC” .
4. Execute Orders:
Bullish:
Alert triggers (e.g., stop $3,377, limit $3,377.10).
In TradingView’s “Order Panel,” select “Stop-Limit,” set:
Stop Price: $3,377.
Limit Price: $3,377.10.
Quantity: 175 MGC.
Direction: Buy.
Confirm via Tradovate.
Add bracket order (OCO):
Stop-loss: Sell 175 at $3,376.20 (8 ticks, $1,400 risk).
Take-profit: Sell 87 at $3,378 (1:1), 88 at $3,379 (2:1) .
Bearish:
Alert triggers (e.g., stop $3,447, limit $3,446.90).
Select “Stop-Limit,” set:
Stop Price: $3,447.
Limit Price: $3,446.90.
Quantity: 175 MGC.
Direction: Sell.
Confirm via Tradovate.
Add bracket order:
Stop-loss: Buy 175 at $3,447.80 (8 ticks, $1,400 risk).
Take-profit: Buy 87 at $3,446 (1:1), 88 at $3,445 (2:1) .
5. Monitor:
Green triangles (bullish) or red triangles (bearish) confirm signals.
Avoid bullish entries above $3,450 (DSI 87, overbought) or bearish entries below $3,296 (support) .
Close trades by 4:59 PM ET (set 4:50 PM alert) .

MA Deviation// -----------------------------------------------------------------------------
// MA Deviation Marking & Alert (MA Divergence)
// -----------------------------------------------------------------------------
// Short Title: MA Deviation Radar
// Author: zhipeng luo
// Version: 1.0
// Date: 2025-04-11
// -----------------------------------------------------------------------------
// Overview:
// This indicator identifies and highlights price bars where the closing price
// deviates significantly from its Simple Moving Average (SMA) by a user-defined
// percentage. It visually marks these bars on the chart and provides
// configurable alert conditions for threshold breaches.
//
// How it Works:
// 1. Calculates the Simple Moving Average (SMA) based on the 'MA Period' input.
// 2. Computes the percentage deviation of the closing price from the SMA value.
// Formula: `((Close - SMA) / SMA) * 100`
// 3. Compares the calculated deviation percentage against the positive and
// negative 'Threshold (%)' input values.
// 4. Marks the background of the price bars when a threshold is exceeded:
// - Red Background: Price deviation is greater than the positive threshold.
// - Green Background: Price deviation is less than the negative threshold.
// 5. Includes an optional, non-visible plot of the MA line itself.
// 6. Offers three distinct alert conditions for automation and notifications.
//
// Features:
// - Customizable Simple Moving Average period.
// - Adjustable deviation threshold percentage.
// - Clear visual signals using background colors on the main chart.
// - Built-in Alert Conditions:
// - MA Positive Deviation Alert (Triggers when price > MA + Threshold %)
// - MA Negative Deviation Alert (Triggers when price < MA - Threshold %)
// - MA Deviation Alert - Any (Triggers on either positive or negative breach)
//
// How to Use:
// - Identify Potential Extremes: Useful for spotting potential overbought (large
// positive deviation) or oversold (large negative deviation) conditions
// which might precede price corrections or mean reversion.
// - Gauge Trend Extension: Extreme deviations can sometimes indicate that a
// trend is overextended and might be due for a pause or reversal.
// - Parameter Tuning: Adjust the 'MA Period' and '(Threshold %)' settings to
// suit the specific asset, timeframe, and volatility characteristics you
// are analyzing. Lower thresholds yield more signals; higher thresholds
// focus on more significant deviations.
// - Alerts: Set up alerts via the TradingView alert menu using the provided
// conditions ("MA Positive Deviation Alert", "MA Negative Deviation Alert",
// "MA Deviation Alert - Any") to get notified of potential setups.
//
// Parameters:
// - MA Period (Default: 200): The lookback period for the SMA calculation.
// - (Threshold %) (Default: 7.0): The percentage deviation (positive and
// negative) from the MA required to trigger a background signal and alert.
//
// Alerts & Important Note:
// Three alert conditions corresponding to the signals are available:
// 1. "MA Positive Deviation Alert"
// 2. "MA Negative Deviation Alert"
// 3. "MA Deviation Alert - Any"
//
// ***Please Note:*** The value shown after "( {{plot_0}}%)" or
// "( {{plot_0}}%)" in the default alert message refers to the
// **Moving Average value** (`plot_0`), not the actual deviation percentage.
// The alert *triggers correctly* based on the deviation percentage crossing
// the threshold, but the number displayed by the `{{plot_0}}` placeholder
// in the message is the MA's value at that time due to the script's
// internal plot order.
//
// Disclaimer: This indicator is provided for informational and analytical
// purposes only. It does not constitute financial advice or a recommendation
// to buy or sell any asset. Always conduct your own research and use proper
// risk management. Trading involves significant risk.
// -----------------------------------------------------------------------------
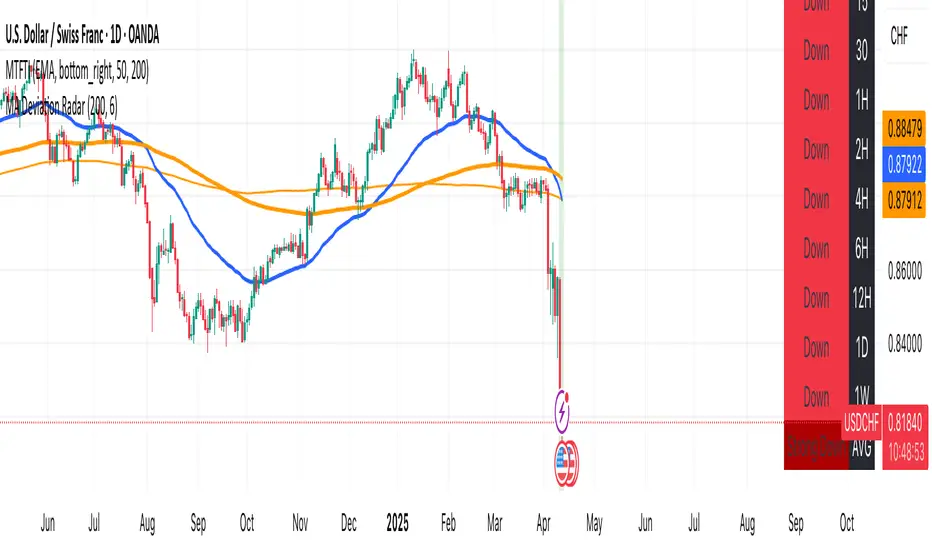
Pullback Entry Zone FinderPullback Entry Zone Finder
Overview:
This indicator is designed to help traders identify potential buying opportunities during short-term pullbacks, particularly when faster-moving averages show signs of converging back towards slower ones. It visually flags potential zones where price might find support and resume its upward movement, based on moving average dynamics and price proximity.
How It Works:
The indicator utilizes four customizable moving averages (Trigger, Short-term, Intermediate, and Long-term) and Average True Range (ATR) to pinpoint specific conditions:
Pullback Detection: It identifies when the fast 'Trigger MA' is below the 'Short-term MA', indicating a potential short-term pullback or consolidation phase.
MA Convergence: Crucially, it looks for signs that the pullback might be weakening by detecting when the gap between the Short-term MA and the Trigger MA is narrowing (maConverging). This suggests the faster average is starting to catch up, potentially preceding a move back up.
Base Buy Zone (Orange Diamond): This signal appears when both the Pullback and Convergence conditions are met simultaneously. It indicates the general area where conditions are becoming favourable for a potential entry.
Refined Entry Zones:
Prime Entry Zone (Green Diamond): This appears within a Base Buy Zone if the bar's low comes within a specified percentage (Max Distance %) of the Short-term MA. It suggests price has pulled back close to the dynamic support of the Short MA.
ATR Entry Zone (Purple Diamond): This appears within a Base Buy Zone if the bar's low comes within the specified percentage (Max Distance %) of an ATR-based target level. This target level (Buy ATR Target Level, plotted as a purple line when active) is calculated by adding a multiple (ATR Multiplier %) of the ATR to the Short-term MA, providing a volatility-adjusted potential entry area.
Visual Elements:
Moving Averages: Four lines representing the Trigger, Short-term, Intermediate, and Long-term MAs (colors and opacity are customizable). Use the Intermediate and Long-term MAs to gauge the broader market trend.
Orange Diamond (Below Bar): Indicates a 'Base Buy Zone' where a pullback and MA convergence are detected.
Green Diamond (Below Bar): Indicates a 'Prime Entry Zone' where price is close to the Short-term MA during a Base Buy Zone.
Purple Diamond (Below Bar): Indicates an 'ATR Entry Zone' where price is close to the ATR-based target level during a Base Buy Zone.
Purple Line: Plots the calculated 'Buy ATR Target Level' only when the Base Buy Zone condition is active.
Input Parameters:
Moving Averages: Customize the Length and Type (EMA, SMA, WMA, VWMA) for all four moving averages.
ATR Settings: Adjust the ATR Length, the ATR Multiplier % (for calculating the target level), and the Max Distance % (for triggering the Prime and ATR Entry Zones).
Visualization: Set the colors for the four Moving Average lines.
How to Use:
Look for the Orange Diamond as the initial signal that pullback/convergence conditions are met.
The Green and Purple Diamonds suggest price has reached potentially more optimal entry levels within that zone, based on proximity to the Short MA or the ATR target, respectively.
Always consider the signals within the context of the broader trend, indicated by the Intermediate and Long-term MAs. This indicator is generally more effective when used to find entries during pullbacks within an established uptrend (e.g., Intermediate MA > Long MA).
Combine these signals with other forms of analysis, such as chart patterns, support/resistance levels, volume analysis, or other indicators for confirmation.
Disclaimer:
You should always use proper risk management techniques and conduct your own analysis before making any trading decisions. This indicator, or any other, will be of no use if you don't have good risk management.
