חפש סקריפטים עבור "vix"

Historical Volatility RankSame formulation of IVR but based on Historical Volatility instead.
Serves the same purpose as IV rank.

RSI/RCI3TripleTimeframe+VixFearInverseBottomDefault: RSI OFF,RCI ExLine OFF
RSI triangle signal: Buy-green Sell-red
Vix color(BG color): Fear-green Inverse-fuchsia Bottom-red

Change Per Period - Tom1traderwww.tradingview.com
Plots the values between current close and close (specified number of periods) ago. User chooses the period defaulted to 1 and the period of a simple moving average of the values in the series. Made this specifically to measure the drift of the VIX exchange traded funds VXX, UVXY and SVXY. The fact that they must drift can be strategic in trading.
In the chart example it shows that VXX drifts down usually between -$10 and -$20 over a 60 day period (eyeball) and that for a few days in February of 2017 it had drifted down -$75. To find a positive change (briefly) you can see you have to go back to November of 2016. If you use Heiken Ashi candles or ohlc bars or change between regular candles and these there is a set of variables in this code that lets you do that without changing your indicator results. Anyhow use it or any of the code if it helps you, good luck with your trading and keep smiling! (any feedback appreciated also :-) )

Daily Deviations (Lazy Edition)
Plots the standard deviation resistance/support lines.
Uses Previous days close and the VIX as the volatility factor.
credit to u/UberBotMan and u/Living_Granger for the idea and formulas

SPY/VXX/TLT RSI crisscrossAre treasuries moving with VIX or are they correlated with equities?
Who's changing faster, VXX or SPY?
The indicator displays the RSI's of SPY, VXX and TLT so you can see how they are moving relative to each other.

Humble Student OB/OS Trifecta indicatorAfter reading Cam Hui's blog post about his "Trifecta" bottom spotting model I thought I'd try my hand at scripting it as an indicator. The results are pretty close to what he describes. Though the data TradingView feeds me doesn't seem to be identical to what he's using on StockCharts.com the results are close enough that I will call the effort a success worth publishing.

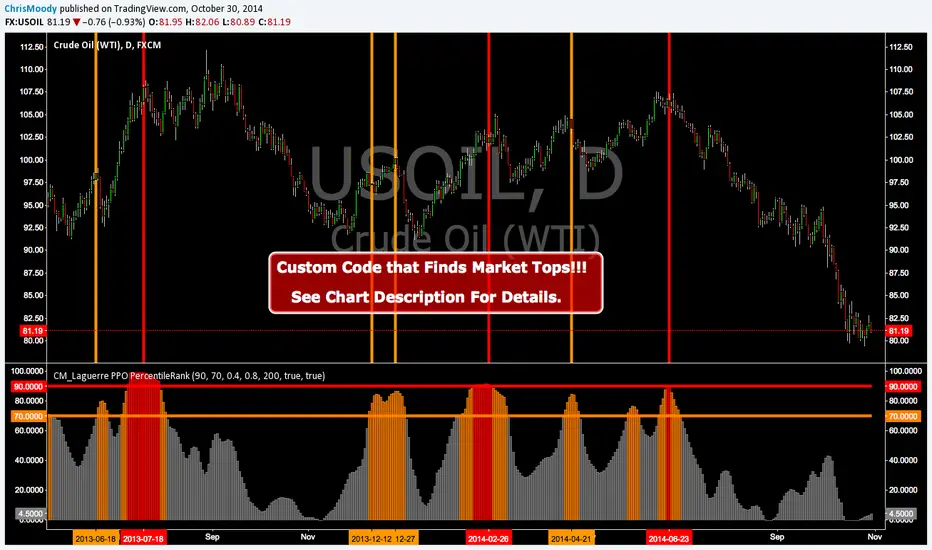
CM_Laguerre PPO PercentileRank Mkt Tops & BottomsCustom Code that Finds Market Tops & Bottoms!!!
CM_Laguerre PPO PercentileRank V2 Mkt Tops & Bottoms
Original Laguerre PPO code was Created by TheLark.
Special Thanks to coondawg71 and ChartArt for Great Insights
This Is Version 2 Of This Indicator that now Finds Market Tops and Bottoms.
Coming Next…Upper Indicator Pinpointing Entries Based on Price Action!!!
See Original Post Below For Detailed Information.
Other Indicators That Show Market Bottoms Well.
CM ATR PERCENTILERANK - GREAT FOR SHOWING MARKET BOTTOMS!
GREAT CONFIRMING INDICATOR FOR THE WILLIAMS VIX FIX
TWO TRADING SYSTEMS - BASED ON EXTREME MOVES!!!

CM_Laguerre PPO PercentileRank - Markets ToppingCustom Code that Finds Market Tops!!!
CM_Laguerre PPO PercentileRank - Markets Topping
Original Laguerre PPO code was Created by TheLark.
I found if I applied a Percent Rank of the PPO to view Extreme Moves in the PPO it was great at showing Market Tops.
Features via Inputs Tab:
Ability to set all PPO Indicator Values.
Ability to set Warning Threshold Line Value and Extreme Percentile Threshold Line Values.
Ability to turn On/Off Warning and Extreme Percentile Rank Lines.
***I’ve found this Indicator to be Valid…However, I have NOT Extensively tested the Settings. Initially setting the LookBack Period to 200 on A Daily chart with a 90 Extreme Percentile Rank Value works Good. Some charts changing the Lookback period to 50 an draisisng the Extreme Percentile Rank Line to 95 Works Great.
***To Be Blunt…When I look at the underlying Indicator…I don’t know why this Shows Us What It Does When the Percentile Rank Function is applied to it…But For Whatever Reason…It Just Works.
***If you Find Very Useful Settings Please Post Below
Other Indicators That Show Market Bottoms Well.
CM ATR PERCENTILERANK - GREAT FOR SHOWING MARKET BOTTOMS!
GREAT CONFIRMING INDICATOR FOR THE WILLIAMS VIX FIX
TWO TRADING SYSTEMS - BASED ON EXTREME MOVES!!!
CM_RSI Plus EMARSI with EMA Signal Created By Request For @motcha1
@motcha1 Requested the RSI with EMA Signal.
A Larry Williams Follower who says it's a Great
Entry Signal when RSI Crosses EMA When VIX
Is Showing A Potential Bottom. Looks Good!!!
Link to Lower Indicator CM_Williams_Vix_Fix
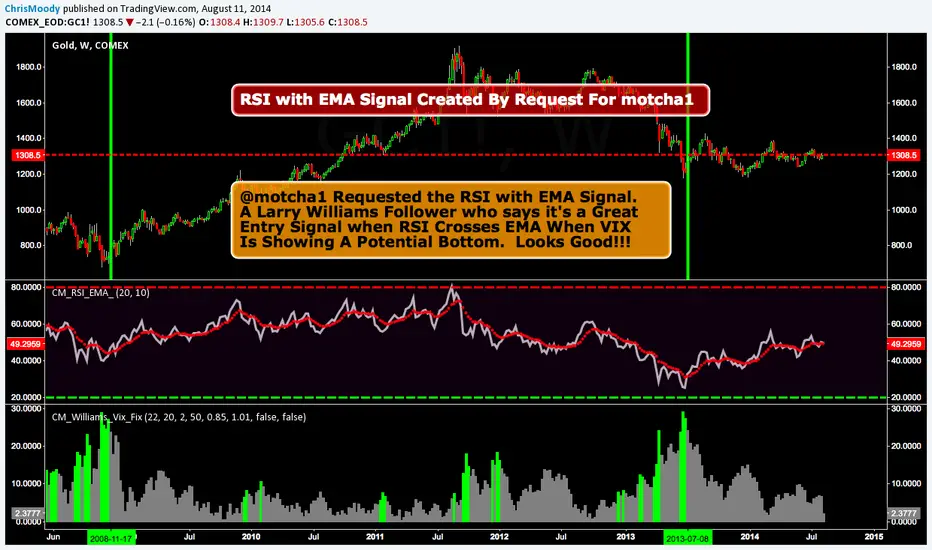
CM_Williams_Vix_Fix Finds Market BottomsLarry Williams Developed This Incredible Indicator. It Gives The Same Readings The VIX does for Stock Index’s…But This Indicator Works on All Asset Classes.
I Customized The Settings Slightly To Create “Percentile” Based Highlight Bars…So You May Need To Adjust Slightly For Your Asset Class. These Are The Standard Settings Shown Here. Designed For Daily Charts…But Works GREAT On Intra-Day Charts!!!
