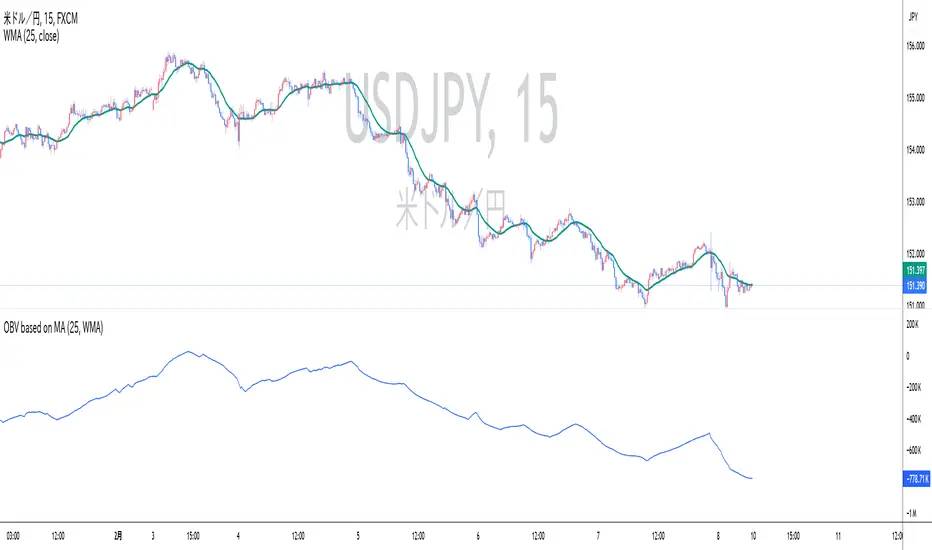
OBV based on MADescription:
This indicator calculates On-Balance Volume (OBV) based on the direction of a Simple Moving Average (SMA). Instead of using price movements, this OBV adds or subtracts volume depending on whether the SMA is rising or falling.
SMA-based OBV: When the SMA rises, the volume is added to the OBV. When the SMA falls, the volume is subtracted from the OBV. This allows traders to observe cumulative volume in relation to the wave patterns created by the SMA.
SMA Period: The period of the SMA can be customized, allowing traders to adjust it according to the wave size they want to observe.
While the cumulative volume indicator already exists, traders who analyze volume patterns can use this indicator to more easily conduct volume analysis across different wave sizes.
Inputs:
SMA Period: Defines the lookback period for calculating the Simple Moving Average (default is 25).
Ideal for:
Traders who want to analyze volume flow relative to moving average trends, rather than price movements. This can help identify underlying strength or weakness in market trends.
説明:
このインジケーターは、単純移動平均(SMA)の方向に基づいてオンバランス・ボリューム(OBV)を計算します。価格の動きではなく、SMAが上昇しているときは出来高を加算し、SMAが下降しているときは出来高を減算します。
SMA基準のOBV: SMAが上昇している場合はOBVに出来高が加算され、SMAが下降している場合は出来高が減算されます。これにより、SMAが作る波形に即した累積出来高を観察することができます。
SMA期間: トレーダーが見たい波のサイズ感に応じて、SMAの期間をカスタマイズできます。
既に累積出来高(Cumulative Volume)というインジケーターは存在しますが、波形を基に出来高を分析しているトレーダーは、このインジケーターを使うことで、様々なサイズの波形に即した出来高分析をより簡単に行うことができます。
入力項目:
SMA期間: 単純移動平均の計算に使用される期間を定義します(デフォルトは25)。
適しているトレーダー:
より波形に即した累積出来高分析を重視するトレーダーに最適です。
חפש סקריפטים עבור "volume indicator"
Big Volume Highlighter ADVANCEDBIG VOLUME HIGHLIGHTER INDICATOR ADVANCED
The BIG VOLUME INDICATOR ADVANCED is an essential tool for traders who want to gain a deeper understanding of market dynamics through volume analysis. This advanced indicator highlights significant volume spikes, enabling traders to make more informed decisions based on market activity and price movements.
Key Features:
Customizable Lookback Period: Define the number of candles over which the highest volume is calculated, allowing you to adjust the analysis to fit your specific trading strategy and timeframe.
Approximate Volume Matching: Activate the approximate volume matching feature to identify candles that fall within a specified range of a target volume. This feature is particularly valuable for capturing notable volume spikes that may not match your exact input but are within an acceptable tolerance.
Flexible Volume Units: Input volumes in various units (Hundreds, Thousands, Millions, or Billions) to cater to your trading preferences. This flexibility ensures that you can analyze volume data in a way that aligns with your trading style.
Dynamic Tolerance Calculation: Set a percentage-based tolerance for volume matching, allowing for greater flexibility. For instance, if you input a volume of 600 million with a tolerance of 1.5%, the indicator will highlight candles with volumes ranging from 591 million to 609 million.
Visual Alerts: Highlighted candles are marked with clear, color-coded labels positioned above the bars. Green labels represent bullish candles, while red labels denote bearish candles, providing immediate visual feedback on market sentiment.
Mobile and Desktop Compatibility: Designed for seamless integration with TradingView, this indicator is accessible on both desktop and mobile devices, ensuring that you can monitor the market wherever you are.
How to Use:
Set the Lookback Period: Adjust the lookback period to analyze a specific number of candles for volume spikes.
Enable Approximate Volume Matching: If desired, toggle the approximate volume matching feature and enter your target volume, selecting the appropriate unit.
Adjust Tolerance: Define the tolerance percentage to specify how close the volume must be to your input for it to be considered significant.
Analyze the Chart: Observe the highlighted candles on your chart, which indicate significant volume activity based on your criteria.
Make Informed Decisions: Leverage the insights provided by the indicator to guide your trading decisions, identifying potential entry or exit points based on volume analysis.
****

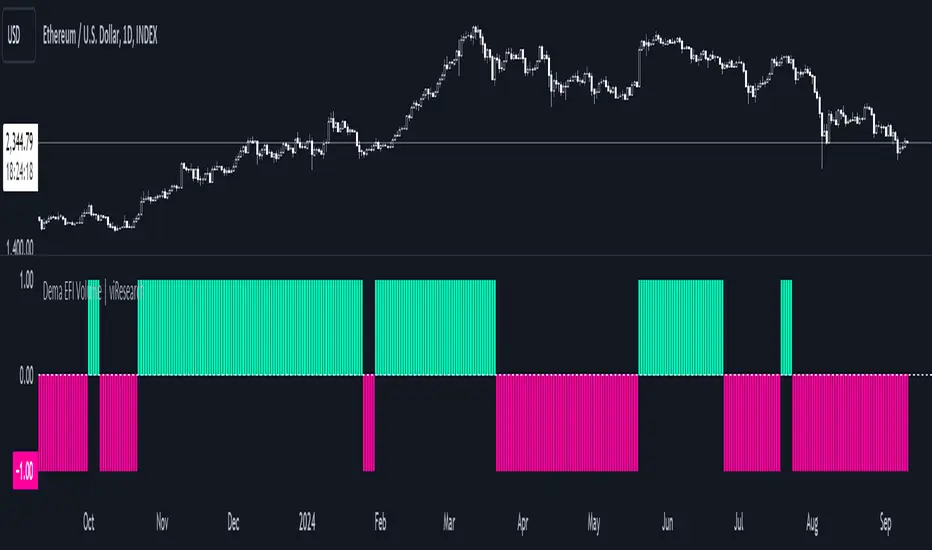
Dema EFI Volume | viResearchDema EFI Volume | viResearch
Conceptual Foundation and Innovation
The "Dema EFI Volume" indicator from viResearch integrates the Double Exponential Moving Average (DEMA) with the Elder Force Index (EFI), providing a dynamic approach to analyzing both price trends and volume strength. The DEMA is applied to smooth out price fluctuations while minimizing lag, which enhances the ability to detect trend direction. The EFI, developed by Dr. Alexander Elder, measures the power behind price movements by incorporating both price change and volume. This indicator, when combined with DEMA smoothing, gives traders a more accurate understanding of whether the current price movements are supported by significant volume, helping them make more informed trading decisions. The combination of DEMA and EFI allows traders to track trend strength while assessing the market’s volume dynamics, offering a more reliable method for identifying potential trend continuations or reversals.
Technical Composition and Calculation
The "Dema EFI Volume" script consists of two key components: the Double Exponential Moving Average (DEMA) and the Elder Force Index (EFI). The DEMA is applied to the selected source price over a user-defined length, providing a smoothed representation of price movements while reducing the noise that can occur with traditional moving averages. The EFI is calculated by multiplying the change in the DEMA by the volume over a user-defined period, which indicates whether the price movement is being driven by strong or weak volume. The script monitors the EFI values and volume data to generate trend signals. If the EFI is positive and volume increases, this indicates bullish pressure, while a negative EFI with decreasing volume suggests bearish conditions. The combination of these signals helps traders determine whether a price move is backed by sufficient volume, making it easier to identify trend continuations or potential reversals.
Features and User Inputs
The "Dema EFI Volume" script offers several customizable inputs, allowing traders to adapt the indicator to their specific strategies. The DEMA Length controls the smoothing applied to the price data, while the EFI Length defines the period over which the force index is calculated. Additionally, traders can set alert conditions for when a bullish or bearish EFI signal occurs, enabling them to react quickly to changing market conditions.
Practical Applications
The "Dema EFI Volume" indicator is designed for traders who want to combine price trend analysis with volume dynamics in a single tool. This makes it particularly effective for identifying trend continuations, as rising volume alongside a positive EFI suggests that the market move is supported by strong momentum. Conversely, decreasing volume and a negative EFI may indicate a weakening trend, giving traders early warning of potential reversals. The combination of DEMA and EFI also makes this indicator valuable for detecting trend strength by measuring whether price movements are backed by strong volume, confirming trend reversals by comparing price changes with volume activity, and improving trade entries and exits by analyzing both price and volume for more robust signals.
Advantages and Strategic Value
The "Dema EFI Volume" script offers significant advantages by combining the DEMA’s smoothing power with the EFI’s volume analysis. This integration allows traders to filter out noise in price data while ensuring that trend signals are backed by meaningful volume. The result is a more reliable tool for trend-following and reversal detection, making it easier for traders to stay aligned with strong market moves while avoiding false signals caused by low-volume fluctuations. The dual focus on price and volume makes the "Dema EFI Volume" an ideal tool for traders who value a comprehensive approach to market analysis.
Alerts and Visual Cues
The script includes alert conditions that notify traders when a significant EFI signal occurs. The "EFI Volume Long" alert is triggered when the EFI is positive and volume increases, indicating a potential upward trend. The "EFI Volume Short" alert signals a possible downward trend when the EFI turns negative and volume decreases. Visual cues, such as the color and direction of the plotted EFI line, help traders quickly identify trend shifts and make timely decisions.
Summary and Usage Tips
The "Dema EFI Volume | viResearch" indicator provides traders with a powerful tool for analyzing both price trends and volume strength. By incorporating this script into your trading strategy, you can improve your ability to detect trend continuations and reversals, making more informed decisions based on a combination of price movement and volume dynamics. Whether you are focused on identifying trend strength or looking for early reversal signals, the "Dema EFI Volume" offers a reliable and customizable solution for traders of all levels.
Note: Backtests are based on past results and are not indicative of future performance.
Rempi Volume
Greetings, dear traders. I present to your attention the concept of a Rempi Volume indicator + info table.
Rempi Volume displays volume in a color palette, where:
gray color - very weak volume,
blue color - weak volume,
green color - normal volume,
orange color - high volume,
red color - very high volume,
purple color - ultra high volume
The indicator also supports the function of displaying a moving average, the default is 20.
The indicator can color bars on the main price chart, depending on how much volume is currently inside the bar.
The Rempi Volume indicator table has the following information for the trader:
Current Bar -information about the current bar: its volume in real time, as well as the percentage of buyers and sellers.
Previous Bar - information about the previous bar: its volume, as well as the percentage of buyers and sellers. (data is updated at bar close)
10 Bar Volume Comparison - data on the volume of buyers or sellers for the previous 10 bars on the chart.
Volume Change - changing the amount of volume between the current and previous bar, in real time.
Average Volume - average trading volume for the current day.
Market Volatility - market volatility and recommendations.
Current Trend - current trend on the market.
RSI - RSI indicator and recommendations.
/////////////////////////////////////////////////////////////
Приветствую вас уважаемые трейдеры. Вашему вниманию представляю концепт индикатора объемов Rempi Volume + информативная таблица.
Rempi Volume отображает объем в цветовой палитре , где:
серый цвет - очень слабый объем,
голубой цвет - слабый объем,
зеленый цвет - нормальный объем,
оранжевый цвет - высокий объем,
красный цвет - очень высокий объем,
фиолетовый цвет - ультра высокий объем
Также индикатор поддерживает функцию отображения скользящей средней, по умолчанию равна 20.
Индикатор может окрашивать бары на основном графике цены, в зависимости ,какой объем в данный момент внутри бара.
Таблица индикатора Rempi Volume имеет следующую информацию для трейдера:
Current Bar - информация о текущем баре: его объем в режиме реального времени, а также процентное соотношение покупателей и продавцов.
Previous Bar - информация о предыдущем баре: его объем , а также процентное соотношение покупателей и продавцов. ( данные обновляются на закрытии бара )
10 Bar Volume Comparison - данные об объеме покупателей или продавцов за предыдущие 10 баров на графике.
Volume Change - изменение количества объема между текущим и предыдущим баром,в режиме реального времени.
Average Volume - средний объем торгов за текущий день.
Market Volatility - волатильность рынка и рекомендации.
Current Trend - текущее направление рынка.
RSI - показатель RSI и рекомендации.

VSA Wyckoff Volume with Bubbles Introducing the "VSA Wyckoff Volume" indicator—a powerful tool for traders who want to visualize and analyze market volume with precision. This indicator leverages Volume Spread Analysis (VSA) and Wyckoff principles to categorize volume into six distinct levels: Ultra High, Very High, High, Normal, Low, and Very Low. Each level is represented by a color-coded bubble on the chart, with bubble sizes adjusted according to the volume intensity. Additionally, the indicator incorporates an ATR-based positioning system, ensuring that each bubble is placed accurately on the chart for easy interpretation. Whether you're an experienced trader or new to the market, this indicator provides clear insights into market activity, helping you make more informed trading decisions.
Volume Spread Analysis (VSA) is a trading methodology that analyzes the relationship between volume, price, and the spread (range) of a price bar. It was developed by Tom Williams, who combined his experience as a trader with principles derived from Richard D. Wyckoff's work on market manipulation.
Key Concepts of VSA:
Volume: The amount of a particular asset traded during a specific time period. In VSA, volume is a key indicator of market activity and is used to understand the strength or weakness behind price movements.
Spread: The range between the high and low of a price bar. The spread, when analyzed in conjunction with volume, can indicate whether the market is being driven by strong or weak hands.
Price: The actual value at which an asset is traded. VSA looks at price in relation to volume and spread to identify the intentions of smart money (large institutional traders).
How VSA Works:
VSA aims to uncover the footprints of smart money by analyzing the volume and price spread. The core idea is that significant price movements accompanied by high volume indicate the involvement of professional traders, while price movements on low volume might suggest that the move lacks conviction or is driven by retail traders.
VSA in Practice:
High Volume, Narrow Spread: This could indicate supply coming into the market as professional traders sell into the buying pressure, leading to potential price weakness.
High Volume, Wide Spread, Price Up: This often suggests strong buying interest, with smart money pushing prices higher.
Low Volume, Wide Spread: A sign of a potential weak market, where price is moving without strong participation, indicating that the move may not be sustainable.
Applications:
VSA is particularly useful for identifying potential turning points in the market, understanding market sentiment, and anticipating future price movements based on the actions of smart money. Traders who use VSA often combine it with other technical analysis tools to build a comprehensive trading strategy.
Your "VSA Wyckoff Volume" indicator, by categorizing volume into distinct levels and visualizing it on the chart, provides an enhanced way to apply VSA principles and understand the underlying market dynamics.

Bullish/Bearish VolumeThe "Bullish/Bearish Volume" indicator helps traders identify discrepancies between price movement and trading volumes. Sometimes the price trends in one direction while trading volumes indicate opposing intentions among market participants. This indicator aims to identify such divergences, assisting traders in making more informed and balanced trading decisions.
Key features:
1. Directional Volume Differences: The indicator calculates volumes by separating them into two main categories: buying and selling. When the closing price is higher than the opening price, buying volume is shown in green, while selling volume is shown in red when the closing price is lower than the opening price. This accurate classification helps identify which volume type predominates in the current interval.
2. Histograms by Fixed Time Intervals: Collecting data from a fixed time interval (1 minute), the indicator analyzes and sums up buying and selling volumes regardless of the selected chart timeframe. This provides a more detailed market view, allowing traders to accurately gauge sentiment within any chosen timeframe.
3. Total Volume: The indicator aggregates buying and selling volumes, representing total trading activity in gray transparent bars. This gives traders a clear visual representation of overall volume activity in the market for a selected period.
4. Volume Delta and its Moving Average: The volume delta (the difference between buying and selling volumes) is highlighted in blue, allowing for monitoring shifts in the balance of buying and selling power. Additionally, the indicator includes a moving average of the delta, shown as a blue line, to smooth out short-term fluctuations and help traders easily identify long-term trends in volume shifts.
5. Volume Volatility: A histogram representing volume volatility offers insight into trading activity variability, uncovering abnormal spikes or lulls in market dynamics.
Bullish/Bearish Volume is a powerful tool that can break down market flows into understandable signals, enabling traders to better recognize imbalances and make informed decisions.

Significant VolumeSignificant Volume Indicator for Scalpers
This indicator, designed for scalpers, identifies candles with significant volume pressure, aiding in pinpointing optimal entry points for short or long positions. Unlike traditional trend analysis tools, this indicator focuses specifically on volume dynamics to assist traders in identifying ideal trade setups for quick, short-term trades.
**Key Features:**
1. **Volume Analysis:** Utilizes volume data to highlight candles with significant buying or selling pressure.
2. **Moving Average:** Calculates a simple moving average of volume to provide a reference for determining the significance of current volume levels.
3. **Volume Pressure:** Evaluates volume pressure based on the difference between buy and sell pressures over a specified lookback period.
4. **Customizable Parameters:** Allows users to adjust parameters such as SMA period and lookback period to fine-tune the indicator to their trading preferences and strategies.
**Ideal Usage:**
- **Scalping Strategy:** Tailored for traders employing scalping strategies who seek to capitalize on short-term price movements.
- **Entry Point Identification:** Helps traders identify candles with notable volume activity, indicating potential entry points for short or long positions.
- **Volume Confirmation:** Provides additional confirmation for trade setups by highlighting candles with significant volume pressure.
**Disclaimer:** This indicator is designed specifically for scalping purposes and may not be suitable for other trading styles or purposes.

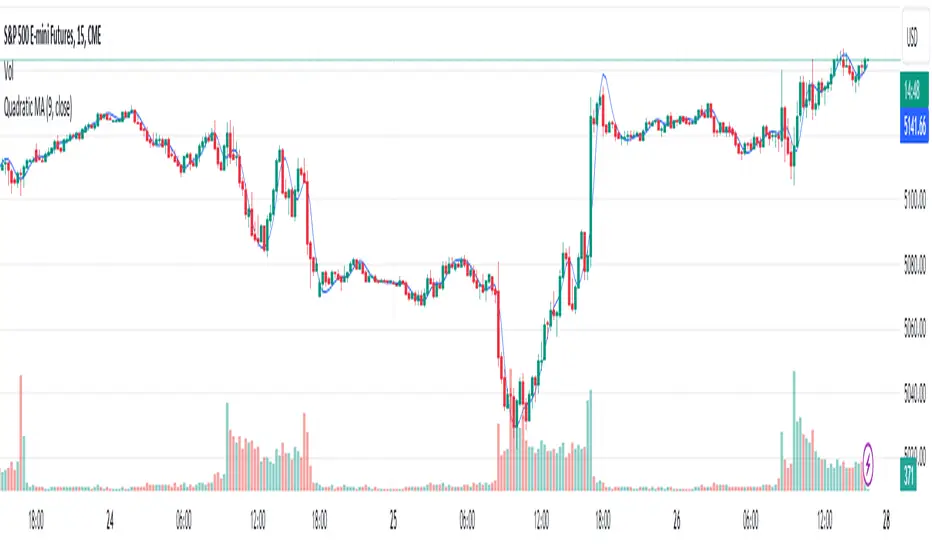
Quadratic MAThe Quadratic Moving Average (QMA) is an advanced smoothing indicator that provides a smoother and more responsive moving average by applying the Weighted Moving Average (WMA) methodology in a unique, multi-layered approach. This indicator is especially useful for identifying trends in highly volatile markets where data points vary significantly.
Calculation:
The QMA is calculated by first determining a basic WMA over half the specified period and then modifying it by subtracting the WMA over the full period, effectively emphasizing recent price changes. This result is then re-smoothed using another WMA function applied over the square root of the specified length, providing a quadratic enhancement to the typical WMA.
Usage:
The QMA can be particularly effective in trend-following strategies. When the price moves above the QMA line, it may indicate a bullish trend, suggesting a potential buy signal. Conversely, if the price falls below the QMA line, it may signal a bearish trend, indicating a potential sell signal.
Settings:
Length: Controls the sensitivity of the QMA to price changes. A shorter length will make the QMA more responsive to price changes, while a longer length will smooth out the moving average further, potentially reducing the number of signals and noise.
Tips:
Combine the QMA with other forms of analysis, such as volume indicators or momentum oscillators, to confirm trends and refine trading signals.
Adjust the length parameter according to your trading style and the asset's volatility to optimize performance.
Volume NThe Volume Indicator provides a visual representation of trading volume, expressed in U.S. dollars, directly on your chart. It multiplies each candle's closing price by its volume to compute the volume in dollar terms, offering a clearer perspective on market activity relative to price movements.
Features:
Volume Calculation: The indicator calculates the volume in dollar terms by multiplying the closing price by the trading volume of each bar.
Color Coding: Bars are colored to highlight significant trading activity. Standard bars are displayed in blue, whereas bars representing the highest trading volume over the latest 10-bar period are colored red.
Dynamic Labels: Red bars, indicating peak volume within the specified period, feature dynamically positioned labels that display the dollar amount, formatted to three significant figures. Labels are appended with "M" for millions or "B" for billions as appropriate, followed by a dollar sign to denote currency.
Automatic Label Adjustment: To avoid label overlap and maintain chart clarity, labels adjust their vertical positioning automatically based on proximity to other labels.
Usage:
This indicator is particularly useful for traders who wish to assess the strength of price movements in conjunction with volume. By quantifying volume in dollar terms, it provides a more standardized measure of trading intensity, which can be beneficial for making informed trading decisions in both high and low volatility environments.

Volume Breakout [Afnan]Introducing the Relative Volume / Volume Breakout Multiplier (RVI) , RVI is specifically designed for traders who incorporate volume breakout analysis into their trading strategies, particularly breakout traders.
This indicator provides a unique perspective on volume dynamics by quantifying the extent of volume breakouts in relation to the Simple Moving Average (SMA). It offers an upgraded version of the default volume indicator on TradingView, with the added feature of Relative Volume.
For example, if the volume SMA is 100M and the current volume is 200M, the indicator will return a breakout number of 2.0, indicating that the current volume is twice that of the volume SMA. Conversely, if the volume SMA is 100M and the current volume is 50M, the indicator will return a value of 0.50, indicating that the current volume is half of the volume SMA.
This tool can be a very helpful for breakout traders, helping them identify potential trading opportunities and assess volume strength more effectively. this indicator is a must-have in the toolkit of any trader who focuses on volume breakout analysis.
Remember, every tool we use, every analysis we perform, is a step towards becoming better traders. So, let’s embrace this journey of continuous learning and improvement together. As the saying goes, “The only limit to our realization of tomorrow will be our doubts of today." Let’s step into the future with confidence, armed with the right tools and the right mindset.
Lastly, a big thank you for your support, your likes, and your comments. They mean a lot! If you have any questions, feel free to ask. Together, let’s make trading a rewarding experience!

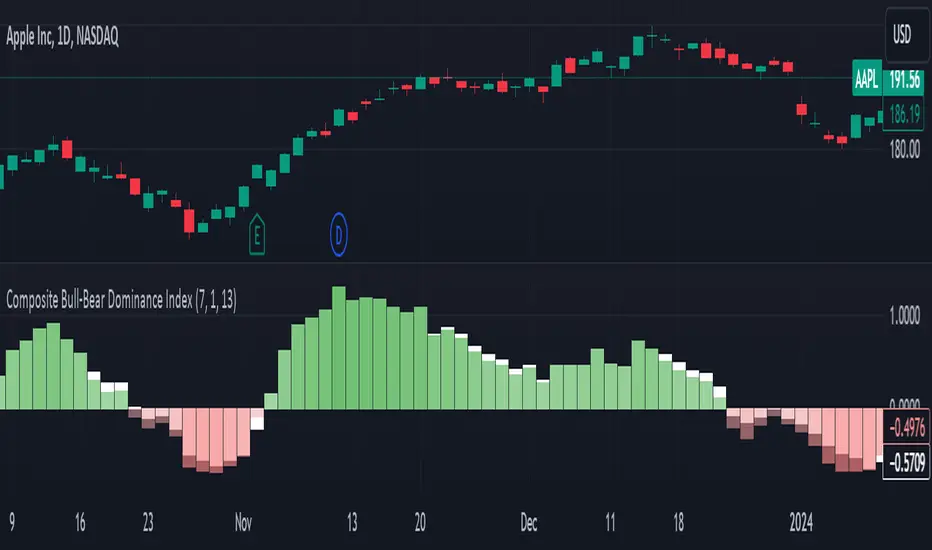
Composite Bull-Bear Dominance IndexNote: CREDITS: This is based on the Up Down Volume Indicator (published in Trading View) and Elder Ray Index (Bull Bear Power).
The Composite Bull Bear Dominance Index (CBBDI) is a indicator that combines up down volume analysis with Bull and Bear Power to provide a comprehensive view of market dynamics. It calculates Z-scores for up down volume delta and bull bear power measures, averages them, and then smoothes the result using Weighted Moving Average (WMA) for Bull and Bear Power and Volume Weighted Moving Average (VWMA) for Up and Down Volume Delta. The advantages include responsiveness to short-term trends, noise reduction through weighting, incorporation of volume information, and the ability to identify significant changes in buying and selling pressure. The indicator aims to offer clear signals for traders seeking insights into overall market dominance and indicate if the bulls or the bears have the upper hand.
Volume Analysis (Up/Down Volume Delta):
Up/Down Volume Delta reflects the net difference between buying and selling volume, providing insights into the prevailing market sentiment.
Positive Delta: Indicates potential bullish dominance due to higher buying volume.
Negative Delta: Suggests potential bearish dominance as selling volume surpasses buying volume.
Price Analysis (Bull and Bear Power):
Bull and Bear Power measure the strength of buying and selling forces based on price movements and the Exponential Moving Average (EMA) of the closing price.
Positive Bull Power: Reflects bullish dominance, indicating potential upward momentum.
Positive Bear Power: Suggests bearish dominance, indicating potential downward momentum.
Composite Bull Bear Dominance Index (CBBDI):
CBBDI combines the standardized Z-scores of Up/Down Volume Delta and Bull Bear Power, providing an average measure of both volume and price-related dominance.
Positive CBBDI: Indicates an overall bullish dominance in both volume and price dynamics.
Negative CBBDI: Suggests an overall bearish dominance in both volume and price dynamics.
Smoothing Techniques:
The use of Weighted Moving Average (WMA) for smoothing Bull and Bear Power Z-scores, and Volume Weighted Moving Average (VWMA) for smoothing Up/Down Volume Delta, reduces noise and provides a clearer trend signal.
Smoothing helps filter out short-term fluctuations and emphasizes more significant trends in both volume and price movements.
Color Coding:
CBBDI values are color-coded based on their direction, visually representing the prevailing market sentiment.
Green Colors: Positive values indicate potential bullish dominance.
Red Colors: Negative values suggest potential bearish dominance.
Split VolumeThe Split Volume indicator displays 'Upwards' and 'Downwards' volume with an additional method for distributing 'split' candle volume.
A 'split' candle is a candle whose direction is...'Split'...since the open and close are equal. (Ex. Doji)
Upwards and Downwards Volume is tracked by comparing the Open and Closes of the Lower Timeframes.
If the Close is Greater-than the Open, we track the Volume as 'Upwards' Volume.
If the Close is Less-than the Open, we track the Volume as 'Downwards' Volume.
If the Close and Open are Equal, we assume that the Volume is an even split 50/50, and track it as such.
The indicator pulls data from lower timeframes to achieve more granular Open,Close,& Volume Data
Specifically:
<5m Timeframe: 1 Second LTF
<60m Timeframe: 5 Second LTF
<1D Timeframe: 1 Minute LTF
>1D Timeframe: 60m LTF
We have also included some nice-to-have features
50% Volume Line: This line splits each columns in half, this is used as quick reference to see exactly which side the volume is on.
High Volume Candle Identification: We are detecting bars with high relative volume and coloring them on the upper chart for use as important zones.
Status Line Readouts: The Status line for this indicator is formatted for simple reading. It Reads(Left-to-Right):Total Volume, Downwards Volume, 50% Value, Upwards Volume

Volume Delta Trailing Stop [LuxAlgo]The ' Volume Delta Trailing Stop ' indicator uses Lower Time Frame (LTF) volume delta data which can provide potential entries together with a Volume-Delta based Trailing Stop-line .
🔶 USAGE
Our 'Volume Delta Trailing Stop' script can show potential entries/Stop Loss lines
A trigger line needs to be broken before a position is taken, after which a Volume Delta-controlled Trailing Stop-line is created:
🔶 DETAILS
🔹 Volume rises when bought or sold
🔹 When the opening price appears on the chart, a buy/sell order has been executed.
If that order is less than the available supply of that particular price, volume will rise, without moving the price.
🔹 When the opening price is the same as the closing price, the volume of that bar can be seen as "neutral volume" (nV); nor "up", nor "down" volume.
Example
A buy order doesn't fill the first available supply in the order book. This price will be the opening price with a certain volume.
When at closing time, price still hasn't moved (the first available supply in the order book isn't filled, or no movement downwards),
the closing price will be equal to the opening price, but with volume. This can be seen as "neutral volume (nV)".
🔹 Delta Volume (ΔV): this is "up volume" minus "down volume"
🔹 Standard volume is colored red when closing price is lower than opening price ( = "down volume").
🔹 Standard volume is colored green when closing price is higher OR equal (nV) than opening price ( = "up volume").
🔹 Neutral Volume
The "Neutral-Volume" is considered "Up-Volume" - setting will dictate whether nV is considered as green 'buy' volume or not.
🔶 EXAMPLE
29 July 10:00 -> 10:05, chart timeframe 5 minutes, open 29311.28, close 29313.89
close > open, so the volume (39.55) is colored green ("up volume").
(The Volume script used in the following examples is the open-source publication Volume Columns w. Alerts (V) from LucF )
Let's zoom to the 1-minute TF:
The same period is now divided into more bars, volume direction (color) is dependable on the difference between open and close.
Counting up and down volume gives a more detailed result, it remains in an upward direction though):
(ΔV = +15.51)
Let's further zoom in to the 1-second TF:
The same period is now divided into even more bars (more possibility for changing direction on each bar)
Here we see several bars that haven't moved in price, but they have volume ("neutral" volume).
(neutral volume is coloured light green here, while up volume is coloured darker green)
When we count all green and red volume bars, the result is quite different:
(ΔV = -0.35)
In total more volume is found when price went downwards, yet price went up in these 5 minutes.
-> This is the heart of our publication, when this divergence occurs, you can see a barcolor changement:
• orange: when price went up, but LTF Volume was mainly in a downward direction.
• blue: when price went down, but LTF Volume was mainly in an upwards direction.
When we split the green "up volume" into "up" and "neutral", the difference is even higher
(here "neutral volume" is colored grey):
(ΔV = -12.76; "up" - "down")
🔶 CONCEPTS
bullishBear = current bar is red but LTF volume is in upward direction -> blue bar
bearishBull = current bar is green but LTF volume is in downward direction -> orange bar
🔹 Potential positioning - forming of Trigger-line
When not in position, the script will wait for a divergence between price and volume direction. When found, a Trigger-line will appear:
• at high when a blue bar appears ( bullishBear ).
• at low when an orange bar appears ( bearishBull ).
Next step is when the Trigger-line is broken by close or high/low (settings: Trigger )
Here, the closing price went under the grey Trigger-line -> bearish position:
🔹 Trailing Stop-line
When the Trigger-line is broken, the Trailing Stop-line (TS-line) will start:
• low when bullish position
• high when bearish position
You can choose (settings -> Trigger -> Close or H/L ) whether close price or high/low should break the Trigger-line
When alerts are enabled ("Any alert() function call"), you'll get the following message:
• ' signal up ' when bullish position
• ' signal down' when bearish position
After that, the TS-line will be adjusted when:
• a blue bullishBear bar appears when in bullish position -> lowest of {low , previous blue bar's high or orange bar's low}
• an orange bearishBull bar appears when in bearish position -> highest of {high, previous blue bar's high or orange bar's low}
When alerts are enabled ("Any alert() function call"), and the TS-line is broken, you'll get the following message:
• ' TS-line broken down ' when out bullish position
• ' TS-line broken up ' when out bearish position
🔹 Reference Point
Default the direction of price will be evaluated by comparing closing price with opening price.
When open and close are the same, you'll get "neutral volume".
You can use "previous close" instead (as in built-in volume indicator) to include gaps.
If close equals open , but close is lower than previous close , it will be regarded as " down volume ",
similar, when close is higher than previous close , it will be regarded as " up volume "
Note, the setting applies for the current timeframe AND Lower timeframe:
Based on: " open " (close - open)
Based on: " previous close " (close - previous close)
🔹 Adjustment
When the TS-line changes, this can be adjusted with a percentage of price , or a multiple of " True Range "
Default (Δ line -> Adjustment - 0)
Δ line -> Adjustment 0.03% (of price)
Δ line -> Mult of TR (10)
🔶 SETTINGS
🔹 LTF: choose your Lower TimeFrame: 1S (seconds), 5S, 10S, 15S, 30S, 1 minute)
🔹 Trigger: Choose the trigger for breaking the Trigger-line ; close or H/L (high when bullish position, low when bearish position)
🔹 Δ line ( Trailing Stop-line ): add/subtract an adjustment when the TS-line changes ( default: Adjustment ):
• Adjustment ( default: 0 ): add/subtract an extra % of price
• Mult of TR : add/subtract a multiple of True Range
🔹 Based on: compare closing price against:
• open
• previous close
🔹 "Neutral-Volume" is considered "Up-Volume" : this setting will dictate whether nV is considered as green 'buy' volume or not.
🔶 CONSIDERATIONS
🔹 The lowest LTF (1S) will give you more detail and will get data close to tick data.
However, a maximum of 100,000 intrabars can be used in calculations .
This means on the daily chart you won't see anything since 1 day ~ 86400 seconds. (just over 1 bar)
-> choose a lower chart timeframe, or choose a higher LTF (5S, 10S, ... 1 minute)
🔹 Always choose a LTF lower than the current chart timeframe.
🔹 Pine Script™ code using this request.security_lower_tf() may calculate differently on historical and real-time bars, leading to repainting .

RSI Xray + VolumeRSI Analysis:
The indicator calculates the Relative Strength Index (RSI) using a user-defined length (default: 14).
It colors the bars based on RSI levels to identify potential overbought and oversold conditions.
Bars exceeding the overbought level (default: 70) are colored, while bars below the oversold level (default: 30) are colored too.
This helps traders identify potential trend reversals or market exhaustion points.
Midpoint Analysis:
The indicator calculates the midpoint of each bar, which is the average of the high and low prices.
It colors the bars based on their relation to the midpoint.
Bars above the midpoint are colored, indicating potential bullish momentum.
Bars below the midpoint are colored, suggesting potential bearish momentum.
Volume Analysis:
The indicator offers the ability to analyze volume changes and identify high volume bars.
It colors the bars when the volume exceeds a user-defined threshold.
This feature helps traders identify potential areas of market interest and increased participation.
Moving Average (SMA):
The indicator plots a Simple Moving Average (SMA) line of the closing price over a user-defined period (default: 9).
This moving average line helps traders identify potential trends and spot areas of support or resistance.
RSI Extreme Conditions:
The indicator identifies extreme RSI conditions by comparing the current RSI value with the highest and lowest RSI values calculated from a user-defined number of previous bars (default: 10).
When the RSI exceeds the overbought level but is lower than the highest RSI value within the specified range, the bar color changes to a customizable color (default: blue).
Conversely, when the RSI falls below the oversold level but is higher than the lowest RSI value within the specified range, the bar color changes to the same customizable color.
This feature helps traders identify potential RSI-based trading opportunities and market turning points.
Customization:
The indicator offers customizable settings for colors, RSI levels, SMA length, volume thresholds, RSI extreme levels, and RSI label color.
Traders can modify these settings based on their preferences and trading strategies.
Overall, the 'RSI Xray + Volume' indicator provides a comprehensive view of RSI levels, market momentum, volume changes, and RSI extreme conditions. Traders can use this information to identify potential trade setups, validate market trends, and make more informed trading decisions. It can be applied to various timeframes and instruments, making it a valuable tool for both short-term and long-term traders.
Volume+The enhanced Volume+ Indicator is a valuable tool that builds upon the traditional Volume indicator by incorporating a technique known as linear prediction.
In traditional Volume analysis, the volume data for a bar is only known once the bar has closed. However, with the enhanced Volume+ Indicator, we utilize linear prediction to estimate the closing volume of the k-bar before it actually closes. This estimation is based on historical volume observed in the market.
By employing this indicator, traders and investors can gain an early insight into the potential volume of the current bar, even before it concludes. This can be particularly useful for those who wish to make informed decisions based on volume analysis and its impact on price movements.
===========================中文版本===========================
增强的Volume+指标是一个有价值的工具,它通过结合一种称为线性预测的技术建立在传统成交量指标的基础上。
在传统的成交量分析中,只有在柱线收盘后才能知道柱线的成交量数据。然而,通过增强的Volume+指标,我们利用线性预测来估计 k 柱实际收盘前的收盘成交量。该估计基于市场观察到的历史交易量。
通过使用该指标,交易者和投资者可以在k柱结束之前就尽早了解当前柱的潜在交易量。对于那些希望根据交易量分析及其对价格变动的影响做出明智决策的人来说,这尤其有用。

Ectopic Bar by Moti RakamEctopic Bar is an indicator that highlights a pin-bar candle that has divergence in it's shape and volume delta. To find volume delta, code of standard Up/Down volume indicator has been used.
PIN BAR : pin bar are marked by using Close Range option parameter. Default value is set to 0.35 which implies any candle that closes in the 35% of its high/low will be considered a pin bar (of course the code also ensures that rest of the bar body is only a wick).
HOW IT WORKS:
Up/Down volume variables "Up Volume" and "Down Volume" are checked against the shape of the pin bar to find an ectopic situation. For example, if a bullish pin bar candle (a bullish hammer) has more sell volume than buy volume, that's an ectopic situation. The bullish hammer shows a buying push from the bottom of the wick, instead the up/down volume indicator shows there were more sell orders than buy orders. Hence the ectopic situation. Similarly, an inverted hammer (a bearish hammer) in general should have more sell volume, but instead if it has more buying volume, the indicator highlights it as an ectopic bar.
Ectopic Bars are painted in yellow colour.

Quickfingers Luc base scanner - version 2This is my second implementation of a Pine Script Quickfingers Luc (QFL) base scanner that I have published on Trading View. QFL base scanners seek to provide buy signals according to the QFL trading strategy. To profitably trade using this script you should be familiar with the QFL trading strategy, scaling in and out of positions, and money risk management.
Background
All the QFL base identification Pine Scripts that I have inspected to date use a simple candlestick pattern of two lower lows followed by two higher lows to identify a base. Some scripts may combine this with a volume indicator as well. In practice, I found the results of this approach to be somewhat unreliable. The candlestick pattern may identify some significant bases, may identify minor bases (that should not be traded), but at the same time miss other significant bases entirely!
My first QFL base scanner sought to use Pine Script’s built in ta.lowest and ta.highest functions to identify bases and peaks. This approach depended on the time period selected to find the lowest lows and highest highs. This approach can be problematic because significant bases may be formed outside the nominated time period, leading to the identification of minor bases within the time period. I have left the first version of my QFL base scanning script in the Trading View indicators because it uses a different approach to this script that other people may still find useful.
My second version of the QFL base scanner does not use the Pine Script ta.lowest and ta.highest functions, and therefore does not rely on nominating a time period to look back through data.
User inputs
This script steps through the price data to find the following patterns that are used to confirm bases and peaks.
Base – bounce of x% above previous base confirms that base
Peak – fall of y% below previous peak confirms that peak
Buy signal – fall of z% below the base signals a buy signal.
x%, y% and z% are user configurable through the script settings. Small percentages will provide more, but riskier, buy signals; larger percentages will provide fewer, but safer, buy signals.
The script identifies QFL bases and buy signals and marks them on the price chart. These are able to be turned on and off in the script settings. The settings also allow the user to turn on plots for peaks, lowest lows and highest highs. These are not useful for applying the QFL trading strategy, but are calculations used in finding bases and can be useful for the user to understand what the script is doing in the background.
Troubleshooting
If looking at the past script results, you may think that the script is perfectly timing entry points at the bottom of market dips. This is NOT the case. The script is actually showing buy signals when the price falls z% below the PREVIOUS base. The current base is only retrospectively marked some periods later once the reversal is confirmed – a solid line marks a confirmed base in real time; a dotted line retrospectively repaints the line to the actual base. New bases are not tradeable using this script, but a percentage fall from the previous base is – this is the QFL trading strategy.
Pine Script may flag that this script has a repainting issue. Pine Script defines repainting as, “script behavior causing historical vs realtime calculations or plots to behave differently.” In the case of this script, bases are confirmed once the price has bounced x% off the low. The script then repaints a dotted line from the base that has been identified in real time (with a solid line) back to the point in the price data where the base actually occurs. The dotted line only aids in visual identification of the base, and does not impact on the real time identification of bases. A similar repainting issue occurs for identifying peaks. I have identified the lines in the script that cause this repainting. These lines can be commented out without affecting the buy signals generated by the script, but you will also lose the visual pinpointing of historical bases and peaks.
The user may find price charts where they think that the script has not correctly identified a base or peak. Usually, careful measurement will reveal that the price chart has not confirmed a base or peak by moving x% or y% from the previous base or peak respectively.
And before you ask, yes, Trading View alerts work with this script.
Enjoy.

Buyer to Seller Volume (BSV) Indicator As promised, here is the buyer to seller volume indicator!
About it/How it works:
The indicator tracks buying and selling volume. It does it simplistically but effectively simply by looking at red vs green candles and averaging out the volume of each respective candle.
It uses the SMA of buying/selling and overall volume to track buyers to sellers and also display the average volume traded over a designated period of time.
Legend:
Green lines = buying volume
Red lines = selling volume
Yellow lines = SMA over designated period of time (user input defined, default is 14 candles).
Buyers are shown in green and sellers are shown in red:
How to Use it:
Default, the indicator goes to 1 Day, 14 candle period.
My preference personally is to use to have it go to "chart" but you can view any time period on the chart that you want and designate the time period of volume you want to view independently.
This can be used for:
1. Identify trends: When buying or selling volume is above selling volume and above the SMA, you know that this persuasively supports a bullish trend. Inverse for the opposite (see below):
2. To identify fakeouts and whether there is volume backing a move:
3. To identify potential changes in trends via a cross:
Its also a great reference when you are unsure of a move. This indicator literally just saved me from wrongfully shorting the FOMC bear flag today:
Probably many other uses you can find, but these are the things I like to use it for!
As always, I have posted a tutorial video for your reference:
As always though, if you have any questions, comments or suggestions for the indicator, please share them below!
Safe trades and best of luck to all!

Normalized VolumeOVERVIEW
The Normalized Volume indicator is a technical indicator that gauges the amount of volume currently present in the market, relative to the average volume in the market. The purpose of this indicator is to filter out with-trend signals during ranging/non-trending/consolidating conditions.
CONCEPTS
This indicator assists traders in capitalizing on the assumption that trends are more likely to start during periods of high volume compared to periods of low volume. This is because high volume indicates that there are bigger players currently in the market, which is necessary to begin a sustained trending move.
So, to determine whether the current volume is "high", it is compared to an average volume for however number of candles back the user specifies.
If the current volume is greater than the average volume, it is reasonable to assume we are in a high-volume period. Thus, this is the ideal time to enter a trending trade due to the assumption that trends are more likely to start during these high-volume periods.
More information on this indicator can be found on NNFX's video on it in his Indicator Profile series and on Stonehill Forex's blog post on it .
HOW DO I READ THIS INDICATOR
When the column's color is red, don't take any trend trades since the current volume is less than the average volume experienced in the market.
When the column's color is green, take all valid with-trend trades since the current volume is greater than the average volume experienced in the market.
.srb suite vol & infoThe volume indicator
what can replace the built-in volume indicator and It also has some useful features.
and designed to work as overlay in the same pane with open-source indicator by default.
Regular volume Indicator
Volume SMA plot
Large Volume ! emphasize by color & mark.
Ultra Volume ! overlay marking ; x2 x4 x6 lager than regular average volume. it will help you can take the reversal
BTC-agg. Volume
4 BTC-spot & 4 BTC-PERP volume aggregated.
It might helps you don't miss out on important volume flows.
Weighted to spot trading volume when using PERP+spot volume.
If enabled, BTC-agg.Vol automatically applied when selecting BTC-pair.
Information panel (optimized for crypto-currency)
BTC-PERP price & delta (when Binance:BTCUSDT selected)
BTC dominance, Binance:BTCUSDTPERP OI
Symbol, Price, Daily up/down
ATR14 (for checking current volatility)
Recommended setup for .srb suite
tradingview | chart setting > Appearance > Top margin 0%, Bottom margin 0% for optimized screen usage
tradingview | chart setting > Appearance > Right margin 57
.srb suite vol & info --> Visual Order > Bring to Front
.srb suite vol & info --> Pin to scale > No scale (Full-screen)
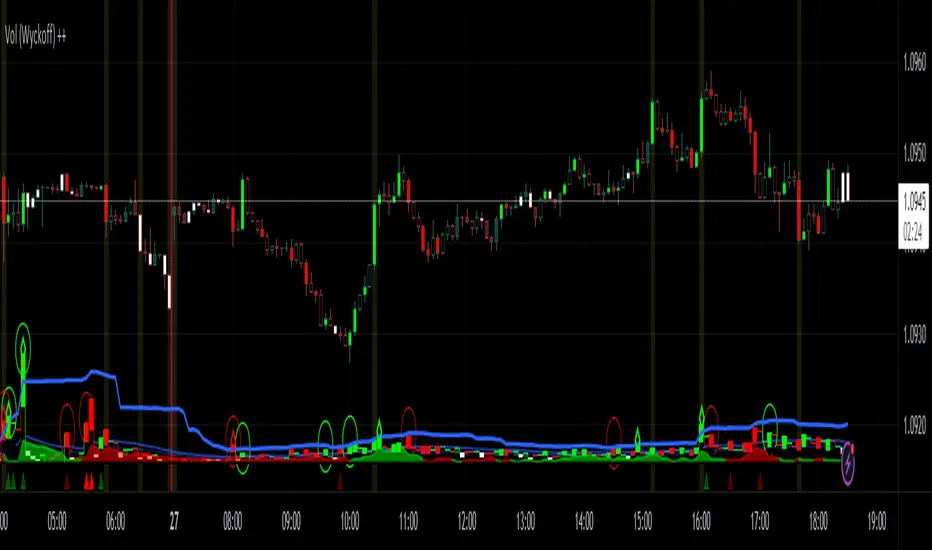
Vol (Wyckoff)I like TradingView Built-in Volume indicator, because it is overlay with price chart, and has appropriate scale.
I made similar style volume indicator and added concept of Laws of Wyckoff.
caution : You need {Chart settings} → {Appearance} → {Bottom margin} is set 0 %, to make chart look good.
: You need {Chart settings} → {Symbol} → {body} ,{Borders} and {Wick} are set dark color, to easier to identify the color of candles.
This 3 Laws of Wyckoff are my interpretation, not the original.
///////// The Law of Supply and Demand //////////
I define the Demand as volume that is larger than the previous volume and has close > open bar.
I define the Supply as volume that is larger than the previous volume and has close <= open bar.
Volume Flow is value difference between Demand MA and Supply MA.
I imitate the idea of "Volume Flow v3" by oh92.
///////// The Law of Cause and Effect //////////
Enough volume(Cause) makes reliable price movement(Effect).
If there is not enough volume, its price movement is suspicious.
I define enough volume as volume that is larger than previous volume.
I define large volume as volume that is larger than previous volume and over volume MA(using all volume).
I define "not enough volume" as volume that is smaller than previous volume.
I borrowed the idea from "The Lie Detector" by LucF.
Enough volume(increasing volume) is painted by dark color and Large volume(increasing volume and over volume MA) is painted by light color.
"Not enough volume"(decreasing volume) is painted by empty color(default is black).
This coloring are reflected to price candles.
So, you need {Chart settings} → {Symbol} → {body} ,{Borders} and {Wick} are set dark color, to easier to identify the color of candles.
///////// The Law of Effort and Result //////////
If volume (effort) cannot move price (result), it may be Absorption(potential reversal).
"Factor of Volume Density" determines the threshold of Absorption.
Small Absorption is displayed by gray square at bottom.
Large Absorption is displayed by white square at bottom.
///////// Volume Spike //////////
Volume Spike sometimes precede or confirm trend direction.
"Factor of Volume Spike" determines the threshold of Volume Spike.
Volume Spike is displayed by light bulb.
Average Dollar Normalize Volume//-------------------------------------------------------------------------------
//Brief Explanation
//--Instead of using Volume Indicator that show the volume in quantity
//--this indicator will show the volume in dollar transaction
//Indicator Value:
//-- A B C D E
//--
//Formula
//--Average Dollar Normalize Volume = Average Price x Volume
//--ADNV Ratio = ADNV / ADNV Moving Average
//--Volume Ratio = Volume / Volume Moving Average
//Setting Moving Average (used by ADNV MA & Volume MA)
//--Type: SMA : EMA
//--Length: 20 : 1 : 200
//Setting Minimum Dollar Value
//--Value: 1 : 1 : 900
//--Unit: Million : Thousand
// Bar Color Setting
//--Grow above ADNVMA : Dark Green
//--Grow but below ADNVMA: Light Green
//--Fall and above ADNVMA: Dark Red
//--Fall but below ADNVMA: Light Red
//--Grow but less than Minimum Dollar Value: Dark Black
//--Fall but less than Minimum Dollar Value: Grey
//-------------------------------------------------------------------------------
Reverse Stochastic Momentum Index On ChartIntroducing the Reverse Stochastic Momentum Index "On Chart" version
According to Investopedia :
“The Stochastic Momentum Index (SMI) is a more refined version of the stochastic oscillator, employing a wider range of values and having a higher sensitivity to closing prices.”
The SMI is considered a refinement of the stochastic oscillator developed by William Blau and introduced in 1993 in an attempt to provide a more reliable indicator, less subject to false swings.
It calculates the distance of the current closing price as it relates to the median of the high/low range of price.
The SMI has a normal range of values between +100 and -100.
When the present closing price is higher than the median, or midpoint value of the high/low range, the resulting value is positive.
When the current closing price is lower than that of the midpoint of the high/low range, the SMI has a negative value.
Here I have reverse engineered the SMI formula to derive 2 functions.
One function calculates the chart price at which the SMI will reach a particular SMI scale value.
The second function calculates the chart price at which the SMI will crossover its signal line.
I have employed those functions here to give the "crossover" price levels for :
Upper alert level ( default 40, color : aqua blue )
Mid-Line ( default value 0, color : white )
Lower alert level ( default -40, color : purple )
Signal line ( default 13, colors : bright red & lime green )
And also to give the SMI eq price ( colors : red & green )
The midline, upper and lower alert levels return the closing price which would make SMI equal to their respective values
The user can infer from this that.....
Closing above these prices will cause the Stochastic Momentum Index to cross above the associated levels
Closing below these prices will cause the Stochastic Momentum Index to cross below the associated levels
Signal line returns the closing price where Stochastic Momentum Index is equal to its signal line
The user can infer from this that.....
Closing above this price will cause the Stochastic Momentum Index to cross above the signal line
Closing below this price will cause the Stochastic Momentum Index to cross below the signal line
SMI eq price returns the closing price which would make the SMI equal to its previous value
The user can infer from this that.....
Closing above this price will cause the Stochastic Momentum Index to increase
Closing below this price will cause the Stochastic Momentum Index to decrease
Note : all returned prices have a returned value filter to replace any values below zero with zero to help prevent auto focus issues.
These levels are displayed as plotted lines on the chart and also as an optional infobox with choice of displayed info.
This allows the user to see directly on the chart the interplay between the various crossover levels and price action and to precisely plan entries, exits and stops for their SMI based trades.
Traditionally traders and analysts will consider:
Positives values above 40 indicate a bullish trend
Negative values below -40 indicate a bearish trend .
Common traditional ways to derive signals from the SMI :
When the SMI crosses below -40 and then moves back above it, a buy signal is generated.
When the SMI crosses above +40 and then moves back below it, a sell signal is generated.
When the SMI line crosses above the signal line. A signal to buy is generated
When the SMI line crosses below the signal line signal to sell is generated.
When the SMI crosses above the zeroline, signal line and the SMI eq level many interpret that as a full bullish bias signal and take trades only in that direction, vice versa for bearish bias.
Traders also look for divergences between the SMI and price action.
The SMI is often used in conjunction with the Chande Momentum Oscillator or R squared indicator to determine overall market trendiness where the SMI is used to determine the direction of the trend, and also with volume indicators to show if the momentum carries significant selling or buying pressure.
