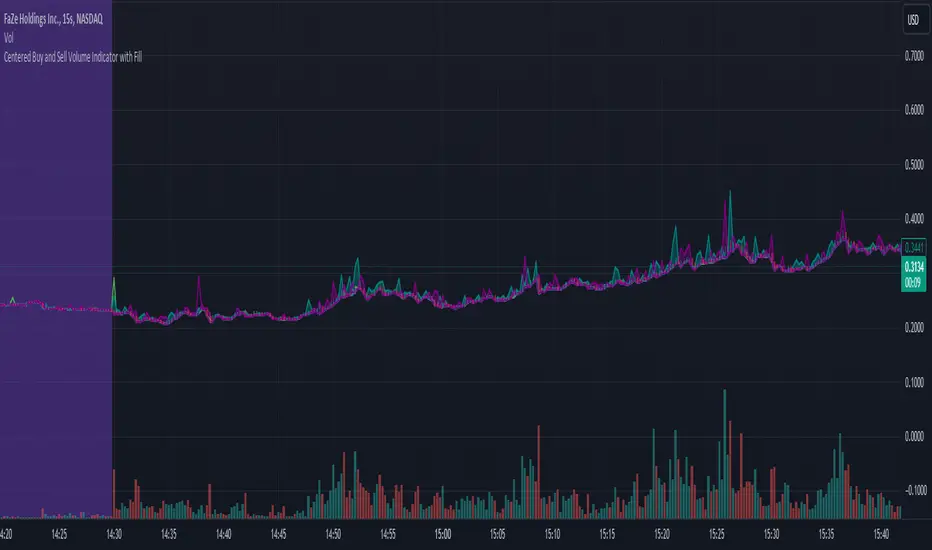
Centered Buy and Sell Volume Indicator with FillThis indicator provides an estimation of buy and sell volumes in the market. The estimated buy volume is represented by a blue-green color, while the estimated sell volume is depicted in purple. Both of these are highlighted with a solid fill. Additionally, the Rate of Change for the buy volume is shown in a solid green line, and for the sell volume, it's illustrated with a solid purple line, both without any fill.
חפש סקריפטים עבור "volume indicator"
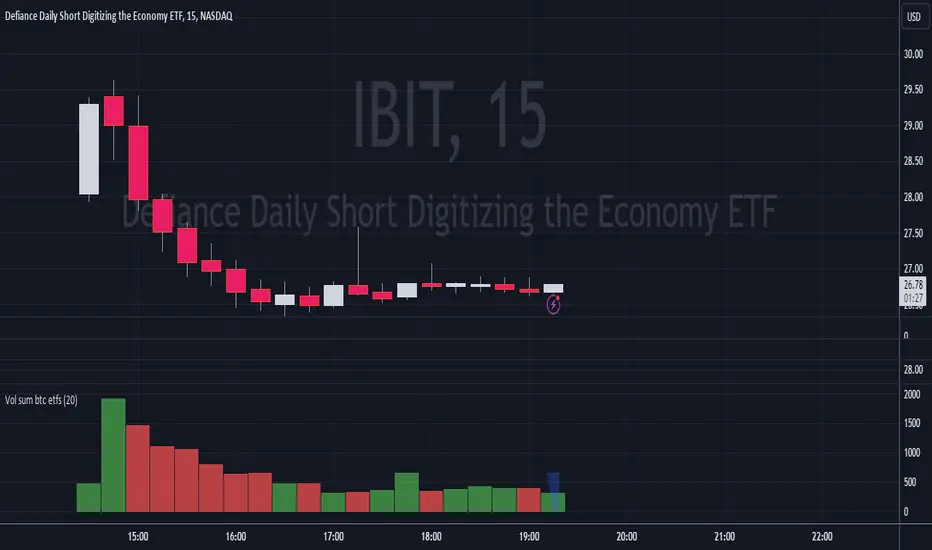
Volume Sum BTC ETFsThis volume indicator tracks the volume of these 10 bitcoin ETFS:
AMEX:GBTC, NASDAQ:IBIT, AMEX:BTCO, AMEX:ARKB, AMEX:HODL, AMEX:EZBC, NASDAQ:BRRR, AMEX:BTCW, AMEX:DEFI, AMEX:BITB
It multiplies the traded shares with the hl2 share price and then devides the volume by the bitcoin hl2 price.
You can change to usd volume in settings.
Enjoy!
Notice that historical volume comes from etfs which traded already before launch like GBTC.
Also notice that that btc trades also when tradfi markets are closed, so then the indicator will show the last available volume. Something to fix later.
Ace VolumeThis is volume indicator that can help you identify either the volume is increasing or decreasing gradually.
The color based on the previous volume price.
The bigger the volume from the previous, it will show bull color (white) and vice versa bear color (blue).
The example of the indicator volume as shown above. Feel free to used it. Thank you!
Volume [Entoryx]
Certainly! Here's a more concise description for the "Entoryx Volume" indicator, with less focus on the specifics of the order block bar detection:
The "Entoryx Volume" is a versatile technical indicator that analyzes the relationship between price ranges and volume over a user-defined number of bars. By calculating a delta between the highest high and lowest low, it offers insights into market momentum and direction.
Key features of this indicator include:
1) Current Value Plotting: A dynamic line plotted on the chart represents the current value, which reflects market trends. The color of the line changes to green for bullish conditions and red for bearish conditions, depending on its relationship with the Exponential Moving Average (EMA) of the close.
2) Color-Coded Regions: The area between the current value plot and a baseline zero line is filled with a corresponding color, providing a visual representation of market sentiment.
3) Boundary Lines: Horizontal lines at +10 and -10 serve as reference points to highlight significant market movements.
4) Order Block Bar Detection (Optional): An optional feature that places visual markers on the chart to signal potential reversals. This can be enabled or disabled by the user, according to preference.
The "Entoryx Volume" indicator is tailored for traders aiming to understand market momentum with a clear and visually intuitive display. It is suitable across various trading strategies and market conditions, with customization options to fit individual needs.
The source code for this indicator is subject to the terms of the Mozilla Public License 2.0.

Volume Z-Score [SuperJump]Hello Guys.
I'm very very happy to release a new indicator after a really long time
The reason I created this indicator is, we often forget the importance of volume.
Volume is a signal of the start of a strong trend, and a very good example of how long a trend can continue.
Why do we forget the importance of trading volume?
Right, because we use a timeframe that is too small,
Most of the time we trade, the candles are largely free of volatility and low in volume.
So if we forget to check volume sometimes, no problem.
But when trading on a big trend, we can't ignore it.
I hope this volume indicator made using Z-Score will help you.
===========================================================================================
People sometimes call us gamblers.
They even accuse us of being unnecessary for the things we study with passion.
But I believe, we can definitely find a good meaning.

Vollinger BandsI'm happy to present to you... VOLLINGER BANDS. Loosely based on bollinger bands, this indicator uses the new Up/Down Volume indicator from tradingview, which I have add moving averages, and a width calculation between them to determine squeeze. Essentially I have created a volume squeeze bollinger band derivative, hence the term "Vollinger Band".
The bands are NOT a deviation of any middle line or moving average, but rather their own moving averages of the volume delta, respectively.
Blue background = Volume Squeeze (vollinger bands width is less than the squeeze strength line), meaning consolidation, and a big move may happen soon.
Top line = A moving average of the Up Volume delta
Bottom line = A moving average of the Down Volume delta
Vol MA = the moving average length of both the top/bottom line
> If you zoom in, you can see a white line, which is the squeeze represented as a single line, calculated using bollinger bands width. The squeeze strength is a moving average of the squeeze line, which then determines if the width is below that moving average, then the squeeze will occur (white line below purple)
The bands are colored based on the sum of the Up/Down volume over the specified number of bars (preset at 5). If the volume is more buying than selling over that amount of bars, then the line is colored green, and vice versa.

Trend Volume Indicator by [VanHelsing]Trend Volume and Momentum based indicator
How it works:
The principle of the volume zone oscillator was used here,
but instead of closes > closes (price momentum) was used RSI,
if RSI > 50 it is a positive momentum and we get + volume value, otherwise - volume
Instead of ema's here is a Volume-Weighted Average Price (VWAP) which gives us such shape of TVI line that in general less sensitive to the pullbacks inside a trend.
This indicator is good for catching and following trends.
You can use alerts as well for take values of trend (-1,1) from 1-10D timeframes
Here how to read it

Last Price minus Open Price Intraday VolumeLast Price minus Open Price Intraday Volume
Change in price from day Open price to Last Price indicate the stock price movement. Last Price minus Open Price Intraday Volume indicator is framed on volume change during change in price from day Open price to Last Price. It takes into account the average intraday volume based on intraday length of bars and actual volume attributed to change in price from day Open Price to Last Price. The indicator reflects the change in trend .By analyzing the position of price on the basis of average change in volume during intraday with that of volume attributed to change in price from day open Price to Last price one may decide upon the course of trade.
DISCLAIMER: For educational and entertainment purposes only. Nothing in this content should be interpreted as financial advice or a recommendation to buy or sell any sort of security or investment including all types of crypto.
NIFTY IT volumeKEY TAKEAWAYS
-Uses NIFTY IT Index Stocks Volume .
-NIFTY IT Volume Indicator is created by adding all 10 NIFTY IT Stocks Volume together.
-NIFTY IT Volume will be an important indicator in NIFTY IT Index technical analysis because it is used to measure the relative significance of a market move.
-The higher the volume during a NIFTY IT index price move, the more significant the move and the lower the volume during a NIFTY IT index price move, the less significant the move.
-Moving Average is also added.

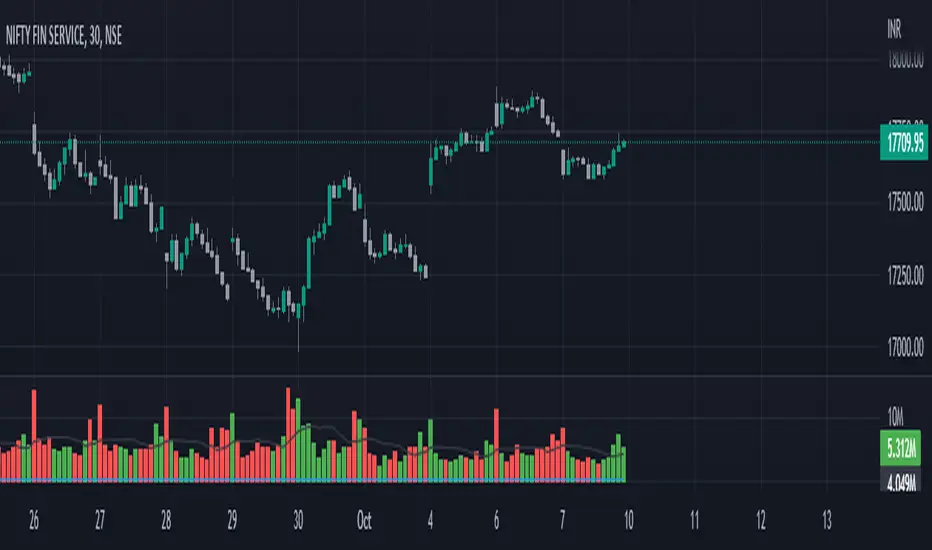
FinNifty VolumesKEY TAKEAWAYS
-Uses FinNifty Index Stocks Volume .
-FinNifty Volume Indicator is created by adding all 20 FinNifty Stocks Volume together.
-FinNifty Volume will be an important indicator in FinNifty Index technical analysis because it is used to measure the relative significance of a market move.
-The higher the volume during a FinNiftyy index price move, the more significant the move and the lower the volume during a FinNifty index price move, the less significant the move.
-Moving Average is also added.
Relative Volume IndicatorA simple indicator showing the relation of volume to highest volume for a define number of bars. Helps to differentiate periods of low and high volume.
Define the number of bars to find the highest volume used as a basis.
Apply a simple moving average to smoothen the volume. Set it to 1 to disable smoothing.
Define a threshold differentiating low and high volume.

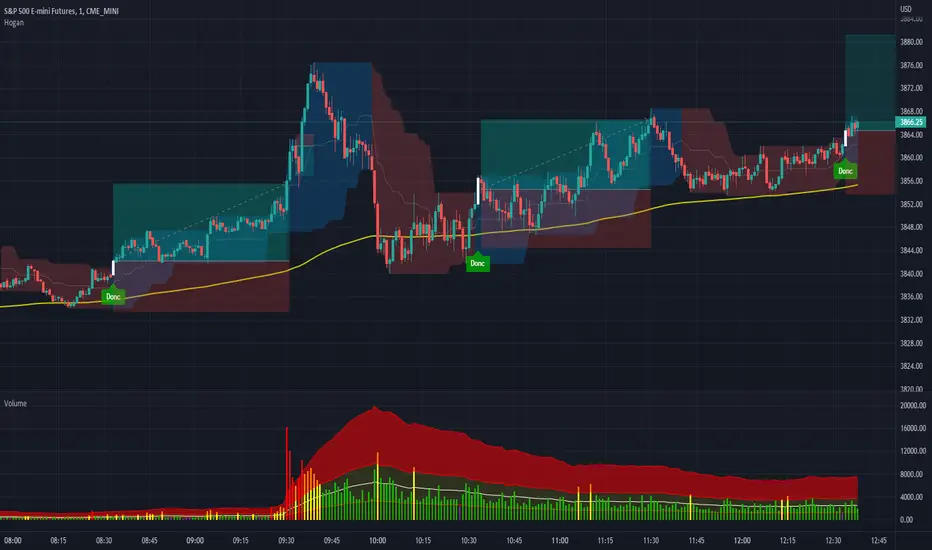
Volume Spread for VSA CustomHey everyone, I have been using volume a lot more lately as price action can sometimes get manipulated but volume shows us the truth!
Anyways, I have enjoyed the Volume Spread for VSA indicator but wished I had the code to change a few settings. This volume indicator includes spread analysis with the ability to customize input values and I'm making it open source so you can do with it as you please.
I have made notes all throughout the code to give suggestions on a few changes or why I have written it in such a way. I have also tried to section everything off to make it easier to see where each piece of the code is used. Overall I think it is a good example of how to code cleanly and how to add useful notes when you are learning Pine for yourself :D
The indicator on the price chart is my Donchian Channel indicator, which you can also find on my profile. This is the one I use every day.
Nasdaq or US Composite Total VolumeBecause no NASDAQ composite index or NYSE composite index provide data volume, this script intends to use the NASDAQ Composite total volume index, index ticker : TVOLQ, or the NYSE Composite total volume index, index ticker : TVOL, as a classical volume indicator on chart.
How tu use : in the input tab choose youe prefered SMA lenght and the volume' index ticker you want to display. TVOLQ for the NASDAQ Composite total volume or TVOL for the NYSE Composite total volume.
On chart, choose to display the indicator in a new pane.

Anchored OBVThe On Balance Volume indicator (OBV) is used in technical analysis to measure buying and selling pressure.
It is a cumulative indicator meaning that on days where price went up, that day's volume is added to the cumulative OBV total.
If price went down, then that day's volume is subtracted from the OBV total.
The OBV value is then plotted as a line for easy interpretation.
On Balance Volume is primarily used to confirm or identify overall price trends or to anticipate price movements after divergences.
If On Balance Volume crosses over or under the zero line, it adds confluence to a bull/bear bias respectively.
Anchored On Balance Volume unlike traditional OBV, resets on your specified date and/or bar (clickable).

MTF 24-hour Volume [Anan]█ OVERVIEW
Tradingview added a new 24-hour Volume indicator to Pine. It’s designed to calculate the volume of daily trading turnover in a particular currency.
It works in the same way as the well-known Volume indicator does. The difference is that 24-hour Volume is a metric used to track the total value of all transactions within a 24-hour period. It can be used to measure market interest in a specific currency over the past day and night. You can read more about how the 24-hour Volume indicator works in Help Center .
█ FEATURES
- Multi Time Frames up to four customizable slots.
- Volume Change by "quote" currency.
- Volume Change %.
- Volume MA Change %.
- Control table colors/position as you like.
**Designed to work with Crypto pairs**

Volume Strength FinderGenerally, Volume indicator shows total Volume of a candle. In this Volume Strength Finder Indicator, I tried to separate Strength of buyers and sellers based on the candle stick pattern. Calculating Buyer and Seller Strength each and every candle of the day based on the pattern formation.
High - close => Buyers
Close - low => Sellers
in this way, cumulative volume separates for buyer and sellers and comparing with total volume of the day and showing results.
if buyer strength more than seller, candle bar color remains green even a candle is negative candle(Open>close) and wise versa.
Note: This is for Education Purpose only.

[Mad] Volume DeltaThis is a volume indicator that splits purchases and sales into 2 separate columns.
In addition, I added some POW factors to scale the volume to a more compact or expanded picture.
The SMA draws the red line indicating the volume of purchases and sales, also with POW factor customizable, so it is possible to scale it within the volume bars
what to do with this information: it is very easy to find rotation points when the selling volume and the buying volume are equal, this is where possible rotation phases occur
have fun

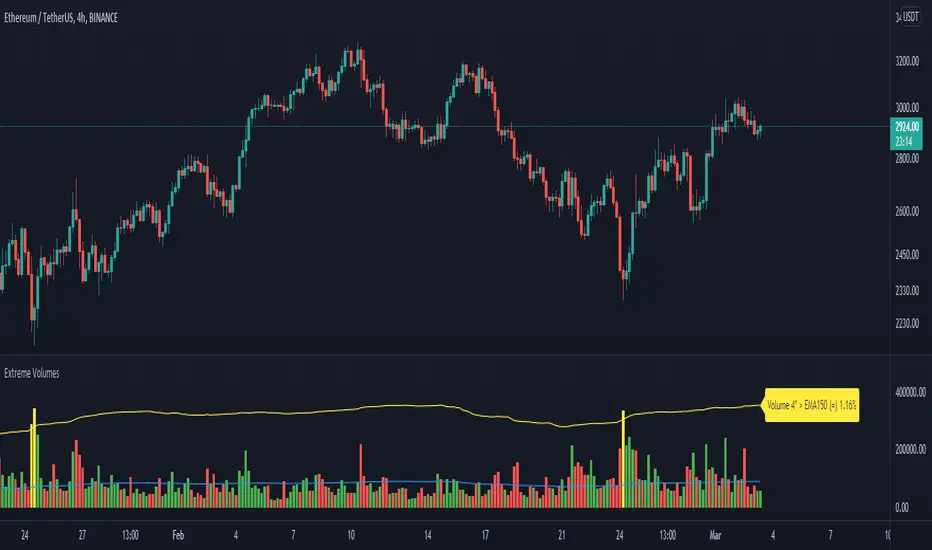
Extreme VolumesThe aim of this volume indicator is quite simple: to pinpoint extreme volume spikes and how unusual these extremes are in comparison to all the chart's volumes.
The label displayed at the end of the indicator updates according to the settings you choose;
It shows the volume EMA length and how many times (the EMA) the current volume bar as to be above to be considered extreme.
Finally, the percentage at the end of the label tells how unusual the defined extreme volumes are compared to the whole chart's volumes (the smaller the percentage, the more unusual these "extreme" volumes are).
TFS Volume Oscillator Noise FilteredINTRODUCTION
This indicator is inspired from " HPotter’s TFS: Volume Oscillator " but I have used Heiken Ashi and Hull Moving Average in calculations in order to reduce noise for better trades.
The concept is similar to that of On-Balance Volume indicator (OBV). It is calculated according to these rules:
If Heiken Ashi Close > Heiken Ashi Open, Volume is positive
If Heiken Ashi Close < Heiken Ashi Open, Volume is negative
If Heiken Ashi Close = Heiken Ashi Open, Volume is neutral
BAR COLORS
Green Color:
Strong Uptrend with good volume supported momentum.
Faded Green Color:
Volume is relatively weakening.
Red Color:
Strong Downtrend with volume support.
Gray Color:
Downtrend negative volume is relatively weakening.
DEFAULTS SETTINGS
Volume length is 30 (Better for timeframes higher than 1H)
Hull Moving Average length is 14 but Linear Regression Curve can be selected with same length

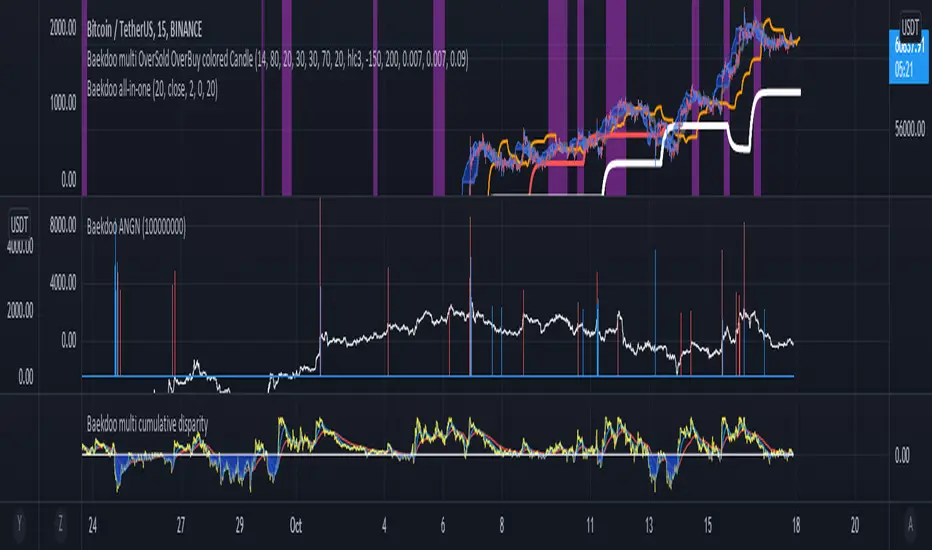
Baekdoo ANGN for cryptocurrencyHi forks,
I'm trader Baekdoosan who trading Equity from South Korea. This Baekdoo ANGN indicator plot volume when large volume trading happened.
I made this indicator for Korea stock trading. I put bars for large amount of trading happened. Let's say 1% of their market cap, then we can regarded this as very big amount of trading is going on.
But those function that drag into the chart of market cap works only on stock. so I put them into hardcoded value.
you can freely change value (since I put the variable into input, you can modify based on your needs).
And adding ANGN (An-Na-Gan-Ni?, means "are you still there? in Korean")
line for upgrade version of On Balance Volume (OBV).
OBV is very good indicator but when it has long tail and short body, it can have wrong indication of buying or selling from big whales. So ANGN with large volume indicator combination would gives you better idea for the big brothers buying or selling tracker.
hope this will help your trading on equity as well as crypto. I didn't try it on futures . Best of luck all of you. Gazua~!
Baekdoo ANGNHi forks,
I'm trader Baekdoosan who trading Equity from South Korea. This Baekdoo ANGN indicator plot volume when large volume trading happened.
Assume that the large volume means higher than 1% of its marketcap amount. And adding ANGN (An-Na-Gan-Ni?, means "are you still there? in Korean")
line for upgrade version of On Balance Volume (OBV).
OBV is very good indicator but when it has long tail and short body, it can have wrong indication of buying or selling from big whales. So ANGN with large volume indicator combination would gives you better idea for the big brothers buying or selling tracker.
hope this will help your trading on equity as well as crypto. I didn't try it on futures. Best of luck all of you. Gazua~!

Advanced VolumeThis simple indicator improves upon the built in volume indicator by adding the following:
-Option to use an EMA instead of SMA
-Advanced Coloring: Lighter bars show growing volume, darker bars show falling volume. Gray bars show very low relative volume (less than or equal to 50% of the moving average), while bars which have a highlighted background have a high relative volume( you can choose the threshold level, default is 2 times the RVOL).
Enjoy!

Climatic Volume indicator Buy/Sell ENGLISH
this indicator is contrarian and it's use in my strategy
Strategy: when price falls the graph show as two moments with panic during the downtrend: two candlesticks of panic
Both candlesticks are associating with two Volume climatic bars (when volumen double the average volume of last 10 bars). In that moment the institutions buy (remember, the institutions only buy during panic and sell in the euphoria moment because they generate a new trend in the market)
Buy Signal: Bear candlestick with climatic volume in downtrend (first institutions buying) + a few candlesticks more with low volume (lower than average volume of last 10 bars) + second candlestick climatic volume in downtrend (last institutions buying before the new trend)
Moving Stop Loss to break even or first sell of us: bull candlestick with climatic volume associated in uptrend (first take profit of institutions)
Sell Signal: Second bull candlestick with climatic volume associated in uptrend (in this moment the institutions take profit in the timeframe where we are operating and wait for a future new swing)
ESPAÑOL
El indicador es un indicador contratendencial
Estrategia: Cuando el precio cae el grafico nos muestra dos momentos de pánico durante la tendencia bajista: dos velas japonesas de panic
ambas velas japonesas están asociadas a dos barras de volumen climático (un volumen que supera en un 100% el volumen promedio de las ultimas 10 barras). En ese momento las instituciones compran (recuerden que las instituciones compran durante el pánico y venden durante la euforia porque ellos generan una nueva tendencia en el mercado)
Señal de compra: vela japonesa bajista con un volumen climático asociado en una tendencia bajista (primera compra de instituciones) + algunas velas japonesas con bajo volumen + una segunda vela japonesa con volumen climático en una tendencia bajista (la ultima compra de institucionales antes de la nueva tendencia)
Mover stop loss a precio de entrada o hacer nuestra primera venta: vela japonesa alcista con volumen climático asociado en una tendencia alcista (primera toma de ganancias de institucionales)
Señal de venta: Segunda vela japonesa con volumen climático asociado en una alcista (en ese momento las instituciones toman ganancias en el timeframe donde estamos operando y esperan un nuevo swing futuro)
