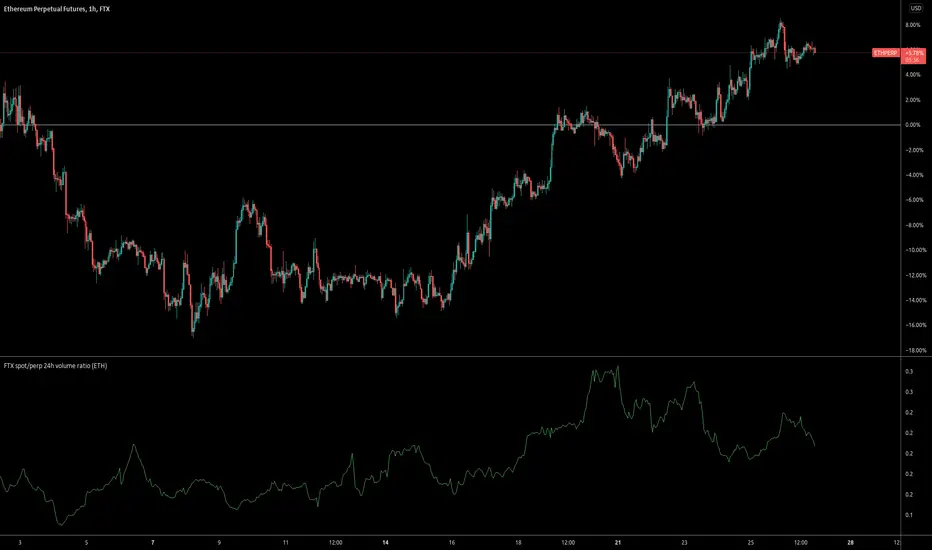
FTX spot/perp 24h volume ratioThis indicator gives the ratio between the 24h volume on the spot instrument versus the perpetual contract on FTX.
חפש סקריפטים עבור "volume"
Base volumeCalculates volume in base currency. For example, in a pair bnbusdt will show the volume not in bnb, but in usdt (million).

TKP Volume Slope Bar ColoringUsing the slope of the 20 Period Volume Moving Averages to detect trend changes in Volume
*With respect to Indexes only*
Increasing Volume tends to be "Bearish" while decreasing volume tends to be "Bullish".
Color of the slope changes when the current slope is above or below the reading of the slope 3 days prior.

Dip Volume V1the very simple and very effective script, the script fetching the data from future contract data so that you can easily understand what is going inside the future data volume . and this is very important for Nifty and Bank Nifty traders


IBEX35 Volume Template [DM]Greetings Sirs
This Script recovers all the volume of the stocks that make up the index to generate the real volume signal with the market data.
You can see how some bars differ in color that is because the volume has been calculated individually by the forward backward stock layer.
Enjoy

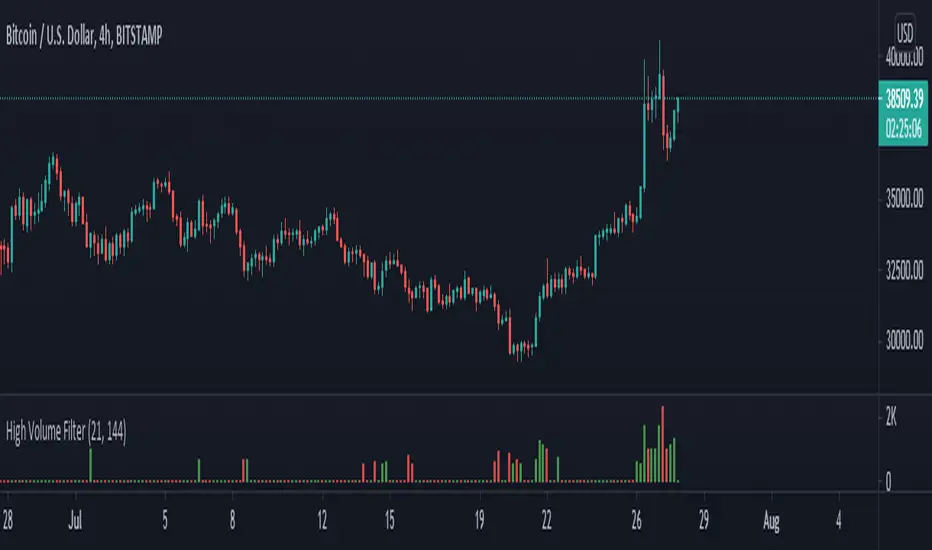
High Volume Filter - Taylor V1High Volume Filter
- Hide Small Volume Bar
- Show High Volume Bar
Able to Change the Filter Average Period

Cumulative Volume FTX + BINANCE SPOT VS DERVIATIVE VOLUMEShows spot volume green and red and derivative volume as blue.

Symbol VolumeUnlike the built-in Volume indicator and other custom scripts, this one allows to configure the volume symbol and preserves the known look and feel.

[ENG/PL] Sumiński's Volume | Wolumen SumińskiegoNASDAQ:DISCK ENG below.
Niniejszy wskaźnik, który jako jego twórca pozwoliłem sobie nazwać w tłumaczeniu na Polski - Wolumenem Sumińskiego :)
Od innych wskaźników wolumenu różni się tym, że mierzy "gęstość wolumenu" na danym barze. Polega to na tym, że w przypadku wystąpienia dużej świecy, np. spadkowej przy niewielkim wolumenie - oznacza to że wskazany obszar cenowy pozbawiony jest drugiej strony - w tym przypadku kupujących, nie zachodzi tu chęć odkupienia sprzedawanego instrumentu.
Jednak w przypadku wystąpienia niedużej świecy, a podwyższonego wolumenu - oznacza to, że przy danym poziomie ceny spotkał się duży kapitał kupujących i sprzedających - wskaźnik oznacza taki bar wysoką wartością. Im wyższy poziom wskaźnika tym "gęstsza" i mocniejsza wymiana pomiędzy kupującymi a sprzedającymi.
_____________________________________________
This indicator, which, as its creator, I have allowed myself to call - Sumiński's Volume :)
It differs from other volume indicators in that it measures the "volume density" on a given bar. It consists in the fact that in the event of a large candle, e.g. a downward candle with a small volume - it means that the indicated price area has no other side - in this case there are buyers, there is no desire to buy back the instrument being sold.
However, in the event of a small candle and an increased volume - this means that at a given price level, there was a large capital of buyers and sellers - the indicator means such a bar with a high value. The higher the index level, the "denser" and stronger the exchange between buyers and sellers.

Koalafied Volume Extension Bar colours based on extensions from volume Z-Score. Large volume candles can often signal exhaustion or show market strength in reversals or breakouts. Candles not supported by rising volume are coloured black while those that are retain their colouring.

Better VolumePlots perceived buy volume,sell volume, an sma of volume over the last x amount of bars, and an arrow when volume is above average.

Plot Other Symbol VolumeThis script plots the volume of another specified symbol.
The standard TradingView 'compare' functionality already covers plotting the various price types.

Delta Volume/Cumulative deltaThis is a slightly modified version of the Delta Volume v2.1 indicator from kernel_phi.
You can read the documentation here:

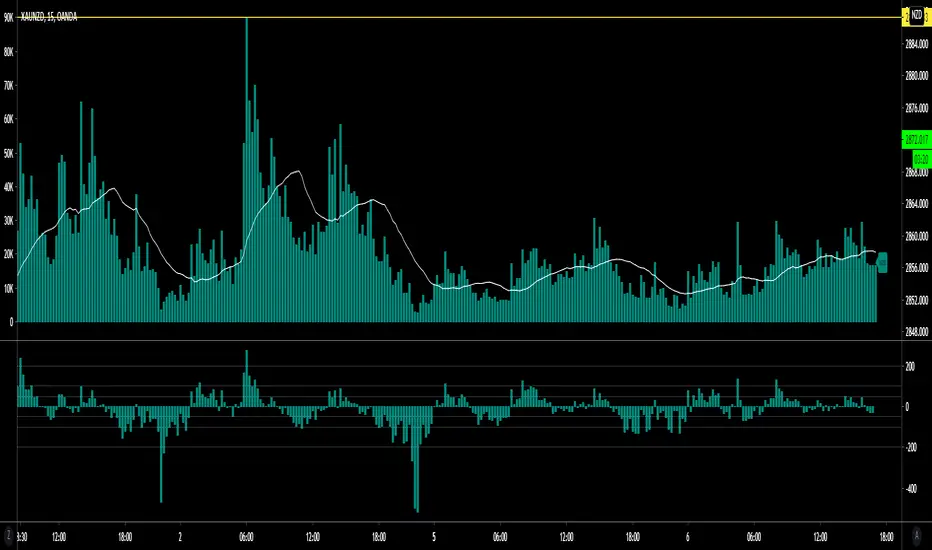
Currency Group Volume
This indicator shows the combined volume of an entire currency from the majors and crosses. So if you chose USD you get the combined volume of audusd, nzdusd, usdjpy, usdchf, eurusd, gbpusd, usdcad...
I made it to see if it would reveal where orders where flowing or perhaps where turning points were etc.
There's an example below of how I was trying to use it. I'm not sure it shows anything too far from obvious.
Its been in my archive for ages so I thought i might as well share it - if anyone sees something I've missed let me know.
(the currency that had the smallest volume spike (AUD) had the biggest push after the volume)
DAX VolumeDAX index (DEU30) hourly volume indicator, which is obtained by adding the sum of the underlying stocks volume.
The volume is displayed in millions of EUR.

Price Weighted VolumeReally simple: VWAP idea applied to volume, to see how much actual value is moving around. Great for assets pegged to fiat like USD, as it then shows how many dollars moved.
It's fun to pair with a long-term VWAP.

Time and sales volume final 1 hello, this is a volume script that depicts the basics of time and sales onto an accurate volume scale. what this can be used for is finding reversal to enter shorts, or puts and strong bullish movement to enter longs or calls. The green indicates buying and red indicates selling inside a candlestick. obviously when securities are exchanged there is an equal amount but this works off relative to the candle close and open to help determine a certain direction.

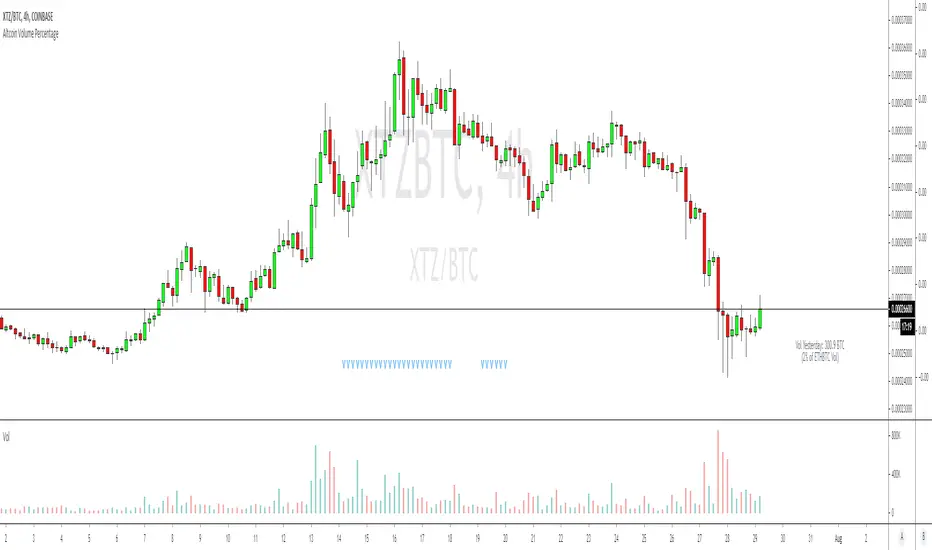
Altcoin Volume StatsShows how much BTC volume an alt has done in the past 24 hours as a label, with a comparison of that volume versus ETHBTC on Binance, as a percentage. Something I have been hoping the good people at Tradingview would add to the interface for years. It also shows some other stats in the data window on the right: i.imgur.com
Big thanks to the talented @Daveatt who helped unbake my noodle with some label code I couldn't figure out.
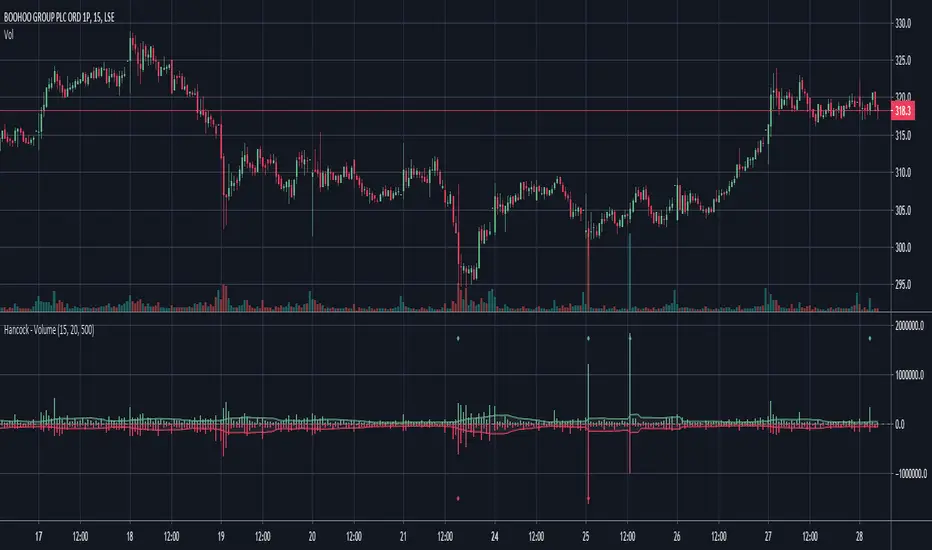
Hancock - VolumeEstimates the buy and sell volume of each candle by using a configurable lower time-frame and displays the volume in a colored histogram.
Happy trading
Hancock