Miyagi (10 in 1) + AlertsMiyagi: The attempt at mastering something for the best results.
Miyagi indicators combine multiple trigger conditions and place them in one toolbox for traders to easily use, produce alerts, backtest, reduce risk and increase profitability.
VWAP has been the main condition for entry for our trading community for quite some time now, however using VWAP alone can lead to poor entries and bags.
Miyagi adds filtering conditions which can then be used to improve entries as opposed to simply using VWAP alone.
Miyagi (10-in-1) + Alerts combines multiple trigger conditions in an easy to use format.
Each trigger or filtering condition is selectable and able to be combined using the selector checkboxes.
Trigger or filter conditions can be used on a different timeframe chart than the current user selected chart.
For instance, the user's chart can be set to a 15M for entry however using filtering from a 30 minute RSI.
It is recommended to not use a lower timeframe chart setting than the current chart timeframe.
The following trigger and filter conditions are present in the 10-in-1:
EMA: Takes two "Exponential Moving Averages" into effect for filtering with user selectable chart timeframe, length and sources.
EMA Trend Type is user selectable for Trend-following or Counter-trend which allows you to counter-trade the markets.
Beside the "Simple Moving Average" the EMA has a multiplier.
Calculation is SMAxMultipier / SMAxMultiplier of the previous candle.
MACD: Takes the "Moving Average Convergence Divergence" into effect for trigger condition or filtering with user selectable chart timeframe,
source, fast & slow length and signal smoothing. MACD is a trend-following momentum indicator that shows the relationship between two moving averages of a price.
The MACD is calculated by subtracting the EMA 26 period from the EMA 12. Long alert is triggered on crossing the MACD zero line upwards and short alert vise versa.
RSI: Takes the "Relative Stregth Index" into effect for trigger condition or filtering with user selectable chart timeframe, length, source, and oversold and overbought values.
The RSI is a technical oscillator that uses price and volume data for identifying overbought or oversold signals in an asset.
It can also be used to spot divergences which warn of a trend change in price. This oscillator moves between 0 and 100.
RSI > 80 is considered overbought and an RSI < 20 is considered oversold.
Stochastic RSI: oscillator version of RSI.
Takes the stochRSI into effect for trigger condition or filtering with user selectable chart timeframe, K D, length, upper and lower length.
stochRSI = (actual RSI - lowest RSI) / (highest RSI - lowest RSI)
VWAP: Takes the "Volume Weighted Average Price" into effect for trigger condition with user selectable chart timeframe, period, and VWAP lower line (long),
or VWAP Upper line (Short) values. VWAP is calculated by totaling the money traded for every transaction (price x volume) and then dividing by the total shares traded.
The VWAP appears as a single line on charts. It looks similar to a moving average line, but smoother. In general it is a intraday/week anchored indicator that resets,
but we are using a steady version over a selectable period of candles.
TTM: Takes the TTM squeeze indicator into effect for trigger condition with user selectable chart timeframe, length, multiplier, smoothing and trend direction.
The TTM is used to identify when to enter or exit a market for the best chance of profitability. It squeezes pairs well with other indicators, such as the ADX indicator.
For Multiplicator you can use Keltner and Boilinger Bands.
ADX: Takes the "Average Directional Movement Index" into effect for trigger condition with user selectable chart timeframe, smoothing, DI-length, a long and a short setting.
The ADX is used to detect trend direction with a positive and a negative direction indicator (+DI & -DI). The factor of those is a value between 0 and 100.
A low value can be a week trend or consolidation. A value > 25 is considered as a positive trend, >50 is a strong long trend >75 extremely strong trend.
Beside timeframe, you can choose smoothing and DI length.
SuperTrend: Takes the SuperTrend into effect for filtering with user selectable chart timeframe, ATR length and factor.
As an alternative to moving averages you can keep a fix distance to determine long or short trend.
That way you can avoid a lot of switching during a consolidation phase. Once crossed it switches trend direction.
The "Average True Rage" is used for calculation of the SuperTrend distance, it measures the volatility of the coin.
MFI: Takes the "Money Flow Index" into effect for filtering with user selectable chart timeframe, length, source, long and short settings.
The MFI is a technical oscillator that uses price and volume data for identifying overbought or oversold signals in an asset.
It can also be used to spot divergences which warn of a trend change in price. Like RSI this oscillator moves between 0 and 100.
MFI > 80 is considered overbought and an MFI < 20 is considered oversold.
W-Divergence: Takes the "Wolfpack Divergence" into effect for trigger condition with user selectable chart timeframe, length, lookback, divergence and ranges.
W-Divergence is MACD 3-8 setting with added divergence hunter.
How to use: Select the VWAP, and set the VWAP up as you would normally trade with your selected timeframe, period, and VWAP settings (long and short).
All entries will be shown, based on the VWAP settings.
From here, filtering can be implemented to produce better entries, ie using EMA/MACD/RSI/SuperTrend/MFI filtering.
Happy Trading!
חפש סקריפטים עבור "vwap"

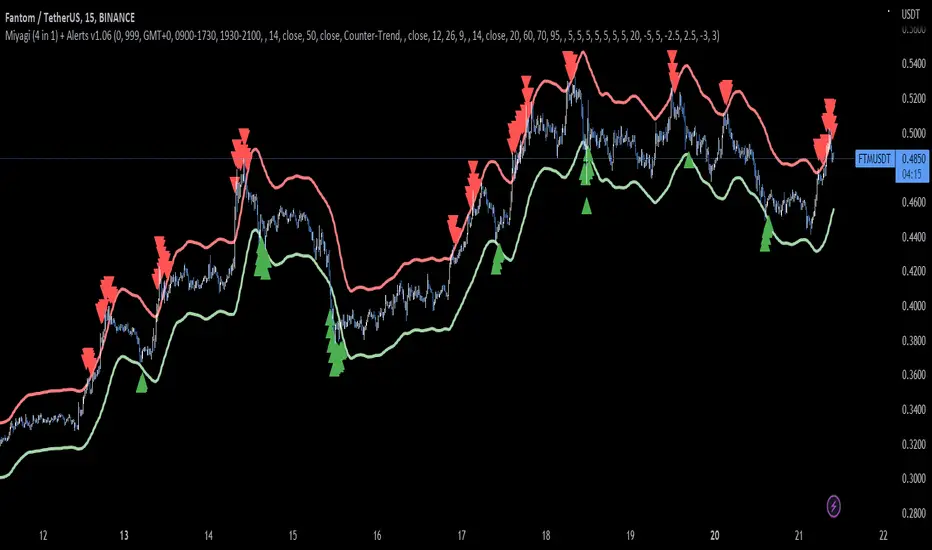
Miyagi (4 in 1) + AlertsMiyagi: The attempt at mastering something for the best results.
Miyagi indicators combine multiple trigger conditions and place them in one toolbox for traders to easily use, produce alerts, backtest, reduce risk and increase profitability.
VWAP has been the main condition for entry for our trading community for quite some time now; however using VWAP alone can lead to poor entries and bags.
Miyagi adds filtering conditions which can then be used to improve entries as opposed to simply using VWAP alone.
Miyagi (4-in-1) + Alerts combines multiple trigger conditions in an easy to use format.
Each trigger or filtering condition is selectable and able to be combined using the selector checkboxes.
Trigger or filter conditions can be used on a different timeframe chart than the current user selected chart.
For instance, the user's chart can be set to a 15M for entry however using filtering from a 30 minute RSI.
It is recommended to not use a lower timeframe chart setting than the current chart timeframe.
The following trigger and filter conditions are present in the 4-in-1:
EMA: Takes two EMAS into effect for trigger condition or filtering with user selectable chart timeframe, length and sources. EMA Trend Type is user selectable for Trend-following or Counter-trend which allows you to counter-trade the markets.
MACD: Takes the MACD into effect for trigger condition or filtering with user selectable chart timeframe, source, fast & slow length and signal smoothing.
RSI: Takes the RSI into effect for trigger condition or filtering with user selectable chart timeframe, length, source, and oversold and overbought values.
VWAP: Takes the VWAP into effect for trigger condition with user selectable chart timeframe, period, and VWAP lower line (long), or VWAP Upper line (Short) values.
How to use: Select the VWAP, and set the VWAP up as you would normally trade with your selected timeframe, period, and VWAP settings (long and short).
All entries will be shown, based on the VWAP settings.
From here, filtering can be implemented to produce better entries, ie using EMA/MACD/RSI filtering.
Happy Trading!
EVWAPThis indicator plots two Volume-Weighted Average Price (VWAP) lines anchored to earnings events:
EVWAP (Earnings Day): Resets VWAP on the day of the earnings release.
EVWAP (Post-Earnings Day): Resets VWAP on the first trading day after earnings.
These earnings-based VWAPs help identify average price zones impacted by earnings, providing insight into post-earnings support/resistance and potential trend shifts. Works on all timeframes.
Useful for traders analyzing price reactions around earnings reports.

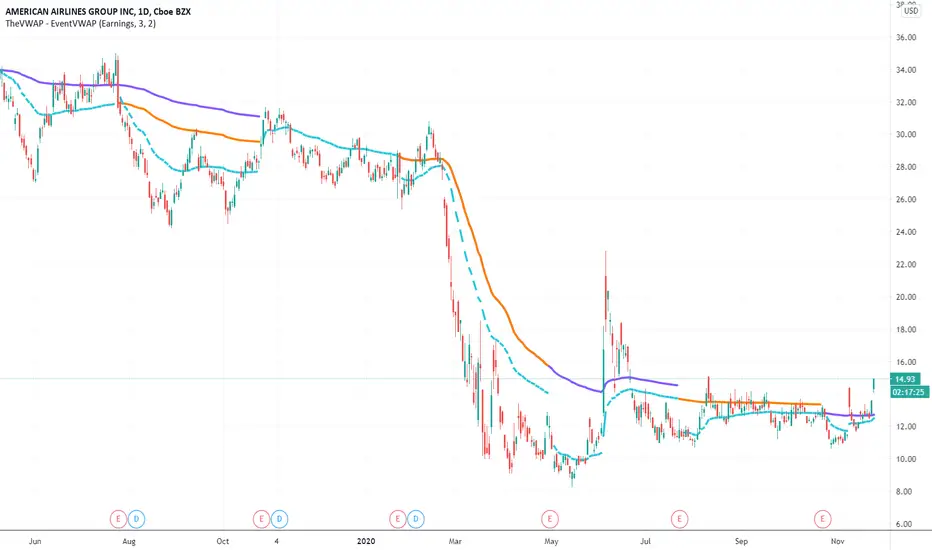
TheVWAP - EventVWAPRequiring no date input from the user, EventVWAP automatically launches custom-dated VWAPs from relevant events — earnings and user-defined gaps — to detect longer-term thematic support and resistance. Works on both intraday and daily charts and includes user-specified thresholds for detection of launch events, such as the minimum gap % required to qualify.
Inputs include the number of VWAPs (up to four), the line style, custom color selection and which event type to use.
Use the link below to obtain access to this indicator.

MultiWAPThe VWAP tracks the average price, giving weight to each candle based upon its' relative volume.
In other words, high-volume candles move the VWAP faster than low-volume candles.
On a good day, market maker:
-Buys the dip
-Pumps past resistance, causing bullish FOMO
-Sells into the bullish FOMO, causing bearish FOMO
-Buys the dip (rinse and repeat)
By default, MultiWAP begins at the first visible bar.
Range low/high - tracks the most recent high/low
Upper VWAP - tracks retail's average buy price (MM is selling)
Lower VWAP - tracks MM's average buy price (MM is buying)
If price closes below the lower VWAP or the range low, the lower VWAP and range low are reset.
If price closes above the upper VWAP or the range high, the upper VWAP and range high are reset.
Resets are indicated by the dots. Resetting either VWAP moves it close to last price, making it easy to breach again.
A down-trend that lasts many bars will produce a string of green dots. When the accumulation phase ends, price pulls away from the lower VWAP, so it stops resetting. The ABSENCE of green dots tells you that we're in the markup phase/up-trend.
An up-trend that lasts many bars will produce a string of red dots. When the distribution phase ends, price pulls away from the upper VWAP, so it stops resetting. The ABSENCE of red dots tells you that we're in the markdown phase/down-trend.
By default, the net result is two VWAP's that automatically anchor themselves to the most recent, significant, and visible, high and low.
Usage:
For any timeframe, I recommend starting zoomed way out. Find the last green dot and drop an "Anchored VWAP" there. Now, zoom in until that candle is no longer visible. Find the last green dot and drop an anchored VWAP there. Continue doing so until you notice the lower VWAP getting reset to basically the same place.
This works the same, in reverse, during down-trends.

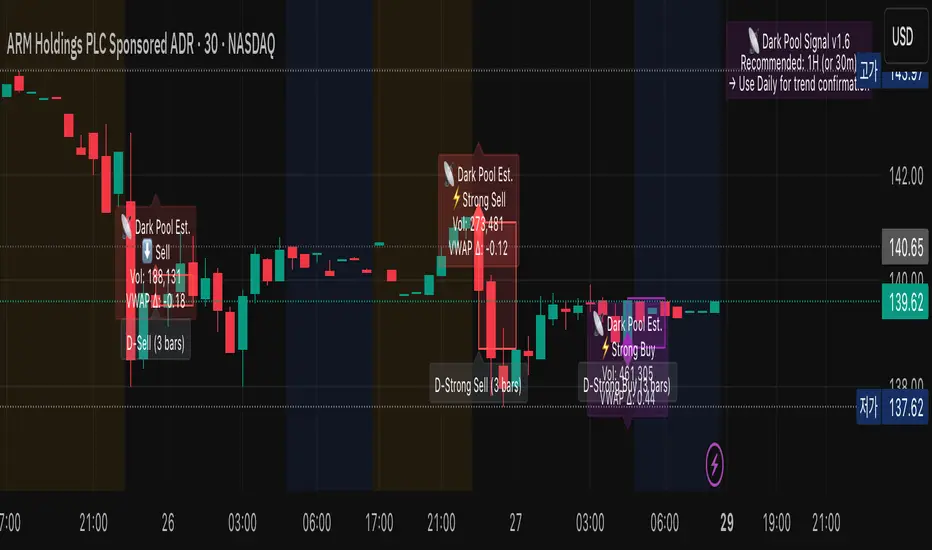
Dark Pool Estimate Signal TrackerDark Pool Estimate Signal — Detect Potential Institutional Activity
Overview
The Dark Pool Signal v1.6 indicator is designed to detect unusual trading activity near VWAP zones, which can be associated with institutional dark pool transactions. By combining volume spikes, VWAP proximity, and optional trend filters, it provides clear visual cues of potential hidden accumulation or distribution zones.
Disclaimer: This script is for informational and educational purposes only. It does not constitute financial advice. All trading involves risk. Past performance is not indicative of future results.
🔍 Core Logic
This indicator identifies potential off-exchange activity by analyzing three key factors:
Unusual Volume Spikes: Highlights bars where the current volume significantly exceeds its moving average by a user-defined multiplier.
VWAP Proximity: Triggers when the price stays within a volatility-adjusted range (ATR-based) of the VWAP, a common characteristic of algorithmic execution.
Trend Confirmation: An optional EMA filter helps align signals with the broader market direction.
Accumulation Detection: Counts repeated signals within a lookback period to identify persistent institutional buying or selling pressure.
The result is a set of visual and alert signals indicating possible institutional footprints.
🧩 Features
Dynamic VWAP Range (ATR-based): Automatically adjusts VWAP proximity sensitivity based on current market volatility.
Multi-tiered Signal Strength: Differentiates between Normal, Strong, and Accumulated signals to visualize the intensity of activity.
Non-Repainting Confirmation: Signals are confirmed only on bar close to ensure they do not repaint.
Language Support: Dual-language display (English / Korean).
Customizable Visualization: Easily adjust label size, color transparency, offset, and the duration of highlighted zones.
Smart Alert System (v1.6): Provides comprehensive alert() and alertcondition() calls for real-time push notifications.
Recommended Timeframe Notice (v1.6): Displays a small on-chart note suggesting optimal timeframes for analysis.
🕒 Recommended Timeframes
Type Recommended Use Description
1-Hour (default) Primary Analysis Offers a good balance between signal clarity and noise reduction. Ideal for most equities and ETFs.
30-Minute Short-term Confirmation Useful for intraday analysis and refining entry/exit points.
Daily Macro View Helps identify long-term institutional positioning and potential trend reversal zones.
< 15-Minute Experimental May generate excessive noise due to market micro-volatility. Not recommended for primary analysis.
💡 Tip: Combine 1H detection with Daily chart confirmation for a more robust, dual-layer view of institutional flow.
📊 Visualization
Purple Diamonds: Strong or Normal Buy signals
Red Diamonds: Strong or Normal Sell signals
Translucent Boxes: Highlight the estimated duration of dark pool activity.
Optional Labels: Display volume, VWAP delta, and signal strength for detailed analysis.
All visual components can be toggled on or off in the settings.
⚙️ Alert System
Create alerts for each specific signal type directly from the chart's alert menu or your script settings.
⚡ Strong Buy/Sell
📡 Accumulated Buy/Sell
⬆️ Normal Buy/Sell
➖ Neutral Activity (Volume spike near VWAP without clear direction)
Set alert frequency to Once Per Bar Close for confirmed, non-repainting signals.
🧭 How to Use
Add the indicator to your chart.
Select your preferred language and timeframe.
Customize visualization and alert settings to your preference.
Observe how the combination of volume + VWAP + trend reveals potential accumulation or distribution zones.
Use alerts to monitor for significant institutional activity in real-time.
🧠 Important Notes
This indicator is non-repainting. Signals are confirmed at the close of each bar.
It is intended for analytical and educational use, not as a direct trading system.
It works across equities, ETFs, and crypto, but volume data reliability can vary by exchange. Always confirm signals with your own strategy and risk management.
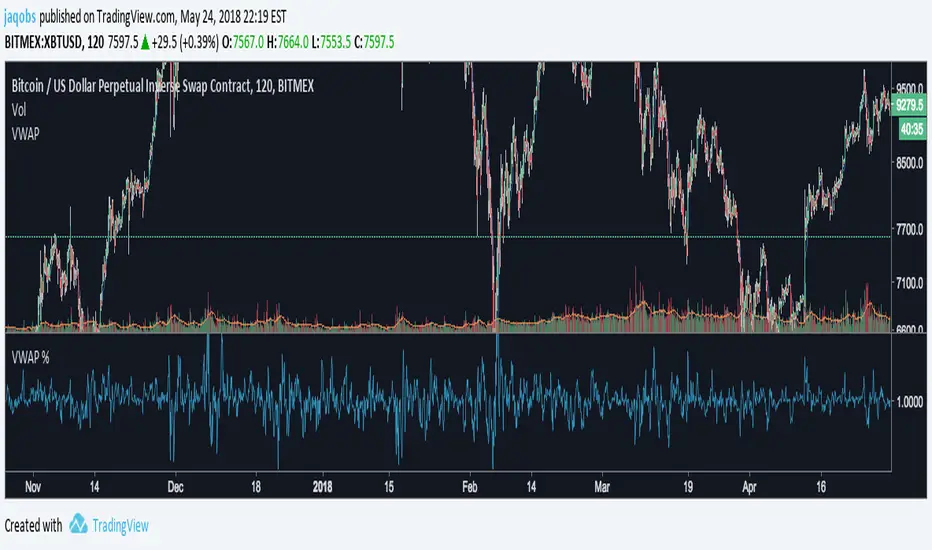
Spot v Perp aggrRollingVWAPThis indicator is a rolling VWAP that shows an aggregated BTC VWAP for both spot markets and futures markets
Spot VWAP is shown in BTC orange while perp VWAP is shown in blue
This is useful for identifying which market (spot or perps) is pushing trending moves
If the spot VWAP is more closely following the trend, then spot is pushing the move
If the perp VWAP is more closely following the trend, then perps are pushing the move
e.g. In the following picture you can see that the move down was followed much more closely by the spot VWAP, therefore you can assume that the move is being pushed my spot

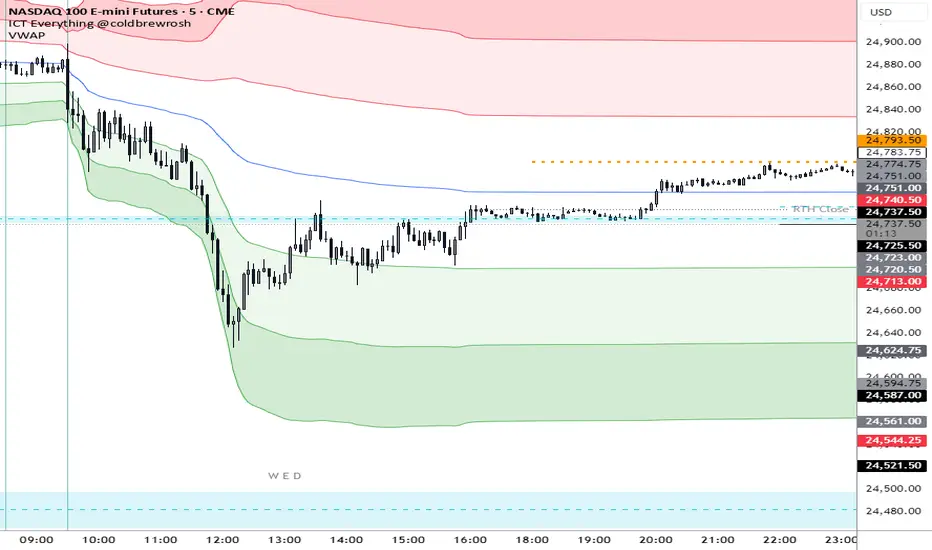
TheVWAP - AspectAspect measures any one of three critical VWAP elements —
1) Position: price distance from VWAP in standard deviations as a subgraph indicator
2) Slope: rate of change of VWAP to detect incrementally rising (or waning) directional aggression
3) Deviation Size: using VWAP standard deviation bands as a proxy for expected range, comparing current volatility to historical (‘typical’) volatility as a ratio
Aspect is most effective when paired with an intraday VWAP and is all about confirmation — telling you that ‘position’ is diverging from price, that slope is intensifying (or decaying), or that volatility is normal or abnormal.
Inputs include aspect type, slope length, sensitivity type or custom sensitivity input, and threshold.
Use the link below to obtain access to this indicator.

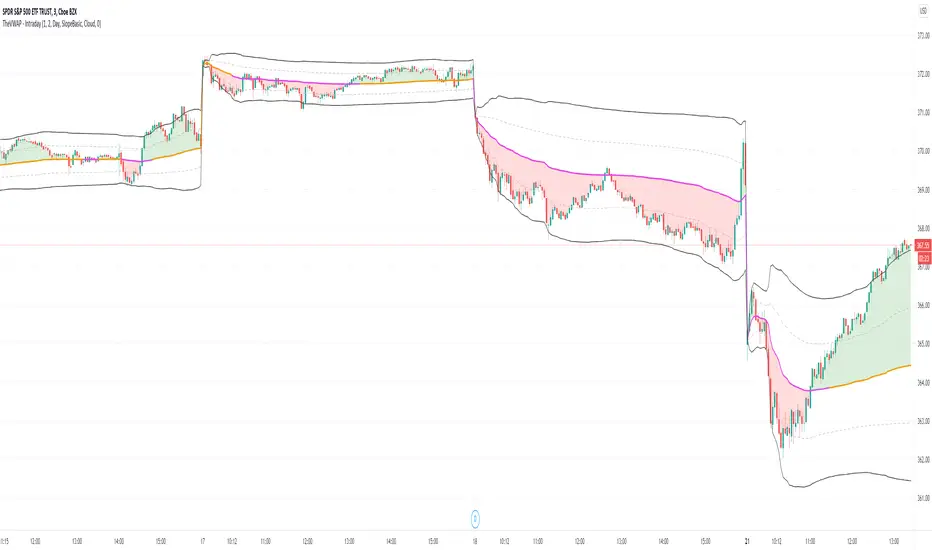
TheVWAP - IntradayOur custom intraday VWAP study, which includes a typical "market open to market close" VWAP , standard deviation bands and color-coding to reflect the market’s current position and slope. This can be applied to a Day, Week or Month timeframe.
This is the backbone of our intraday strategy, as it reveals areas of support and resistance that would otherwise remain hidden and highlights them through custom colorization.
Inputs include standard deviation values, time frame, VWAP color, background color signal, tolerance band width, and the ability to turn on a color-coded deviation signal.
Use the link below to obtain access to this indicator and to learn more.
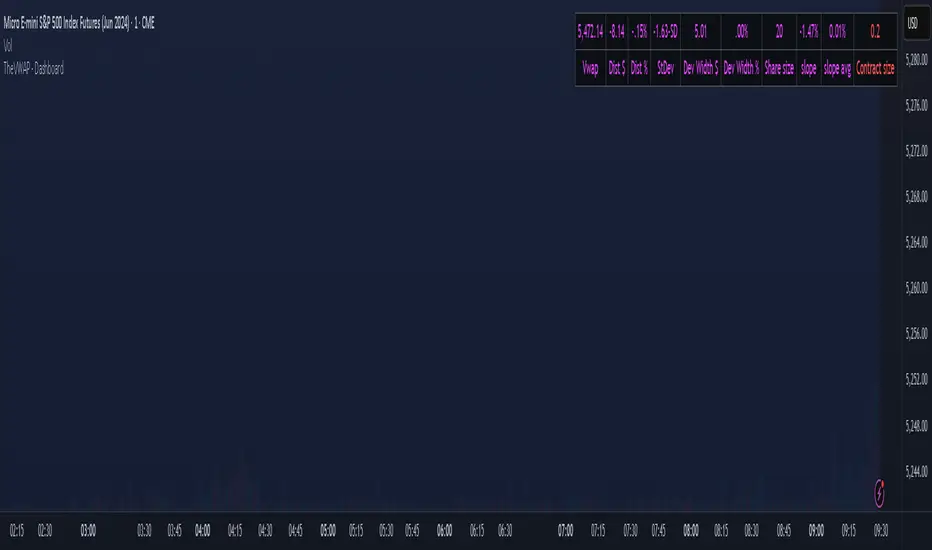
TheVWAP - DashboardJust as the name implies, Dashboard contains several useful VWAP metrics like price in relation to VWAP (dollars, percent, and StDev) as well as automatic viable position sizing estimation. Each metric can be separately hidden according to preference and the position size calculator is customizable to fit your particular parameters of risk and reward.
Appearing in the upper right corner of the chart by default, Dashboard allows traders to quickly assess a chart’s specific volatility in the context of — and its position relative to — the day's volume-weighted average price.
Use the link below to obtain access to this indicator and to learn more.
[MCN] Volume Weighted Average PriceStandard VWAP with custom stdv colourings and the ability to anchor by midnight price.
Option Selling Indicator
* ✅ Bullish Trend → Background turns Green (favorable for Put Selling)
* ❌ Bearish Trend → Background turns Red (favorable for Call Selling)
* ⚪ Sideways / Weak Trend → Background turns White (avoid trades or use range strategies)
📊 How to Use:
1. Apply the indicator on Index Futures or Stocks where Options are actively traded.
2. Use the **background color** as a visual guide:
* Green → Consider **Put Selling** opportunities.
* Red → Consider **Call Selling** opportunities.
* Grey → Market is sideways → **Avoid trades** or use strangle/straddle strategies.
3. Confirm signals with **VWAP levels** for better entries.

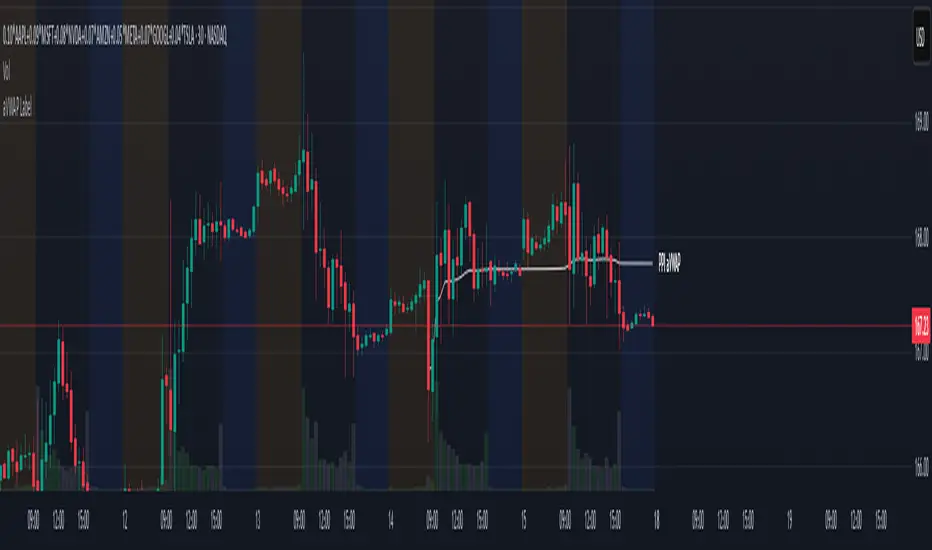
aVWAP with LabelAnchored VWAP with Label
- Select the indicator, a vertical line will appear on the chart to select the anchor
- Allows to hide the plot line while keeping the label, for a cleaner chart
- Allows 3 Presets of color and line width for types
News
Buyers
Sellers
Two Days Auto Anchored VWAPEasier way to set anchors to today and last trading day's open.
All you need to do is to select today from the dates picker in Setting ➔ Inputs ➔ Anchor Today .
If last workday is holiday for the market, then overwrite by selecting Manually Set Prev Day
Next update: auto set today's anchor, so completely automatic

Custom_AVWAP_Harpal's-AnchorsAutomated VWAP Indicator written in PineScript for TradingView charts. Automatically Anchored at key swing H/L levels extracted from price and volume time-series.
Indicator takes one Argument, "LookBack (# of Periods)", and then for a given security finds three key anchors, the highest and lowest values in the 'hlc3' column (average of high low and close on the daily timeframe) in the last 'LookBack' # of days. The script displays up to three color coded time-series corresponding to a trailing Volume Weighted Average Price beginning at the anchor dates corresponding to the anchor points listed above.

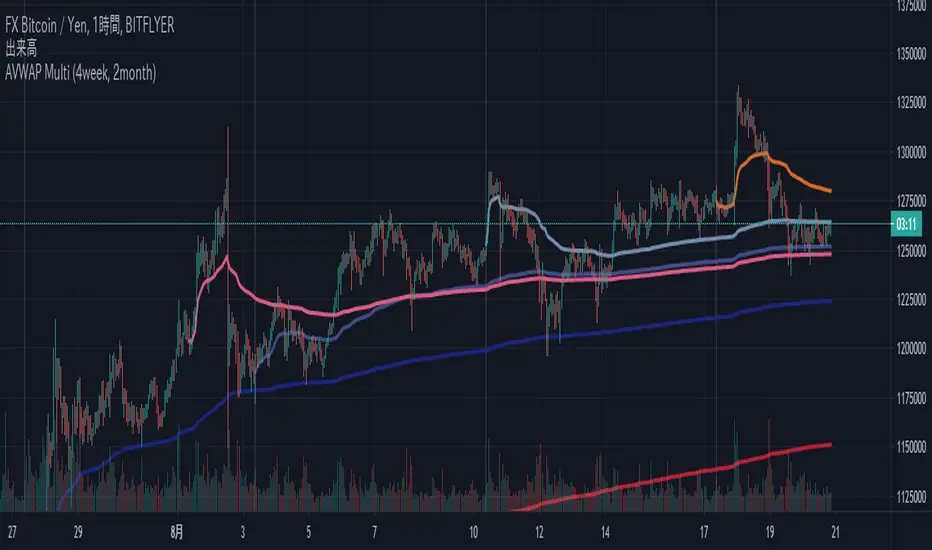
AVWAP Multi (4week, 2month)Multi Ancherd VWAP Lines
Weeks (Start every Monday)
- now week AVWAP
- last week AVWAP
- two weeks ago AVWAP
- three weeks ago AVWAP
Months (Start on the 1st day of every month)
- now month AVWAP
- last month AVWAP
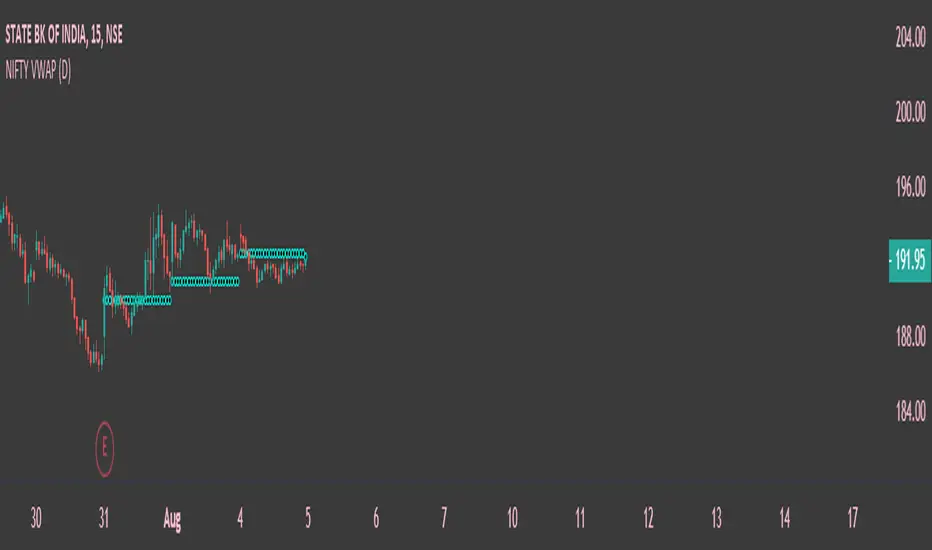
Nifty VWAPThis indicator is based on Indian Indices Nifty and Nifty 50 Stocks . Combination of breadth volumes of Niifty50 stocks to get Nifty Volume , can be used only Nifty50 Index and stocks . This indicator tells you the trend of the index or stocks. If the price is above the Volume weighted average price line its considers as Bullish Trend and if the price is below the Volume weighted average price line its considered as Bearish Trend. Default resolution is Set as Day , can be customized according to ones choice . Hope you guys will like it .
Max of VWAP of last three daysThe script searches for max values of last three days and then calculates average of those values


Bitcoin Institutional Volume AnchorsBitcoin Institutional Volume Anchors
Indicator Overview:
The Bitcoin Institutional Volume Anchors indicator is a professional-grade VWAP analysis tool designed for sophisticated Bitcoin trading strategies. It tracks two critical volume-weighted average price levels anchored to fundamental market structure events that drive Bitcoin's multi-year cycles.
-Orange Line (Halving Anchor): Volume-weighted average price from April 19, 2024 halving event
-Blue Line (Cycle Low Anchor): Volume-weighted average price from November 21, 2022 cycle bottom
These anchors represent the average price institutional and professional traders have paid since Bitcoin's most significant supply-side catalyst (halving) and demand-side reset (cycle low).
Market Interpretation Framework:
Price Above Both Anchors - Institutional Bullish
-Strong institutional accumulation confirmed
-Majority of professional money profitable since key events
-Optimal environment for long-term position building
-Risk-on institutional sentiment
Price Between Anchors - Transition Phase
-Mixed institutional signals requiring careful analysis
-Appropriate for reduced position sizing
-Monitor for directional confirmation
-Tactical rebalancing opportunity
Price Below Both Anchors - Institutional Bearish
-Professional money underperforming key levels
-Heightened risk management protocols required
-Defensive positioning appropriate
-Await institutional re-accumulation signals
Standard Deviation Band Analysis:
Gray Bands (2σ): Statistical volatility boundaries
-Represent normal price excursions from institutional fair value
-Used for tactical profit-taking and position scaling
-Indicate elevated but manageable risk levels
Colored Bands (3σ): Extreme volatility boundaries
-Orange/Blue bands corresponding to respective VWAP anchors
-Represent statistically extreme price extensions
-High-probability reversal or exhaustion zones
-Critical risk management triggers
Professional Trading Applications:
Portfolio Allocation Framework
Maximum Allocation (70-100%)
-Price above both anchors with upward trending VWAPs
-Recent bounce from either anchor level
-Recovery to fair value after extreme extension
Standard Allocation (40-70%)
-Price above anchors but approaching 2σ bands
-Consolidation near anchor levels
-Confirmed institutional trend changes
Reduced Allocation (20-40%)
-Price at 2σ extension levels
-Below one anchor but above the other
-Conflicting VWAP trend signals
Defensive Allocation (10-25%)
-Price at 3σ extreme levels
-Below both institutional anchors
-Overextended risk conditions (>30-35% above anchors)
Entry Signal Hierarchy:
Tier 1 Signals (Highest Probability)
-Bounce from Cycle Low Anchor during uptrend
-Cross above both anchors with volume confirmation
-Recovery to fair value after 20%+ extension
Tier 2 Signals (Standard Probability)
-Bounce from Halving Anchor during uptrend
-Trend change confirmation in VWAP slope
-2σ band rejection with momentum
Tier 3 Signals (Lower Probability)
-Entries near 2σ extension levels
-Counter-trend plays against institutional flow
-High-risk momentum trades at extremes
Risk Management Protocol:
Stop Loss Guidelines
-Halving Anchor entries: 3% below anchor level
-Cycle Low Anchor entries: 4% below anchor level
-Extension trades: 2% below current level
-Trend change trades: Below invalidation anchor
Profit Taking Strategy
-25-40% profits at 2σ bands
-50-70% profits at 3σ bands
-Trailing stops below higher timeframe anchor levels
-Complete exits on institutional trend reversals
Alert System Integration:
The indicator provides institutional-grade alert notifications with:
-Precise entry and exit levels
-Position sizing recommendations
-Historical win rate data
-Risk/reward calculations
-Stop loss and target guidelines
-Timeframe expectations
-Volume confirmation requirements
Implementation Notes
-Timeframe Suitability: Daily charts recommended for primary analysis
-Asset Specificity: Optimized exclusively for Bitcoin spot markets
-Volume Consideration: Higher volume enhances signal reliability
-Market Context: Most effective during trending market conditions
-Institutional Alignment: Designed for professional risk management standards
-Key Performance Metrics
Based on historical backtesting:
-Overall Win Rate: 74% for primary signals
-Risk Reduction: 31% drawdown improvement vs buy-and-hold
-Signal Accuracy: 85% at extreme (3σ) levels
-Optimal Timeframe: 1-12 week holding periods
-Best Performance: April 2024 - January 2025 period
This indicator is designed for professional traders and institutional investors who require sophisticated market analysis tools with quantified risk parameters and historically validated performance metrics.

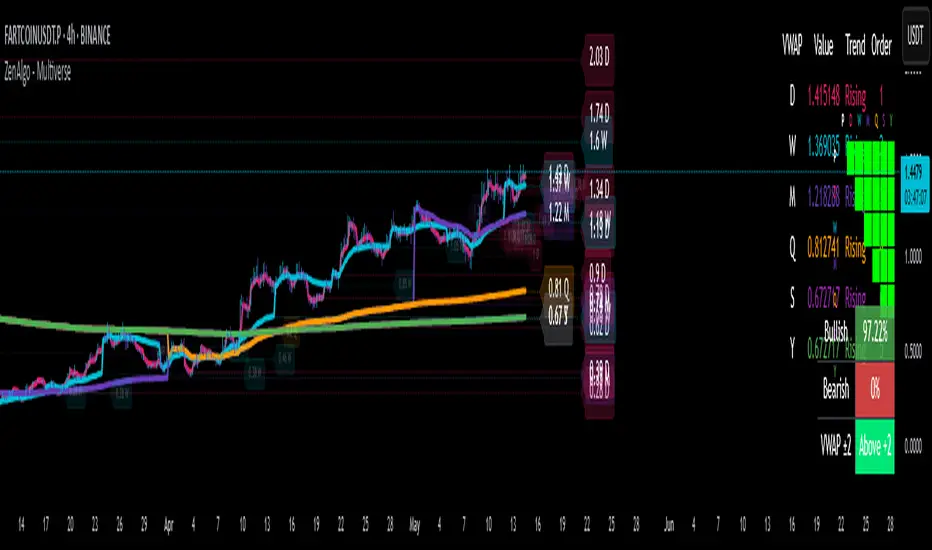
ZenAlgo - MultiverseThe ZenAlgo – Multiverse indicator provides a multi-timeframe view of Volume-Weighted Average Price (VWAP) levels and their dynamic interaction with price across seven defined timeframes: Daily, Weekly, Monthly, Quarterly, Semi-Annual, and Yearly. The indicator is intended to help traders contextualize price within time-based value areas and examine how price interacts with statistically relevant bands derived from those VWAPs.
VWAP Calculation and Period Structure
At the core, this script computes VWAP levels anchored to six distinct timeframes using volume data and a configurable source (default is HLC3). Each VWAP resets at the start of its corresponding period (e.g., Daily VWAP resets at the beginning of a new day) using timeframe.change() as a detection mechanism. This allows each VWAP level to reflect a clean aggregation of price and volume over its specified period.
VWAP levels are only computed if volume data is present and cumulative volume increases, ensuring logical consistency. If volume is missing or inconsistent, the script terminates execution with an error to prevent invalid outputs.
Band Calculation
Each VWAP is accompanied by one or two optional bands on both sides, calculated using percentage-based offset. Daily VWAP is configurable per user preference to use either standard deviation or a percentage-based offset. These bands provide a dynamic value area that expands or contracts with volatility or proportional price distance, respectively.
The bands help classify price as:
Inside the main band (e.g., between ±1 band): near average value
Inside extended band (e.g., ±2 bands): stretched but not extreme
Beyond extended band: potentially overheated or oversold conditions
This layering creates a multi-zoned map of value perception across timeframes.
Labeling and Historical Tracking
As each new VWAP is computed, it is stored in a bounded array alongside metadata such as label position, line objects, test count, and test state (whether price has interacted with it). Each level is drawn as a dotted horizontal line and labeled with its value and corresponding period (e.g., "D", "W", "M").
Price interaction with a VWAP level (i.e., candle high/low crossing the line) changes the styling of the label and line, marking it as "tested." A cap on how many tested levels are retained (default 10) avoids excessive clutter and resource usage.
These persistent horizontal levels give the trader a visual reference of where value was defined in previous periods and how price has respected or ignored those levels over time.
Summary Tables and Grid
Two visual table overlays are provided:
1. VWAP Summary Table , this table shows:
VWAP values per timeframe
Trend interpretation (rising, falling, stable) relative to price
Ranked order of VWAP values (from highest to lowest)
The order is recalculated each bar to reflect the vertical positioning of each VWAP on the price chart.
2. VWAP Relationship Grid
A grid matrix compares each VWAP and current price against all others. Each cell reflects whether a given source is above, below, or within a tolerance threshold relative to another. Colors (green, red, gray) visually encode the result, with the diagonal marked in black and unused cells disabled.
This matrix helps identify alignment or dissonance among timeframes, allowing users to detect whether shorter-term value is leading or lagging longer-term value.
Price Band Classification
For the Daily VWAP specifically, the script includes an extra classification system. It assigns the current price to a zone (e.g., "At VWAP", "Bear Band", "Above Bull Band 2") based on where the price lies in relation to the VWAP bands. This classification is also used for dynamic coloring and added to the daily label.
Display Controls
The script offers fine-grained controls:
Toggle visibility of each VWAP and band group independently
Adjust the offset of labels from the current bar
Customize band multipliers and color transparency
Limit the number of historical VWAP labels plotted
Position both the summary and grid tables flexibly on screen
These options allow traders to declutter their charts and focus on the most relevant context for their strategy.
How to Interpret and Use
This indicator provides a structured view of market value perception across various timeframes. For example:
When price converges with multiple VWAPs, it may suggest consensus on value.
When price moves away from all VWAPs, it may indicate trending or stretched conditions.
Crosses and retests of VWAPs (especially higher-timeframe ones) can act as areas of interest.
The band-based classification helps identify transitional zones and whether price is situated in an area where value is being accepted or rejected.
The summary tables offer a high-level dashboard of price positioning and value structure, which can assist with top-down analysis, filtering setups, or contextual decision-making.
Added Value Compared to Free Alternatives
Most free VWAP scripts:
Cover only a single timeframe (often daily or session-based)
Lack historical level tracking with tested/retested visualization
Do not support grid-level relationships or multi-timeframe band analysis
Offer limited configuration over how bands are calculated or displayed
This script consolidates multiple value areas in one consistent framework and goes further by tracking historical relevance, providing interaction logs, and organizing data into actionable overlays.
For traders seeking comprehensive value context across intraday and swing horizons, this tool offers persistent and structured data views that are otherwise unavailable through individual, isolated VWAP tools.
Limitations and Disclaimers
The indicator depends on volume data. On instruments with unreliable or synthetic volume (e.g., certain spot forex or CFDs), results may not be meaningful.
Band-based interpretation should not be used as a signal mechanism on its own.
On low timeframes, longer-period VWAPs may appear flat or visually compressed.
As with any analytical tool, interpretation requires trader discretion and should be combined with broader context.