Rolling VWAP 7-30-907, 30, and 90-day VWAP (Volume Weighted Average Price) indicator on TradingView provides traders with multiple perspectives on market sentiment and price efficiency across short, medium, and long-term horizons. The 7-day VWAP is particularly useful for active traders or intraday participants who want to gauge near-term value and liquidity. It highlights short-term imbalances, helping to identify overbought or oversold conditions relative to recent trading activity. Meanwhile, the 30-day VWAP smooths out shorter-term noise, offering a more balanced benchmark that swing traders often use to spot trend alignment or potential reversals within a monthly cycle.
The 90-day VWAP serves as a longer-term institutional benchmark, reflecting deeper capital flows and market consensus over a quarter. It’s particularly valuable for position traders or those tracking whether price is consistently trading above or below this broader measure of value, which can indicate long-term accumulation or distribution phases. Using all three together provides a layered framework: the 7-day VWAP for tactical entries, the 30-day VWAP for swing positioning, and the 90-day VWAP for strategic trend confirmation. This multi-timeframe approach allows traders to align short-term signals with medium and long-term market structure, improving precision and conviction in decision-making.
Prof Satoshi
חפש סקריפטים עבור "vwap"

Volume Profile + VWAP + Long Wick StrategyVolume Profile + VWAP + Long Wick Strategy
This indicator combines Volume Profile (VP), VWAP (Volume Weighted Average Price) with deviation bands, and a long wick candle strategy to identify potential support/resistance zones and trading signals. It detects "power wicks" (long shadows with high volume near key levels like POC, VAH/VAL, or VWAP) as reversal setups, generating buy/sell alerts after confirmation wicks appear near these zones.
Key Features:
Volume Profile: Displays VP histogram over a lookback period, highlighting POC (Point of Control), VAH/VAL (Value Area High/Low) with customizable rows and thresholds.
VWAP & Bands: Plots VWAP with 1-3 std dev bands; filters signals based on trend and proximity to bands.
Long Wick Detection: Identifies strong ("power") and signal wicks based on wick/body ratios, ATR size, and volume multipliers. Supports Market Maker (MM) volume bonuses for liquidity zones.
Trading Signals: Generates BUY/SELL arrows when price retests wick levels with confirmation, limited by max signals per zone and min wait bars. Filtered by MTF (multi-timeframe) alignment (e.g., higher TF EMA trend and candle direction) and VWAP trend.
Sessions: Shows POC/VAH/VAL for Asian, London, and NY sessions with optional active-only display.
MTF Analysis: Scores bullish/bearish alignment across two higher timeframes for signal filtering.
Visuals: Liquidity sweep boxes, resistance/support lines, info table (levels, signals remaining, VWAP status), and MTF status box.
Customizable: Adjust wick ratios, volume thresholds, VP rows, MTF periods, and display options.
Ideal for intraday/scalping on forex/crypto/stocks. Use on lower TFs with MTF filters for confluence. Not financial advice—backtest thoroughly!

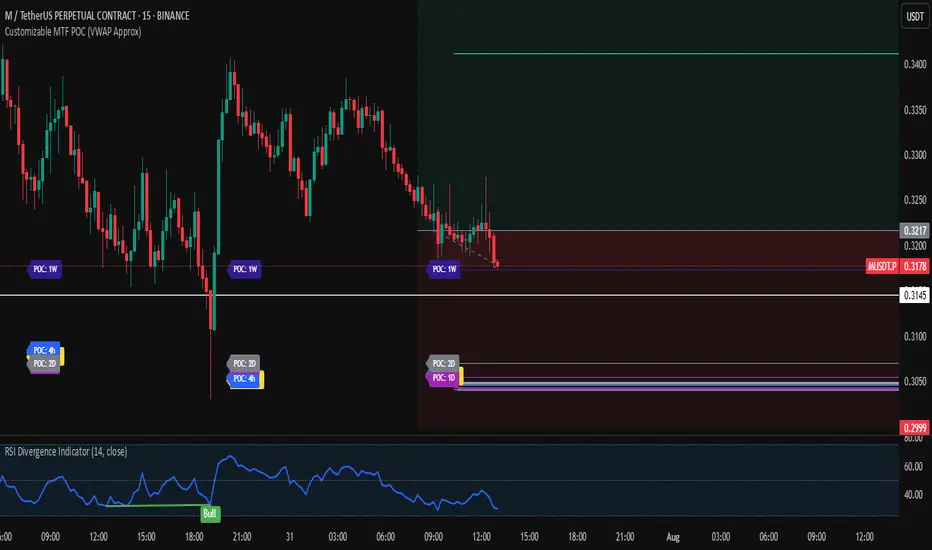
Customizable MTF POC (VWAP Approx)🔍 Multi-Timeframe VWAP POC Zones
This script displays volume-weighted average price (VWAP) levels from multiple timeframes on a single chart. Each VWAP level acts as a potential dynamic support or resistance zone, depending on the price action.
✅ Customizable timeframes included:
1m, 5m, 15m, 1h, 2h, 4h, 1D, 2D, 1W, 1M
📌 Key Features:
– VWAP lines per timeframe with adjustable visibility
– Color-coded for clarity
– Useful for identifying high-confluence support/resistance zones
📈 Usage Tip:
Combine this indicator with price action or liquidity zones for more accurate entries. Confluent VWAP zones across multiple timeframes often signal strong reaction areas.
⚠️ Note: This script uses VWAP as an approximation for Point of Control (POC). It does not rely on true volume profile histograms due to Pine Script limitations. For full volume profile analysis, use TradingView’s built-in “Fixed Range Volume Profile” tool.
day trading check indicatorDay Trading Check Indicator
By Trades per Minute · Creator: Trader Malik
Overview
The Day Trading Check Indicator is an on‐chart status panel that gives you a quick “go/no-go” snapshot of four key metrics—MACD, VWAP, Float, and Bearish Sell-Off—directly in TradingView’s top-right corner. It’s designed for fast decision-making during high-velocity intraday sessions, letting you instantly see whether each metric is “bullish” (green) or “bearish” (red), plus live float data.
What It Shows
Column Description
Metric The name of each metric: MACD, VWAP, Float, Bearish Sell-Off
Status/Value A color-coded status (“GREEN”/“RED” or “YES”/“NO”) or the float value formatted in K/M/B
Metrics & Calculations
MACD (1-Minute)
Calculation: Standard MACD using EMA (12) – EMA (26) with a 9-period signal line, all fetched from the 1-minute timeframe via request.security().
Status:
GREEN if MACD ≥ Signal
RED if MACD < Signal
VWAP (Session-Anchored)
Calculation: Built-in session VWAP (ta.vwap(close)) resets each new trading session.
Status:
GREEN if current price ≥ VWAP
RED if current price < VWAP
Float
Calculation: Retrieves syminfo.shares_outstanding_float (total float), then scales it into thousands (K), millions (M), or billions (B), e.g. “12.3 M.”
Display: Always shown as the absolute float value, white on semi-transparent black.
Bearish Sell-Off
Calculation: Checks the last five 1-minute bars for any “high-volume down” candle (volume above its 20-bar SMA and close < open).
Status:
YES if at least one such bar occurred in the past 5 minutes
NO otherwise
Key Features
Dynamic Table: Automatically shows only the metrics you enable via the Display Options group.
Size Selector: Choose Small, Medium, or Large text for easy visibility.
Clean Styling: Distinct header row with custom background, consistent row shading, centered status text, and a subtle gray border.
Lightweight Overlay: No cluttering plots—just a concise status panel in the corner.
Published by Trader Malik / Trades per Minute
Version: Pine Script v5

EMA 9/21/50 + VWAP + MACD + RSI Pro [v6]Overview:
A powerful multi-indicator tool combining Exponential Moving Averages (EMA 9, 21, 50), Volume-Weighted Average Price (VWAP), Moving Average Convergence Divergence (MACD), and Relative Strength Index (RSI) into a single, easy-to-read system. Designed for traders who want a clean, all-in-one dashboard for trend analysis, momentum confirmation, and overbought/oversold conditions.
Key Features:
1. Triple EMA System (9, 21, 50)
Identifies short-term and medium-term trends.
Bullish Signal: EMA 9 > EMA 21 > EMA 50 (Green Highlight)
Bearish Signal: EMA 9 < EMA 21 < EMA 50 (Red Highlight)
Helps confirm trend direction and potential reversals.
2. VWAP (Volume-Weighted Average Price)
Tracks intraday fair value price based on volume.
Bullish: Price above VWAP (Green)
Bearish: Price below VWAP (Red)
3. MACD (Standard 12, 26, 9 Settings)
Shows momentum shifts.
Bullish: MACD line > Signal line (Green)
Bearish: MACD line < Signal line (Red)
Histogram confirms strength of momentum.
4. RSI (14-Period Default)
Identifies overbought (>70) and oversold (<30) conditions.
Red: Overbought (Potential Reversal)
Green: Oversold (Potential Bounce)
5. Signal Dashboard (Top-Right Table)
Real-time summary of all indicators in one place.
Color-coded for quick interpretation (Green = Bullish, Red = Bearish).
How to Use This Indicator?
✅ Trend Confirmation:
Trade in the direction of EMA alignment (9 > 21 > 50 for uptrends).
Use VWAP as dynamic support/resistance.
✅ Momentum Entries:
Look for MACD crossovers while RSI is not extreme.
Avoid buying when RSI > 70 or selling when RSI < 30 (unless strong trend).
✅ Mean Reversion:
Fade extreme RSI readings (overbought/oversold) when price is at key levels.
Who Is This For?
✔ Swing Traders – EMA + MACD combo for trend-following.
✔ Day Traders – VWAP + EMA for intraday bias.
✔ RSI Traders – Clear overbought/oversold signals.
Settings Customization:
Adjust EMA lengths, RSI periods, and MACD settings as needed.
Toggle VWAP visibility on/off.
Why Use This Script?
📌 All-in-One: No need for multiple indicators cluttering your chart.
📌 Visual Clarity: Color-coded signals for quick decision-making.
📌 Flexible: Works on any timeframe (1M, 5M, 1H, Daily, etc.).
Install now and enhance your trading strategy with a professional-grade multi-indicator system!
Not a financial advice. Use at your own discretion and always apply risk management

NIFTY VWAP DistanceNIFTY Futures VWAP Distance Indicator
Track price deviation from Volume-Weighted Average Price in real-time
📈 Key Features:
Measures absolute (points) and percentage distance from VWAP
Daily session reset aligned with NSE trading hours
Dual-axis visualization with clear zero reference line
Real-time data table display for instant analysis
Typical price calculation: (H+L+C)/3 formula
Built-in safeguards against division errors
🎯 Ideal For:
Intraday traders monitoring mean reversion opportunities
Algorithmic traders needing VWAP deviation metrics
Swing traders identifying overextended price moves
Market profile analysts studying auction theory
📊 How to Use:
Apply to NIFTY Futures chart (1m-1h timeframes recommended)
Blue line = Points above/below VWAP
Red line = Percentage deviation
Positive values = Price > VWAP (bullish territory)
Negative values = Price < VWAP (bearish territory)
💡 Pro Tips:
Combine with volume profile for confirmation
Watch for >1% deviations for potential reversals
Use divergence patterns for early trend change signals
Works best with raw futures data (not continuous contracts)
🔧 Technical Specs:
Pine Script v5+
No repainting
Low latency calculations
Mobile-friendly display
"Know when price strays too far from fair value"

Matrix Series and Vix Fix with VWAP CCI and QQE SignalsMatrix Series and Vix Fix with VWAP CCI and QQE Signals
Short Title: Advanced Matrix
Purpose
This Pine Script combines multiple technical analysis tools to create a comprehensive trading indicator. It incorporates elements like support/resistance zones, overbought/oversold conditions, Williams Vix Fix, QQE (Quantitative Qualitative Estimation) signals, VWAP CCI signals, and a 200-period SMA for trend filtering. The goal is to provide actionable buy and sell signals with enhanced visualization.
Key Features and Components
1. Matrix Series
Smoothing Input: Allows customization of EMA smoothing for the indicator (default: 5).
Support/Resistance Zones: Based on CCI (Commodity Channel Index) values.
Dynamic zones calculated with customizable parameters (SupResPeriod, SupResPercentage, PricePeriod).
Candlestick Visualization: Custom candlestick plots with colors indicating trends.
Dynamic levels for overbought/oversold conditions.
2. Overbought/Oversold Signals
Overbought and oversold levels are adjustable (ob and os).
Plots circles on the chart to highlight extreme conditions.
3. Williams Vix Fix
Identifies potential reversal points by analyzing volatility.
Uses Bollinger Bands and percentile thresholds to detect high-probability entries.
Includes two alert levels (alert1 and alert2) with customizable criteria for signal filtering.
4. QQE Signals
Based on the smoothed RSI and QQE methodology.
Detects trend changes using adaptive ATR bands (FastAtrRsiTL).
Plots long and short signals when specific conditions are met.
5. VWAP CCI Signals
Combines VWAP and CCI for additional trade signals.
Detects crossovers and crossunders of CCI levels (-200 and 200) to generate long and short signals.
6. 200 SMA
A 200-period simple moving average is plotted to act as a trend filter.
The script rules recommend buying only when the price is above the SMA200.
Customizable Inputs
General:
Smoothing, support/resistance periods, overbought/oversold levels.
Williams Vix Fix:
Lookback periods, Bollinger Band settings, percentile thresholds.
QQE:
RSI length, smoothing factor, QQE factor, and threshold values.
VWAP CCI:
Length for calculating deviations.
Visual Elements
Dynamic candlestick colors to indicate trend direction.
Overbought/oversold circles for extreme price levels.
Resistance and support lines.
Labels and shapes for buy/sell signals from Vix Fix, QQE, and VWAP CCI.
Alerts
Alerts are configured for the Matrix Series (e.g., "BUY MATRIX") and other components, ensuring traders are notified when significant conditions are met.
Intended Use
This indicator is designed for traders seeking a multi-faceted tool to analyze market trends, identify potential reversal points, and generate actionable trading signals. It combines traditional indicators with advanced techniques for comprehensive market analysis.

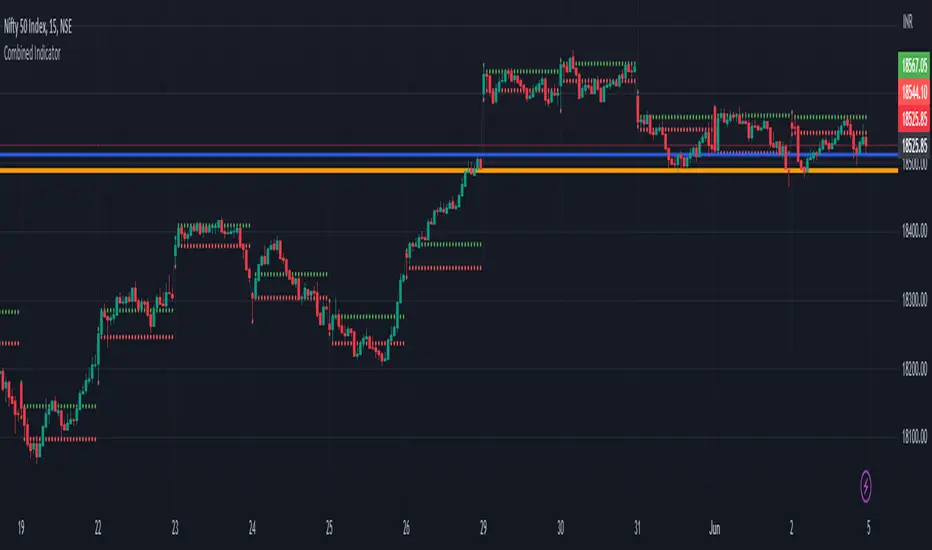
Previous Day Close and Average VWAP value, Current Day 30 min HLThe code provided is a TradingView Pine Script that creates a combined indicator consisting of two separate components:
Indicator 1: Plot Lines with VWAP
This component plots lines on the chart using two different colors and widths.
It uses a custom function f_newLine to create a new line object with a specified color and width.
It uses another custom function f_moveLine to move a line to a specific location on the chart.
The line_close line is moved to a specific date and closing price.
The line_vwap line represents the VWAP (Volume Weighted Average Price) and is plotted using the line.new function.
The VWAP calculation is performed using the typical price (average of high, low, and close) and volume.
The VWAP is plotted on the chart using the plot function.
The previous day's VWAP is also plotted and connected to the current day's VWAP with a line.
Indicator 2: 30 Min high and low breakout
This component identifies a specific time range ("0915-0945") within each trading day.
It uses the ta.valuewhen function to find the highest and lowest prices during that time range.
The highest price is stored in the high_thirtymin variable, and the lowest price is stored in the low_thirtymin variable.
These prices are plotted on the chart as circles, with green representing the high and red representing the low.
The indicator combines these two components to provide visual information about the VWAP and the high/low breakout within a specific time range. The code also includes some additional logic to handle barstate and ensure correct calculations and plotting.
Wick Hunter VWAP & RSIWick Hunter VWAP & RSI Script to be used to produce quality reversal entries based on VWAP with added RSI Filtering.
Wick Connect 2.0 was designed specifically to work with Wick Hunter, the lightning fast cryptocurrency trading robot that can trade for you 24/7.
Simply input your UUID and start trading automatically with Wick Hunter!
The indicator first starts with VWAP entries, with user selectable user selectable inputs to plot percentages above and below current VWAP line.
Percentage Above VWAP = Short Entry
Percentage Below VWAP = Long Entry.
Alerts will fire as soon as price crosses the VWAP Line if using "Once per bar", and may disappear after.
Alerts shown on the chart are confirmed via candle close, and as such, "Once per bar close" should be used if the user wants to only trade confirmed signals.
RSI Filtering has been added with separate RSI Values for both long and shorts which can used to filter entries.
RSI Long Min: Minimum RSI value to fire alerts.
RSI Long Max: Maximum RSI value to fire alerts.
RSI Short Min: Minimum RSI value to fire alerts.
RSI Short Max: Maximum RSI value to fire alerts.
Happy Trading.

SPY VWAPSPY VWAP adds the VWAP indicator for SPY on your current chart, and shows the current SPY VWAP level converted to ES / MES value. It uses the last close price of SPY and ES / MES to calculate the level.
By adding the regular VWAP indicator to your MES / ES chart, you will clearly see the difference between the VWAP of SPY and the futures chart. This is helpful when trading as price may respect both VWAP levels.
This indicator should only be used on ES and MES futures chart. It will behave weirdly if used on different tickers and it is not supported in the current version.

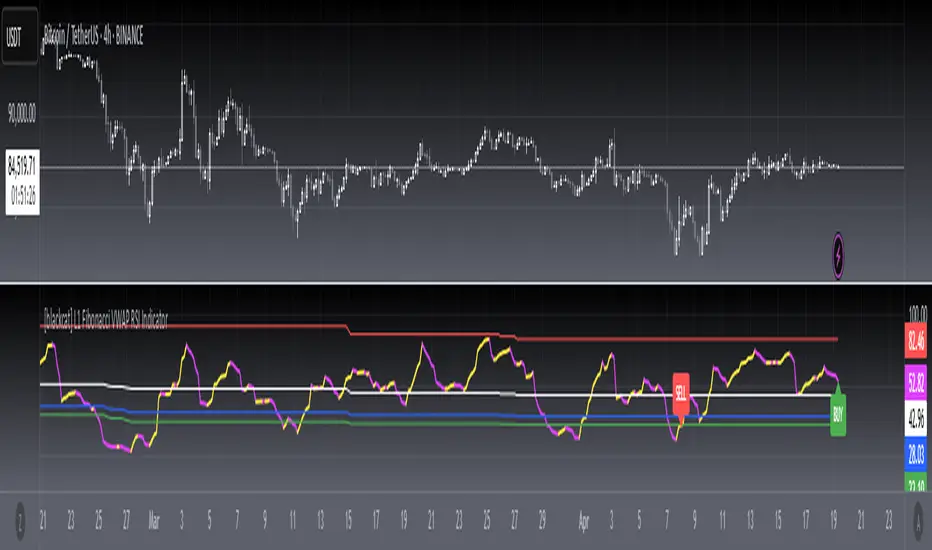
[blackcat] L1 Fibonacci VWAP RSI IndicatorLevel: 1
Background
Ingo Bucher proposed "Fibonacci RSI" in March,2003. It describes the advantages of considering Fibonacci retracement levels for use with the classic RSI indicator. Bucher reviews six charts, each displaying Fibonacci retracement levels for the RSI associated with each chart. The pine code given here will allow you to automatically recreate these charts for any security available in Tradingview. BTW, i enhanced it by changing RSI into VWAP RSI with hl2.
Function
For this Fib VWAP RSI indicator, it also applicable for original Bucher's fib concept. Bucher calculated his retracement levels by picking the RSI high and low for a given time window. In his examples, these were generally six months to a year's worth of data. Once the high and low were picked, he calculated retracement levels based on the well-known Fibonacci numbers (23.6%, 38.2%, 50%, 61.8%). This script here does the same thing. I use a "LookbackLength" (default: 400 bars), which represents a sliding data window that is used to determine the VWAP RSI high and low. The second input value controls the VWAP RSI period (default: 14 bars). The next three inputs select the retracement levels.
A total of eight different lines need to be drawn: the RSI itself, the 50% line, two retracements above the 50% point, two retracements below, and the zero and 100% lines. Pine script will create four plotlines per indicator, so I advise inserting the Fibonacci RSI twice. The first time it is inserted, leave the PlotRSI input with its default value, true. True tells pine script to plot the VWAP RSI itself. The second copy should have the input "Plot RSI" set to false. This will put the 50% line on your chart.
Inputs
LookbackLength --> Look Back Length.
RSILength --> RSI Length.
Fib1 and Fib2 --> Fibonacci lengths.
Key Signal
RawVWAPRSI --> Raw VWAP RSI output signal
Remarks
This is a Level 1 free and open source indicator.
Feedbacks are appreciated.
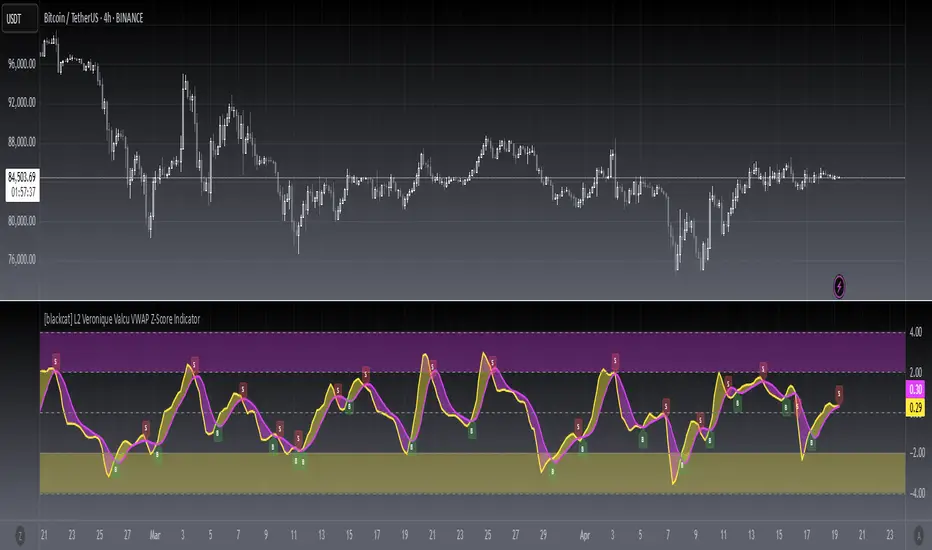
[blackcat] L2 Veronique Valcu VWAP Z-Score IndicatorLevel: 2
Background
Veronique Valcu's article "Z-Score Indicator" in Feb,2003 provided a description and commentary on a new method of displaying directional change normalized in terms of standard deviation. This indicator is realized in pine script here by using the following function code, adding vwap function, called vwap ZScore.
Function
This indicator has three input, "AvgLen", "Smooth1" and "Smooth2." Price is fixed in selected vwap price. AvgLen describes the length of the sample considered in the standard deviation calculation. Once created and verified, the function can be easily called in any indicator or strategy.
Inputs
AvgLen --> Length input for vwap Zscore.
Smooth1 and Smooth2 --> Smoothing length.
Key Signal
Curve1 --> vwap ZScore output fast signal
Curve2 --> vwap ZScore output slow signal
Remarks
This is a Level 2 free and open source indicator.
Feedbacks are appreciated.
[blackcat] L3 VWAP BMP IndicatorLevel: 3
Background
This indicator is my attempt to combine VWAP and BMP indicators.
Function
The goal is to provide a more timely entry point. I mixed up Igor Livshin's balance of market power (BMP) indicator together with vwap, can be considerably simplified for efficient implementation. If you do the math, you'll find that the raw BMP is actually equivalent to (Close-Open) / (High-Low) which can provide instant market judgement. I also filter try to filter out noise by averaging and fast-slow line to capture the shrot term and mid term status. So, it contains two input parameters to be adjusted to find proper values to adapt to different time frame and trading pairs.
Divergence and alerts are availble as well.
Inputs
FastLength --> VWAP BMP fast line length
SlowLength --> VWAP BMP slow line length
Key Signal
BMPF --> VWAP BMP fast line in yellow color
BMPS --> VWAP BMP slow line in fuchsia color
Remarks
This is a Level 3 free but closed source indicator.
Feedbacks are appreciated.

TurboVWAPoscilOscillator based on VWAP and its standard deviations. It will display VWAP as a zero line and then an indicator line showing where price is in relation to VWAP expressed as Standard Deviation units.
This indicator is based on my awesome indicator TurboVWAP, so it shares most of its features:
- you can select whether you want a rolling or an anchored VWAP as basis.
- the VWAP will auto-set itself depending on the chart timeframe, so that it will be calculated based on the period you really want, not number of bars or similar.
- you can set the indicator to auto-set session start and end times for the session-anchored VWAP depending on the futures contract selected, so you don't need to mess with times.

Rolling VWAP Structure [MTF]Core Logic: Rolling VWAP & MTF**
* **Rolling VWAP (Volume-Weighted Average Price):** Unlike a simple Moving Average, this centerline weighs price by volume. It represents the true "Institutional Cost Basis" over the rolling period (default 20).
* **MTF (Multi-Timeframe) Capability:** The indicator is locked to the **Daily (1D)** timeframe by default. This acts as a stable "Lighthouse," ensuring that intraday noise does not distort the major structural levels.
* *Stepped Lines:* On lower timeframes, the lines appear stepped. This is intentional. It shows that the structural value remains constant throughout the day until the daily close shifts the calculation.
**3. Market Profile Logic: Balance vs. Imbalance**
This indicator visually decodes the market cycle using Auction Market Theory:
* **Orange Zone (Squeeze) = Balance:** When the bands contract (and turn Orange), the market is in equilibrium. This is a high-volume node where price is accepted. **Note:** Historical Orange Zones often act as strong Support/Resistance upon retest.
* **Grey Cloud (Expansion) = Imbalance:** When price breaks into the Grey "Highway" (1.0 - 2.0 StdDev), the market enters Price Discovery mode (Trending).
**4. Key Features & Settings**
* **Fixed Timeframe:** Select the timeframe you want to monitor (e.g., "1D" for Daily structure, "1W" for Weekly).
* **Clean Visuals:** The bottom signal dots have been removed for a cleaner chart.
* **Squeeze Toggle:** You can now **hide the Orange Squeeze color** in the settings if you prefer a unified Grey look for strictly structural analysis.
---
### **中文说明**
核心逻辑:Rolling VWAP 与 跨周期 (MTF)**
* **Rolling VWAP (滚动成交量加权均价):** 与简单移动平均线不同,中轨根据成交量对价格进行加权。它代表了滚动周期内(默认20)真实的“机构持仓成本”。
* **MTF (跨周期) 能力:** 指标默认锁定在 **日线 (1D)** 周期。这就像一座稳定的“灯塔”,确保日内的短期噪音不会扭曲主要的结构性点位。
* *阶梯状线条:* 在小周期图表上,轨道呈现阶梯状。这是有意设计的,代表当天的结构价值是固定的,不会随秒级波动而改变。
**3. 市场轮廓逻辑:平衡与失衡**
本指标利用拍卖市场理论可视化解码市场周期:
* **橙色区域 (挤压) = 平衡 (Balance):** 当布林带收缩(并变橙色)时,市场处于均衡状态。这是筹码密集的高成交量区。**注意:** 历史上的橙色区域在未来回踩时往往起到强力的 支撑/阻力 作用。
* **灰色云带 (扩张) = 失衡 (Imbalance):** 当价格突破进入灰色“高速公路”(1.0 - 2.0 标准差)时,市场进入价格发现模式(趋势)。
**4. 主要功能与设置**
* **Fixed Timeframe (锁定时间框架):** 选择你想要监控的周期(例如 "1D" 看日线结构,"1W" 看周线结构)。
* **视觉净化:** 移除了底部的信号圆点,让主图背景更加纯粹干净。
* **Squeeze Toggle (挤压色开关):** 你现在可以在设置中**隐藏橙色挤压显示**。如果你更偏向纯粹的结构分析,可以选择让通道始终保持灰色。

WOLFGATEWOLFGATE is a clean, session-aware market structure and regime framework designed to help traders contextualize price action using widely accepted institutional references. The indicator focuses on structure, momentum alignment, and mean interaction, without generating trade signals or predictions.
This script is built for clarity and decision support. It provides a consistent way to evaluate market conditions across different environments while remaining flexible to individual trading styles.
What This Indicator Displays
Momentum & Structure Averages
9 EMA — Short-term momentum driver
21 EMA — Structural control and trend confirmation
200 SMA — Primary regime boundary
400 SMA (optional) — Deep regime / macro bias reference
These averages are intended to help assess directional alignment, trend strength, and structural consistency.
Session VWAP (Institutional Mean)
Session-based VWAP with a clean daily reset
Default session: 09:30–16:00 ET
Uses HLC3 as the VWAP source for balanced price input
Rendered in a high-contrast institutional blue for visibility
VWAP can be used to evaluate mean interaction, acceptance, or rejection during the active session.
How to Use WOLFGATE
This framework is designed for context, not signals.
Traders may use WOLFGATE to:
Identify bullish or bearish market regimes
Evaluate momentum alignment across multiple time horizons
Observe price behavior relative to VWAP
Maintain directional bias during trending conditions
Avoid low-quality conditions when structure is misaligned
The indicator does not generate buy or sell signals and does not include alerts or automated execution logic.
Important Notes
Volume must be added separately using TradingView’s built-in Volume indicator
(Volume cannot be embedded directly into this script due to platform limitations.)
This script is intended for educational and analytical purposes only
No financial advice is provided
Users are responsible for their own risk management and trade decisions
